
The Role of Posterior Neural Plate-Derived Presomitic Mesoderm (PSM) in Trunk and Tail Muscle Formation and Axis Elongation
 , and
, and
Abstract
:1. Introduction
2. Materials and Methods
2.1. Animals
2.2. DiI-Labelling of Tissues
2.3. Homotopic Grafting of GFP+ Tissues
2.4. Histological Stainings and Optical Tissue Clearing
2.5. Image Processing and Analysis
3. Results
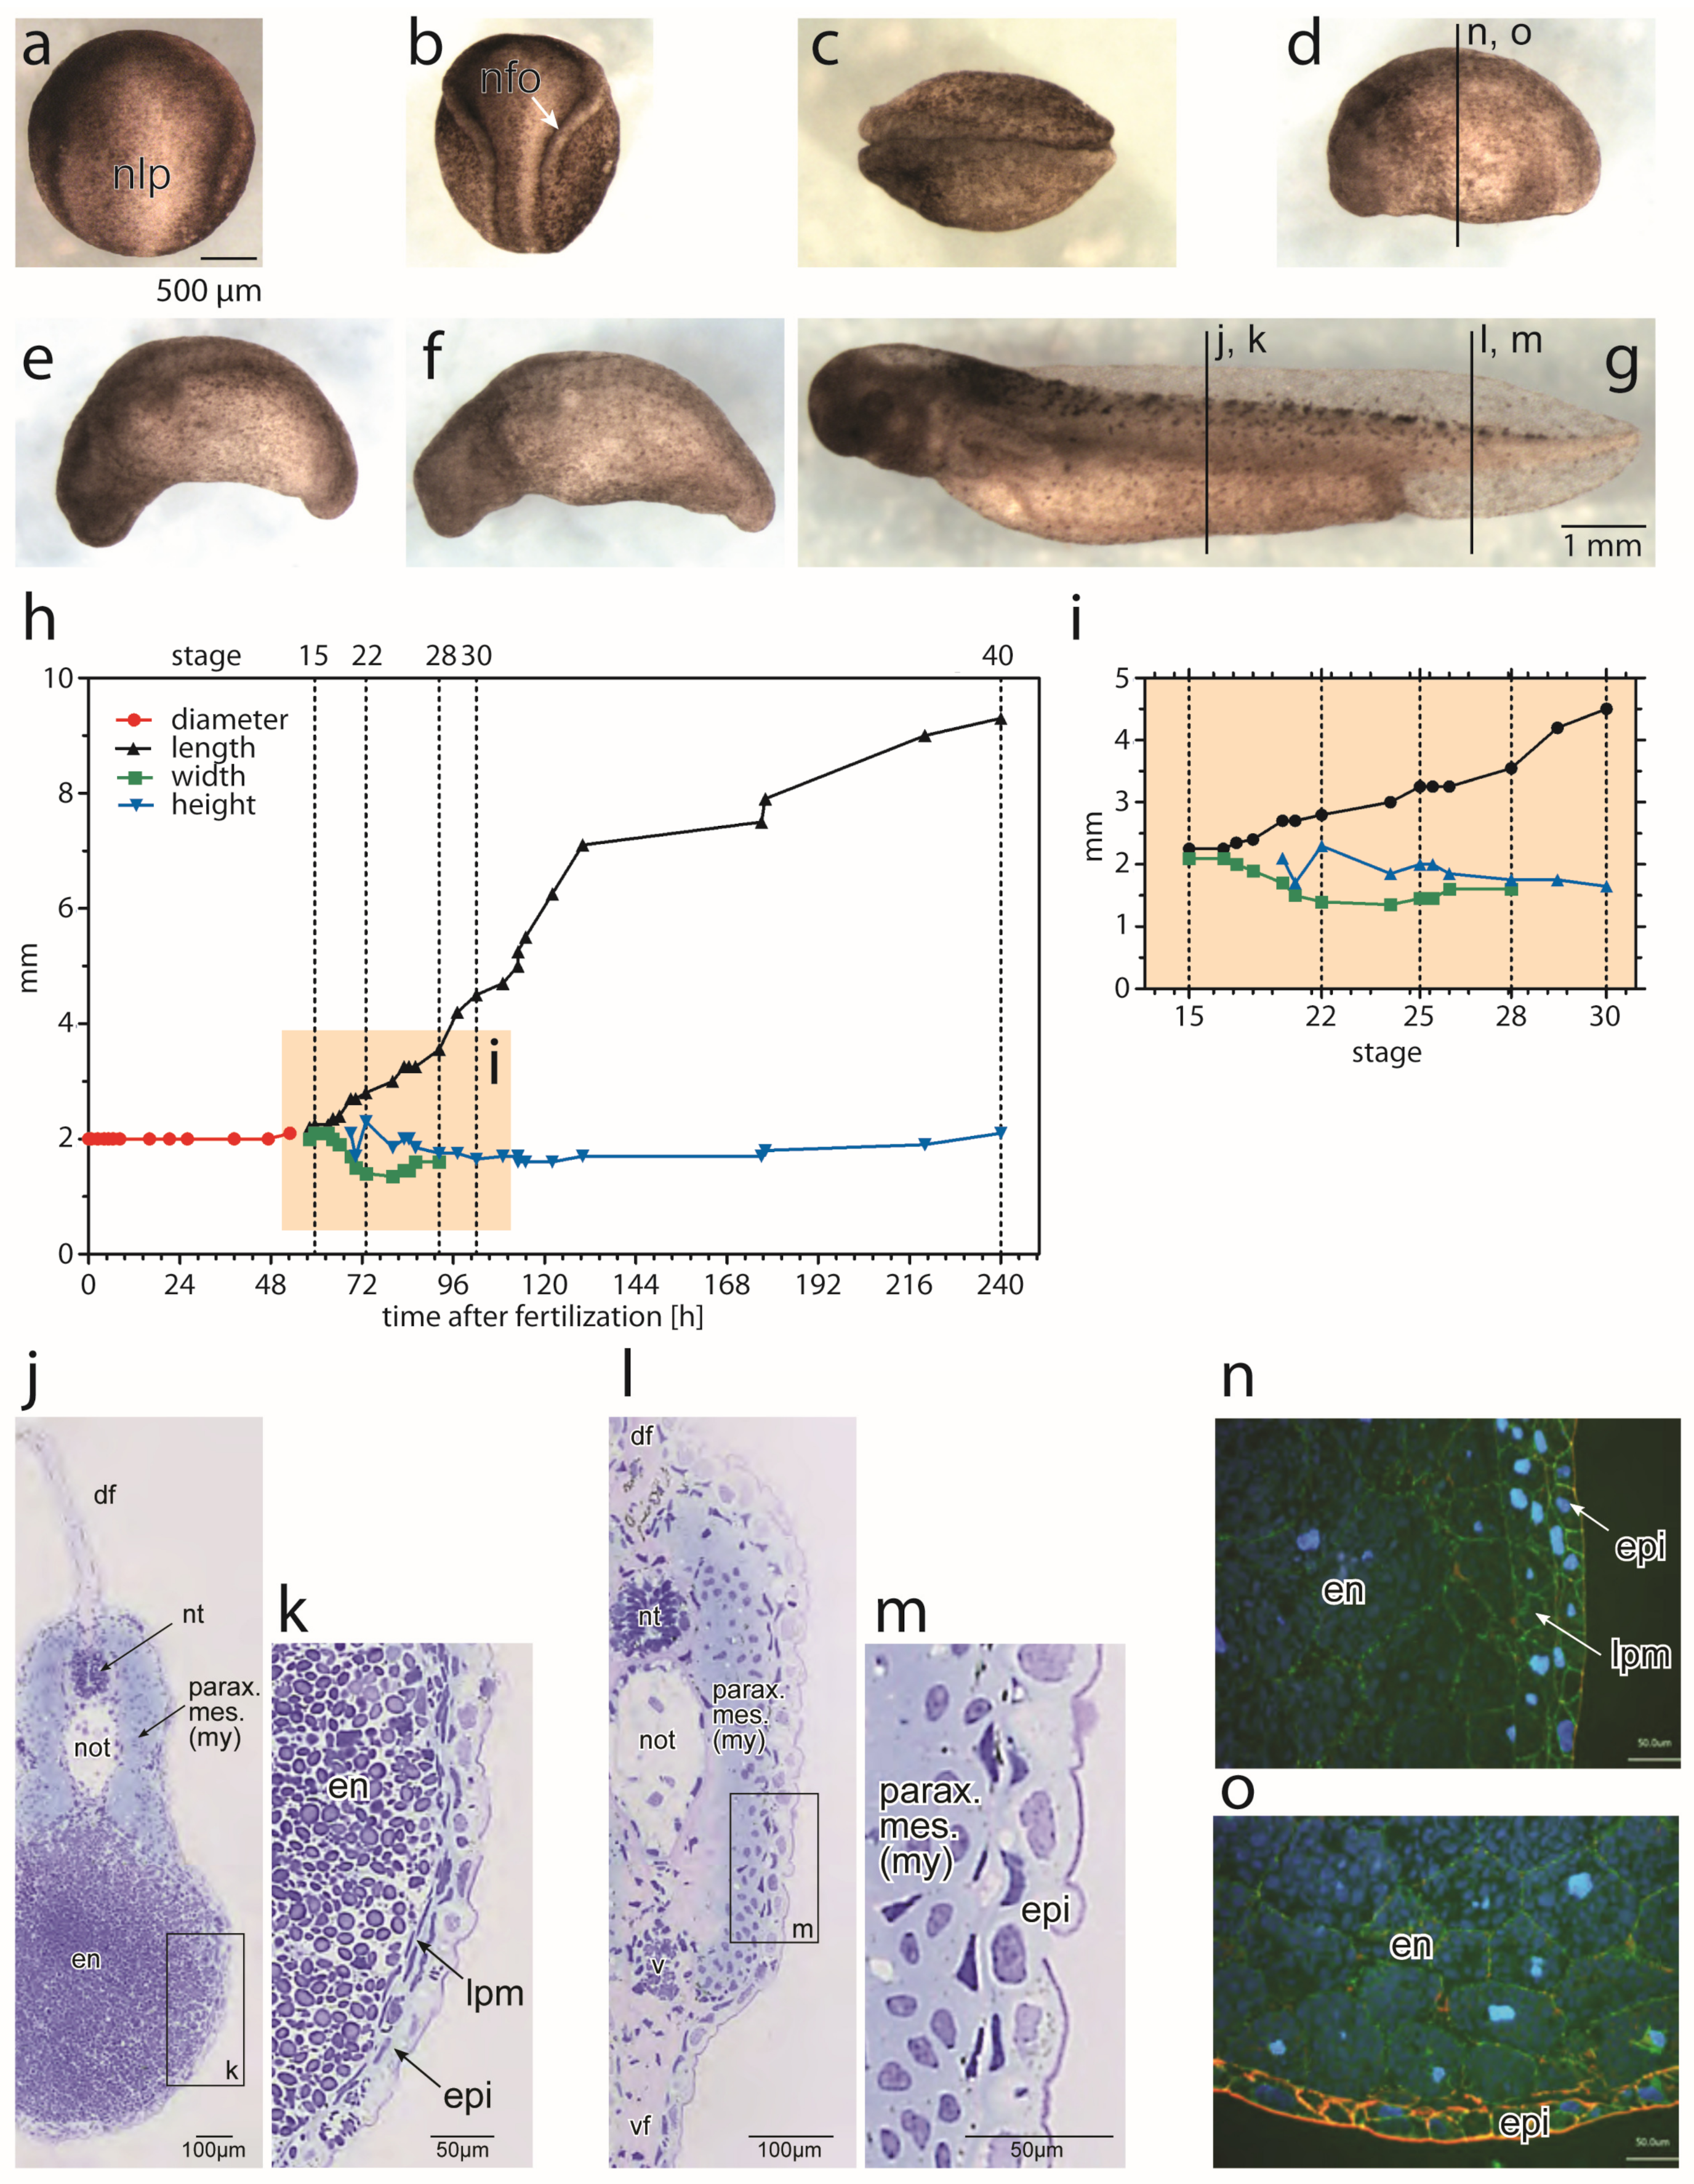
3.1. Morpohological Changes during Axial Elongation of a Developing Axolotl Embryo
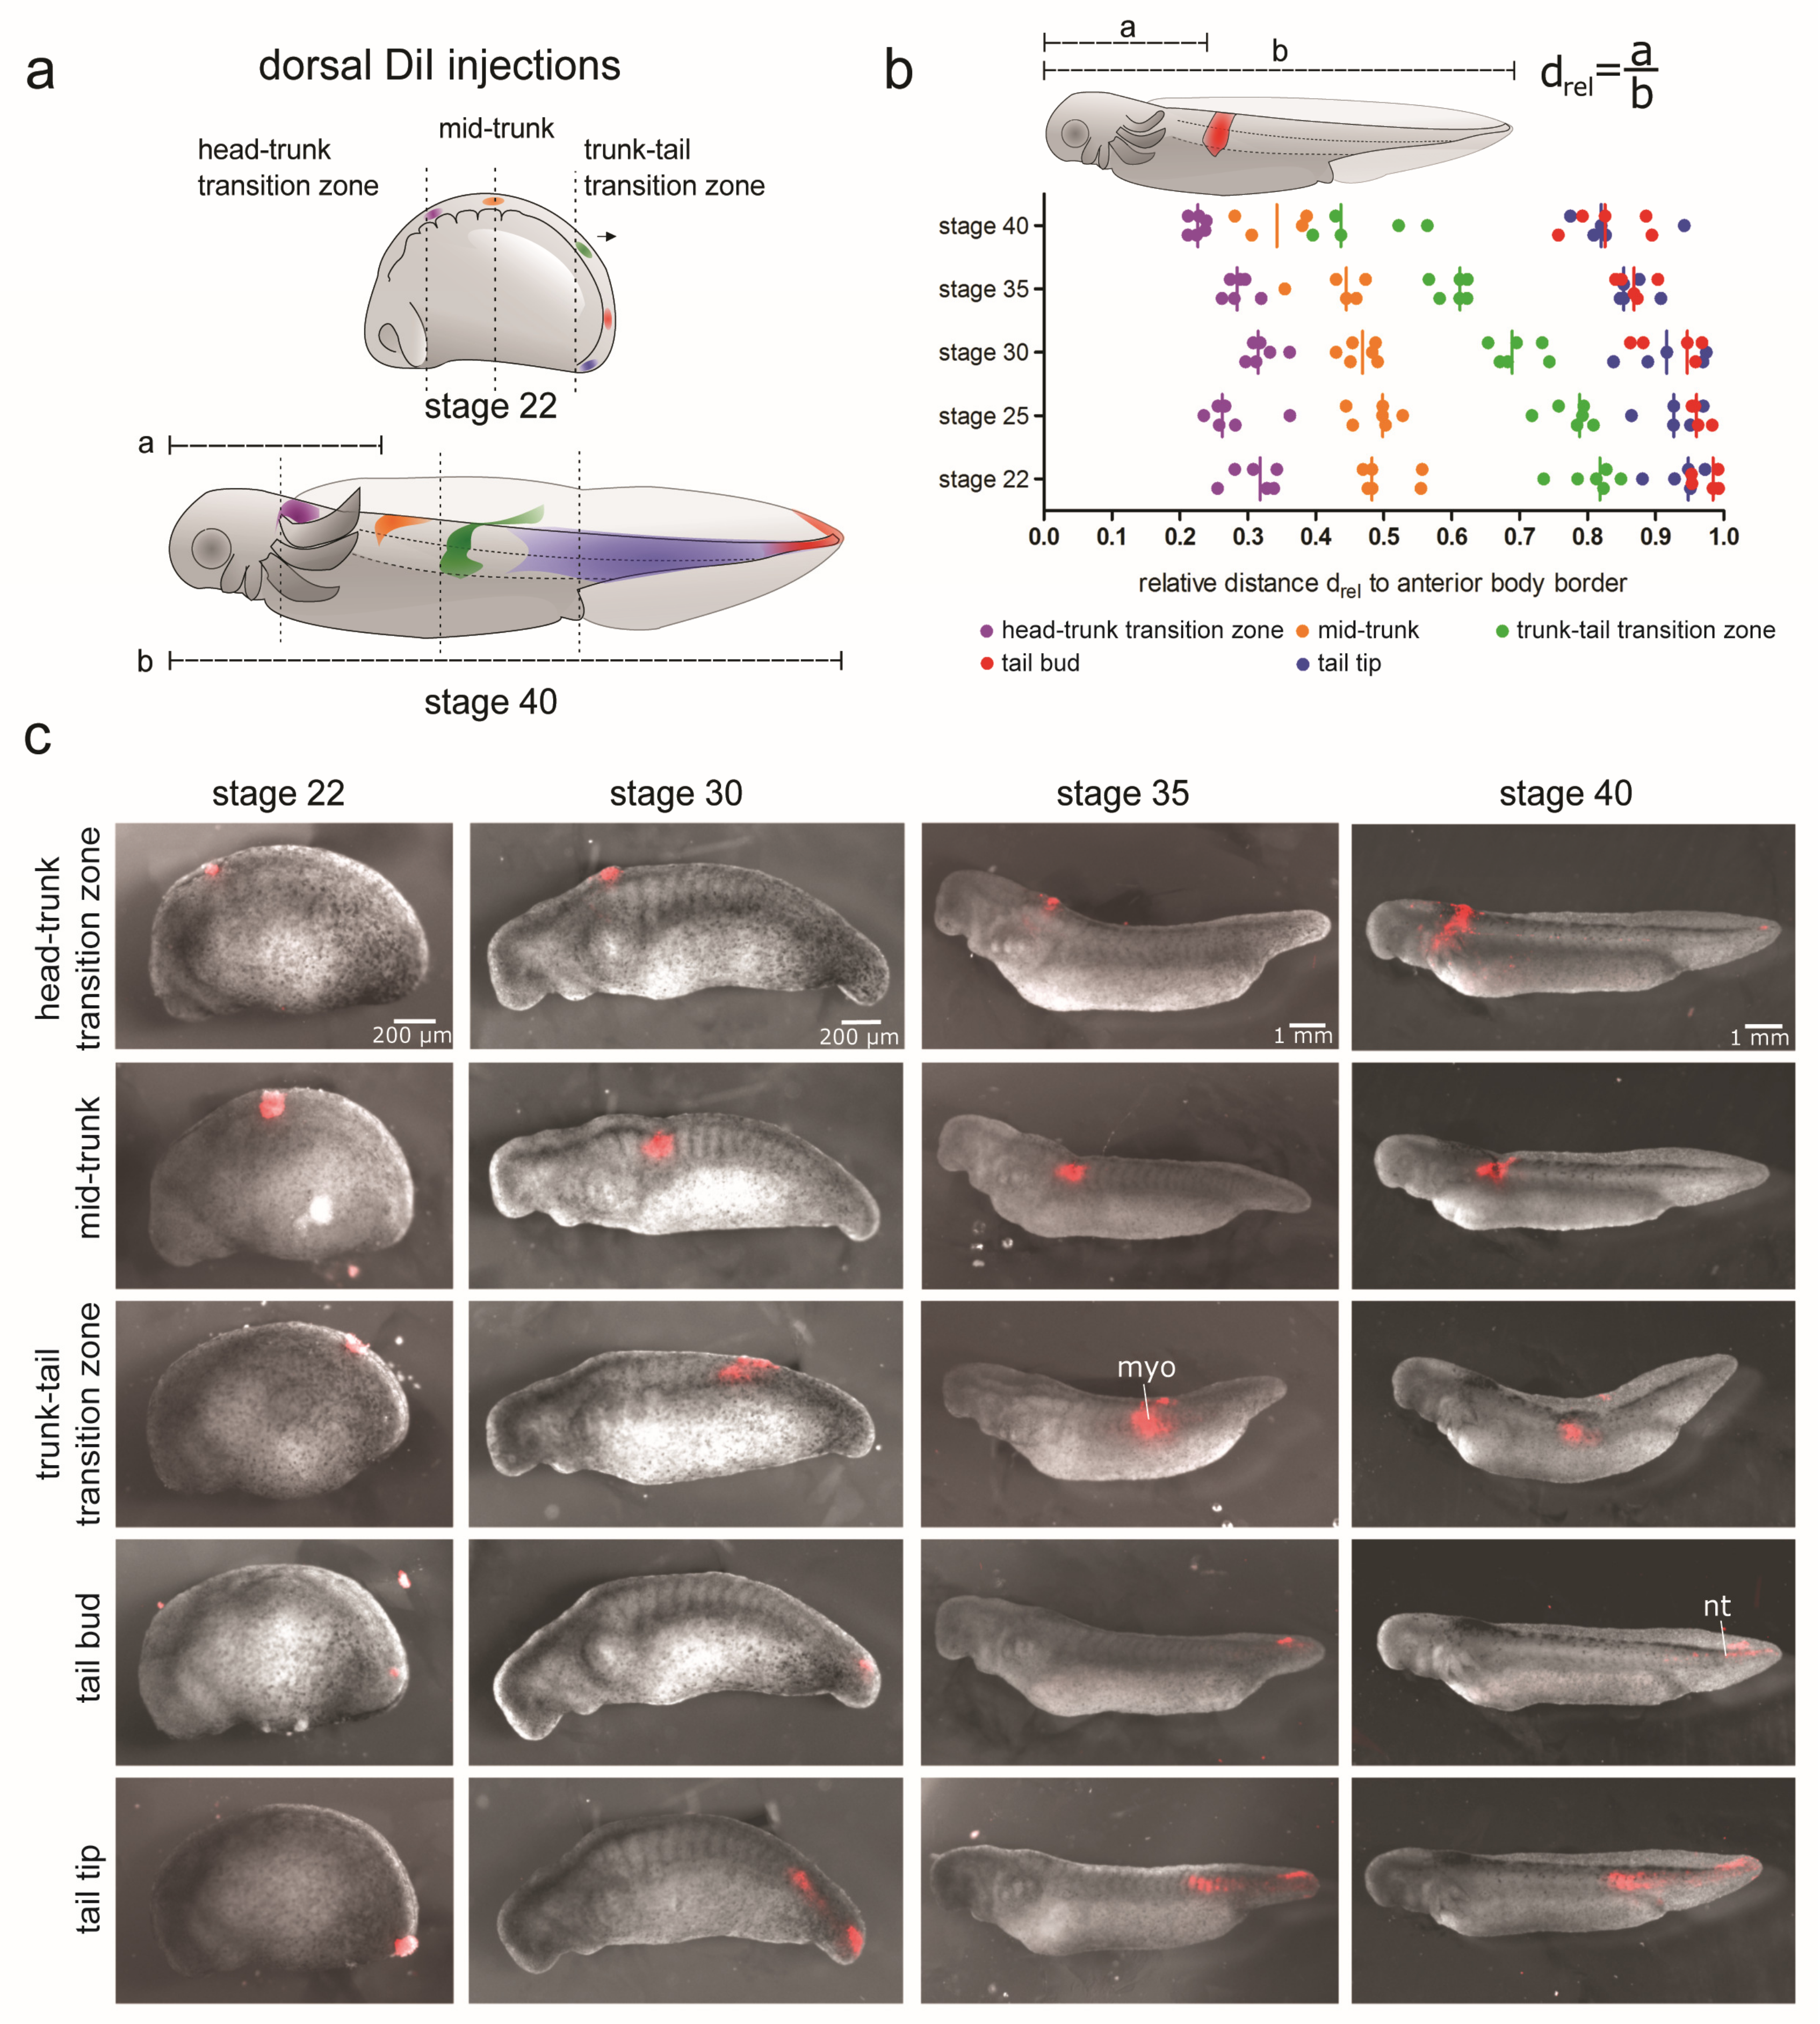
3.2. Differential Contribution of Embryonic Tissues to Axial Elongation
3.2.1. Displacement and Tissue Contribution of Labelled Dorsolateral Paraxial Mesoderm
3.2.2. Displacement and Tissue Contribution of Labelled LPM and Endoderm of the Lateral Trunk and Tail Bud
3.2.3. Displacement and Tissue Contribution of Labelled Endoderm of the Ventral Trunk
3.2.4. Displacement and Tissue Contribution of the GFP+ Epidermis and Paraxial Mesoderm of the Dorsal Trunk and Tail
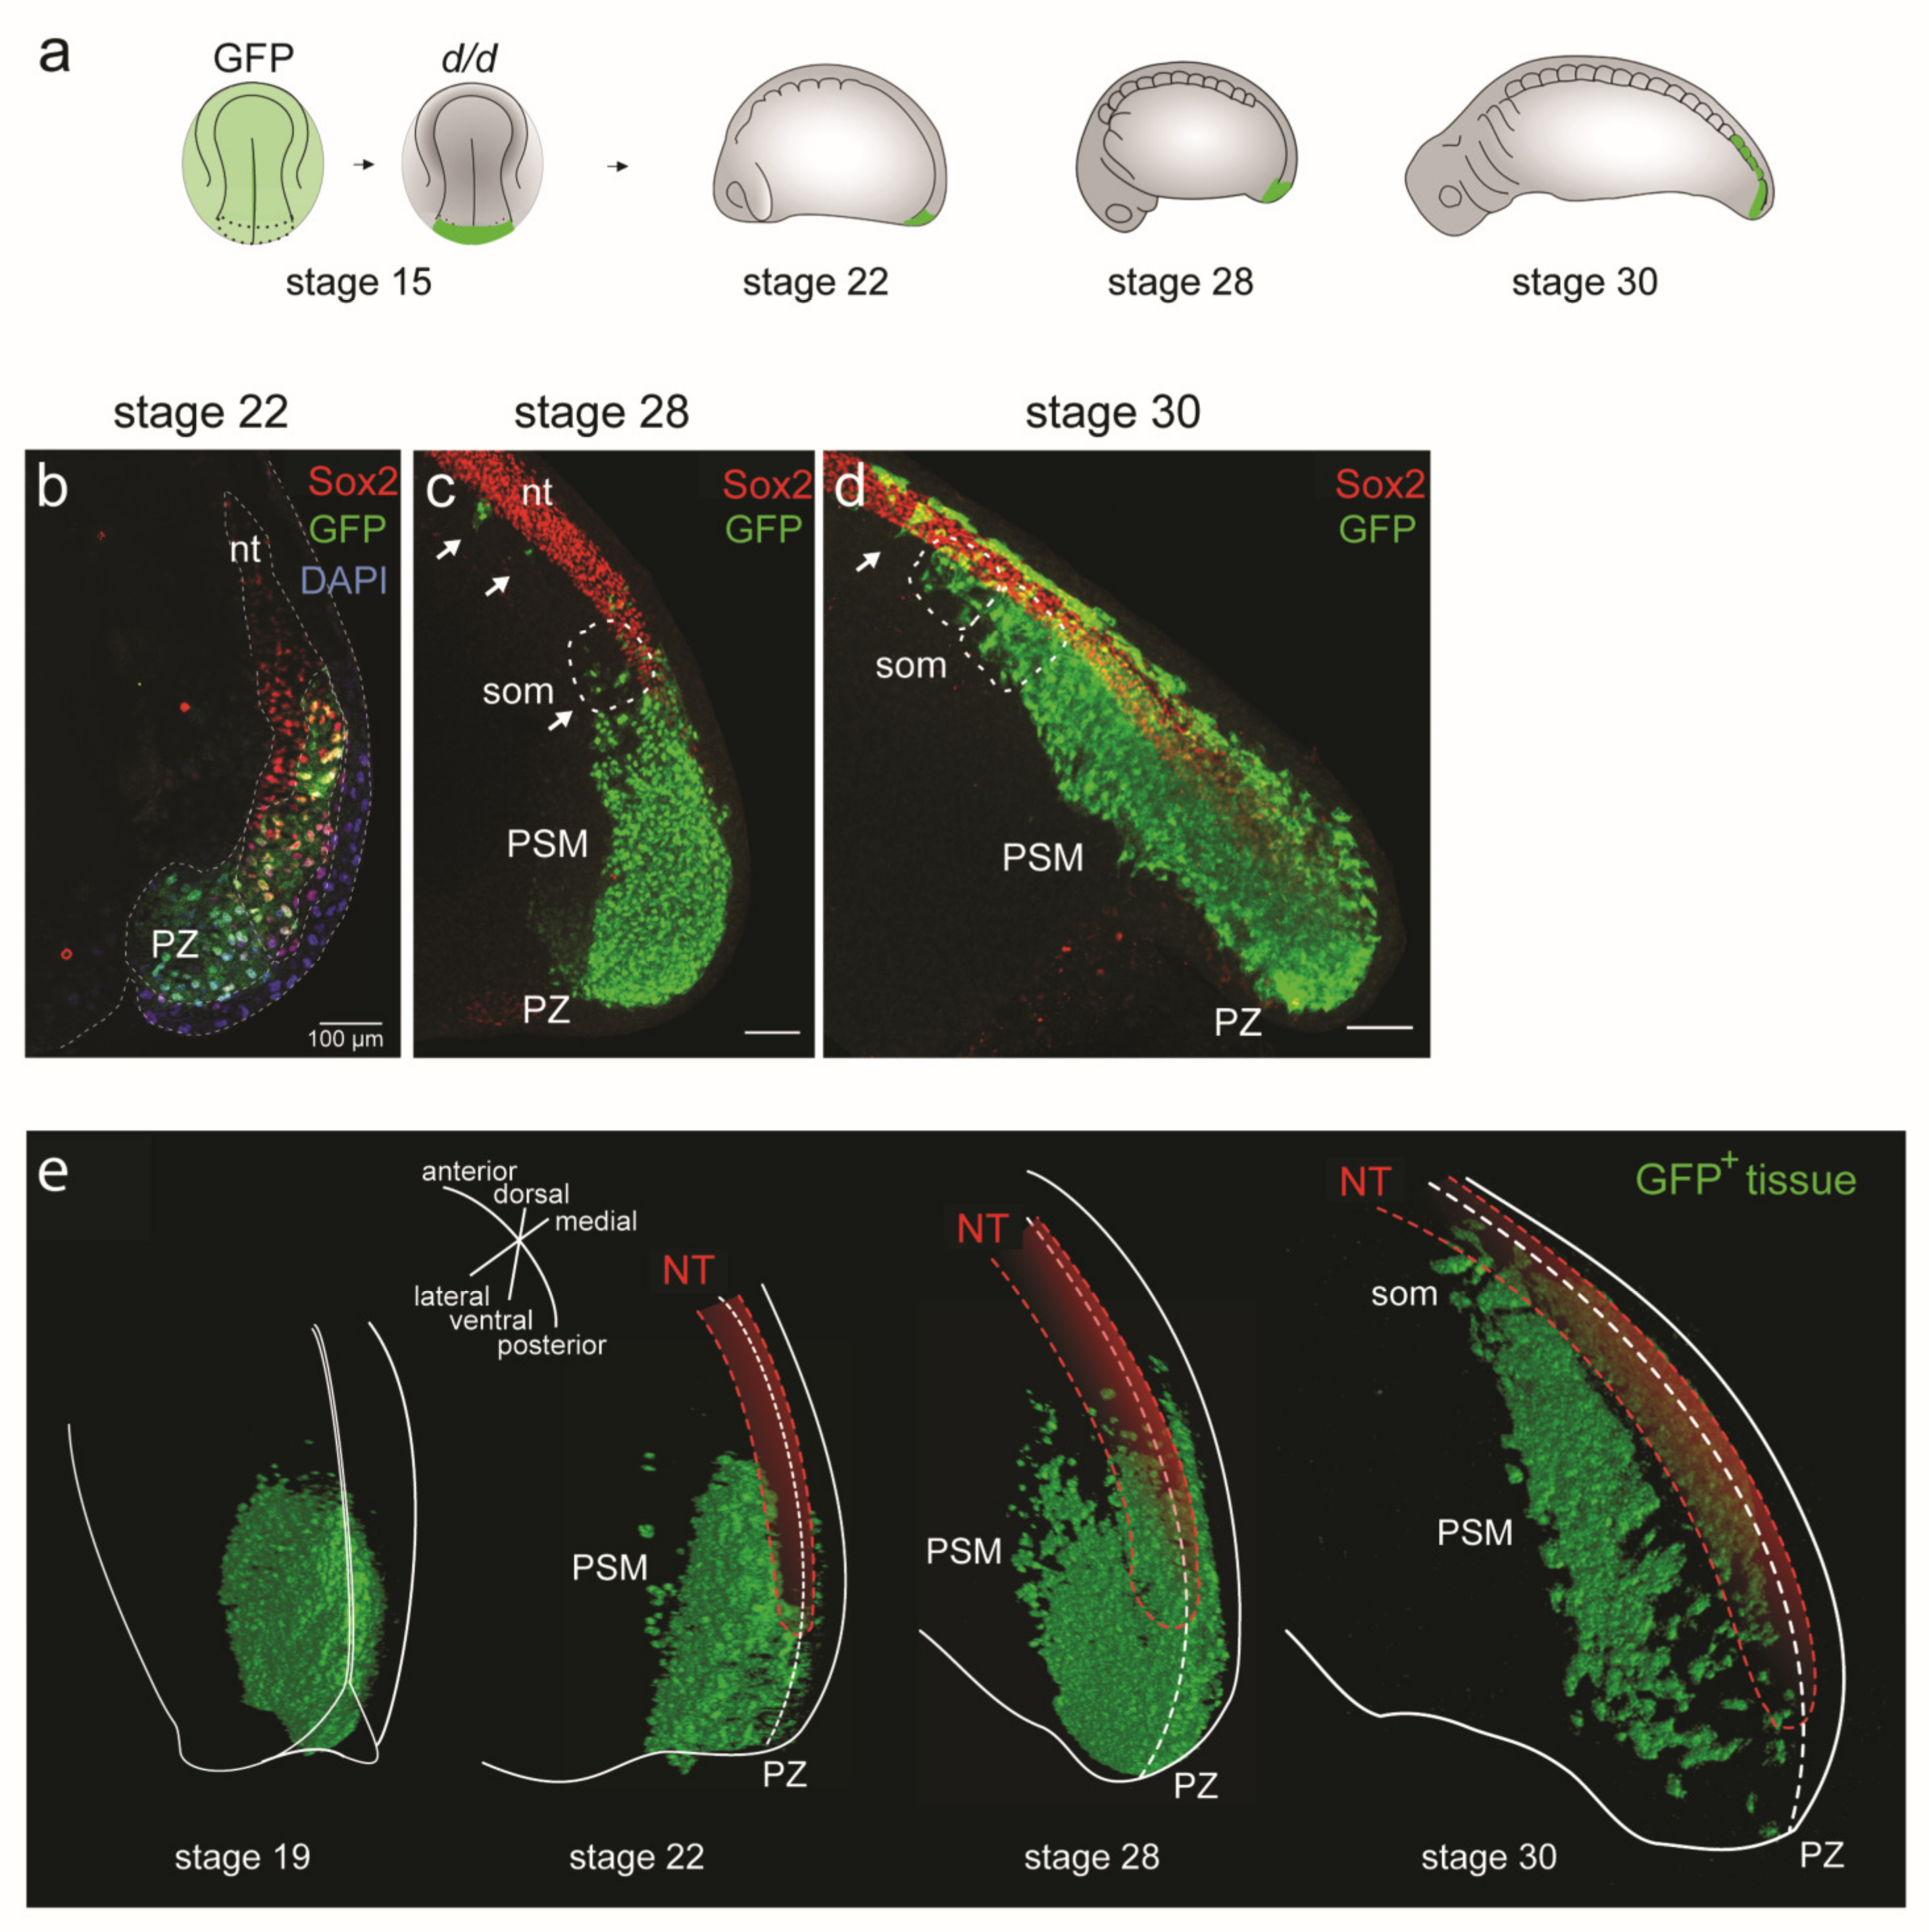
3.3. Dual Cell Fate of the Posterior NP Progenitors (Grafting of the Entire GFP+ Posterior Neural Plate)
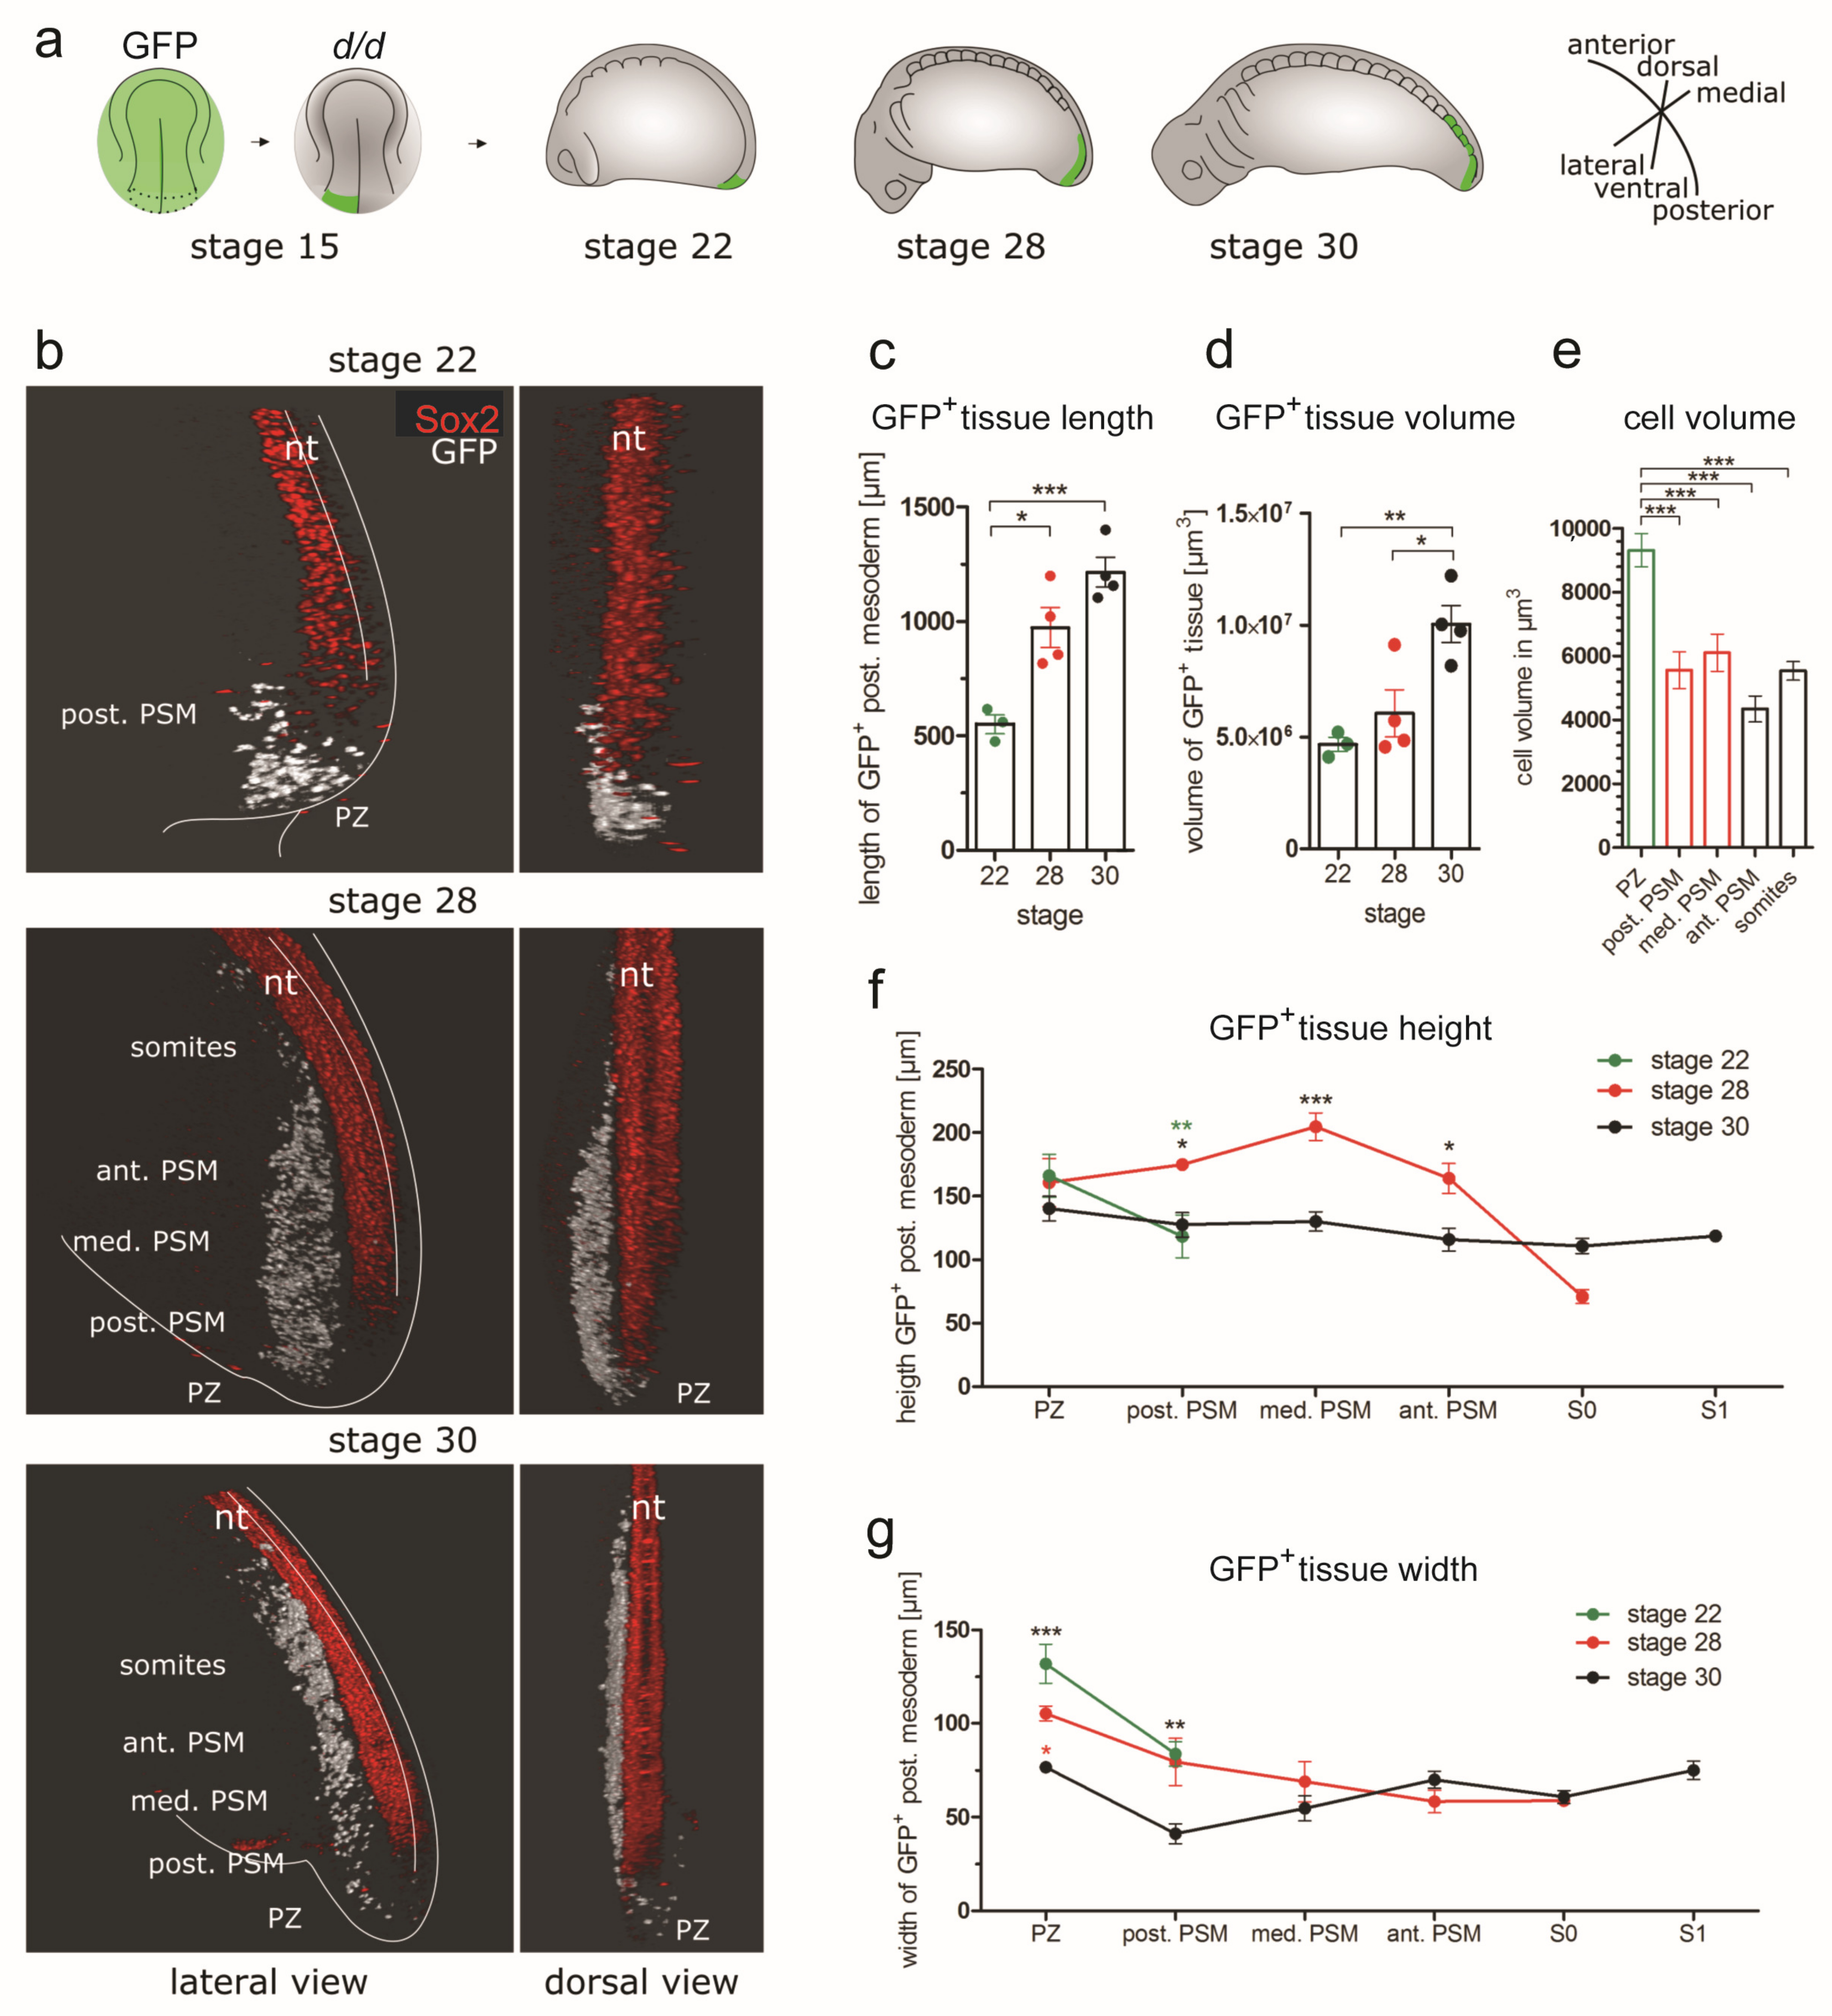
3.4. D Reconstructions of the PSM
3.4.1. Three-dimensional Reconstructions of PSM Grafts of the Left Half of the GFP+ Posterior NP
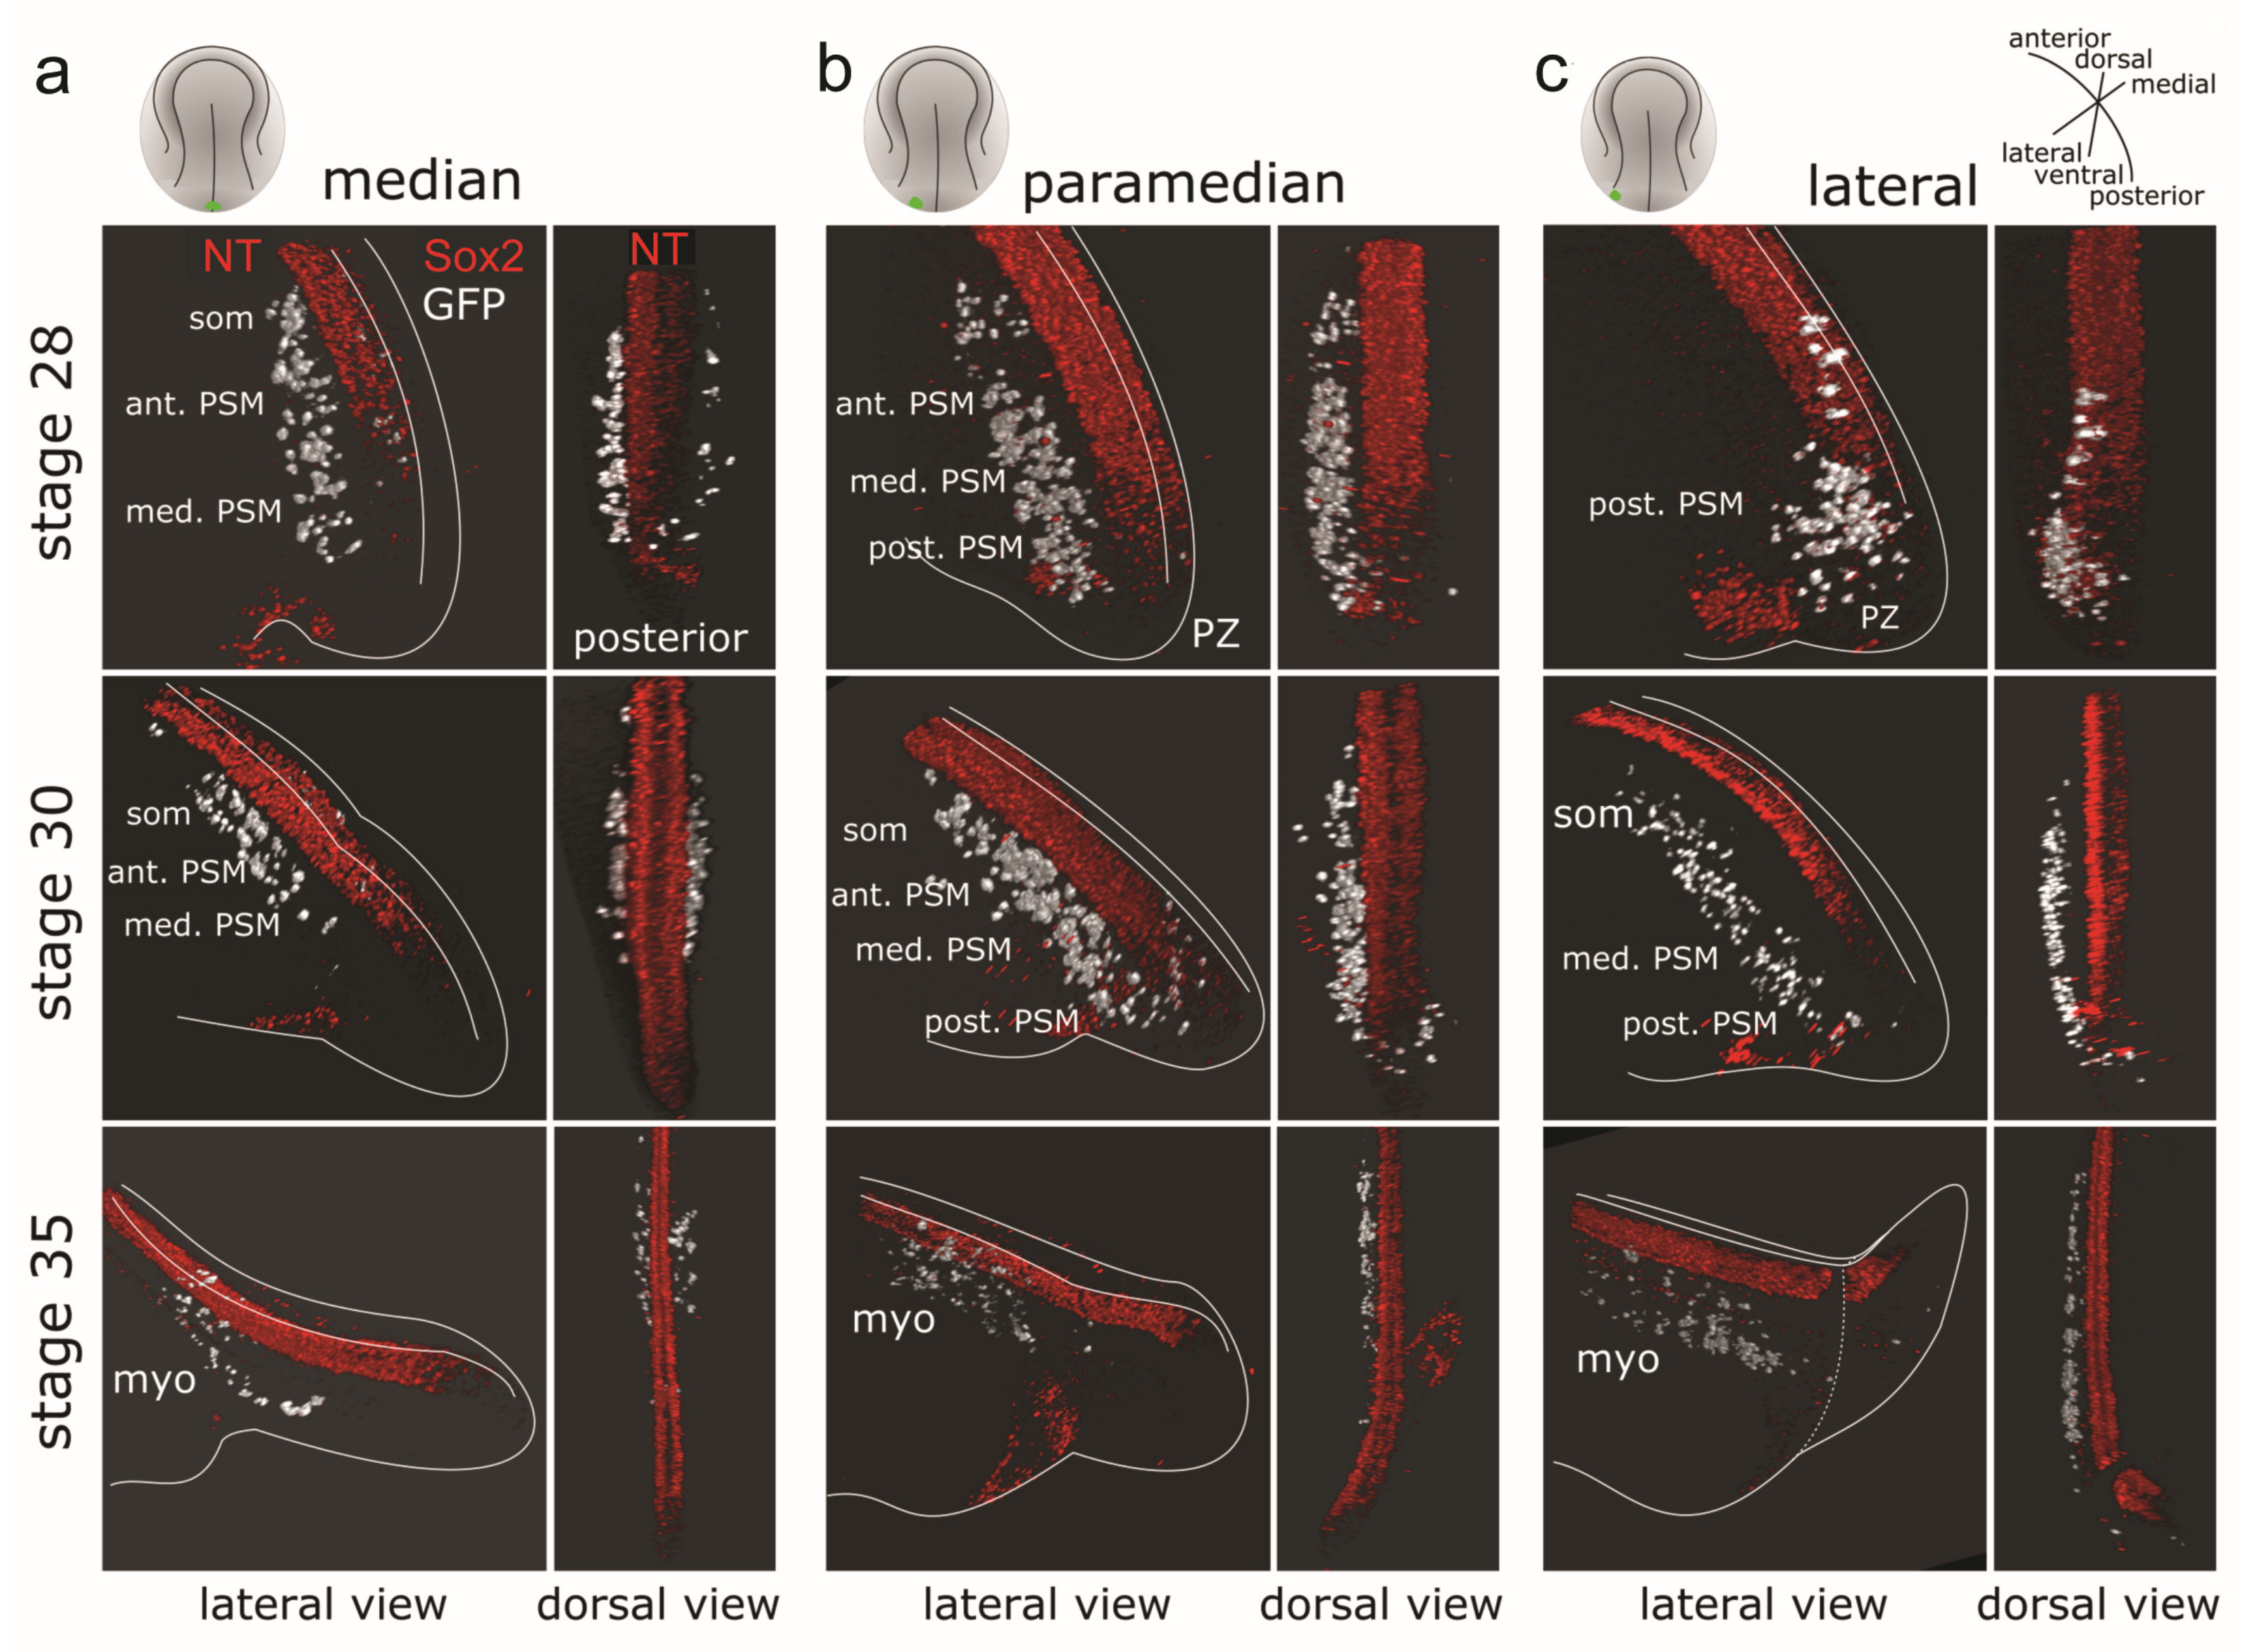
3.4.2. Three-dimensional Reconstructions of PSM from Grafts of Median, Paramedian or Lateral Subregions of the GFP+ Posterior NP

| Parameter | Stage 19 (69 h) | Stage 22 (73 h) | Stage 28 (92 h) | Stage 30 (102 h) | Stage 35 (122 h) |
|---|---|---|---|---|---|
| GFP+ PSM stream | NA | tail bud PSM bulge | Extended PSM | Elongated PSM, anteriorly narrowed | NA |
| GFP+ PSM stream (from median post. NP) | NA | NA | Medially from medial to anterior PSM | Medially in anterior PSM and somites | Medially in myotomes |
| GFP+ PSM stream (from paramedian post. NP) | NA | NA | Medially from posterior to anterior PSM | Medially from posterior PSM to somites | Medially in myotomes |
| GFP+ PSM stream (from lateral post. NP) | NA | NA | PZ and posterior PSM | Laterally from posterior PSM to somites | Laterally from PSM to myotome |
| GFP+ PSM cell number | 527 | 1095 | 1232 | 1989 | NA |
| AP-oriented cell divisions [%] | 5.9 | 1.4 | 12.1 | 4.4 | NA |
| Cell orientation | NA | PZ: 48% mediolateral | Post. PSM: mediolateral and anteroposterior (36% each); med. PSM: 44% anteroposterior | Ant. PSM: 32% mediolateral, 30% anteroposterior; somites: 46% dorsoventral, 33% anteroposterior | NA |
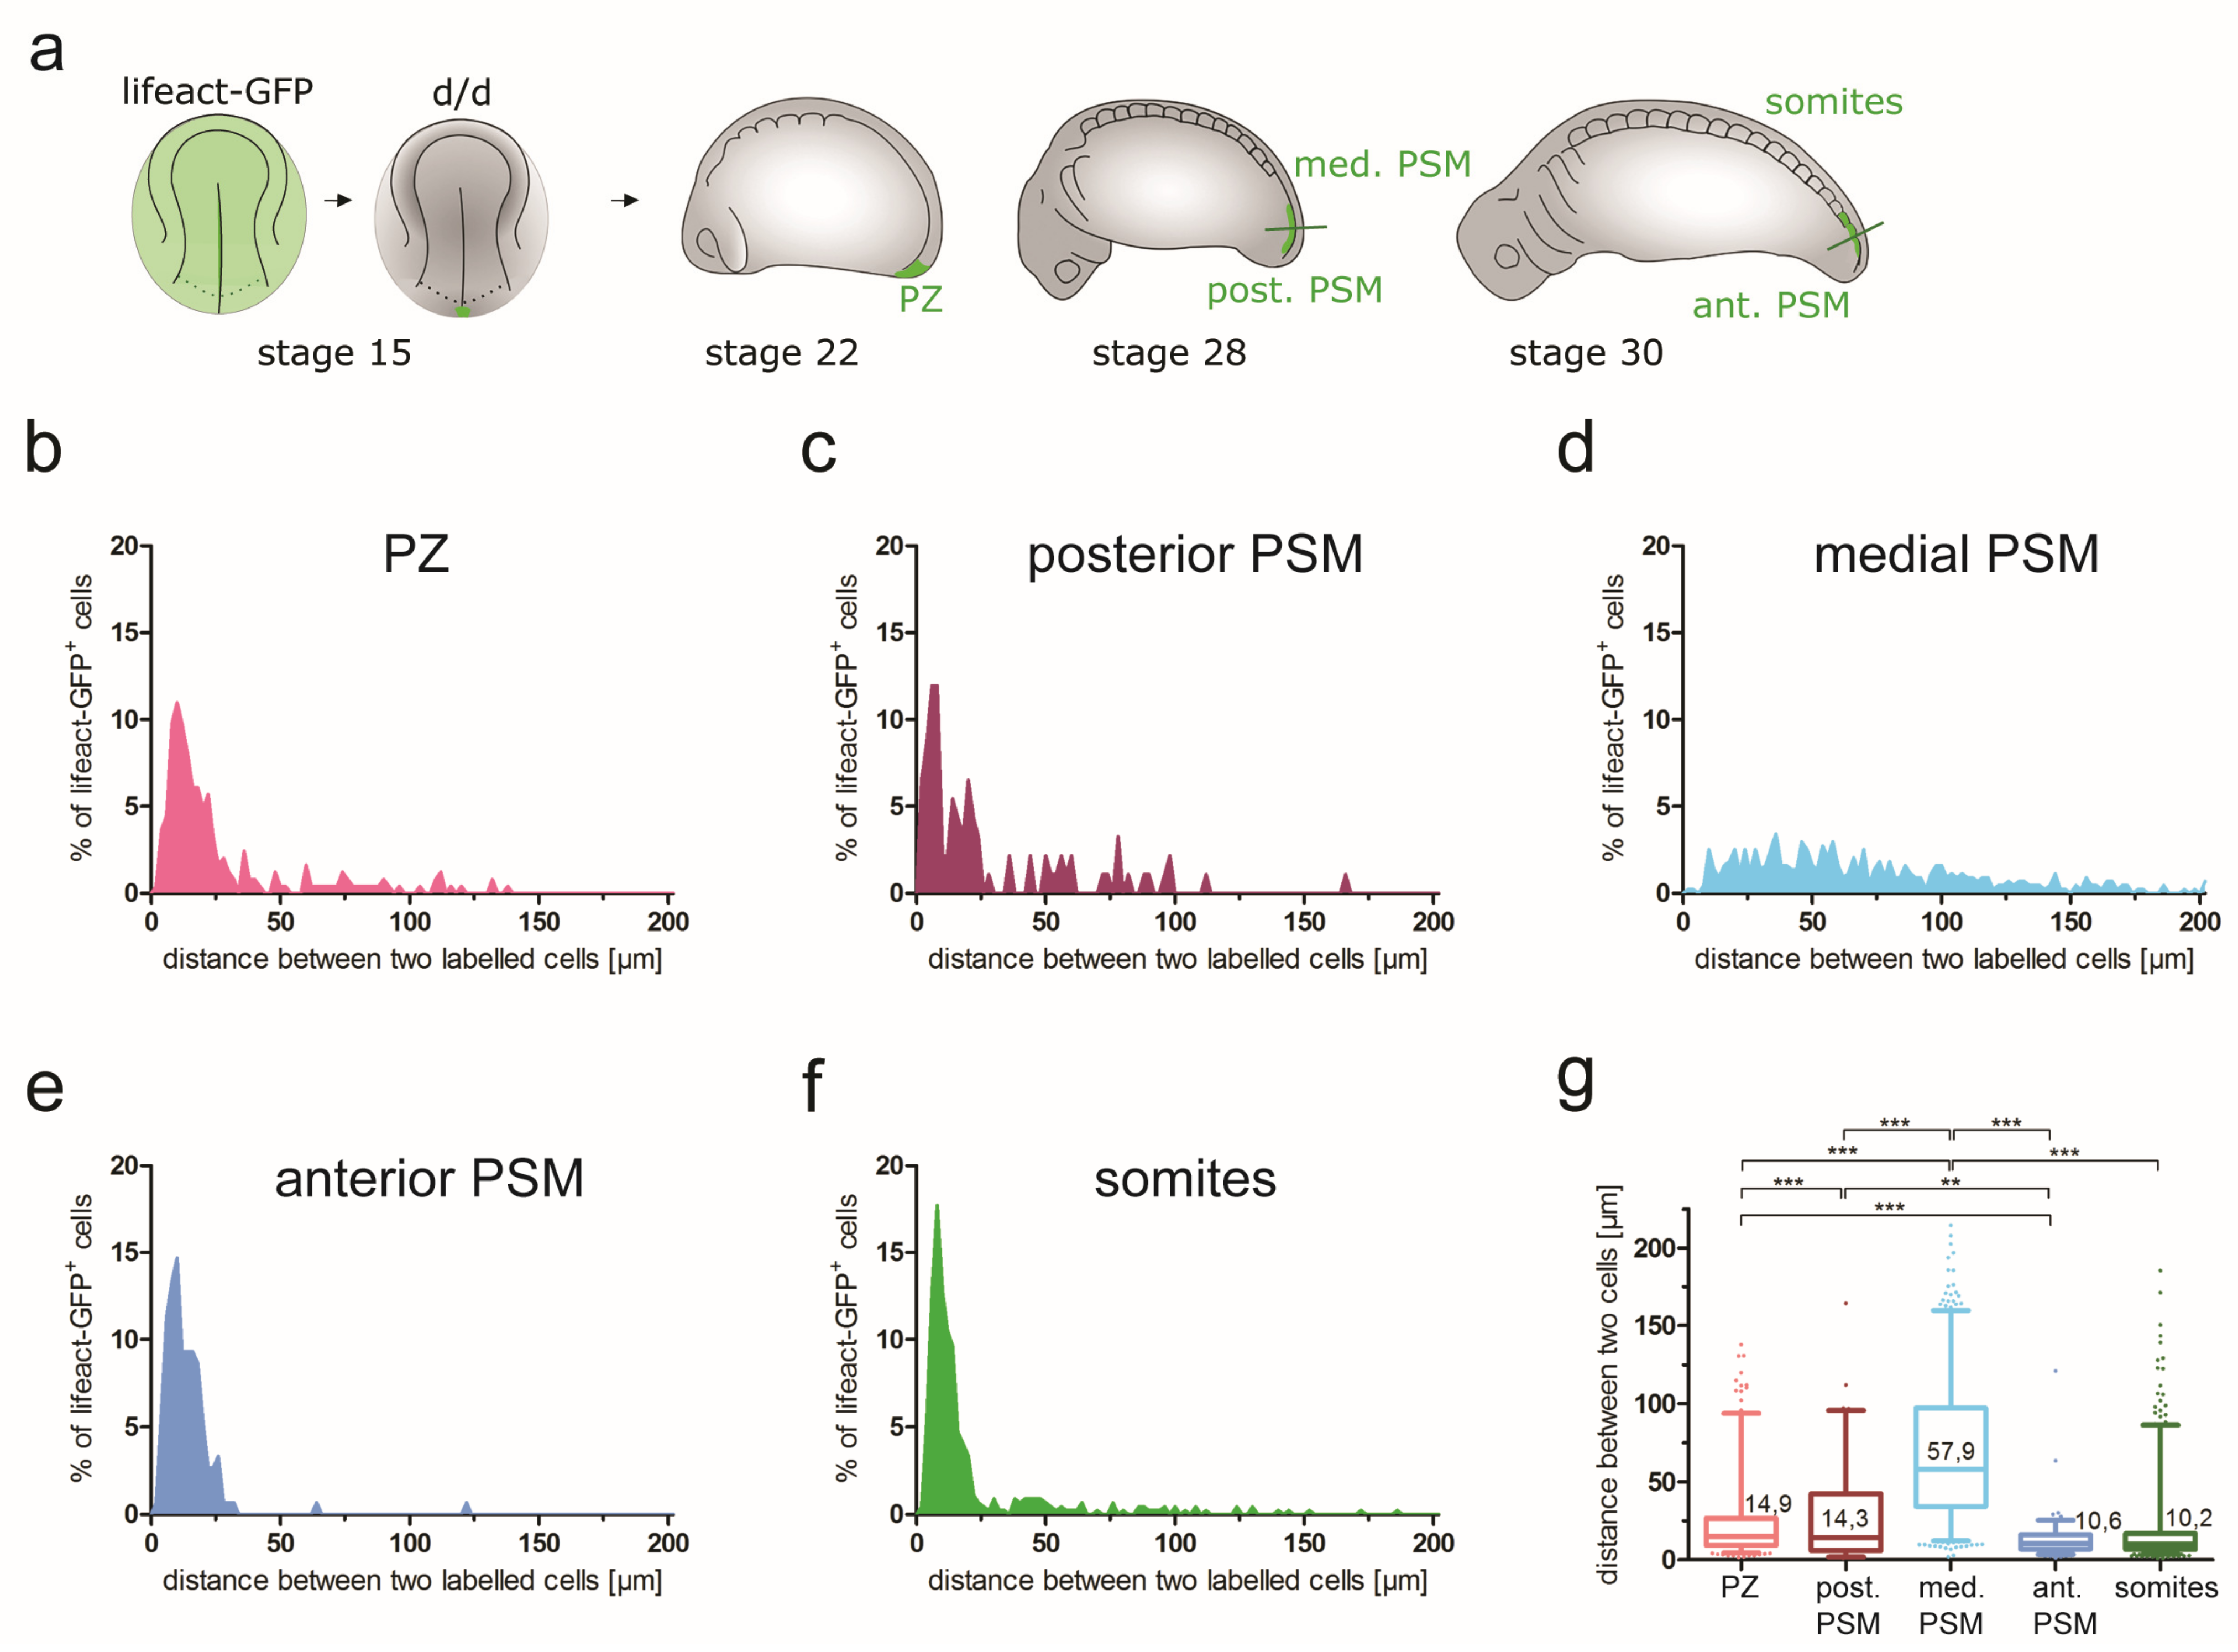
| Cell distances (cell group cohesion) | NA | PZ: 14.9 µm | Post. PSM: 14.3 µm; med. PSM: 57.9 µm | Ant. PSM: 10.6 µm; somites: 10.2 µm | NA |
| Cell distances (density) | NA | NA | NA | PZ to ant. PSM: ~30 µm; somite 1: ~25 µm | NA |
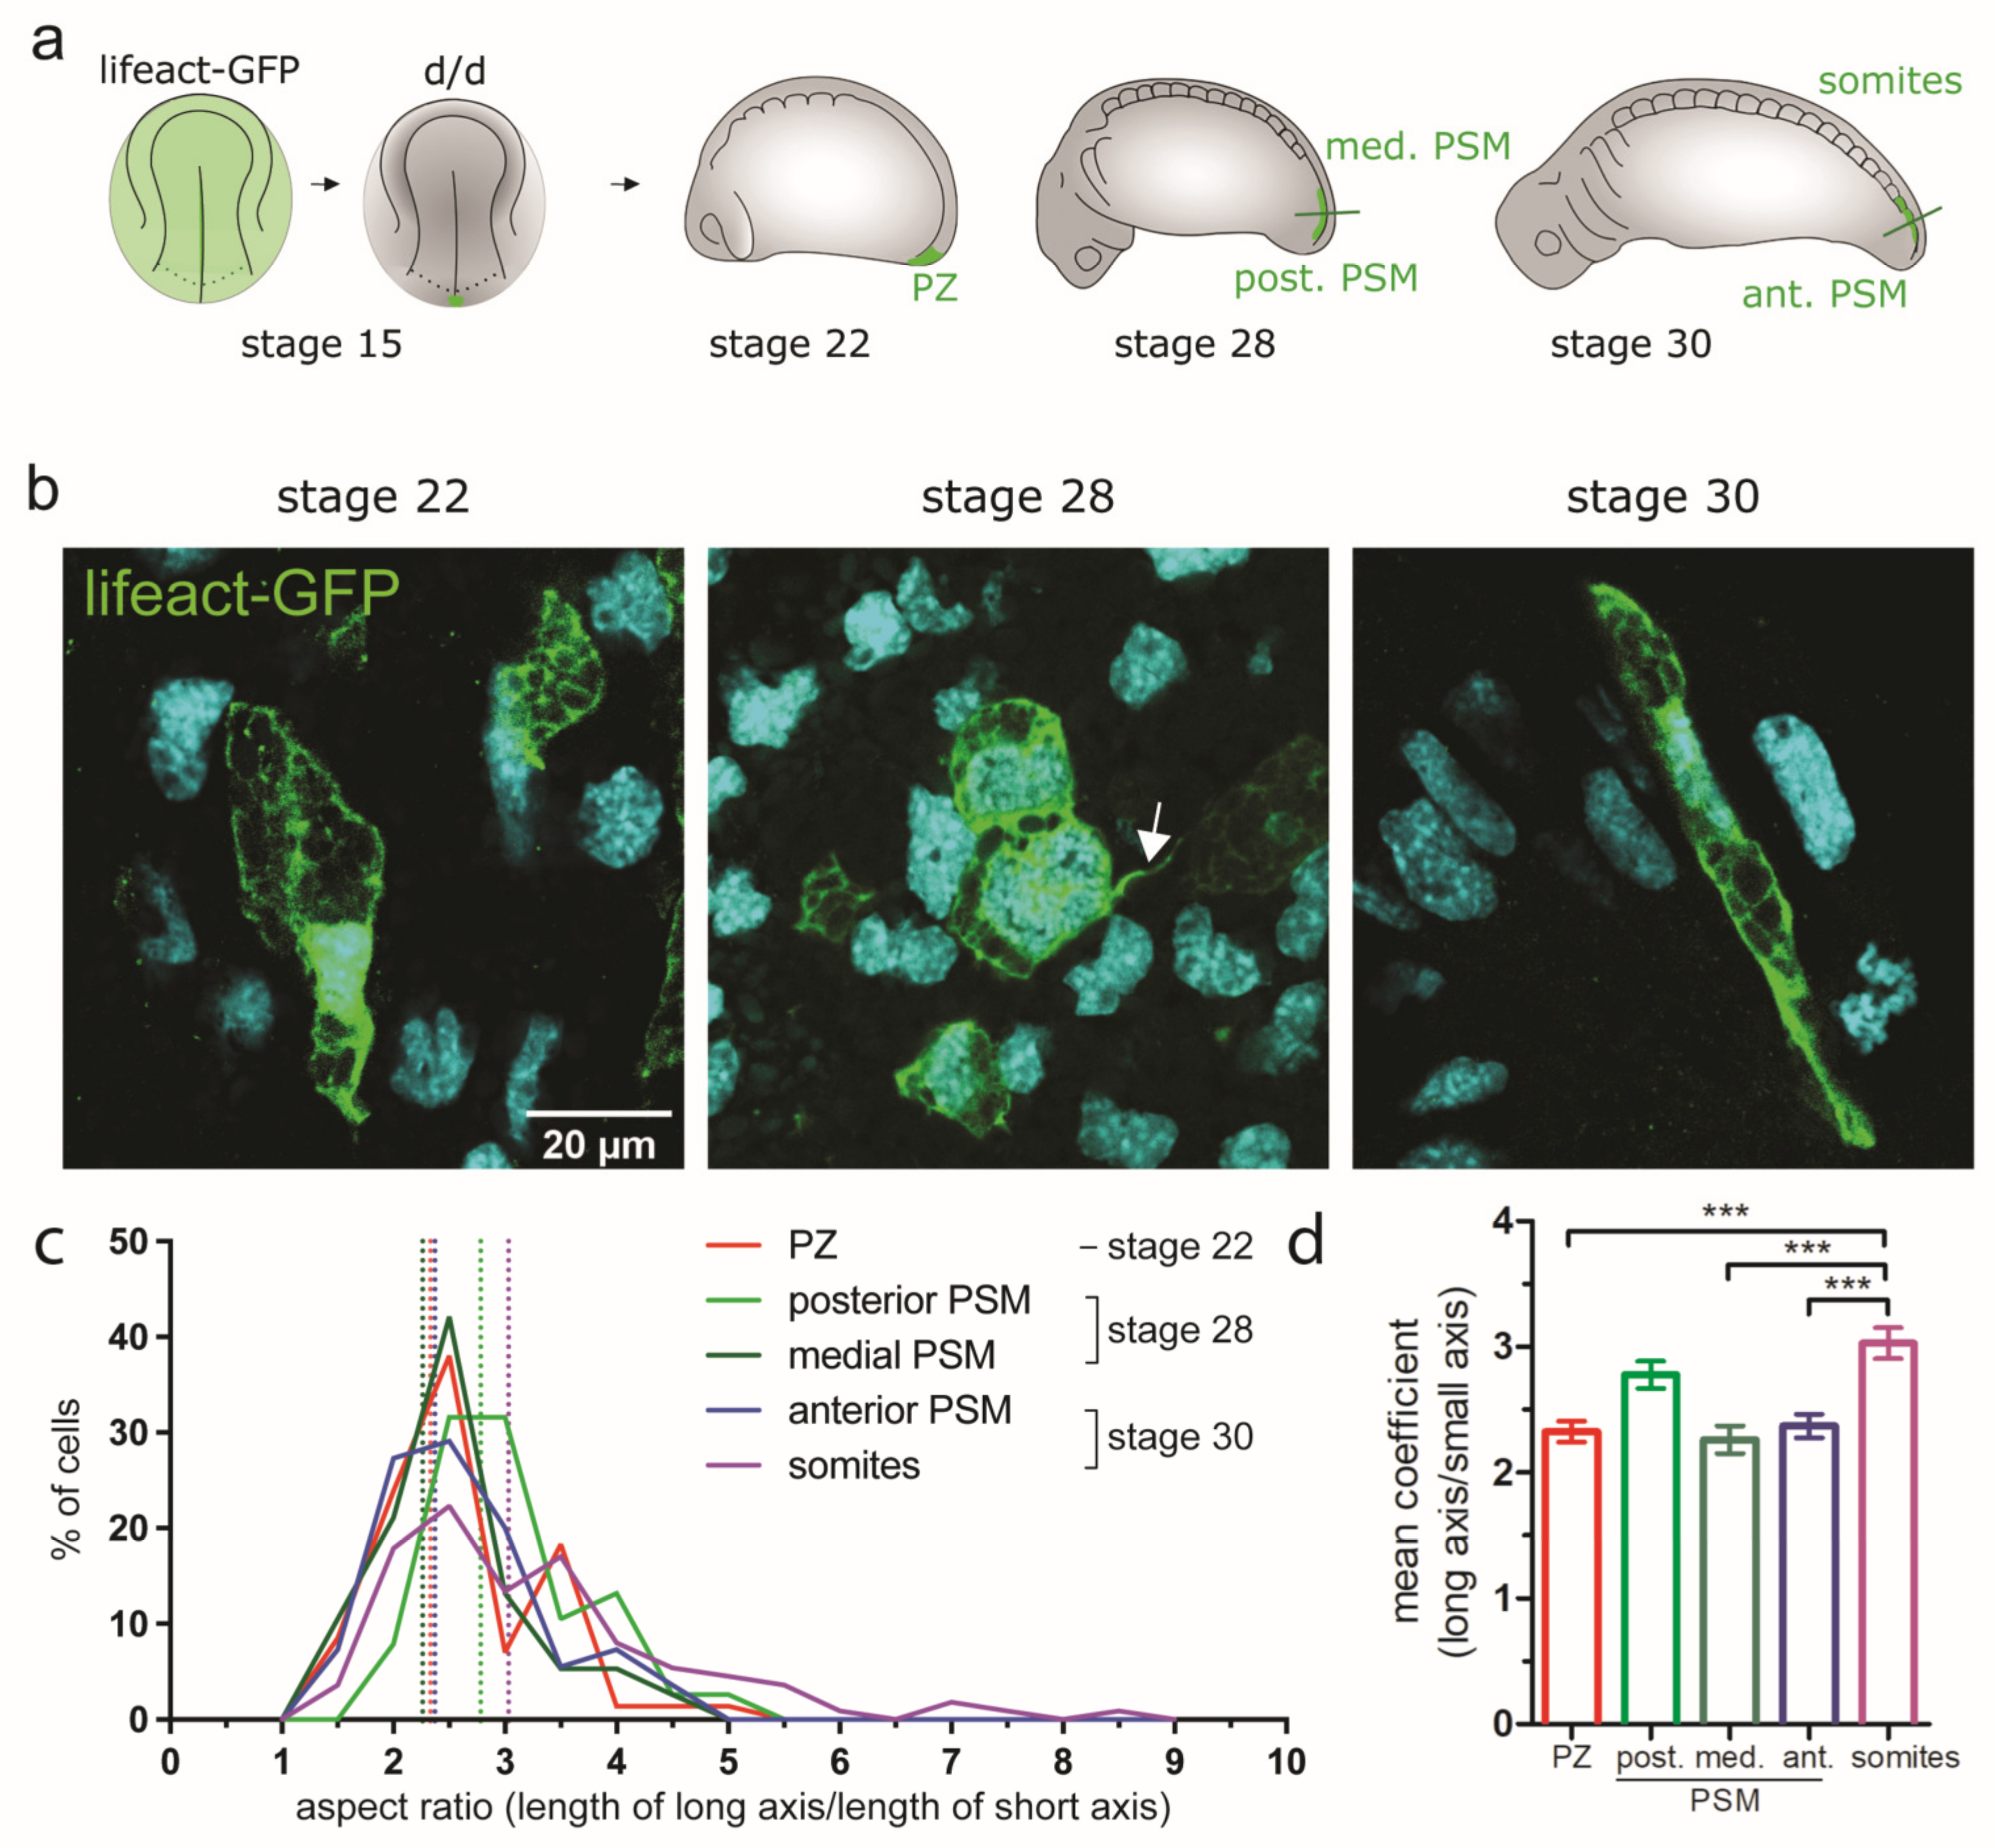
| Cell shape (aspect ratio; see Figure 6c-d); for description see 1 | NA | PZ: 2.33 | Post. PSM: 2.78; med. PSM: 2.26 | Ant. PSM: 2.37, somite: 3.03 | NA |
| Filopodia length | NA | PZ: ~6 µm | Post. and med. PSM ~6 µm | Ant. PSM and somites ~4 µm | NA |

3.5. Analysis of Cellular Parameters Influencing Paraxial Mesoderm Morphogenesis in the Posterior Body
3.5.1. Cell Addition and Oriented Cell Divisions of Tail Tissues during Morphogenesis and Elongation
3.5.2. Changes of Cell Shape and Orientation during Tail Morphogenesis and Elongation
3.5.3. Cell Group Cohesion during Axial Elongation and PSM Morphogenesis
3.6. The Epidermis Governs Tail Elongation by Affecting Mesodermal Tissue Integrity
4. Discussion
4.1. Model of PSM Morphogenesis and Axis Elongation in Axolotl
4.2. Limitations and Further Research Directions
5. Conclusions
Supplementary Materials
Author Contributions
Funding
Institutional Review Board Statement
Informed Consent Statement
Data Availability Statement
Acknowledgments
Conflicts of Interest
References
- Hubaud, A.; Pourquié, O. Signalling dynamics in vertebrate segmentation. Nat. Rev. Mol. Cell Biol. 2014, 15, 709–721. [Google Scholar] [CrossRef] [PubMed]
- Bénazéraf, B.; Pourquié, O. Formation and segmentation of the vertebrate body axis. Annu. Rev. Cell Dev. Biol. 2013, 29, 1–26. [Google Scholar] [CrossRef] [PubMed]
- Handrigan, G.R. Concordia discors: Duality in the origin of the vertebrate tail. J. Anat. 2003, 202 Pt 3, 255–267. [Google Scholar] [CrossRef] [PubMed]
- Shook, D.R.; Keller, R. Epithelial type, ingression, blastopore architecture and the evolution of chordate mesoderm morphogenesis. J. Exp. Zoolog. B Mol. Dev. Evol. 2008, 310, 85–110. [Google Scholar] [CrossRef]
- Steventon, B.; Martinez Arias, A. Evo-engineering and the cellular and molecular origins of the vertebrate spinal cord. Dev. Biol. 2017, 432, 3–13. [Google Scholar] [CrossRef]
- Mallo, M. The vertebrate tail: A gene playground for evolution. Cell Mol. Life Sci. 2020, 77, 1021–1030. [Google Scholar] [CrossRef]
- Gilbert, S.F. Developmental Biology, 9th ed.; Sinauer Associates: Sunderlan, MA, USA, 2010. [Google Scholar]
- Wolpert, L. Pattern formation in epithelial development: The vertebrate limb and feather bud spacing. Philos. Trans. R. Soc. Lond. B Biol. Sci. 1998, 353, 871–875. [Google Scholar] [CrossRef]
- Garrido-Allepuz, C.; Haro, E.; González-Lamuño, D.; Martínez-Frías, M.L.; Bertocchini, F.; Ros, M.A. A clinical and experimental overview of sirenomelia: Insight into the mechanisms of congenital limb malformations. Dis. Model. Mech. 2011, 4, 289–299. [Google Scholar] [CrossRef]
- Xiong, F.; Ma, W.; Bénazéraf, B.; Mahadevan, L.; Pourquié, O. Mechanical Coupling Coordinates the Co-elongation of Axial and Paraxial Tissues in Avian Embryos. Dev. Cell 2020, 55, 354–366.e5. [Google Scholar] [CrossRef]
- Bénazéraf, B.; Beaupeux, M.; Tchernookov, M.; Wallingford, A.; Salisbury, T.; Shirtz, A.; Shirtz, A.; Huss, D.; Pourquié, O.; François, P.; et al. Multi-scale quantification of tissue behavior during amniote embryo axis elongation. Dev. Camb. Engl. 2017, 144, 4462–4472. [Google Scholar] [CrossRef]
- Bénazéraf, B.; Francois, P.; Baker, R.E.; Denans, N.; Little, C.D.; Pourquié, O. A random cell motility gradient downstream of FGF controls elongation of an amniote embryo. Nature 2010, 466, 248–252. [Google Scholar] [CrossRef]
- Davis, R.L.; Kirschner, M.W. The fate of cells in the tailbud of Xenopus laevis. Dev. Camb. Engl. 2000, 127, 255–267. [Google Scholar] [CrossRef]
- Romanos, M.; Allio, G.; Roussigné, M.; Combres, L.; Escalas, N.; Soula, C.; Médevielle, F.; Steventon, B.; Trescases, A.; Bénazéraf, B. Cell-to-cell heterogeneity in Sox2 and Bra expression guides progenitor motility and destiny. eLife 2021, 10, e66588. [Google Scholar] [CrossRef]
- Olivera-Martinez, I.; Harada, H.; Halley, P.A.; Storey, K.G. Loss of FGF-dependent mesoderm identity and rise of endogenous retinoid signalling determine cessation of body axis elongation. PLoS Biol. 2012, 10, e1001415. [Google Scholar] [CrossRef]
- Sambasivan, R.; Steventon, B. Neuromesodermal Progenitors: A Basis for Robust Axial Patterning in Development and Evolution. Front. Cell Dev. Biol. 2021, 8, 607516. [Google Scholar] [CrossRef]
- Wymeersch, F.J.; Huang, Y.; Blin, G.; Cambray, N.; Wilkie, R.; Wong, F.C.K.; Wilson, V. Position-dependent plasticity of distinct progenitor types in the primitive streak. eLife 2016, 5, e10042. [Google Scholar] [CrossRef]
- Tzouanacou, E.; Wegener, A.; Wymeersch, F.J.; Wilson, V.; Nicolas, J.-F. Redefining the progression of lineage segregations during mammalian embryogenesis by clonal analysis. Dev. Cell 2009, 17, 365–376. [Google Scholar] [CrossRef]
- Wymeersch, F.J.; Wilson, V.; Tsakiridis, A. Understanding axial progenitor biology in vivo and in vitro. Dev. Camb. Engl. 2021, 148, dev180612. [Google Scholar] [CrossRef]
- Martin, B.L.; Kimelman, D. Canonical Wnt signaling dynamically controls multiple stem cell fate decisions during vertebrate body formation. Dev. Cell 2012, 22, 223–232. [Google Scholar] [CrossRef]
- Toh, K.; Saunders, D.; Verd, B.; Steventon, B. Zebrafish neuromesodermal progenitors undergo a critical state transition in vivo. iScience 2022, 25, 105216. [Google Scholar] [CrossRef]
- Attardi, A.; Fulton, T.; Florescu, M.; Shah, G.; Muresan, L.; Lenz, M.O.; Lancaster, C.; Huisken, J.; van Oudenaarden, A.; Steventon, B. Neuromesodermal progenitors are a conserved source of spinal cord with divergent growth dynamics. Dev. Camb. Engl. 2018, 145, dev166728. [Google Scholar] [CrossRef] [PubMed]
- Taniguchi, Y.; Kurth, T.; Weiche, S.; Reichelt, S.; Tazaki, A.; Perike, S.; Kappert, V.; Epperlein, H.-H. The posterior neural plate in axolotl gives rise to neural tube or turns anteriorly to form somites of the tail and posterior trunk. Dev. Biol. 2017, 422, 155–170. [Google Scholar] [CrossRef] [PubMed]
- Taniguchi, Y.; Kurth, T.; Medeiros, D.M.; Tazaki, A.; Ramm, R.; Epperlein, H.-H. Mesodermal origin of median fin mesenchyme and tail muscle in amphibian larvae. Sci. Rep. 2015, 5, 11428. [Google Scholar] [CrossRef] [PubMed]
- Bijtel, J.H. Über die Entwicklung des Schwanzes bei Amphibien. Wilhelm Roux Arch. Entwickl. Org. 1931, 125, 448–486. [Google Scholar] [CrossRef] [PubMed]
- Tucker, A.S.; Slack, J.M. Tail bud determination in the vertebrate embryo. Curr. Biol. CB 1995, 5, 807–813. [Google Scholar] [CrossRef]
- Duband, J.L.; Monier, F.; Delannet, M.; Newgreen, D. Epithelium-mesenchyme transition during neural crest development. Acta Anat. 1995, 154, 63–78. [Google Scholar] [CrossRef]
- Rao, Y. Conversion of a mesodermalizing molecule, the Xenopus Brachyury gene, into a neuralizing factor. Genes Dev. 1994, 8, 939–947. [Google Scholar] [CrossRef]
- Gont, L.K.; Steinbeisser, H.; Blumberg, B.; de Robertis, E.M. Tail formation as a continuation of gastrulation: The multiple cell populations of the Xenopus tailbud derive from the late blastopore lip. Dev. Camb. Engl. 1993, 119, 991–1004. [Google Scholar] [CrossRef]
- Youn, B.W.; Malacinski, G.M. Somitogenesis in the amphibian Xenopus laevis: Scanning electron microscopic analysis of intrasomitic cellular arrangements during somite rotation. J. Embryol. Exp. Morphol. 1981, 64, 23–43. [Google Scholar] [CrossRef]
- Youn, B.W.; Malacinski, G.M. Comparative analysis of amphibian somite morphogenesis: Cell rearrangement patterns during rosette formation and myoblast fusion. J. Embryol. Exp. Morphol. 1981, 66, 1–26. [Google Scholar] [CrossRef]
- Lawton, A.K.; Nandi, A.; Stulberg, M.J.; Dray, N.; Sneddon, M.W.; Pontius, W.; Emonet, T.; Holley, S.A. Regulated tissue fluidity steers zebrafish body elongation. Dev. Camb. Engl. 2013, 140, 573–582. [Google Scholar] [CrossRef]
- Steventon, B.; Duarte, F.; Lagadec, R.; Mazan, S.; Nicolas, J.-F.; Hirsinger, E. Species-specific contribution of volumetric growth and tissue convergence to posterior body elongation in vertebrates. Dev. Camb. Engl. 2016, 143, 1732–1741. [Google Scholar] [CrossRef]
- Piatkowska, A.M.; Evans, S.E.; Stern, C.D. Cellular aspects of somite formation in vertebrates. Cells Dev. 2021, 168, 203732. [Google Scholar] [CrossRef]
- Dray, N.; Lawton, A.; Nandi, A.; Jülich, D.; Emonet, T.; Holley, S.A. Cell-fibronectin interactions propel vertebrate trunk elongation via tissue mechanics. Curr. Biol. 2013, 23, 1335–1341. [Google Scholar] [CrossRef]
- Mongera, A.; Rowghanian, P.; Gustafson, H.J.; Shelton, E.; Kealhofer, D.A.; Carn, E.K.; Serwane, F.; Lucio, A.A.; Giammona, J.; Campàs, O. A fluid-to-solid jamming transition underlies vertebrate body axis elongation. Nature 2018, 561, 401–405. [Google Scholar] [CrossRef]
- Serwane, F.; Mongera, A.; Rowghanian, P.; Kealhofer, D.A.; Lucio, A.A.; Hockenbery, Z.M.; Campàs, O. In vivo quantification of spatially varying mechanical properties in developing tissues. Nat. Methods 2017, 14, 181–186. [Google Scholar] [CrossRef]
- Epperlein, H.-H.; Selleck, M.A.J.; Meulemans, D.; Mchedlishvili, L.; Cerny, R.; Sobkow, L.; Bronner-Fraser, M. Migratory patterns and developmental potential of trunk neural crest cells in the axolotl embryo. Dev. Dyn. Off. Publ. Am. Assoc. Anat. 2007, 236, 389–403. [Google Scholar] [CrossRef]
- Ke, M.-T.; Fujimoto, S.; Imai, T. SeeDB: A simple and morphology-preserving optical clearing agent for neuronal circuit reconstruction. Nat. Neurosci. 2013, 16, 1154–1161. [Google Scholar] [CrossRef]
- Masselink, W.; Reumann, D.; Murawala, P.; Pasierbek, P.; Taniguchi, Y.; Bonnay, F.; Meixner, K.; Knoblich, J.A.; Tanaka, E.M. Broad applicability of a streamlined ethyl cinnamate-based clearing procedure. Dev. Camb. Engl. 2019, 146, dev166884. [Google Scholar] [CrossRef]
- Steinberg, M. A non-nutrient culture medium for amphibian embryonic tissues. Carnegie Inst. Wash. Yearb. 1957, 56, 347–348. [Google Scholar]
- McHedlishvili, L.; Mazurov, V.; Grassme, K.S.; Goehler, K.; Robl, B.; Tazaki, A.; Roensch, K.; Duemmler, A.; Tanaka, E.M. Reconstitution of the central and peripheral nervous system during salamander tail regeneration. Proc. Natl. Acad. Sci. USA 2012, 109, E2258–E2266. [Google Scholar] [CrossRef] [PubMed]
- Kurth, T.; Weiche, S.; Vorkel, D.; Kretschmar, S.; Menge, A. Histology of plastic embedded amphibian embryos and larvae. Genesis 2012, 50, 235–250. [Google Scholar] [CrossRef] [PubMed]
- Pérez Saturnino, A.; Lust, K.; Wittbrodt, J. Notch signalling patterns retinal composition by regulating atoh7 during post-embryonic growth. Dev. Camb. Engl. 2018, 145, dev169698. [Google Scholar] [CrossRef] [PubMed]
- Schindelin, J.; Arganda-Carreras, I.; Frise, E.; Kaynig, V.; Longair, M.; Pietzsch, T.; Preibisch, S.; Rueden, C.; Saalfeld, S.; Schmid, B.; et al. Fiji: An open-source platform for biological-image analysis. Nat. Methods 2012, 9, 676–682. [Google Scholar] [CrossRef] [PubMed]
- Ollion, J.; Cochennec, J.; Loll, F.; Escudé, C.; Boudier, T. TANGO: A generic tool for high-throughput 3D image analysis for studying nuclear organization. Bioinform. Oxf. Engl. 2013, 29, 1840–1841. [Google Scholar] [CrossRef]
- Schmid, B.; Schindelin, J.; Cardona, A.; Longair, M.; Heisenberg, M. A high-level 3D visualization API for Java and ImageJ. BMC Bioinform. 2010, 11, 274. [Google Scholar] [CrossRef]
- Bordzilovskaya, N.P.; Dettlaff, T.A. Table of stages of the normal development of axolotl embryos and the prognostication of timing of successive developmental stages at various temperatures. Axolotl Newsl. 1979, 7, 2–22. [Google Scholar]
- Bordzilovskaya, N.P.; Dettlaff, T.A.; Duhon, S.T.; Malacinski, G.M. Developmental-stage series of axolotl embryos. In Developmental Biology of the Axolotl; Oxford University Press: New York, NY, USA, 1989; pp. 201–219. [Google Scholar]
- Borycki, A.G.; Li, J.; Jin, F.; Emerson, C.P.; Epstein, J.A. Pax3 functions in cell survival and in pax7 regulation. Dev. Camb. Engl. 1999, 126, 1665–1674. [Google Scholar] [CrossRef]
- Huttner, W.B.; Brand, M. Asymmetric division and polarity of neuroepithelial cells. Curr. Opin. Neurobiol. 1997, 7, 29–39. [Google Scholar] [CrossRef]
- Shellard, A.; Mayor, R. Integrating chemical and mechanical signals in neural crest cell migration. Curr. Opin. Genet. Dev. 2019, 57, 16–24. [Google Scholar] [CrossRef]
- Cerny, R.; Meulemans, D.; Berger, J.; Wilsch-Bräuninger, M.; Kurth, T.; Bronner-Fraser, M.; Epperlein, H.-H. Combined intrinsic and extrinsic influences pattern cranial neural crest migration and pharyngeal arch morphogenesis in axolotl. Dev. Biol. 2004, 266, 252–269. [Google Scholar] [CrossRef]
- Epperlein, H.H.; Halfter, W.; Tucker, R.P. The distribution of fibronectin and tenascin along migratory pathways of the neural crest in the trunk of amphibian embryos. Dev. Camb. Engl. 1988, 103, 743–756. [Google Scholar] [CrossRef]
- Epperlein, H.H.; Radomski, N.; Wonka, F.; Walther, P.; Wilsch, M.; Müller, M.; Schwarz, H. Immunohistochemical demonstration of hyaluronan and its possible involvement in axolotl neural crest cell migration. J. Struct. Biol. 2000, 132, 19–32. [Google Scholar] [CrossRef]
- Girós, A.; Grgur, K.; Gossler, A.; Costell, M. α5β1 integrin-mediated adhesion to fibronectin is required for axis elongation and somitogenesis in mice. PLoS ONE 2011, 6, e22002. [Google Scholar] [CrossRef] [PubMed]
- Georges-Labouesse, E.N.; George, E.L.; Rayburn, H.; Hynes, R.O. Mesodermal development in mouse embryos mutant for fibronectin. Dev. Dyn. Off. Publ. Am. Assoc. Anat. 1996, 207, 145–156. [Google Scholar] [CrossRef]
- Malacinski, G.M.; Youn, B.W. The structure of the anuran amphibian Notochord and a re-evaluation of its presumed role in early embryogenesis. Differentiation 1982, 21, 13–21. [Google Scholar] [CrossRef]
- Dent, J.A.; Polson, A.G.; Klymkowsky, M.W. A whole-mount immunocytochemical analysis of the expression of the intermediate filament protein vimentin in Xenopus. Development 1989, 105, 61–74. [Google Scholar] [CrossRef]
- Schneider, S.; Steinbeisser, H.; Warga, R.M.; Hausen, P. Beta-catenin translocation into nuclei demarcates the dorsalizing centers in frog and fish embryos. Mech. Dev. 1996, 57, 191–198. [Google Scholar] [CrossRef]


| Stage | GFP+ Mesodermal Cells | GFP+ Neural Cells | Anteroposteriorly-Oriented Cell Divisions [%] |
|---|---|---|---|
| 19 | 527 | 0 | 5.9 |
| 22 | 1095 | 27 | 1.4 |
| 28 | 1232 | 78 | 12.1 |
| 30 | 1989 | 1 | 4.4 |
| Epidermis Removal | Normal | Lateral Bending | Misshapen | Missing | n (Total Analysed Embryos) |
|---|---|---|---|---|---|
| Control | 4 (80%) | 0 | 0 | 1 (20%) | 5 |
| Left | 2 (12.5%) | 7 (43.8%) | 4 (25%) | 3 (18.8%) | 16 |
| Right | 2 (20%) | 2 (20%) | 4 (40%) | 2 (20%) | 10 |
| Bilateral | 1 (10%) | 2 (20%) | 3 (30%) | 4 (40%) | 10 |
| Condition | Normal | Deformed | n (Total) |
|---|---|---|---|
| 3% methylcellulose | 3/0 | 0/3 | 3/3 |
| 3% methylcellulose + fibronectin | 3/0 | 0/3 | 3/3 |
| 1% agarose | 3/0 | 0/3 | 3/3 |
| 1% agarose + fibronectin | 2/0 | 1/3 | 3/3 |
Disclaimer/Publisher’s Note: The statements, opinions and data contained in all publications are solely those of the individual author(s) and contributor(s) and not of MDPI and/or the editor(s). MDPI and/or the editor(s) disclaim responsibility for any injury to people or property resulting from any ideas, methods, instructions or products referred to in the content. |
© 2023 by the authors. Licensee MDPI, Basel, Switzerland. This article is an open access article distributed under the terms and conditions of the Creative Commons Attribution (CC BY) license (https://creativecommons.org/licenses/by/4.0/).
Share and Cite
Stepien, B.K.; Pawolski, V.; Wagner, M.-C.; Kurth, T.; Schmidt, M.H.H.; Epperlein, H.-H. The Role of Posterior Neural Plate-Derived Presomitic Mesoderm (PSM) in Trunk and Tail Muscle Formation and Axis Elongation. Cells 2023, 12, 1313. https://doi.org/10.3390/cells12091313
Stepien BK, Pawolski V, Wagner M-C, Kurth T, Schmidt MHH, Epperlein H-H. The Role of Posterior Neural Plate-Derived Presomitic Mesoderm (PSM) in Trunk and Tail Muscle Formation and Axis Elongation. Cells. 2023; 12(9):1313. https://doi.org/10.3390/cells12091313
Chicago/Turabian StyleStepien, Barbara K., Verena Pawolski, Marc-Christoph Wagner, Thomas Kurth, Mirko H. H. Schmidt, and Hans-Henning Epperlein. 2023. "The Role of Posterior Neural Plate-Derived Presomitic Mesoderm (PSM) in Trunk and Tail Muscle Formation and Axis Elongation" Cells 12, no. 9: 1313. https://doi.org/10.3390/cells12091313