
Elastomeric Pillar Cages Modulate Actomyosin Contractility of Epithelial Microtissues by Substrate Stiffness and Topography
 , and
, and 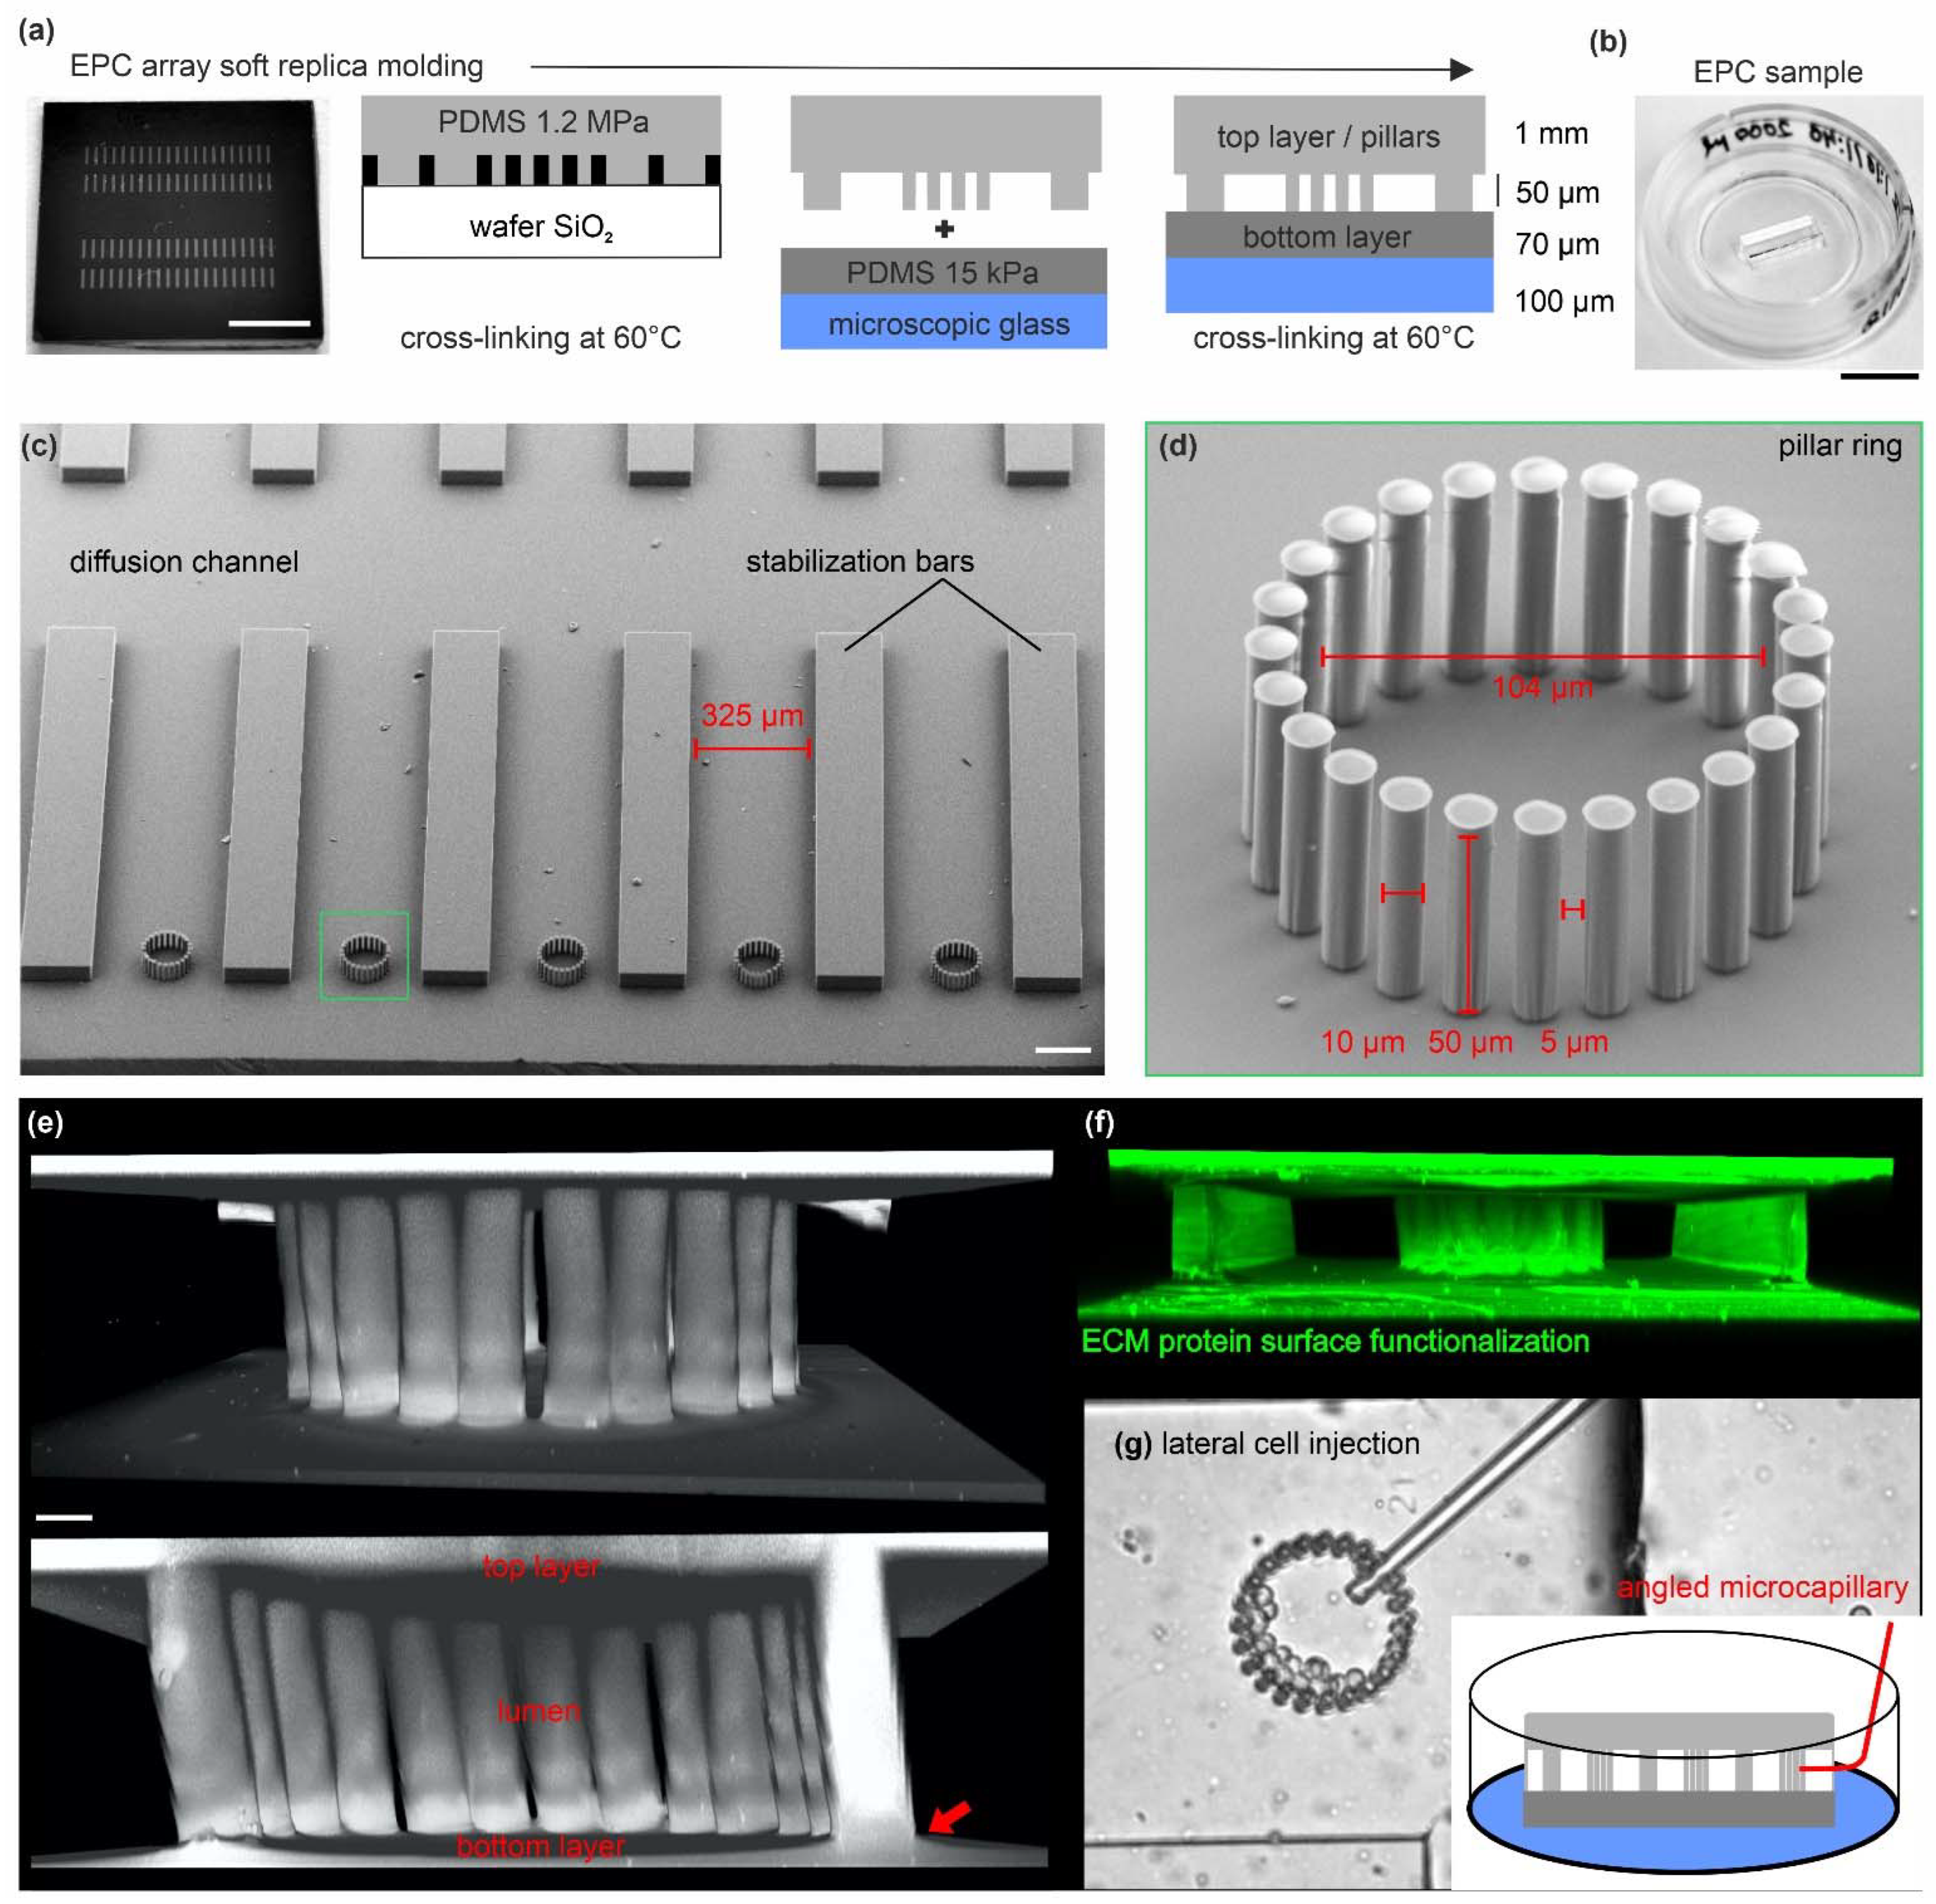
Abstract
:1. Introduction
2. Materials and Methods
2.1. Preparation of Microstructured Casting Molds
2.2. Preparation of Microstructured Casting Molds
2.3. Cell Maintenance
2.4. Cell Seeding in EPC Arrays
2.5. Immunofluorescence Staining
2.6. Scanning Electron Microscopy
2.7. Imaging of Living and Fixed Cells
2.8. Cell Ablation
2.9. 2D Traction Force Microscopy and EPC Force Retrieval
2.10. Statistical Analyses
3. Results
3.1. Microfabrication of EPCs for 3D Epithelial Cell Cultures
3.2. The EPC Geometry Induces the Growth of Mono- and Bilayered Epithelial Microtissues
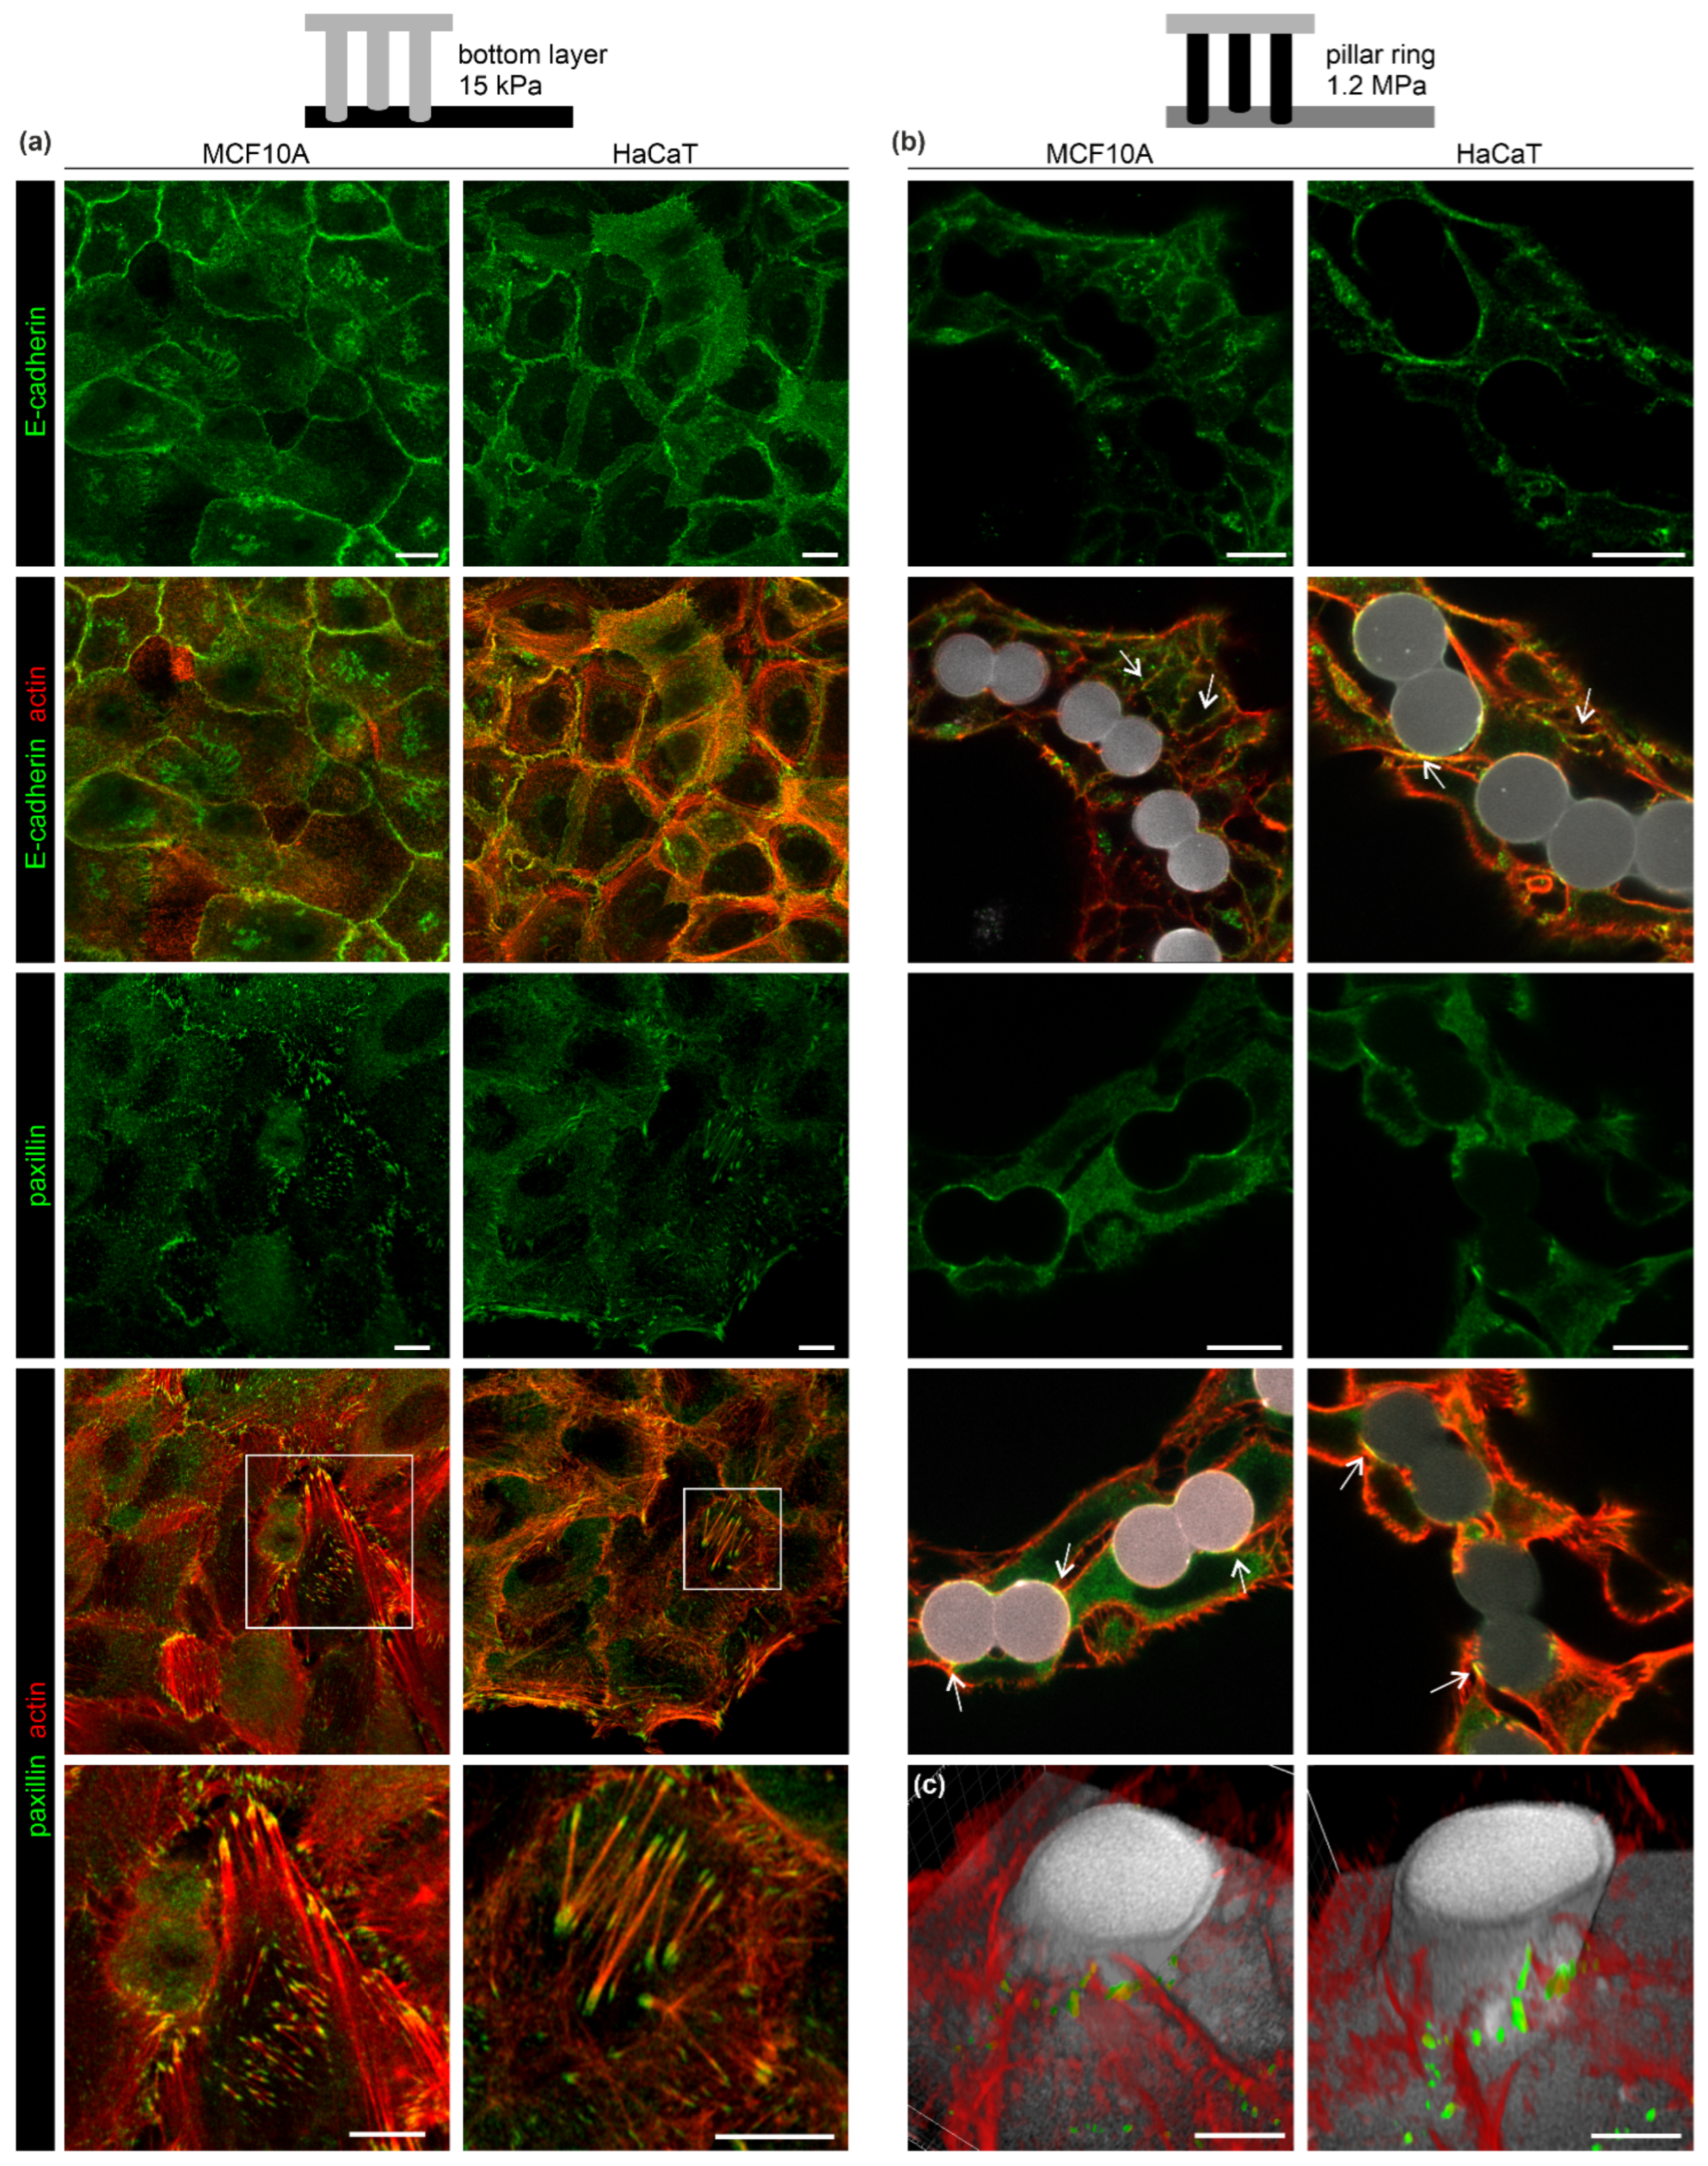
3.3. The EPC Geometry Modulates Actin-Mediated Cell-Cell Junctions and Matrix Adhesion
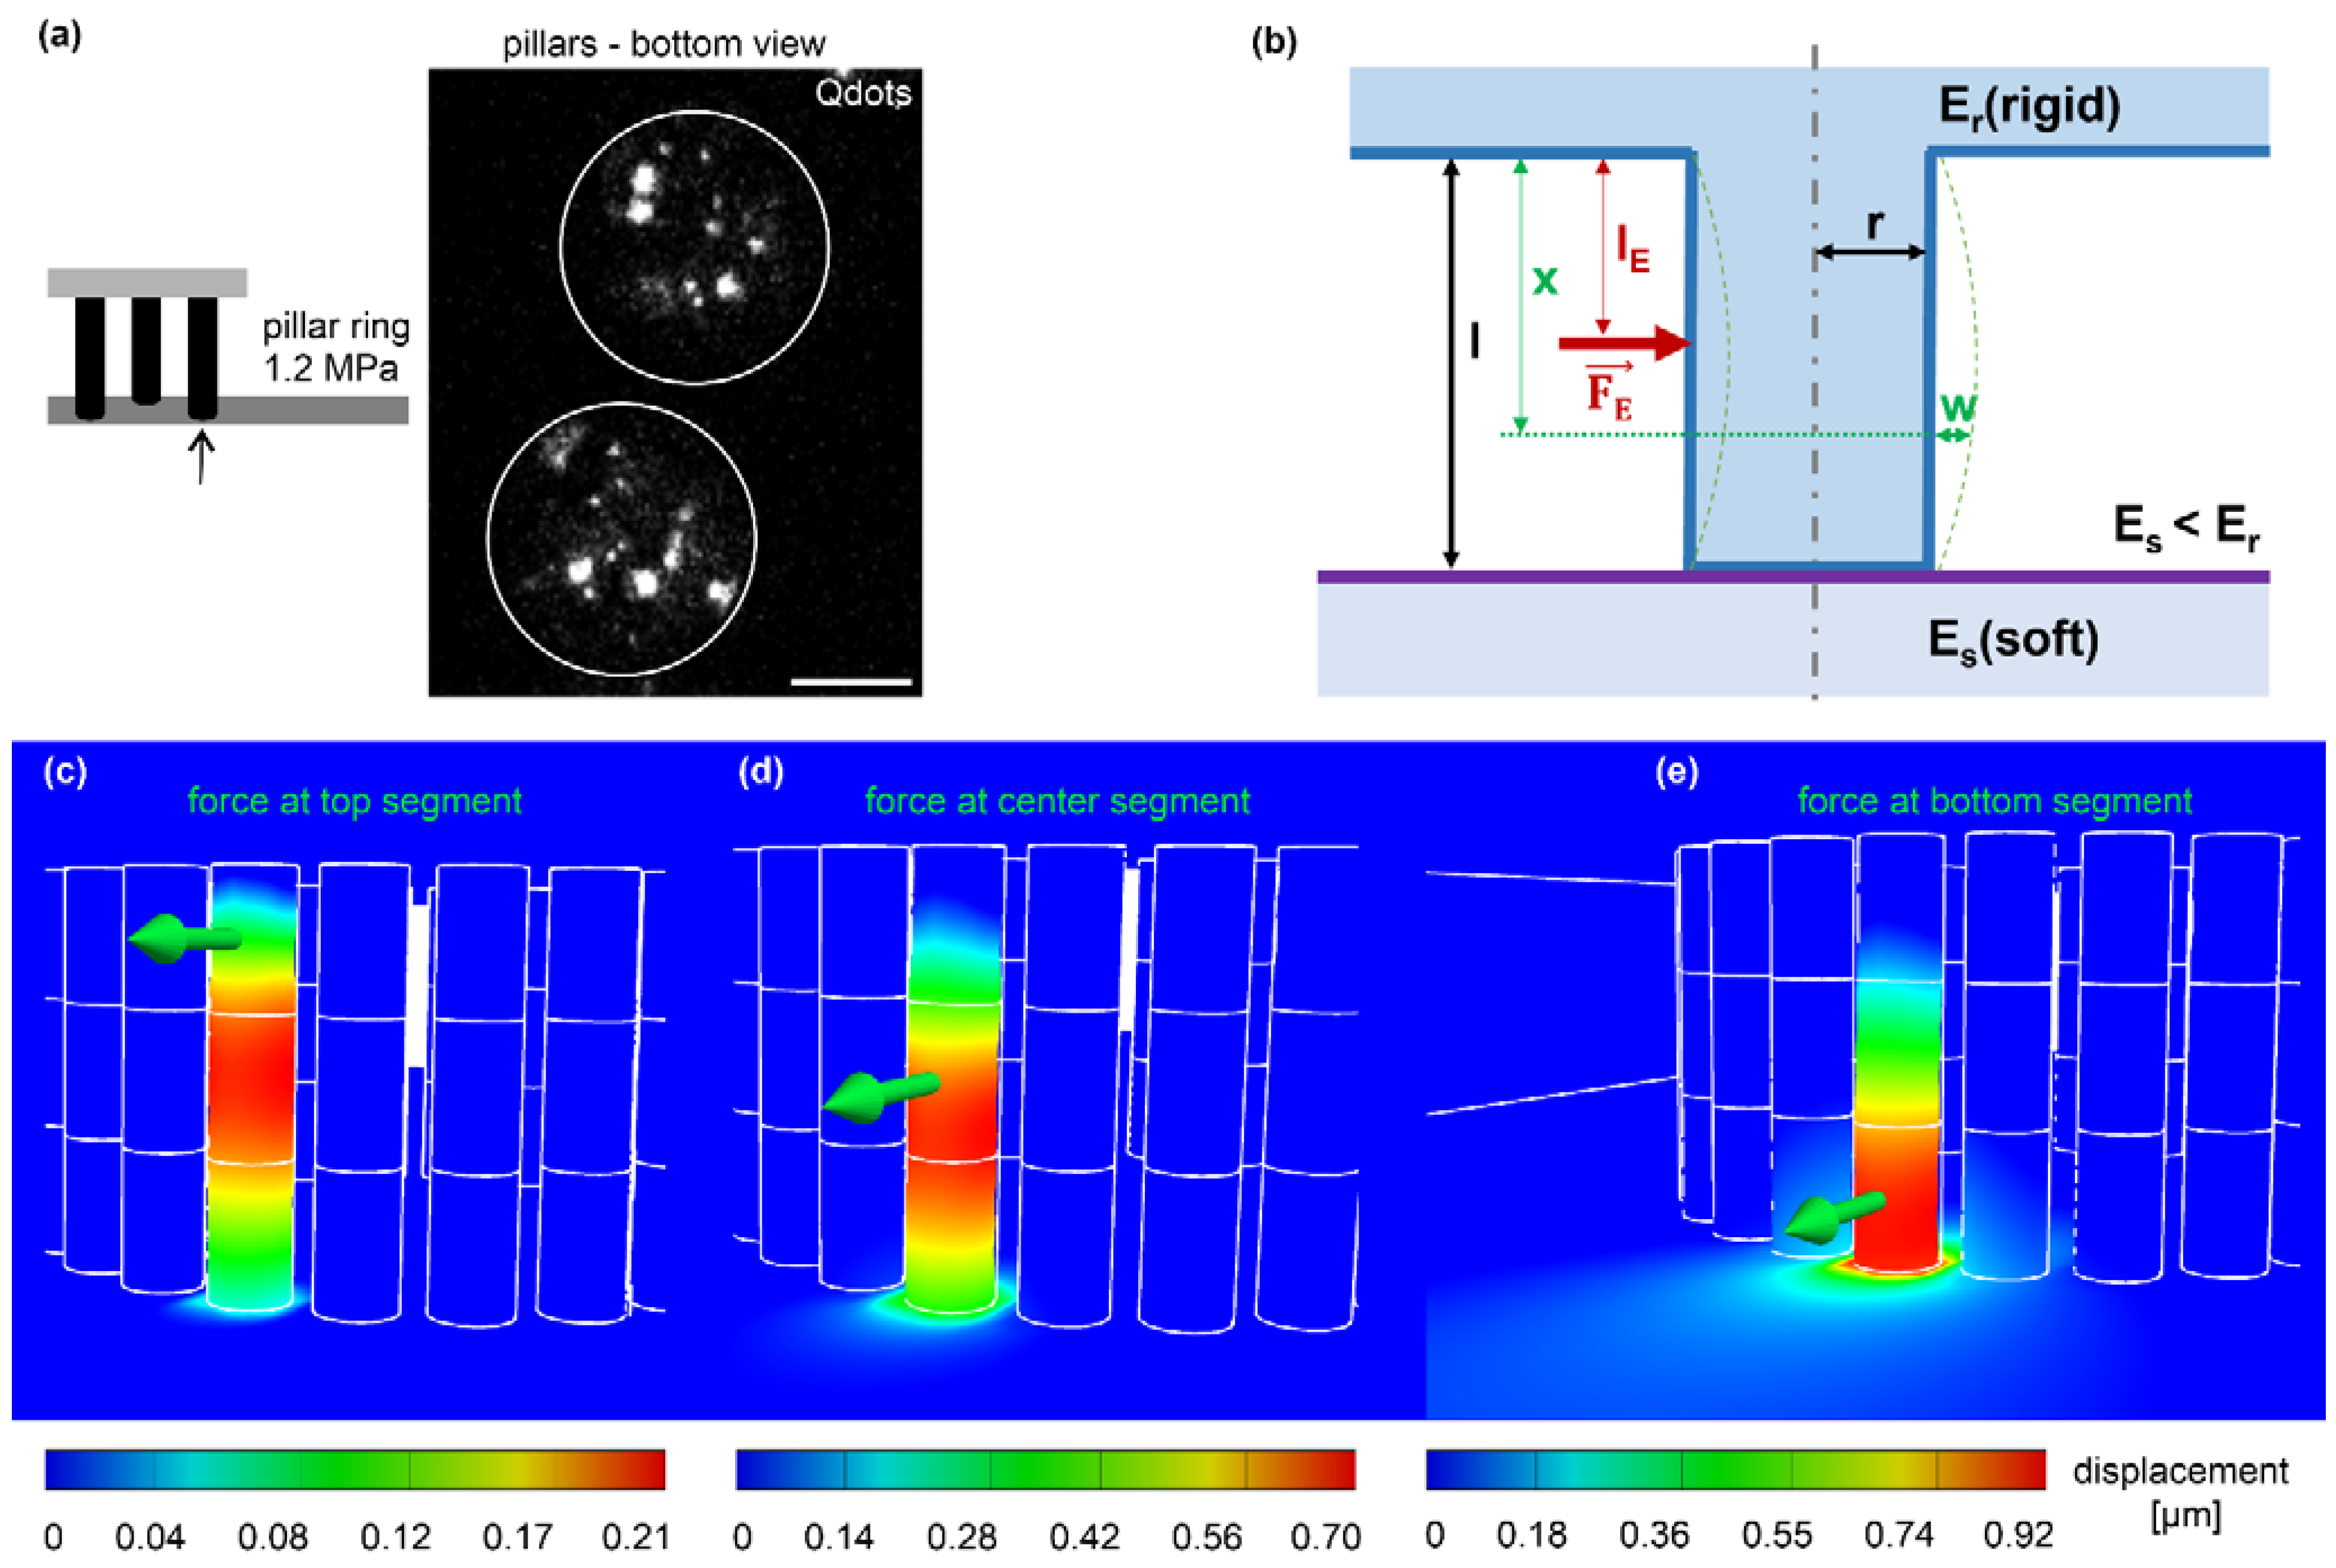
3.4. Calculation of Cell-Derived Traction Force from Pillar Displacement
3.5. Quantification of Static and Dynamic Single-Cell Forces
3.6. Quantification of Epithelial Microtissue Forces
4. Discussion
5. Conclusions
Supplementary Materials
Author Contributions
Funding
Institutional Review Board Statement
Informed Consent Statement
Data Availability Statement
Acknowledgments
Conflicts of Interest
References
- Butcher, D.T.; Alliston, T.; Weaver, V.M. A tense situation: Forcing tumour progression. Nat. Cancer 2009, 9, 108–122. [Google Scholar] [CrossRef]
- McBeath, R.; Pirone, D.M.; Nelson, C.M.; Bhadriraju, K.; Chen, C.S. Cell Shape, Cytoskeletal Tension, and RhoA Regulate Stem Cell Lineage Commitment. Dev. Cell 2004, 6, 483–495. [Google Scholar] [CrossRef]
- Kilian, K.A.; Bugarija, B.; Lahn, B.T.; Mrksich, M. Geometric cues for directing the differentiation of mesenchymal stem cells. Proc. Natl. Acad. Sci. USA 2010, 107, 4872–4877. [Google Scholar] [CrossRef] [PubMed]
- Rosowski, K.A.; Mertz, A.F.; Norcross, S.; Dufresne, E.R.; Horsley, V. Edges of human embryonic stem cell colonies display distinct mechanical properties and differentiation potential. Sci. Rep. 2015, 5, srep14218. [Google Scholar] [CrossRef] [PubMed]
- Gjorevski, N.; Nelson, C.M. Mapping of Mechanical Strains and Stresses around Quiescent Engineered Three-Dimensional Epithelial Tissues. Biophys. J. 2012, 103, 152–162. [Google Scholar] [CrossRef]
- Nelson, C.M.; Jean, R.P.; Tan, J.L.; Liu, W.F.; Sniadecki, N.J.; Spector, A.A.; Chen, C.S. Emergent patterns of growth controlled by multicellular form and mechanics. Proc. Natl. Acad. Sci. USA 2005, 102, 11594–11599. [Google Scholar] [CrossRef]
- Gomez, E.W.; Chen, Q.K.; Gjorevski, N.; Nelson, C.M. Tissue geometry patterns epithelial-mesenchymal transition via intercellular mechanotransduction. J. Cell. Biochem. 2010, 110, 44–51. [Google Scholar] [CrossRef] [PubMed]
- Inman, J.L.; Robertson, C.; Mott, J.D.; Bissell, M.J. Mammary gland development: Cell fate specification, stem cells and the microenvironment. Development 2015, 142, 1028–1042. [Google Scholar] [CrossRef] [PubMed]
- Saez, A.; Ghibaudo, M.; Buguin, A.; Silberzan, P.; Ladoux, B. Rigidity-driven growth and migration of epithelial cells on microstructured anisotropic substrates. Proc. Natl. Acad. Sci. USA 2007, 104, 8281–8286. [Google Scholar] [CrossRef]
- Ghibaudo, M.; Trichet, L.; Le Digabel, J.; Richert, A.; Hersen, P.; Ladoux, B. Substrate Topography Induces a Crossover from 2D to 3D Behavior in Fibroblast Migration. Biophys. J. 2009, 97, 357–368. [Google Scholar] [CrossRef] [PubMed]
- Théry, M.; Pépin, A.; Dressaire, E.; Chen, Y.; Bornens, M. Cell distribution of stress fibres in response to the geometry of the adhesive environment. Cell Motil. Cytoskelet. 2006, 63, 341–355. [Google Scholar] [CrossRef]
- Geiger, B.; Bershadsky, A.; Pankov, R.; Yamada, K.M. Transmembrane crosstalk between the extracellular matrix–cytoskeleton crosstalk. Nat. Rev. Mol. Cell Biol. 2001, 2, 793–805. [Google Scholar] [CrossRef] [PubMed]
- Geiger, B.; Spatz, J.P.; Bershadsky, A.D. Environmental sensing through focal adhesions. Nat. Rev. Mol. Cell Biol. 2009, 10, 21–33. [Google Scholar] [CrossRef]
- Cai, Y.; Rossier, O.; Gauthier, N.C.; Biais, N.; Fardin, M.-A.; Zhang, X.; Miller, L.W.; Ladoux, B.; Cornish, V.W.; Sheetz, M.P. Cytoskeletal coherence requires myosin-IIA contractility. J. Cell Sci. 2010, 123, 413–423. [Google Scholar] [CrossRef] [PubMed]
- Hu, S.; Chen, J.; Fabry, B.; Numaguchi, Y.; Gouldstone, A.; Ingber, D.E.; Fredberg, J.J.; Butler, J.P.; Wang, N. Intracellular stress tomography reveals stress focusing and structural anisotropy in cytoskeleton of living cells. Am. J. Physiol. Physiol. 2003, 285, C1082–C1090. [Google Scholar] [CrossRef] [PubMed]
- Vasquez, C.G.; Martin, A.C. Force transmission in epithelial tissues. Dev. Dyn. 2016, 245, 361–371. [Google Scholar] [CrossRef]
- Chen, C.S.; Mrksich, M.; Huang, S.; Whitesides, G.M.; Ingber, D.E. Geometric Control of Cell Life and Death. Science 1997, 276, 1425–1428. [Google Scholar] [CrossRef]
- Yu, S.-M.; Li, B.; Granick, S.; Cho, Y.-K. Mechanical Adaptations of Epithelial Cells on Various Protruded Convex Geometries. Cells 2020, 9, 1434. [Google Scholar] [CrossRef]
- Bao, M.; Xie, J.; Piruska, A.; Huck, W.T.S. 3D microniches reveal the importance of cell size and shape. Nat. Commun. 2017, 8, 1962. [Google Scholar] [CrossRef]
- Dembo, M.; Wang, Y.-L. Stresses at the Cell-to-Substrate Interface during Locomotion of Fibroblasts. Biophys. J. 1999, 76, 2307–2316. [Google Scholar] [CrossRef]
- Merkel, R.; Kirchgeßner, N.; Cesa, C.M.; Hoffmann, B. Cell Force Microscopy on Elastic Layers of Finite Thickness. Biophys. J. 2007, 93, 3314–3323. [Google Scholar] [CrossRef]
- Butler, J.P.; Tolić-Nørrelykke, I.M.; Fabry, B.; Fredberg, J.J. Traction fields, moments, and strain energy that cells exert on their surroundings. Am. J. Physiol. Physiol. 2002, 282, C595–C605. [Google Scholar] [CrossRef]
- Angelini, T.E.; Hannezo, E.; Trepat, X.; Fredberg, J.J.; Weitz, D.A. Cell Migration Driven by Cooperative Substrate Deformation Patterns. Phys. Rev. Lett. 2010, 104, 168104. [Google Scholar] [CrossRef] [PubMed]
- Trepat, X.; Wasserman, M.R.; Angelini, T.E.; Millet, E.; Weitz, D.A.; Butler, J.P.; Fredberg, J.J. Physical forces during collective cell migration. Nat. Phys. 2009, 5, 426–430. [Google Scholar] [CrossRef]
- Tambe, D.T.; Hardin, C.C.; Angelini, T.E.; Rajendran, K.; Park, C.Y.; Serra-Picamal, X.; Zhou, E.H.; Zaman, M.H.; Butler, J.P.; Weitz, D.A.; et al. Collective cell guidance by cooperative intercellular forces. Nat. Mater. 2011, 10, 469–475. [Google Scholar] [CrossRef]
- Tan, J.L.; Tien, J.; Pirone, D.M.; Gray, D.S.; Bhadriraju, K.; Chen, C.S. Cells lying on a bed of microneedles: An approach to isolate mechanical force. Proc. Natl. Acad. Sci. USA 2003, 100, 1484–1489. [Google Scholar] [CrossRef]
- du Roure, O.; Saez, A.; Buguin, A.; Austin, R.H.; Chavrier, P.; Silberzan, P.; Ladoux, B. Force mapping in epithelial cell migration. Proc. Natl. Acad. Sci. USA 2005, 102, 2390. [Google Scholar] [CrossRef] [PubMed]
- Ghassemi, S.; Meacci, G.; Liu, S.; Gondarenko, A.A.; Mathur, A.; Roca-Cusachs, P.; Sheetz, M.P.; Hone, J. Cells test substrate rigidity by local contractions on submicrometer pillars. Proc. Natl. Acad. Sci. USA 2012, 109, 5328–5333. [Google Scholar] [CrossRef] [PubMed]
- Serrano, R.; Aung, A.; Yeh, Y.-T.; Varghese, S.; Lasheras, J.C.; del Álamo, J.C. Three-Dimensional Monolayer Stress Microscopy. Biophys. J. 2019, 117, 111–128. [Google Scholar] [CrossRef] [PubMed]
- Legant, W.R.; Miller, J.; Blakely, B.L.; Cohen, D.; Genin, G.M.; Chen, C. Measurement of mechanical tractions exerted by cells in three-dimensional matrices. Nat. Methods 2010, 7, 969–971. [Google Scholar] [CrossRef]
- Hall, M.S.; Alisafaei, F.; Ban, E.; Feng, X.; Hui, C.-Y.; Shenoy, V.B.; Wu, M. Fibrous nonlinear elasticity enables positive mechanical feedback between cells and ECMs. Proc. Natl. Acad. Sci. USA 2016, 113, 14043–14048. [Google Scholar] [CrossRef] [PubMed]
- Mark, C.; Grundy, T.J.; Strissel, P.L.; Böhringer, D.; Grummel, N.; Gerum, R.; Steinwachs, J.; Hack, C.C.; Beckmann, M.W.; Eckstein, M.; et al. Collective forces of tumor spheroids in three-dimensional biopolymer networks. Elife 2020, 9, e51912. [Google Scholar] [CrossRef] [PubMed]
- Ulbricht, A.; Eppler, F.J.; Tapia, V.E.; van der Ven, P.F.; Hampe, N.; Hersch, N.; Vakeel, P.; Stadel, D.; Haas, A.; Saftig, P.; et al. Cellular Mechanotransduction Relies on Tension-Induced and Chaperone-Assisted Autophagy. Curr. Biol. 2013, 23, 430–435. [Google Scholar] [CrossRef]
- Eschenbruch, J.; Dreissen, G.; Springer, R.; Konrad, J.; Merkel, R.; Hoffmann, B.; Noetzel, E. From Microspikes to Stress Fibers: Actin Remodeling in Breast Acini Drives Myosin II-Mediated Basement Membrane Invasion. Cells 2021, 10, 1979. [Google Scholar] [CrossRef]
- Hersch, N.; Wolters, B.; Dreissen, G.; Springer, R.; Kirchgeßner, N.; Merkel, R.; Hoffmann, B. The constant beat: Cardiomyocytes adapt their forces by equal contraction upon environmental stiffening. Biol. Open 2013, 2, 351–361. [Google Scholar] [CrossRef]
- Ahrens, D.; Rubner, W.; Springer, R.; Hampe, N.; Gehlen, J.; Magin, T.M.; Hoffmann, B.; Merkel, R. A Combined AFM and Lateral Stretch Device Enables Microindentation Analyses of Living Cells at High Strains. Methods Protoc. 2019, 2, 43. [Google Scholar] [CrossRef] [PubMed]
- Houben, S.; Kirchgeßner, N.; Merkel, R. Estimating force fields of living cells—Comparison of several regularization schemes combined with automatic parameter choice. In Proceedings of the DAGM Symposium, Darmstadt, Germany, 22–24 September 2010; Lecture Notes in Computer Sciences 6376. Springer: Berlin/Heidelberg, Germany, 2010. [Google Scholar]
- Boussinesq, J. Application Des Potentiels à L’étude de L’équilibre et du Mouvement des Solides Élastiques; Gauthier-Villars: Paris, France, 1885. [Google Scholar]
- Landau, L.D.; Lifshitz, E.M. Course of Theoretical Physics. In VII Theory of Elasticity; Pergamon Press: Oxford, UK, 1986. [Google Scholar]
- Maloney, J.M.; Walton, E.B.; Bruce, C.M.; Van Vliet, K.J. Influence of finite thickness and stiffness on cellular adhesion-induced deformation of compliant substrata. Phys. Rev. E 2008, 78, 041923. [Google Scholar] [CrossRef]
- Cesa, C.M.; Kirchgessner, N.; Mayer, D.; Schwarz, U.S.; Hoffmann, B.; Merkel, R. Micropatterned silicon elastomer for high resolution analysis of cell force patterns. Rev. Sci. Instrum. 2007, 78, 034301. [Google Scholar] [CrossRef]
- Kajzar, A.; Cesa, C.; Kirchgeßner, N.; Hoffmann, B.; Merkel, R. Toward Physiological Conditions for Cell Analyses: Forces of Heart Muscle Cells Suspended Between Elastic Micropillars. Biophys. J. 2008, 94, 1854–1866. [Google Scholar] [CrossRef]
- Timoshenko, S.P.; Goodier, J.N. Theory of Elasticity; Mc Graw Hill: Auckland, NZ, USA, 1970. [Google Scholar]
- Boukamp, P.; Petrussevska, R.T.; Breitkreutz, D.; Hornung, J.; Markham, A.; Fusenig, N.E. Normal Keratinization in a Spontaneously Immortalized Aneuploid Human Keratinocyte Cell Line. J. Cell Biol. 1988, 106, 761–771. [Google Scholar] [CrossRef]
- Soule, H.D.; Maloney, T.M.; Wolman, S.R.; Peterson, W.D., Jr.; Brenz, R.; McGrath, C.M.; Russo, J.; Pauley, R.J.; Jones, R.F.; Brooks, S.C. Isolation and characterization of a spontaneously immortalized human breast epithelial cell line, MCF-10. Cancer Res. 1990, 50, 6075–6086. [Google Scholar] [PubMed]
- Soule, H.D.; Vazquez, J.; Long, A.; Albert, S.; Brennan, M. A Human Cell Line From a Pleural Effusion Derived From a Breast Carcinoma 2. Gynecol. Oncol. 1973, 51, 1409–1416. [Google Scholar] [CrossRef] [PubMed]
- Brinkley, B.R.; Beall, P.T.; Wible, L.J.; Mace, M.L.; Turner, D.S.; Cailleau, R.M. Variations in Cell Form and Cytoskeleton in Human Breast Carcinoma Cells in vitro. Cancer Res. 1980, 40, 3118–3129. [Google Scholar] [PubMed]
- Piruska, A.; Nikcevic, I.; Lee, S.H.; Ahn, C.; Heineman, W.R.; Limbach, P.A.; Seliskar, C.J. The autofluorescence of plastic materials and chips measured under laser irradiation. Lab A Chip 2005, 5, 1348–1354. [Google Scholar] [CrossRef] [PubMed]
- Kenny, P.A.; Lee, G.Y.; Myers, C.A.; Neve, R.M.; Semeiks, J.R.; Spellman, P.T.; Lorenz, K.; Lee, E.H.; Barcellos-Hoff, M.H.; Petersen, O.W.; et al. The morphologies of breast cancer cell lines in three-dimensional assays correlate with their profiles of gene expression. Mol. Oncol. 2007, 1, 84–96. [Google Scholar] [CrossRef] [PubMed]
- Aoun, L.; Larnier, S.; Weiss, P.; Cazales, M.; Herbulot, A.; Ducommun, B.; Vieu, C.; Lobjois, V. Measure and characterization of the forces exerted by growing multicellular spheroids using microdevice arrays. PLoS ONE 2019, 14, e0217227. [Google Scholar] [CrossRef]
- Wormer, D.B.; Davis, K.A.; Henderson, J.; Turner, C.E. The Focal Adhesion-Localized CdGAP Regulates Matrix Rigidity Sensing and Durotaxis. PLoS ONE 2014, 9, e91815. [Google Scholar] [CrossRef]
- DuChez, B.J.; Doyle, A.D.; Dimitriadis, E.K.; Yamada, K.M. Durotaxis by Human Cancer Cells. Biophys. J. 2019, 116, 670–683. [Google Scholar] [CrossRef]
- Klein, F.; Striebel, T.; Fischer, J.; Jiang, Z.; Franz, C.M.; von Freymann, G.; Wegener, M.; Bastmeyer, M. Elastic Fully Three-dimensional Microstructure Scaffolds for Cell Force Measurements. Adv. Mater. 2010, 22, 868–871. [Google Scholar] [CrossRef]
- Kraning-Rush, C.M.; Califano, J.P.; Reinhart-King, C. Cellular Traction Stresses Increase with Increasing Metastatic Potential. PLoS ONE 2012, 7, e32572. [Google Scholar] [CrossRef]
- Chrzanowska-Wodnicka, M.; Burridge, K. Rho-stimulated contractility drives the formation of stress fibers and focal adhesions. J. Cell Biol. 1996, 133, 1403–1415. [Google Scholar] [CrossRef] [PubMed]
- Discher, D.E.; Janmey, P.; Wang, Y.-L. Tissue Cells Feel and Respond to the Stiffness of Their Substrate. Science 2005, 310, 1139–1143. [Google Scholar] [CrossRef] [PubMed]
- Gupta, M.; Sarangi, B.R.; Deschamps, J.; Nematbakhsh, Y.; Callan-Jones, A.; Margadant, F.; Mège, R.-M.; Lim, C.T.; Voituriez, R.; Ladoux, B. Adaptive rheology and ordering of cell cytoskeleton govern matrix rigidity sensing. Nat. Commun. 2015, 6, 7525. [Google Scholar] [CrossRef] [PubMed]
- Weinmuellner, R.; Kryeziu, K.; Zbiral, B.; Tav, K.; Schoenhacker-Alte, B.; Groza, D.; Wimmer, L.; Schosserer, M.; Nagelreiter, F.; Rösinger, S.; et al. Long-term exposure of immortalized keratinocytes to arsenic induces EMT, impairs differentiation in organotypic skin models and mimics aspects of human skin derangements. Arch. Toxicol. 2017, 92, 181–194. [Google Scholar] [CrossRef] [PubMed]
- Maas-Szabowski, N.; Stärker, A.; Fusenig, N.E. Epidermal tissue regeneration and stromal interaction in HaCaT cells is initiated by TGF-α. J. Cell Sci. 2003, 116, 2937–2948. [Google Scholar] [CrossRef] [PubMed]
- Debnath, J.; Muthuswamy, S.K.; Brugge, J.S. Morphogenesis and oncogenesis of MCF-10A mammary epithelial acini grown in three-dimensional basement membrane cultures. Methods 2003, 30, 256–268. [Google Scholar] [CrossRef] [PubMed]
- Gaiko-Shcherbak, A.; Fabris, G.; Dreissen, G.; Merkel, R.; Hoffmann, B.; Noetzel, E. The Acinar Cage: Basement Membranes Determine Molecule Exchange and Mechanical Stability of Human Breast Cell Acini. PLoS ONE 2015, 10, e0145174. [Google Scholar] [CrossRef]
- Lemmon, C.A.; Sniadecki, N.J.; Ruiz, S.A.; Tan, J.L.; Romer, L.H.; Chen, C.S. Shear force at the cell-matrix interface: Enhanced analysis for microfabricated post array detectors. Mech. Chem. Biosyst. MCB 2005, 2, 1. [Google Scholar]
- Ridley, A.J.; Hall, A. The small GTP-binding protein rho regulates the assembly of focal adhesions and actin stress fibers in response to growth factors. Cell 1992, 70, 389–399. [Google Scholar] [CrossRef]
- Gaiko-Shcherbak, A.; Eschenbruch, J.; Kronenberg, N.M.; Teske, M.; Wolters, B.; Springer, R.; Gather, M.C.; Merkel, R.; Hoffmann, B.; Noetzel, E. Cell Force-Driven Basement Membrane Disruption Fuels EGF- and Stiffness-Induced Invasive Cell Dissemination from Benign Breast Gland Acini. Int. J. Mol. Sci. 2021, 22, 3962. [Google Scholar] [CrossRef]
- John, J.; Quinlan, A.T.; Silvestri, C.; Billiar, K.L. Boundary Stiffness Regulates Fibroblast Behavior in Collagen Gels. Ann. Biomed. Eng. 2009, 38, 658–673. [Google Scholar] [CrossRef] [PubMed]
- Legant, W.R.; Pathak, A.; Yang, M.T.; Deshpande, V.S.; McMeeking, R.M.; Chen, C.S. Microfabricated tissue gauges to measure and manipulate forces from 3D microtissues. Proc. Natl. Acad. Sci. USA 2009, 106, 10097–10102. [Google Scholar] [CrossRef]
- Chugh, P.; Clark, A.G.; Smith, M.B.; Cassani, D.A.D.; Dierkes, K.; Ragab, A.; Roux, P.P.; Charras, G.; Salbreux, G.; Paluch, E. Actin cortex architecture regulates cell surface tension. Nature 2017, 19, 689–697. [Google Scholar] [CrossRef]
- Vignaud, T.; Copos, C.; Leterrier, C.; Toro-Nahuelpan, M.; Tseng, Q.; Mahamid, J.; Blanchoin, L.; Mogilner, A.; Théry, M.; Kurzawa, L. Stress fibres are embedded in a contractile cortical network. Nat. Mater. 2020, 20, 410–420. [Google Scholar] [CrossRef] [PubMed]
- Eyckmans, J.; Chen, C.S. 3D culture models of tissues under tension. J. Cell Sci. 2016, 130, 63–70. [Google Scholar] [CrossRef] [PubMed]


Disclaimer/Publisher’s Note: The statements, opinions and data contained in all publications are solely those of the individual author(s) and contributor(s) and not of MDPI and/or the editor(s). MDPI and/or the editor(s) disclaim responsibility for any injury to people or property resulting from any ideas, methods, instructions or products referred to in the content. |
© 2023 by the authors. Licensee MDPI, Basel, Switzerland. This article is an open access article distributed under the terms and conditions of the Creative Commons Attribution (CC BY) license (https://creativecommons.org/licenses/by/4.0/).
Share and Cite
Esser, L.; Springer, R.; Dreissen, G.; Lövenich, L.; Konrad, J.; Hampe, N.; Merkel, R.; Hoffmann, B.; Noetzel, E. Elastomeric Pillar Cages Modulate Actomyosin Contractility of Epithelial Microtissues by Substrate Stiffness and Topography. Cells 2023, 12, 1256. https://doi.org/10.3390/cells12091256
Esser L, Springer R, Dreissen G, Lövenich L, Konrad J, Hampe N, Merkel R, Hoffmann B, Noetzel E. Elastomeric Pillar Cages Modulate Actomyosin Contractility of Epithelial Microtissues by Substrate Stiffness and Topography. Cells. 2023; 12(9):1256. https://doi.org/10.3390/cells12091256
Chicago/Turabian StyleEsser, Lisann, Ronald Springer, Georg Dreissen, Lukas Lövenich, Jens Konrad, Nico Hampe, Rudolf Merkel, Bernd Hoffmann, and Erik Noetzel. 2023. "Elastomeric Pillar Cages Modulate Actomyosin Contractility of Epithelial Microtissues by Substrate Stiffness and Topography" Cells 12, no. 9: 1256. https://doi.org/10.3390/cells12091256