Article

AMCSMMA: Predicting Small Molecule–miRNA Potential Associations Based on Accurate Matrix Completion

1
College of Computer Science and Technology, Qingdao Institute of Software, China University of Petroleum, Qingdao 266580, China
2
College of Mathematics and Systems Science, Shandong University of Science and Technology, Qingdao 266580, China
*
Authors to whom correspondence should be addressed.
Cells 2023, 12(8), 1123; https://doi.org/10.3390/cells12081123
Submission received: 8 February 2023 / Revised: 2 April 2023 / Accepted: 4 April 2023 / Published: 10 April 2023
(This article belongs to the Special Issue Research Advances in Cell Methods)

Abstract

:
Exploring potential associations between small molecule drugs (SMs) and microRNAs (miRNAs) is significant for drug development and disease treatment. Since biological experiments are expensive and time-consuming, we propose a computational model based on accurate matrix completion for predicting potential SM–miRNA associations (AMCSMMA). Initially, a heterogeneous SM–miRNA network is constructed, and its adjacency matrix is taken as the target matrix. An optimization framework is then proposed to recover the target matrix with the missing values by minimizing its truncated nuclear norm, an accurate, robust, and efficient approximation to the rank function. Finally, we design an effective two-step iterative algorithm to solve the optimization problem and obtain the prediction scores. After determining the optimal parameters, we conduct four kinds of cross-validation experiments based on two datasets, and the results demonstrate that AMCSMMA is superior to the state-of-the-art methods. In addition, we implement another validation experiment, in which more evaluation metrics in addition to the AUC are introduced and finally achieve great results. In two types of case studies, a large number of SM–miRNA pairs with high predictive scores are confirmed by the published experimental literature. In summary, AMCSMMA has superior performance in predicting potential SM–miRNA associations, which can provide guidance for biological experiments and accelerate the discovery of new SM–miRNA associations.

1. Introduction

MicroRNAs (miRNAs) are a class of single-stranded noncoding RNA molecules containing 17–24 nucleotides [1,2,3]. The first miRNA, lin-4, and the first mammalian miRNA, let-7, were found in the 1990s [4,5]. With these two significant discoveries, a wave of genomic research took place, resulting in the discovery of a large number of miRNAs in many organisms [6,7]. At the same time, it has become increasingly evident to researchers that miRNAs are involved in complex and diverse life processes. Specifically, miRNAs can bind to complementary target mRNAs, resulting in mRNA translational inhibition or degradation, which means that miRNAs have a significant impact on cell differentiation, proliferation, and apoptosis [1]. In addition, miRNAs play essential roles in various cellular activities, including immune responses and neurotransmitter synthesis [8,9]. More significantly, miRNAs participate in tumorigenesis and host–pathogen interactions [10,11,12,13]. For instance, Liu et al. [14] identified that the abnormal expression of miR-181c is involved in the pathogenesis of glioblastoma. Therefore, restoring the expression level of miR-181c in glioblastoma cancer cells can effectively treat the disease, which also provides new insight for the clinical treatment of many refractory diseases, including cancer.
Indeed, as a low-molecular-weight compound, small molecule (SM) drugs have been demonstrated to target dysregulated miRNAs and modulate their expression [15,16,17]. For instance, SPC3649, the first miRNA-targeted drug administered in human clinical trials, successfully inhibits the expression of miR-122, which is required for hepatitis C virus replication [18]. Consequently, utilizing miRNAs as diagnostic and therapeutic targets has become a promising pathway in drug development and disease treatment. Since developing new SMs is time-consuming and expensive, it is extremely difficult to develop specific SMs for each dysregulated miRNA. Therefore, researchers can look into utilizing existing SMs to target and modulate a wider variety of miRNAs [19]. Furthermore, determining the potential associations between the known SMs and miRNAs through biological experiments is of great significance and urgency.
Given the abundance of existing SMs and miRNAs, it is critical to pre-screen out SM–miRNA samples with high association probabilities for complex and expensive biological experiments. The proposed predictive approaches may be divided into network inference-based models and matrix-completion-based models. For the first kind of model, Guan et al. [20] proposed a model called Graphlet Interaction-based Inference for Small Molecule–miRNA Association Prediction (GISMMA). Based on the integrated SM/miRNA similarity (the widely used SM/miRNA similarities include the side-effect-based SM similarity, the chemical-structure-based SM similarity, the functional consistency-based SM similarity, the indication phenotype-based SM similarity, the gene functional consistency-based miRNA similarity, and the disease-phenotype-based miRNA similarity), they first constructed the SM/miRNA similarity network. Then, a specific SM–miRNA association score was calculated by counting the number of graphlet interactions throughout the SM/miRNA similarity network. Furthermore, Li et al. [21] developed the Small Molecule–miRNA Network-Based Inference (SMiR-NBI) predictive model. In a constructed SM–miRNA heterogeneous network, a given SM node evenly distributes the obtained initial resources to the miRNA nodes regulated by it. Following this, these miRNA nodes immediately distribute the obtained resources to the SM nodes adjacent to them. As the resources are continuously propagated through the network, the resource allocation of all nodes eventually stabilizes. The final resource fraction of the miRNA nodes reflects the possibility of being regulated by the given SM. Notably, the model is incapable of predicting miRNAs or SMs that are potentially associated with new SMs or miRNAs. Additionally, Qu et al. [22] proposed the Triple Layer Heterogeneous Network-based Small Molecule–miRNA Association (TLHNSMMA) predictive model. They first constructed an SM–miRNA-disease triple layer heterogeneous network.  An iterative update algorithm was then applied to obtain the association scores of all SM–miRNA pairs. Benefiting from the introduction of additional information, the model demonstrated excellent prediction accuracy. However, it is likewise not applicable to predict miRNAs or SMs that are potentially associated with new SMs or miRNAs. In view of the unreliability of all the aforementioned methods due to the presence of noise data, Yin et al. [23] developed a new computational method called Sparse Learning and Heterogeneous Graph Inference for Small Molecule–miRNA Associations (SLHGISMMA) prediction. They first decomposed the SM–miRNA association matrix into two parts, in which the first part is a linear combination of the original association matrix and a low-rank matrix, and the second part is a sparse noise matrix. After eliminating the noise matrix, they integrated the SM/miRNA similarity information and the information in the reacquired association matrix into a heterogeneous graph. Finally, the association scores were obtained by implementing a heterogeneous graph inference algorithm. The drawback of SLHGISMMA is that it cannot restrict the prediction scores in [0, 1], which reduces the interpretability and accuracy of the association scores.
Additionally, several matrix-completion-based heuristic algorithms are likewise applied in predicting potential SM–miRNA associations. Inspired by the traditional CMF [24] method, Wang et al. [25] developed a model called Dual-Network Collaborative Matrix Factorization (DCMF) for predicting small molecule–miRNA associations. They first preprocessed the SM–miRNA association matrix utilizing the Weighted K-Nearest Known Neighbors (WKNKN) method. In addition to the Tikhonov regularization term, they incorporated two new regularization terms in the optimization framework of the traditional matrix factorization model. After solving the optimization problem, they calculated the matmul product of the two low-rank feature matrices as the completed matrix, and the completed values were considered as the association scores. Moreover, a model named Predicting Potential Small Molecule–miRNA Associations based on Bounded Nuclear Norm Regularization (BNNRSMMA) was developed by Chen et al. [26]. They recovered the target matrix with the missing values by minimizing its nuclear norm. Although BNNRSMMA restricts the completed value in [0, 1], it may obtain a highly biased solution as the nuclear norm may not be the optimal convex approximation to the rank function, and the prediction accuracy cannot be guaranteed. Considering that the rank of the result matrix is non-adjustable, this decreases the adaptability of BNNRSMMA on different datasets. The main innovative points and limitations of the above models are shown in Table 1.
Considering that the previous models have some limitations, we develop a more accurate predictive model called AMCSMMA, which overcomes the insufficiencies listed in Table 1, and its framework is shown in Figure 1. In Validation Experiment A, the AUC scores achieve the best results with values ranging from 0.9974 to 0.9981 when parameter r 13 , and we finally set r { 1 , 2 , 3 } to reduce the computational complexity. Additionally, we design Validation Experiment B in which the values of the AUC, Precision, Recall, F1 Score, Accuracy, and MCC are all above 0.97. Moreover, we conduct four types of cross-validation (CV) experiments based on Dataset 1 (Dataset 2). As a result, the AUC values of AMCSMMA are 0.9910 ± 0.0004 (0.8768 ± 0.0039), 0.9923 (0.8861), 0.9898 (0.8880), and 0.8222 (0.7232) under five-fold CV, Global Leave-One-Out CV (LOOCV), miRNA-Fixed Local LOOCV, and SM-Fixed Local LOOCV, respectively, which are a significant improvement compared with previous models. In the first type of case study, 9 (33) among the top 20 (100) associations predicted by AMCSMMA are confirmed by the published experimental literature. In the second type of case study to the SMs 5-FU and 5-Aza-2’-deoxycytidine, 20 (34) and 16 (26) among the top 20 (50) associations are, respectively, verified by published references. In conclusion, AMCSMMA demonstrates superior accuracy and reliability in predicting potential SM–miRNA associations. It can be used for screening SM–miRNA samples with high association probabilities for complex biological experiments, thus significantly reducing the time and financial cost of discovering new SM–miRNA associations. This paper’s significant contributions are summarized as follows:
  • We integrate a variety of SM/miRNA similarities and consider the adjacency matrix of the constructed SM–miRNA heterogeneous network as the target matrix, which can not only effectively utilize the integrated similarity to improve the prediction accuracy but also enhance its information content as the iteration progresses.
  • We utilize the truncated nuclear norm regularization as the strategy to approximate the rank function, which not only achieves the rank minimization more accurately, robustly, and efficiently but also increases the adaptability to different datasets.
  • We design an effective two-step iterative scheme to solve the optimization problem. In order to solve the convex sub-problem in the second step, we introduce the Alternating Directional Multiplier Method (ADMM).

2. Materials and Methods

2.1. SM–miRNA Associations

In this study, we obtained 664 known SM–miRNA associations from the SM2miR v1.0 [27] database. Then, we collected 831 SMs from the SM2miR v1.0 [27], PubChem [28], and DrugBank [29] databases, as well as 541 human-related miRNAs from the HMDD [30], miR2Disease [31], PhenomiR [32], and SM2miR v1.0 [27] databases. The first dataset (Dataset 1) was constructed from all the data described above, which contained 831 SMs, 541 miRNAs, and 664 confirmed SM–miRNA associations.
The second dataset (Dataset 2) was then constructed by removing SMs and miRNAs without confirmed associations in Dataset 1. It contained 39 SMs, 286 miRNAs, and 664 identical known associations as Dataset 1. Moreover, we constructed a novel independent dataset (Dataset 3) that contained the identical 831 SMs and 541 miRNAs as Dataset 1 but with 132 additional known associations collected from the latest experimental literature (the complete information can be found on our Github page or Supplementary File).
To represent associations between SMs and miRNAs more directly, we constructed an association matrix M R n s × n m in each dataset, where ns and nm, respectively, represent the number of SMs and miRNAs in the dataset. Specifically, each row of M represents a specific SM, and each column of M represents a specific miRNA. The (i,j)-th element of the association matrix, m i j , is set to 1 if SM i is associated with miRNA j , otherwise it is set to 0. Table 2 shows the complete data information for these three datasets.

2.2. Integrated SM Similarity

Referring to the previous work of Lv et al. [33], we introduce four kinds of widely used SM similarities: the side-effect-based SM similarity [34], the chemical-structure-based SM similarity [35], the functional consistency-based SM similarity [36], and the indication phenotype-based SM similarity [34].
  • The side-effect-based SM similarity was calculated according to the Jaccard score based on the number of shared side effects between two SMs. The SM-related side effects were extracted from the SIDER [37] database.
  • The chemical-structure-based SM similarity was calculated by analyzing the maximal common sub-graphs between the chemical structure graphs of two SMs.
  • The indication phenotype-based SM similarity was calculated according to the similarity between MeSH [38] terms of diseases associated with SMs. The disease information related to SMs was extracted from the DrugBank [29] database.
  • The functional consistency-based SM similarity was calculated based on the functional association between the target gene sets of SMs. The target gene information of SMs was extracted from the DrugBank [29] and TTD [39] databases.
We constructed four SM similarity matrices of dimension n s × n s (represented by S S s m , S C s m , S F s m , and  S P s m ) where each row and its corresponding column represent a specific SM. The element in the i-th row and j-th column denotes the similarity score between SM i and SM j . To minimize the bias of a single similarity measure, we integrated these similarity matrices utilizing the weighted averaging strategy as follows:
S s m = α 1 S S s m + α 2 S C s m + α 3 S F s m + α 4 S P s m i = 1 4 α i
where S s m R n s × n s indicates the integrated SM similarity matrix, and α i denotes the weight of the i-th SM similarity matrix, which is set to 1.

2.3. Integrated miRNA Similarity

Similarly, we introduce two types of miRNA similarities: the gene functional consistency-based miRNA similarity [36] and the disease-phenotype-based miRNA similarity [34].
  • The gene functional consistency-based miRNA similarity was calculated based on the functional identity between target gene sets of miRNAs.
  • The disease-phenotype-based miRNA similarity was calculated according to the Jaccard score based on the number of shared diseases between two miRNAs. The miRNA-related diseases were extracted from three databases: HMDD [30], miR2Disease [31], and PhenomiR [32].
We constructed two miRNA similarity matrices of dimension n m × n m (represented by S G m , and  S D m ), in which each row and its corresponding column represent a specific miRNA. The (i,j)-th element denotes the similarity score between miRNA i and miRNA j . The integrated similarity matrix is calculated as follows:
S m = β 1 S G m + β 2 S D m j = 1 2 β j
where S m R n m × n m denotes the integrated miRNA similarity matrix, and β j indicates the weight of the j-th miRNA similarity matrix, which is also set to 1.

2.4. SM–miRNA Heterogeneous Network and Target Matrix

In this section, we detail the construction of an SM–miRNA heterogeneous network. First, we built an SM similarity network containing n s SM nodes, in which the similarity scores between SMs were used as the weights of the edges. Then, we constructed a miRNA similarity network with n m miRNA nodes and utilized the similarity scores between miRNAs as the weights of the edges. Finally, we connected these two similarity networks based on known SM–miRNA associations to construct the SM–miRNA heterogeneous network. We consider the adjacency matrix of this heterogeneous network as the target matrix as shown in Formula (3).
H = S s m M M T S m
where S s m R n s × n s , M R n s × n m , M T R n m × n s , S m R n m × n m , H R ( n s + n m ) × ( n s + n m ) .

2.5. AMCSMMA

2.5.1. Overview

Predicting potential associations between small molecules and miRNAs can be considered as a matrix completion problem, which means recovering the elements with a value of 0 in the association matrix. In this study, we propose a predictive model called AMCSMMA, and its framework is shown in Figure 1. Initially, we introduce and integrate different SM/miRNA similarities. The SM–miRNA heterogeneous network is then constructed, and its adjacency matrix is considered as the target matrix. After that, we design an optimization framework and implement an effective two-step iterative scheme to solve it. Finally, we obtain the prediction score matrix by matrix division.

2.5.2. Optimization Framework

Based on the assumption that the underlying matrix has a low-rank structure, this matrix completion problem is mathematically described in the following form.
min X rank ( X ) s.t. P Ω ( X ) = P Ω ( H )
where X R ( n s + n m ) × ( n s + n m ) , rank ( · ) denotes the rank function, Ω denotes the indices of the observed entries of H, and P Ω is the orthogonal projection operator onto the span of matrices vanishing outside of Ω .
P Ω ( X ) i j = X i j i f ( i , j ) Ω 0 i f ( i , j ) Ω
Unfortunately, owing to the existence of non-convexity and the discontinuous nature in the rank function, the optimization problem (4) becomes an NP-hard problem. Fazel M. [40] proposed a convex relaxation strategy as follows:
min X X * s.t. P Ω ( X ) = P Ω ( H )
where X * = i = 1 n s + n m σ i denotes the nuclear norm of X, σ i is the i-th singular value of X, which satisfies the relationship of σ 1 σ 2 σ i σ ( n s + n m ) . With strong theoretical guarantees, the optimization algorithms for nuclear norm regularization frequently achieve the biased solution in practical applications. This occurs because the nuclear norm treats the singular values differently compared to the rank function, in which all the nonzero singular values have equal contributions to the true rank.
Inspired by Hu et al. [41], on the premise that the rank of the underlying matrix is r ( r < < ( n s + n m ) ), we found that r only corresponds to the r largest singular values. Therefore, we obtained a more accurate approximation to the rank function, as shown in Formula (7), by minimizing the smallest n s + n m r singular values and leaving the r largest singular values to be free.
min X X r s.t. P Ω ( X ) = P Ω ( H )
where X r = i = r + 1 n s + n m σ i denotes the truncated nuclear norm of X. Considering that the optimization problem (7) is non-convex, it needs to be rewritten as (8). The complete process of proof can be found in Appendix A.1.
min X X * max A A T = I , B B T = I Tr ( A X B T ) s.t. P Ω ( X ) = P Ω ( H )
where A R r × ( n s + n m ) , B R r × ( n s + n m ) , and  I R r × r denotes the identity matrix. It is necessary to elaborate when Tr ( A X B T ) obtains the maximum value. The Singular Value Decomposition (SVD) to X is as follows:
( U , S , V T ) = S V D ( X )
where U = ( u 1 , , u r , , u ( n s + n m ) ) R ( n s + n m ) × ( n s + n m ) and V = ( v 1 , , v r , , v ( n s + n m ) ) R ( n s + n m ) × ( n s + n m ) are unitary matrices, and S R ( n s + n m ) × ( n s + n m ) . Some previous research [41,42] suggested that Tr ( A X B T ) obtains the maximum value that equals i = 1 r σ i ( X ) when A equals U r T R r × ( n s + n m ) and B equals V r T R r × ( n s + n m ) , where U r = ( u 1 , , u r ) R ( n s + n m ) × r and V r = ( v 1 , , v r ) R ( n s + n m ) × r . The calculation proof is as follows:
Tr ( A X B T ) = Tr ( u 1 , u 2 , , u r ) T U S V T ( v 1 , v 2 , , v r ) = Tr d i a g σ 1 ( X ) , σ 2 ( X ) , , σ r ( X ) , 0 , , 0 = i = 1 r σ i ( X )
Further, to avoid the interference of noisy data on the results, we relax the tight constraint as a part of the objective function and set the parameter α to control the weight of this term in the objective function. Additionally, we constrain the completed values between 0 and 1. Ultimately, the optimization framework is described as follows:
min X X * max A A T = I , B B T = I Tr ( A X B T ) + α 2 P Ω ( X ) P Ω ( H ) F 2 s.t. 0 X i j 1 , 0 i , j ( n s + n m )
where · F denotes the Frobenius norm.

2.5.3. Optimization Algorithm

In this section, we design an effective two-step iterative algorithm. We initialize X 1 as P Ω ( H ) . In the first step of the l-th iteration, we implement the SVD algorithm to X l to obtain the left singular matrix U l and the right singular matrix V l . Then, we construct the truncated matrices A l a n d B l by, respectively, utilizing the first r-columns of U l a n d V l . In the second step of the l-th iteration, we fix A l , B l and update X l + 1 by solving the following convex sub-problem.
X l + 1 = arg min Z Z * Tr ( A l Z B l T ) + α 2 P Ω ( Z ) P Ω ( H ) F 2 s.t. 0 Z i j 1 , 0 i , j ( n s + n m )
where Z R ( n s + n m ) × ( n s + n m ) . According to different datasets, we set the maximal iterations in [1, 4].
For solving the convex sub-problem (12), we introduce the Alternating Direction Multiplier Method (ADMM). Specifically, we introduce the auxiliary matrix W, which satisfies Z = W , and the optimization problem is given by (13).
min Z Z * Tr ( A l W B l T ) + α 2 P Ω ( W ) P Ω ( H ) F 2 s.t. Z = W , 0 W i j 1 , 0 i , j ( n s + n m )
The Augmented Lagrangian Function of (13) is described as:
L ( W , Z , Y , α , β ) = Z * Tr ( A l W B l T ) + α 2 P Ω ( W ) P Ω ( H ) F 2 + Tr Y T ( Z W ) + β 2 Z W F 2
where Y is the Lagrange multiplier, and β > 0 is the penalty parameter. We initialize the variables W 1 , Z 1 a n d Y 1 as P Ω ( H ) and update the variables alternately by minimizing the Augmented Lagrange Function L ( W , Z , Y , α , β ) with respect to the variables in a Gauss–Seidel manner. The exact procedure of the k-th iteration is shown below.
Computing W k + 1 : Fix Z k , Y k and minimize the Augmented Lagrangian Function L ( W , Z k , Y k , α , β ) for updating W k + 1 .
W k + 1 = arg min 0 W i j 1 Z k * Tr ( A l W B l T ) + α 2 P Ω ( W ) P Ω ( H ) F 2 + Tr Y k T Z k W + β 2 Z k W F 2
Discarding the constant terms, the above equation can be rewritten as (16).
W k + 1 = arg min 0 W ij 1 Tr A l W B l T + α 2 P Ω ( W ) P Ω ( H ) F 2 + Tr Y k T Z k W + β 2 Z k W F 2
Ignoring the constraint, L ( W , Z k , Y k , α , β ) obtains the minimum value when and only when the derivative of (16) equals zero as follows:
A l T B l + α P Ω * P Ω W ¯ k + 1 P Ω ( H ) Y k β Z k W ¯ k + 1 = 0
where P Ω * denotes the adjoint operator of P Ω that satisfies P Ω * P Ω = P Ω , and W ¯ k + 1 denotes the transition matrix, which is calculated as Equation (18). The complete calculation process can be found in Appendix A.2.
W ¯ k + 1 = 1 β Y k + α β P Ω ( H ) + 1 β A l T B l + Z k α α + β P Ω 1 β Y k + α β P Ω ( H ) + 1 β A l T B l + Z k
To update W k + 1 , we implement the operation as Equation (19) on the matrix W ¯ k + 1 , which limits the completed values in [0, 1].
W k + 1 i j = 0 if W ¯ k + 1 i j 0 W ¯ k + 1 i j if 0 < W ¯ k + 1 i j < 1 1 if W ¯ k + 1 i j 1
Computing Z k + 1 : Fix W k + 1 , Y k and update Z k + 1 by minimizing L ( W k + 1 , Z , Y k , α , β ) .
Z k + 1 = arg min Z Z * Tr A l W k + 1 B l T + α 2 P Ω W k + 1 P Ω ( H ) F 2 + Tr Y k T Z W k + 1 + β 2 Z W k + 1 F 2
Ignoring the constant terms, we obtain Equation (21).
Z k + 1 = arg min Z Z * + Tr Y k T Z W k + 1 + β 2 Z W k + 1 F 2 = arg min Z Z * + β 2 Z W k + 1 1 β Y k F 2
According to the singular value shrinkage operator D τ and the related theorem [43], the updating formula is described as follows:
Z k + 1 = D 1 β W k + 1 1 β Y k
where D τ ( L ) = U D τ ( S ) V T , τ is the threshold parameter, U , S , V T = S V D ( L ) , D τ ( S ) = diag max 0 , σ i τ , σ i denotes the main diagonal elements of S.
Computing Y k + 1 : Fix W k + 1 , Z k + 1 and update the Lagrange multiplier Y k + 1 using the gradient ascent method.
Y k + 1 = Y k + γ β L ( W k + 1 , Z k + 1 , Y , α , β ) Y = Y k + γ β Z k + 1 W k + 1
where γ is the learning rate.
Ultimately, we set the iterative stop conditions for the sub-problem according to previous  research [44].
d 1 k + 1 = Z k + 1 Z k F Z k F ε 1 d 2 k + 1 = d 1 k + 1 d 1 k max d 1 k , 1 ε 2
where ε 1 and ε 2 are the given accuracies.
After the two-step iterative algorithm converges, we obtain the result matrix and divide it as follows:
H = S s m M M T S m
where S s m / S m is the enhanced SM/miRNA similarity matrix that contains more precise and abundant SM/miRNA similarity information, M is the prediction score matrix, and recovering values are considered as the association scores that represent the possibility of potential association. The complete pseudocode and parameter settings are shown in Algorithm 1.
Algorithm 1 AMCSMMA.
Require: M, ( S S s m , S C s m , S F s m , S P s m ) R n s × n s , ( S G m , S D m ) R n m × n m , P Ω R ( n s + n m ) × ( n s + n m )
Ensure:  M
1:
S s m R n s × n s M a t r i x _ F u s i o n ( S S s m , S C s m , S F s m , S P s m , α i )
2:
S m R n m × n m M a t r i x _ F u s i o n ( S G m , S D m , β i )
3:
H : S s m M M T S m R ( n s + n m ) × ( n s + n m )
4:
X 1 P Ω ( H ) , l 0 , r 1 , i t e r a t i o n s 3 , m a x i t e r 300 , ε 1 = 2 × 10 3 , ε 2 = 10 5 , α = 1 , β = 10 , γ = 1
5:
repeat
6:
    l l + 1 , ( U l , S l , V l T ) S V D ( X l ) , where U l : ( u 1 , u 2 , , u r , , u ( n s + n m ) ) , V l : ( v 1 , v 2 , , v r , , v ( n s + n m ) )
7:
    A l ( u 1 , u 2 , , u r ) T , B l ( v 1 , v 2 , , v r ) T
8:
    W 1 , Z 1 , Y 1 P Ω ( H ) , k 0
9:
   repeat
10:
      k k + 1 ,
11:
      W ¯ k + 1 1 β Y k + α β P Ω ( H ) + 1 β A l T B l + Z k α α + β P Ω 1 β Y k + α β P Ω ( H ) + 1 β A l T B l + Z k
12:
      W k + 1 i j 0 if W ¯ k + 1 i j 0 W ¯ k + 1 i j if 0 < W ¯ k + 1 i j < 1 1 if W ¯ k + 1 i j 1
13:
      Z k + 1 D 1 β W k + 1 1 β Y k , Y k + 1 Y k + γ β Z k + 1 W k + 1
14:
   until  d 1 k + 1 Z k + 1 Z k F Z k F ε 1 a n d d 2 k + 1 d 1 k + 1 d 1 k max d 1 k , 1 ε 2 or k = = m a x i t e r
15:
    X l + 1 W k + 1
16:
until  l = = i t e r a t i o n s
17:
H : S s m M M T S m R ( n s + n m ) × ( n s + n m ) X l + 1
18:
M R n s × n m M a t r i x _ D e v i d e ( H )
19:
return  M

3. Results

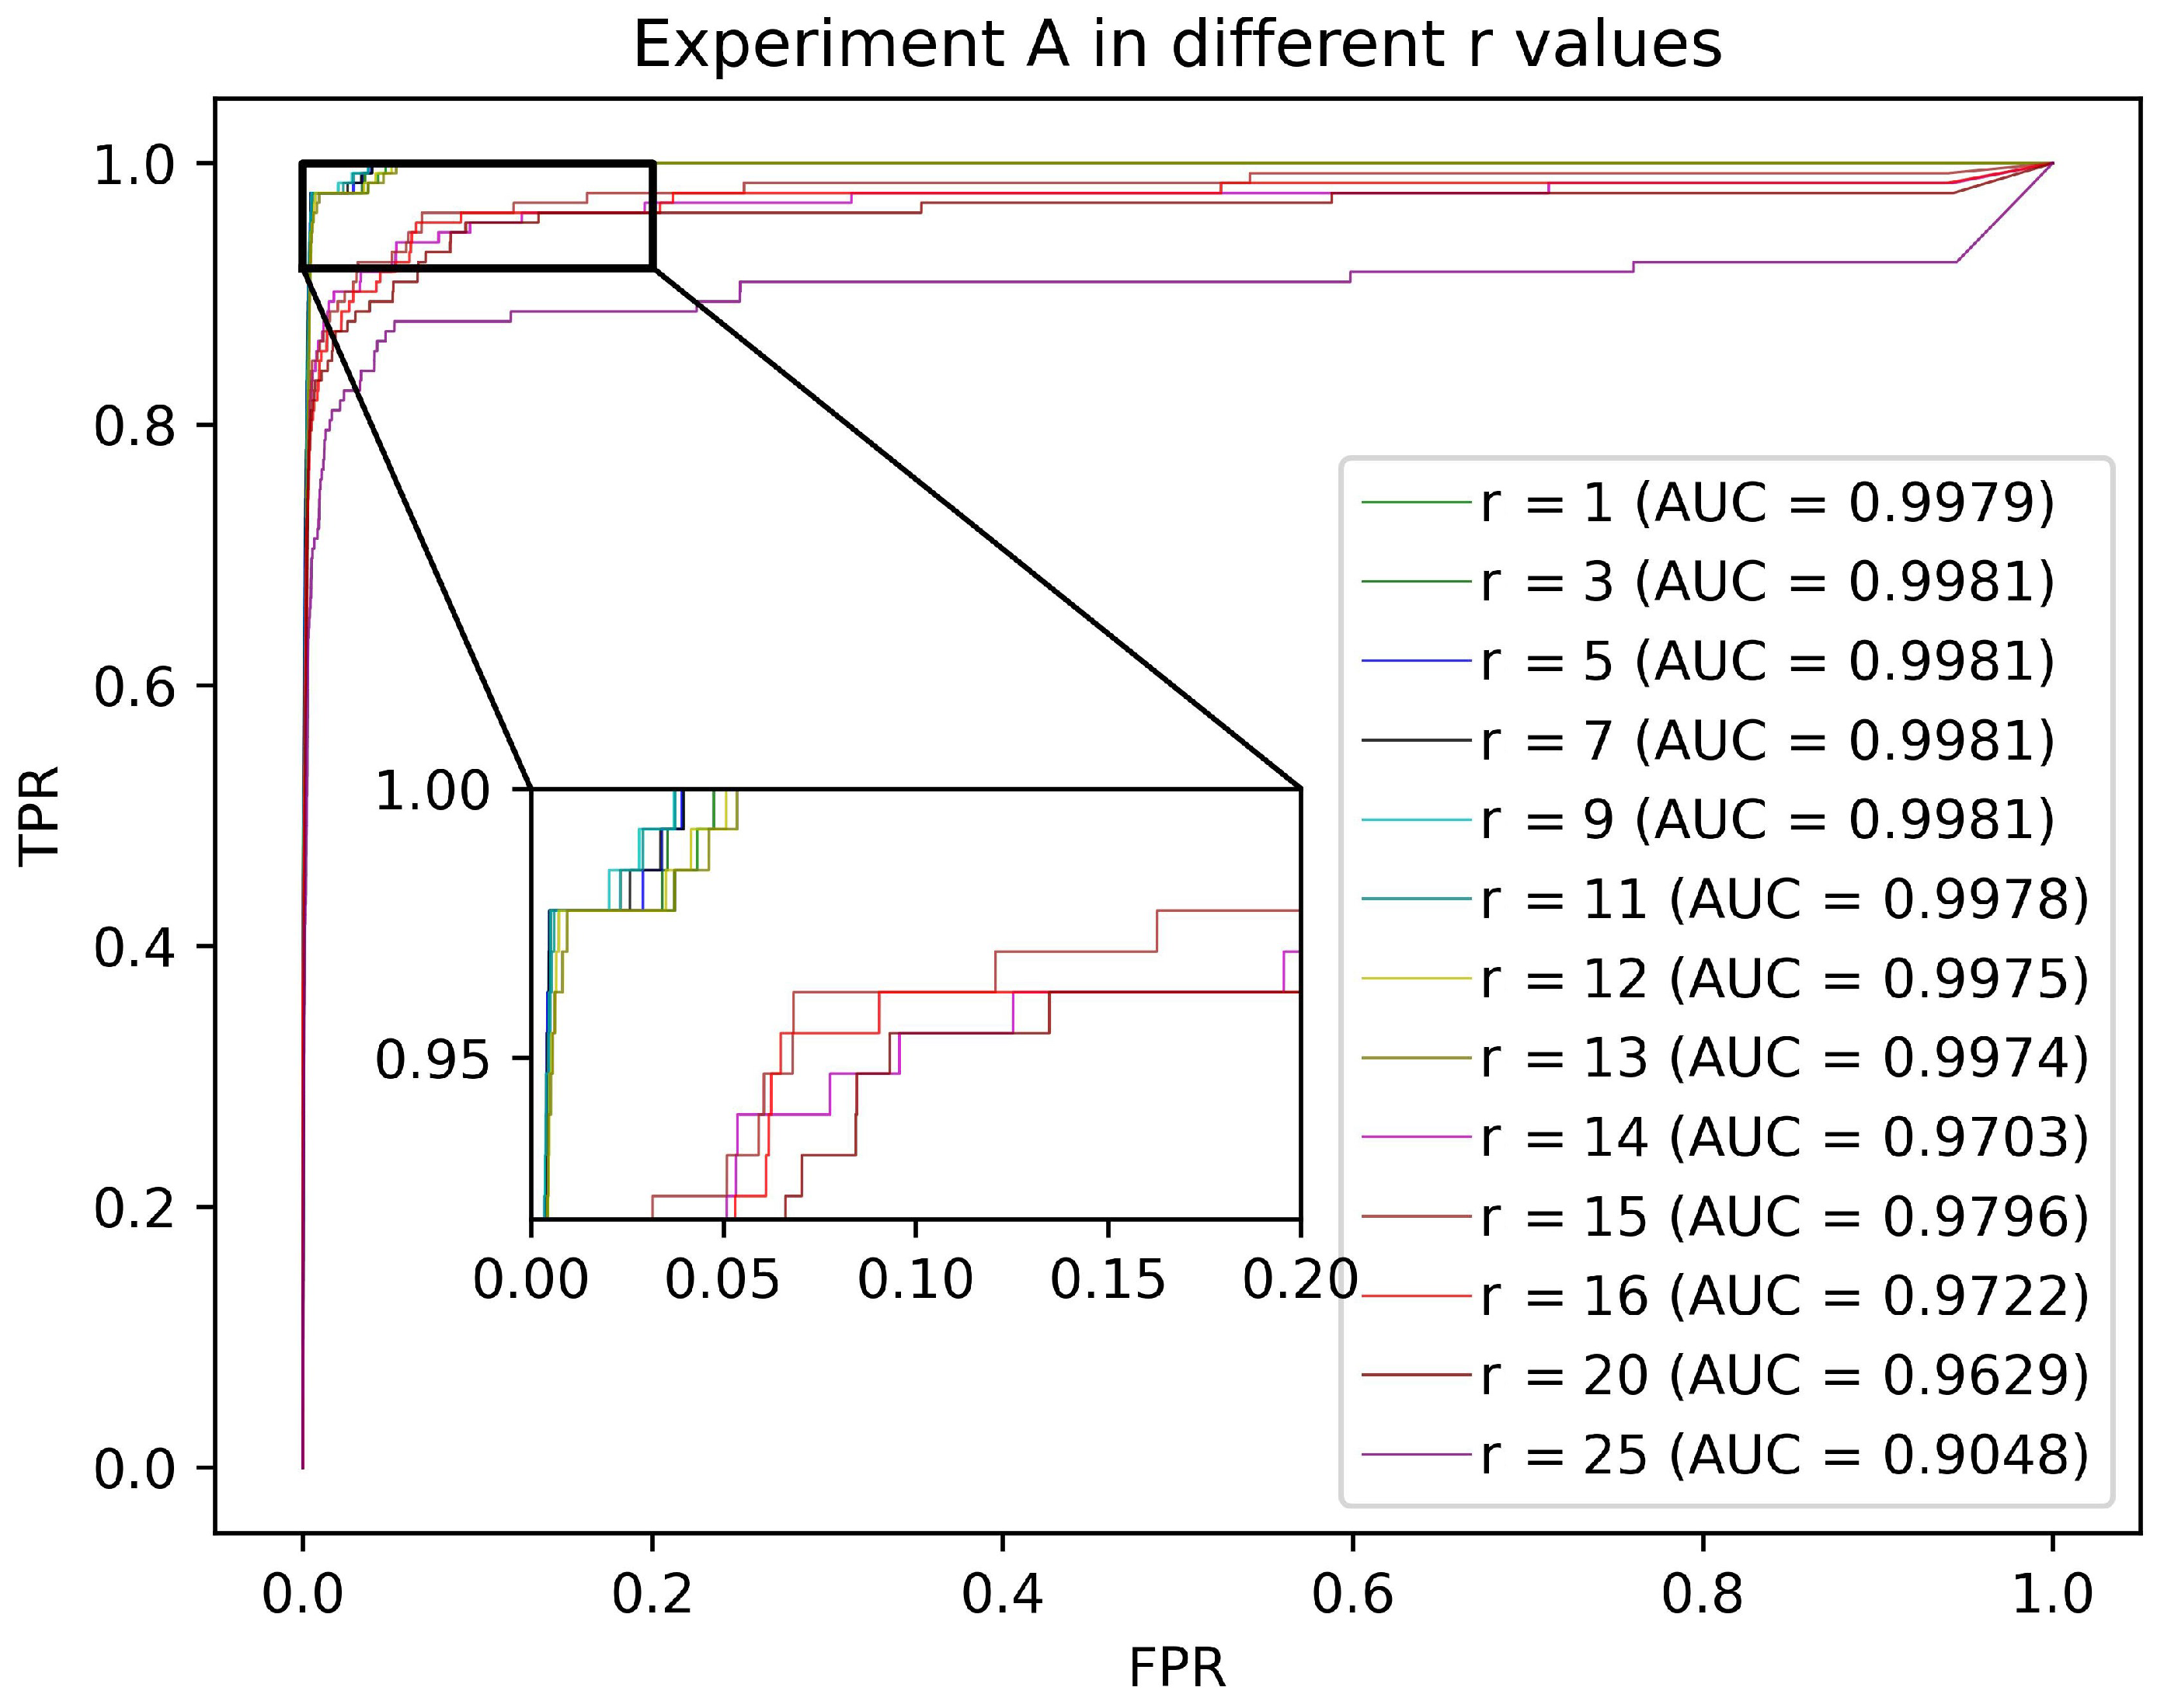
3.1. Validation Experiment A

In this section, we design Validation Experiment A to quantitatively analyze the effect of the truncated position r on the predictive performance of AMCSMMA. Specifically, all confirmed associations in Dataset 1 are regarded as the training samples, all verified associations in Dataset 3 are treated as the testing samples, and all SM–miRNA pairs in Dataset 1 that are neither part of the training set nor the testing set are considered as the candidate samples.
Under specific r { 1 , 3 , 5 , , 11 , 12 , , 16 , 20 , 25 } , we conduct AMCSMMA only utilizing the training samples to recover the SM–miRNA association matrix with missing values. Then, the association scores of the candidate samples and the testing samples are extracted and arranged in descending order to calculate the False Positive Rate (FPR, 1-specificity) and the True Positive Rate (TPR, sensitivity) at a specific threshold. Furthermore, we set the FPR as the abscissa and the TPR as the ordinate and plot the Receiver Operating Characteristic (ROC) curves based on different thresholds.
The AUC between 0 and 1 is the area under the ROC curve, and the larger the numerical value is, the better the predictive performance of the model. According to Figure 2, we find that AMCSMMA achieved excellent and stable performance when r { 1 , 3 , 5 , , 11 , 12 , 13 } . With the increase of r value in [1, 13], the computational complexity increased, whereas the prediction accuracy improved weakly. Considering that the adjustable target rank can increase the adaptability of the model to different datasets, we finally set r { 1 , 2 , 3 } . The AUC reached 0.9981 at the optimal parameters, which strongly demonstrates the superiority of our model in predicting potential SM–miRNA associations.

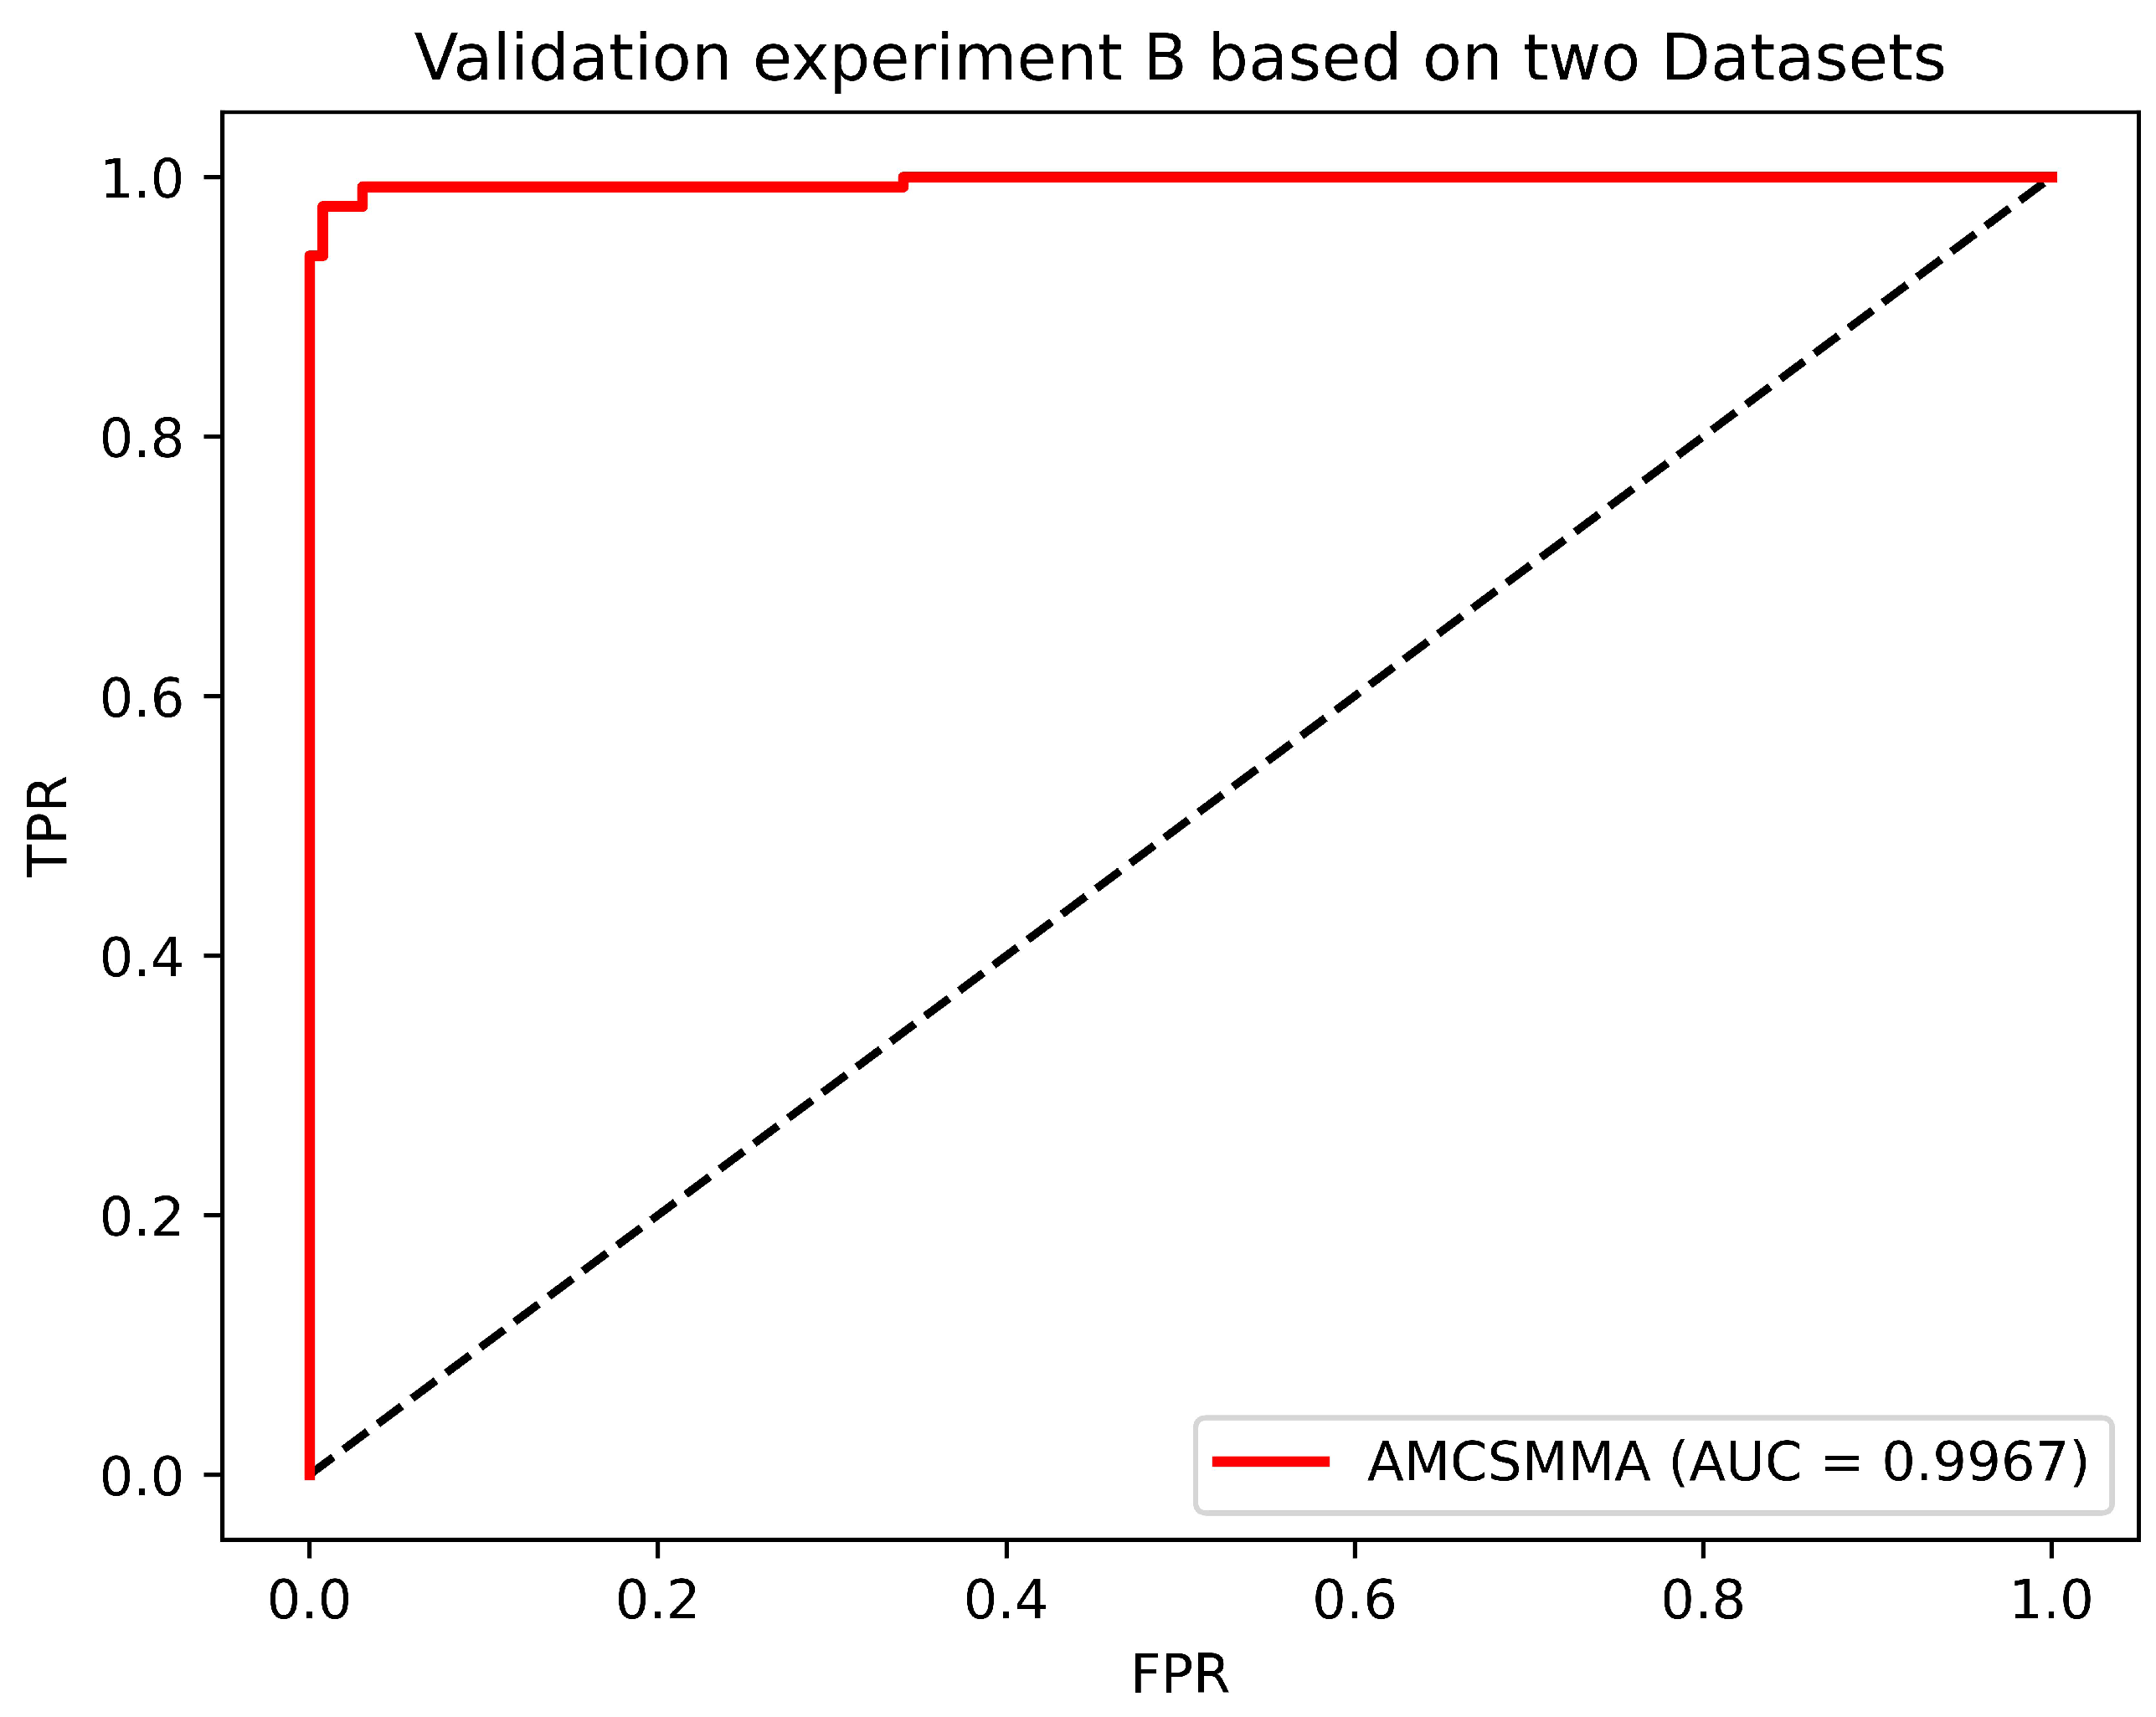
3.2. Validation Experiment B

To comprehensively evaluate the predictive performance of our model, we design Validation Experiment B, in which 664 confirmed SM–miRNA associations in Dataset 1 are utilized as the training samples, and 132 verified SM–miRNA associations in Dataset 3 are assembled into the positive testing set. Then, we randomly select 132 unknown SM–miRNA associations from Dataset 1 to form the negative testing set. The intersection set of the training set, the positive testing set, and the negative testing set is an empty set.
In addition, the AUC, five additional metrics are introduced, which include the Precision, Recall, F1 Score, Accuracy, and MCC. We calculate the above metrics based on three thresholds that maximize the F1 Score, the Accuracy, and the MCC. Considering the fluctuation of experimental results caused by randomly selecting the negative testing samples, we repeat the above procedure 100 times and consider the average value as the final result. It can be seen from Table 3 and Figure 3 that all metrics achieved a significant result.

3.3. Four Cross-Validation Experiments

Based on Dataset 1 and Dataset 2 separately, we implemented five-fold cross-validation (CV), Global Leave-One-Out CV (LOOCV), miRNA-Fixed Local LOOCV, and SM-Fixed Local LOOCV to further validate the predictive performance of AMCSMMA. At the same time, we likewise applied the above four CVs to other association predictive models.
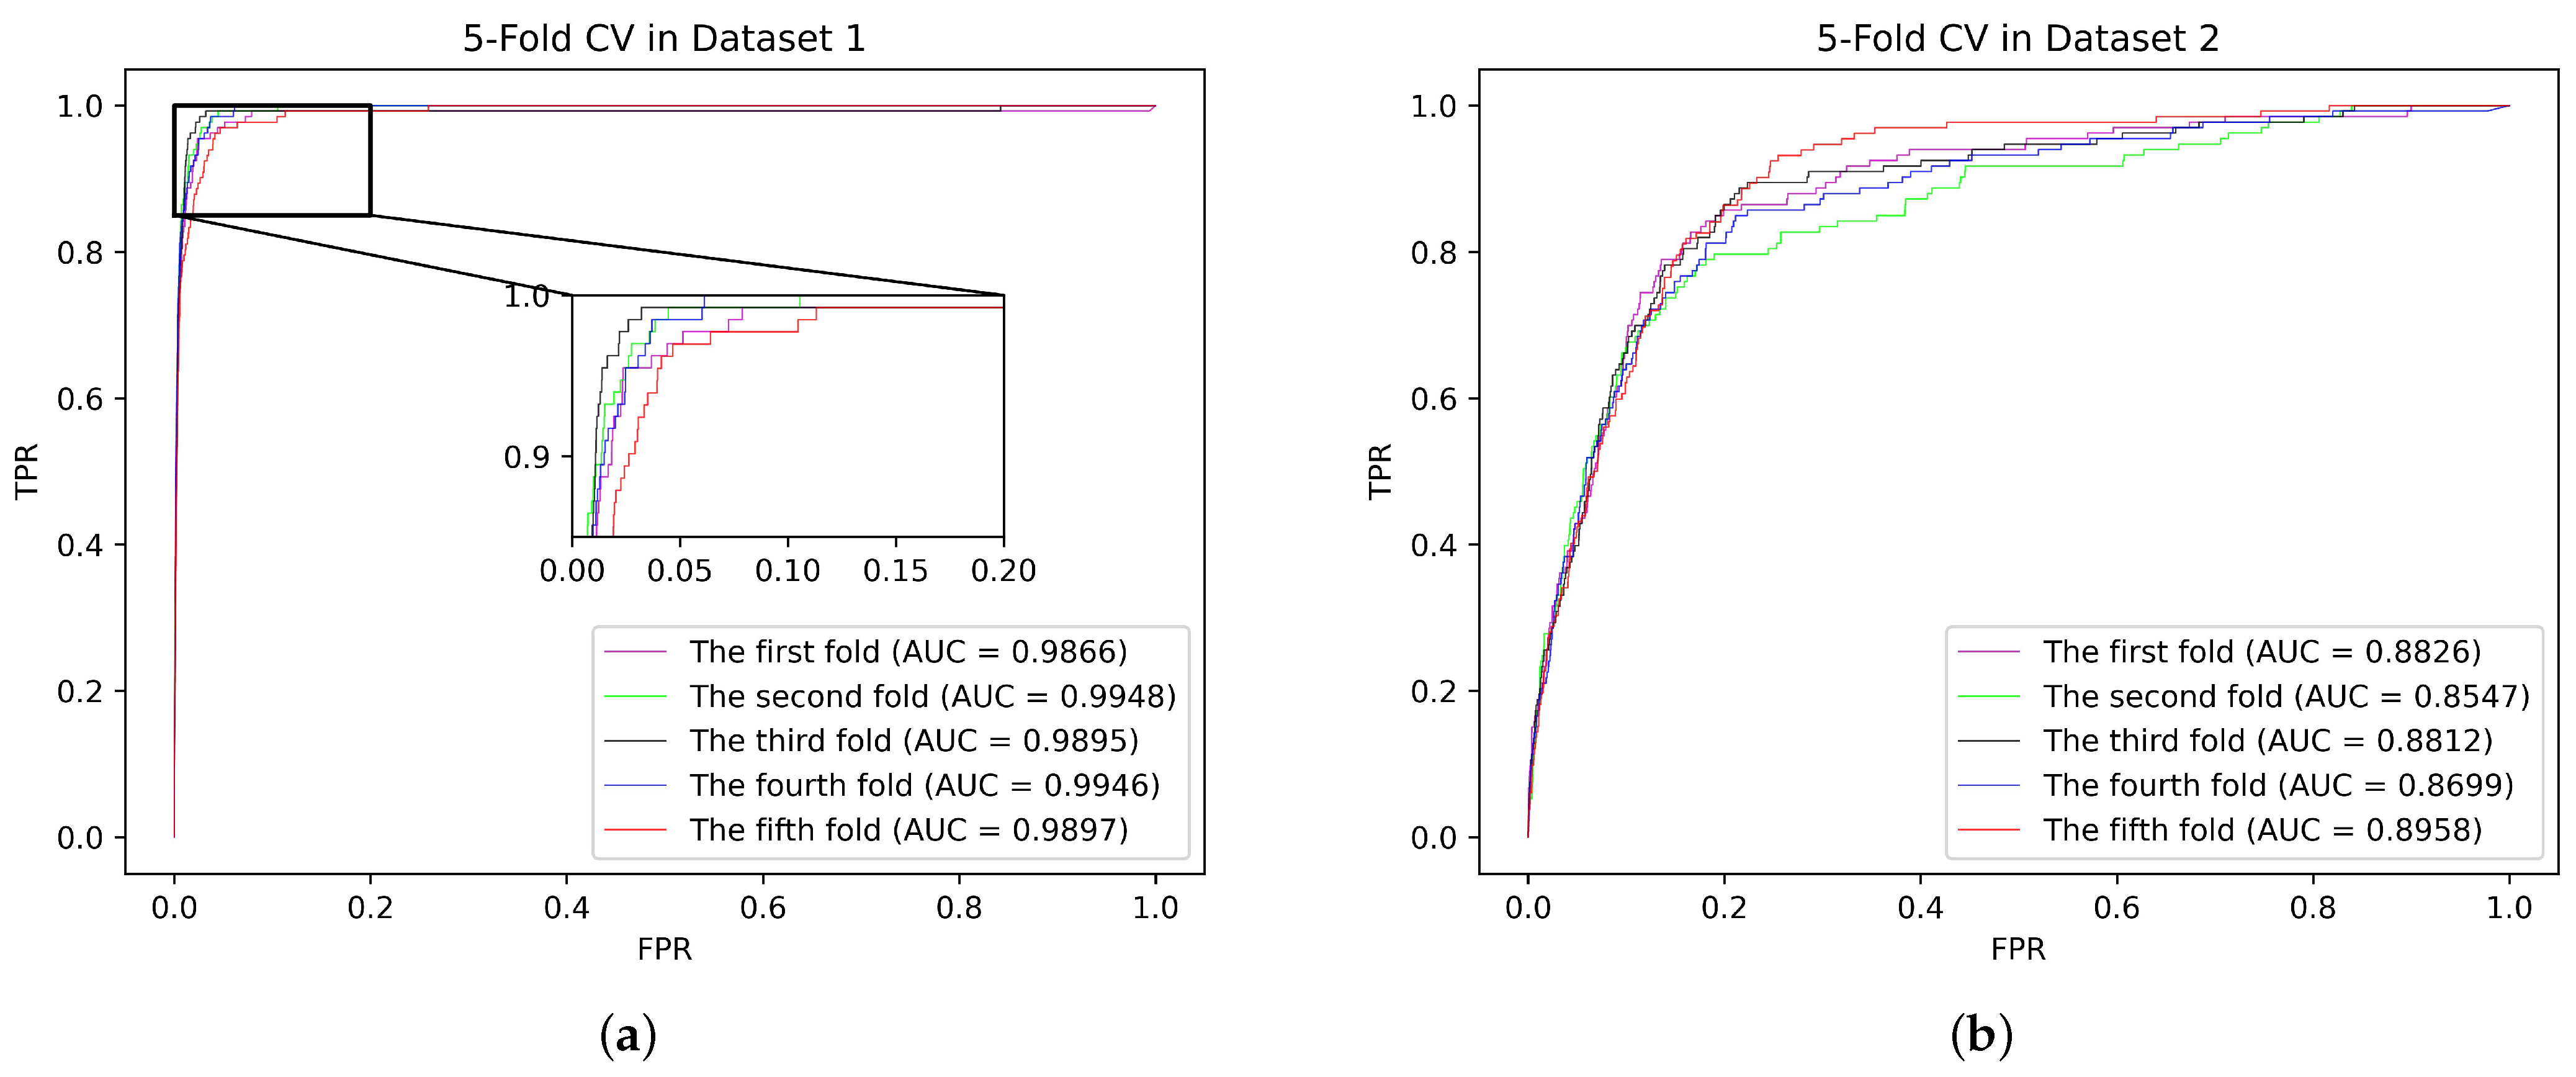
In the five-fold CV, all the confirmed SM–miRNA associations (664 items) were randomly divided into five parts, of which one part incorporated 132 items and each remaining part included 133 items. Specifically, we alternately utilized one part as the testing set, and the remaining four parts were fused as the training set. Additionally, all the unknown SM–miRNA associations were assembled in the candidate set. In each fold, only utilizing the training samples, we conducted AMCSMMA to recover the SM–miRNA association matrix. Likewise as in Validation Experiment A, the association scores of the testing and candidate samples were integrated into a descending sequence.
Then, we plotted the ROC curve and derived the AUC value under this fold. After five folds, the average AUC value was regarded as the result of one five-fold CV. It is worth noting that we repeated the five-fold CV 100 times and took the average AUC value as the final result, which insulates the validation result against the randomness of sample partitioning. Additionally, we calculated the Standard Deviation (SD) value that can reflect the robustness of the model. Finally, the AUC±SD of AMCSMMA under five-fold CV reached 0.9910 ± 0.0004 and 0.8768 ± 0.0039 based on Datasets 1 and 2, respectively.
From Table 4, we observe that AMCSMMA achieved a higher AUC and a lower SD than did the compared models based on both datasets, which indicates that it has superior predictive performance and robustness. Figure 4 shows the ROC curves of each fold in one five-fold CV based on two datasets and the areas under the curves.
In Global LOOCV, each verified SM–miRNA association was sequentially selected as the testing sample, and the remaining 663 confirmed associations were considered as the training samples. Additionally, all unknown SM–miRNA associations were treated as the candidate samples.
Similarly, we calculated the AUC values successively under 664 folds according to the association scores of the testing and candidate samples and regarded the average AUC as the result. From Table 4, we discover that the AUC of AMCSMMA under Global LOOCV reached 0.9923 (0.8861) based on Dataset 1 (Dataset 2), which exceeds all other models proposed in recent years and once again demonstrates the superior predictive performance of our model.
In miRNA-Fixed Local LOOCV and SM-Fixed Local LOOCV, the testing and training samples were selected in the same way as in Global LOOCV. Nevertheless, the candidate set in miRNA/SM-Fixed Local LOOCV only consisted of the unknown SM–miRNA associations that have the same miRNA/SM with the testing sample in each fold. After several computational steps, the AUC of AMCSMMA reached 0.9898 (0.8880) based on Dataset 1 (Dataset 2) under miRNA-Fixed Local LOOCV, which surpasses all comparative models. The AUC reached 0.8222 (0.7232) based on Dataset 1 (Dataset 2) under SM-Fixed Local LOOCV, which is superior to the other four models (TLHNSMMA, GISMMA, SLHGISMMA, and SMiR-NBI). The DCMF achieved the best performance because it was able to obtain the exact SM feature matrix.
As shown in Table 4, AMCSMMA achieved better performance based on Dataset 1 than on Dataset 2 in cross-validation experiments. The reason for this is that Datasets 1 and 2 provide the same positive samples (divided into training and testing samples), but Dataset 1 provides a much larger number of candidate samples compared with Dataset 2. Since these additional candidate samples contain SMs/miRNAs that have no known associations with miRNAs/SMs, they have relatively low association scores compared to the testing samples, resulting in a higher AUC value based on Dataset 1 than on Dataset 2. Therefore, we expect that the accuracy of AMCSMMA will improve as more SMs and miRNAs are added to the dataset.

3.4. Case Studies

3.4.1. The First Type of Case Study

In this section, we initially utilize AMCSMMA to obtain the predictive scores of all unknown SM–miRNA associations in Dataset 1. Subsequently, we count the number of associations confirmed by published literature in PubMed. Finally, 9 (33) among the top 20 (100) associations can be confirmed. Table 5 lists the top 20 associations and the literature evidence (PubMed ID).
Specifically, Khorrami et al. [45] identified that miR-146a is overexpressed in a colon cancer cell line (HT-29), which can increase its resistance to 5-FU and irinotecan, thereby diminishing the prognostic effect of chemotherapy. Additionally, Zhang et al. [46] revealed that CYP11A1 and CYP19A1 expression in human CCs, and the resulting production of progesterone and estradiol, are transcriptionally down-regulated by miR-320a deficiency. Moreover, the colorectal cancer hallmark (CXCL12) is able to induce miR-125 upregulation and generate the chemotherapy drugs 5-FU resistance [47].
We implement this type of case study on other comparative models. From Table 6, our model achieves the best performance.

3.4.2. The Second Type of Case Study

To explore the applicability of AMCSMMA to new SMs, we conducted the second type of case study to two SMs, 5-FU and 5-Aza-2’-deoxycytidine based on Dataset 1. In detail, we first removed all verified associations related to the specific SM. Then, a descending sequence consisting of association scores between the specific SM and all miRNAs was obtained. We counted the number of associations confirmed by the SM2miR database [27] and published references. Finally, in the second type to 5-FU, 20 (34) among the top 20 (50) associations were confirmed as shown in Table 7.
Specifically, the sensitivity of 5-FU was significantly correlated with the antitumor effect, and overexpression of miR-329 and let-7c enhanced the sensitivity of 5-FU by affecting the apoptotic pathway, thus enhancing the antitumor effect [48,49]. In another study, Wang et al. [50] found that 5-FU was abnormally sensitive to MCF-7 cells due to its negative regulation on Bcl-xl expression via let-7b. Additionally, Bamodu et al. [51] concluded that the SOD2-enhanced 5-FU chemoresistance of colorectal cancer cells was inhibited by inducing the re-expression of hsa-miR-324. Furthermore, Han et al. [52] discovered that miR-874 can reduce the resistance of colorectal cancer cells to 5-FU.
In the second type to 5-Aza-2’-deoxycytidine, 16 (26) of the top 20 (50) associations were confirmed as shown in Table 8. Particularly, Liu et al. [53] found that the demethylation agent 5-Aza-2’-deoxycytidine inhibited the proliferation of esophageal cancer cells by increasing the expression of miR-203a. Moreover, the expression of miR-19b and let-7b increased in gastric cancer cells after 5-Aza-2’-deoxycytidine treatment [54,55]. In addition, Sun et al. [56] found that hypermethylation of the promoter region in gastrointestinal cancer cell lines correlated with the expression of miR-148a in gastric cancer, and thus treatment with the demethylation agent 5-Aza-2’-deoxycytidine can be performed.
Furthermore, we conducted the second type of case study on BNNRSMMA and DCMF, which are both heuristic algorithms based on matrix completion. As shown in Table 9, our model achieved the best performance except in Number D.
In conclusion, the above experimental results demonstrate that AMCSMMA is an excellent model with superior predictive performance and high robustness in predicting potential SM–miRNA associations, which can provide guidance for complex and expensive biological experiments and accelerate the discovery of new SM–miRNA associations, thus facilitating drug development and disease treatment.

4. Discussion

In recent years, an increasing number of studies have shown that the abnormal expression of miRNAs is closely related to a variety of physiological and pathological processes, including cancer, cardiovascular diseases, and metabolic diseases [13,57]. As a result, targeting and modulating miRNAs with small molecule (SM) drugs has become a significant modality for clinical treatment.
Given the complexity and expense of developing new SMs, it is extremely difficult to develop specific SMs for each dysregulated miRNA. Therefore, exploring potential associations between known SMs and miRNAs is both significant and urgent in drug development and disease treatment. Since confirming SM–miRNA associations through biological experiments is time-consuming and expensive, more effective predictive approaches need to be proposed for identifying the SM–miRNA associations with high association probabilities, which can provide guidance for biological experiments and discover potential SM–miRNA associations more cost-effectively.
In this paper, we proposed a more accurate predictive model based on the truncated nuclear norm, called AMCSMMA. After determining the optimal parameter values, the results of Validation Experiment A, four cross-validation experiments, Validation Experiment B, and two types of case studies indicated that AMCSMMA had superior prediction accuracy and high robustness. The reasons for this are discussed in the following.
  • All the known SM–miRNA associations were acquired from the SM2miR v1.0 database [27] and the published experimental literature, which are extremely reliable.
  • We constructed the SM–miRNA heterogeneous network and defined its adjacency matrix as the target matrix. This not only well utilized similarity information but also enriched it as the iteration progressed.
  • Unlike the nuclear norm regularization, the truncated nuclear norm regularization only minimized the sum of partial singular values, which not only made the result matrix more closely approximate the true solution but also improved the adaptability to different datasets.
  • We designed an effective two-step iterative scheme to solve the optimization problem.
Although the advancement of AMCSMMA in predicting potential SM–miRNA associations enables it to provide reliable guidance for biological experiments, the model still has some limitations. For instance, the small number of known SM–miRNA associations greatly restricts the prediction accuracy of our model. Moreover, the biological data closely related to SM or miRNA, such as lncRNA and the circRNA, can be introduced to construct heterogeneous networks with more information to improve the prediction accuracy. Furthermore, the work of Yu et al. [58] inspired the idea that deep-learning-based approaches may be able to achieve good results. Due to the multiple utilization of the SVD algorithm, our model requires a relatively high time cost, which will be the focus of our future research.

Supplementary Materials

The following supporting information can be downloaded at: https://www.mdpi.com/article/10.3390/cells12081123/s1, Table S1: The known SM–miRNA associations and the relevant experimental literature in Dataset 3.

Author Contributions

Conceptualization, S.W. and C.R.; methodology, C.R. and Y.Z.; software, C.R. and W.W.; validation, C.R., S.P., and S.Q.; investigation, B.L. and W.W.; resources, B.L.; data curation, B.L.; writing—original draft preparation, C.R.; writing—review and editing, Y.Z.; visualization, S.P.; supervision, S.Q.; project administration, S.Q.; funding acquisition, S.W. All authors have read and agreed to the published version of the manuscript.

Funding

This work was supported by the National Key Research and Development Project of China (2021YFA1000102, 2021YFA1000103), the National Natural Science Foundation of China (Grant Nos. 61873281), and the Natural Science Foundation of China (Grant No. 62202498).

Institutional Review Board Statement

Not applicable.

Informed Consent Statement

Not applicable.

Data Availability Statement

The Python code and datasets of AMCSMMA are publicly available at https://github.com/a1657884486/AMCSMMA.git, accessed on 1 April 2023.

Conflicts of Interest

The authors declare no conflict of interest.

Abbreviations

The following abbreviations are used in this manuscript:
SMSmall Molecule
miRNAmicroRNA
CMFCollective Matrix Factorization
CVCross-Validation
LOOCVLeave-One-Out Cross-Validation
MCCMatthews Correlation Coefficient
SVDSingular Value Decomposition
ADMMAlternating Direction Multiplier Method
NP-hardNon-deterministic Polynomial-hard

Appendix A

Appendix A.1

Proof of Formula (8).
By Von Neumann’s trace inequality, we have:
Tr ( A X B T ) = Tr ( X B T A ) i = 1 n s + n m σ i ( X ) σ i ( B T A )
where X R ( n s + n m ) × ( n s + n m ) , A R r × ( n s + n m ) , B R r × ( n s + n m ) , A A T = I , B B T = I , r ( r ( n s + n m ) ) is a non-negative integer, I R r × r denotes the identity matrix, and σ i is the i-th singular value and satisfies the relationship of σ 1 σ 2 σ i σ ( n s + n m ) 0 . As r a n k ( A ) = r a n k ( B ) = r , we have r a n k ( B T A ) = s r . Owing to B T A ( B T A ) T = I , σ i ( B T A ) equals 1 if i s , otherwise it equals 0, and then we have:
i = 1 n s + n m σ i ( X ) σ i ( B T A ) = i = 1 s σ i ( X ) σ i ( B T A ) + i = s + 1 n s + n m σ i ( X ) σ i ( B T A ) = i = 1 s σ i ( X ) · 1 + i = s + 1 n s + n m σ i ( X ) · 0 = i = 1 s σ i ( X )
Combining inequalities A1 and A2, we have:
Tr ( A X B T ) i = 1 n s + n m σ i ( X ) σ i ( B T A ) = i = 1 s σ i ( X ) i = 1 r σ i ( X )
Then, we have:
| | X | | * max A A T = I , B B T = I Tr ( A X B T ) = | | X | | * i = 1 r σ i ( X ) = | | X | | r

Appendix A.2

According to the equation I + α β P Ω * P Ω 1 = I α α + β P Ω * P Ω [59], where ( · ) 1 denotes the reverse operator, we have:
W ¯ k + 1 = I + α β P Ω * P Ω 1 A l T B l β + α β P Ω * P Ω ( H ) + Y k β + Z k = I α α + β P Ω * P Ω A l T B l β + α β P Ω * P Ω ( H ) + Y k β + Z k = 1 β Y k + α β P Ω ( H ) + 1 β A l T B l + Z k α α + β P Ω 1 β Y k + α β P Ω ( H ) + 1 β A l T B l + Z k

References

  1. Rupaimoole, R.; Slack, F.J. MicroRNA therapeutics: Towards a new era for the management of cancer and other diseases. Nat. Rev. Drug Discov. 2017, 16, 203–222. [Google Scholar] [CrossRef]
  2. Conrad, R.; Barrier, M.; Ford, L.P. Role of miRNA and miRNA processing factors in development and disease. Birth Defects Res. Part C Embryo Today Rev. 2006, 78, 107–117. [Google Scholar] [CrossRef] [PubMed]
  3. Cai, Y.; Yu, X.; Hu, S.; Yu, J. A brief review on the mechanisms of miRNA regulation. Genom. Proteom. Bioinform. 2009, 7, 147–154. [Google Scholar] [CrossRef] [PubMed] [Green Version]
  4. Lee, R.C.; Feinbaum, R.L.; Ambros, V. The C. elegans heterochronic gene lin-4 encodes small RNAs with antisense complementarity to lin-14. cell 1993, 75, 843–854. [Google Scholar] [CrossRef] [PubMed]
  5. Reinhart, B.; Slack, F.J.; Basson, M.; Pasquinelli, A.; Bettinger, J.; Rougvie, A.; Horvitz, H.; Ruvkun, G. The 21-nucleotide let-7 RNA regulates developmental timing in Caenorhabditis elegans. Nature 2000, 403, 901–906. [Google Scholar] [CrossRef] [PubMed]
  6. Ha, M.J.; Kim, V.N. Regulation of microRNA biogenesis. Nat. Rev. Mol. Cell Biol. 2014, 15, 509–524. [Google Scholar] [CrossRef]
  7. Yu, Y.; Jia, T.; Chen, X. The ‘how’and ‘where’of plant micro RNA s. New Phytol. 2017, 216, 1002–1017. [Google Scholar] [CrossRef] [Green Version]
  8. Gantier, M.P.; Sadler, A.J.; Williams, B.R. Fine-tuning of the innate immune response by microRNAs. Immunol. Cell Biol. 2007, 85, 458–462. [Google Scholar] [CrossRef]
  9. Greco, S.J.; Rameshwar, P. MicroRNAs regulate synthesis of the neurotransmitter substance P in human mesenchymal stem cell-derived neuronal cells. Proc. Natl. Acad. Sci. USA 2007, 104, 15484–15489. [Google Scholar] [CrossRef] [Green Version]
  10. Scaria, V.; Hariharan, M.; Maiti, S.; Pillai, B.; Brahmachari, S.K. Host-virus interaction: A new role for microRNAs. Retrovirology 2006, 3, 1–9. [Google Scholar] [CrossRef] [Green Version]
  11. Tsuchiya, S.; Okuno, Y.; Tsujimoto, G. MicroRNA: Biogenetic and functional mechanisms and involvements in cell differentiation and cancer. J. Pharmacol. Sci. 2006, 101, 267–270. [Google Scholar] [CrossRef] [PubMed] [Green Version]
  12. Cho, W. OncomiRs: The discovery and progress of microRNAs in cancers. Mol. Cancer 2007, 6, 1–7. [Google Scholar] [CrossRef] [PubMed] [Green Version]
  13. Lee, Y.S.; Dutta, A. MicroRNAs in cancer. Annu. Rev. Pathol. Mech. Dis. 2009, 4, 199–227. [Google Scholar] [CrossRef] [PubMed]
  14. Liu, T.; Papagiannakopoulos, T.; Puskar, K.; Qi, S.; Santiago, F.; Clay, W.; Lao, K.; Lee, Y.; Nelson, S.F.; Kornblum, H.I.; et al. Detection of a microRNA signal in an in vivo expression set of mRNAs. PLoS ONE 2007, 2, e804. [Google Scholar] [CrossRef]
  15. Onuffer, J.J.; Horuk, R. Chemokines, chemokine receptors and small-molecule antagonists: Recent developments. Trends Pharmacol. Sci. 2002, 23, 459–467. [Google Scholar] [CrossRef]
  16. Shan, G.; Li, Y.; Zhang, J.; Li, W.; Szulwach, K.E.; Duan, R.; Faghihi, M.A.; Khalil, A.M.; Lu, L.; Paroo, Z.; et al. A small molecule enhances RNA interference and promotes microRNA processing. Nat. Biotechnol. 2008, 26, 933–940. [Google Scholar] [CrossRef] [Green Version]
  17. Cha, W.; Fan, R.; Miao, Y.; Zhou, Y.; Qin, C.; Shan, X.; Wan, X.; Cui, T. MicroRNAs as novel endogenous targets for regulation and therapeutic treatments. Medchemcomm 2018, 9, 396–408. [Google Scholar] [CrossRef]
  18. Lanford, R.E.; Hildebrandt-Eriksen, E.S.; Petri, A.; Persson, R.; Lindow, M.; Munk, M.E.; Kauppinen, S.; Ørum, H. Therapeutic silencing of microRNA-122 in primates with chronic hepatitis C virus infection. Science 2010, 327, 198–201. [Google Scholar] [CrossRef] [Green Version]
  19. Zhang, S.; Chen, L.; Jung, E.J.; Calin, G.A. Targeting MicroRNAs With Small Molecules: From Dream to Reality. Clin. Pharmacol. Ther. 2010, 87, 754–758. [Google Scholar] [CrossRef] [Green Version]
  20. Guan, N.N.; Sun, Y.Z.; Ming, Z.; Li, J.Q.; Chen, X. Prediction of potential small molecule-associated microRNAs using graphlet interaction. Front. Pharmacol. 2018, 9, 1152. [Google Scholar] [CrossRef]
  21. Li, J.; Lei, K.; Wu, Z.; Li, W.; Liu, G.; Liu, J.; Cheng, F.; Tang, Y. Network-based identification of microRNAs as potential pharmacogenomic biomarkers for anticancer drugs. Oncotarget 2016, 7, 45584. [Google Scholar] [CrossRef] [PubMed] [Green Version]
  22. Qu, J.; Chen, X.; Sun, Y.Z.; Li, J.Q.; Ming, Z. Inferring potential small molecule–miRNA association based on triple layer heterogeneous network. J. Cheminform. 2018, 10, 1–14. [Google Scholar] [CrossRef] [PubMed]
  23. Yin, J.; Chen, X.; Wang, C.C.; Zhao, Y.; Sun, Y.Z. Prediction of Small Molecule-MicroRNA Associations by Sparse Learning and Heterogeneous Graph Inference. Mol. Pharm. 2019, 16, 3157–3166. [Google Scholar] [CrossRef] [PubMed]
  24. Cui, Z.; Gao, Y.L.; Liu, J.X.; Wang, J.; Shang, J.; Dai, L.Y. The computational prediction of drug-disease interactions using the dual-network L2, 1-CMF method. BMC Bioinform. 2019, 20, 1–10. [Google Scholar] [CrossRef] [PubMed] [Green Version]
  25. Wang, S.H.; Wang, C.C.; Huang, L.; Miao, L.Y.; Chen, X. Dual-Network Collaborative Matrix Factorization for predicting small molecule-miRNA associations. Briefings Bioinform. 2022, 23, bbab500. [Google Scholar] [CrossRef]
  26. Chen, X.; Zhou, C.; Wang, C.C.; Zhao, Y. Predicting potential small molecule–miRNA associations based on bounded nuclear norm regularization. Briefings Bioinform. 2021, 22, bbab328. [Google Scholar] [CrossRef]
  27. Liu, X.; Wang, S.; Meng, F.; Wang, J.; Zhang, Y.; Dai, E.; Yu, X.; Li, X.; Jiang, W. SM2miR: A database of the experimentally validated small molecules’ effects on microRNA expression. Bioinformatics 2013, 29, 409–411. [Google Scholar] [CrossRef] [Green Version]
  28. Wang, Y.; Xiao, J.; Suzek, T.O.; Zhang, J.; Wang, J.; Bryant, S.H. PubChem: A public information system for analyzing bioactivities of small molecules. Nucleic Acids Res. 2009, 37, W623–W633. [Google Scholar] [CrossRef]
  29. Knox, C.; Law, V.; Jewison, T.; Liu, P.; Ly, S.; Frolkis, A.; Pon, A.; Banco, K.; Mak, C.; Neveu, V.; et al. DrugBank 3.0: A comprehensive resource for ‘omics’ research on drugs. Nucleic Acids Res. 2010, 39, D1035–D1041. [Google Scholar] [CrossRef] [Green Version]
  30. Lu, M.; Zhang, Q.; Deng, M.; Miao, J.; Guo, Y.; Gao, W.; Cui, Q. An analysis of human microRNA and disease associations. PLoS ONE 2008, 3, e3420. [Google Scholar] [CrossRef] [Green Version]
  31. Jiang, Q.; Wang, Y.; Hao, Y.; Juan, L.; Teng, M.; Zhang, X.; Li, M.; Wang, G.; Liu, Y. miR2Disease: A manually curated database for microRNA deregulation in human disease. Nucleic Acids Res. 2009, 37, D98–D104. [Google Scholar] [CrossRef] [PubMed] [Green Version]
  32. Ruepp, A.; Kowarsch, A.; Schmidl, D.; Buggenthin, F.; Brauner, B.; Dunger, I.; Fobo, G.; Frishman, G.; Montrone, C.; Theis, F.J. PhenomiR: A knowledgebase for microRNA expression in diseases and biological processes. Genome Biol. 2010, 11, 1–11. [Google Scholar] [CrossRef] [PubMed] [Green Version]
  33. Lv, Y.; Wang, S.; Meng, F.; Yang, L.; Wang, Z.; Wang, J.; Chen, X.; Jiang, W.; Li, Y.; Li, X. Identifying novel associations between small molecules and miRNAs based on integrated molecular networks. Bioinformatics 2015, 31, 3638–3644. [Google Scholar] [CrossRef] [PubMed] [Green Version]
  34. Gottlieb, A.; Stein, G.Y.; Ruppin, E.; Sharan, R. PREDICT: A method for inferring novel drug indications with application to personalized medicine. Mol. Syst. Biol. 2011, 7, 496. [Google Scholar] [CrossRef]
  35. Hattori, M.; Okuno, Y.; Goto, S.; Kanehisa, M. Development of a chemical structure comparison method for integrated analysis of chemical and genomic information in the metabolic pathways. J. Am. Chem. Soc. 2003, 125, 11853–11865. [Google Scholar] [CrossRef]
  36. Lv, S.; Li, Y.; Wang, Q.; Ning, S.; Huang, T.; Wang, P.; Sun, J.; Zheng, Y.; Liu, W.; Ai, J.; et al. A novel method to quantify gene set functional association based on gene ontology. J. R. Soc. Interface 2012, 9, 1063–1072. [Google Scholar] [CrossRef] [Green Version]
  37. Kuhn, M.; Campillos, M.; Letunic, I.; Jensen, L.J.; Bork, P. A side effect resource to capture phenotypic effects of drugs. Mol. Syst. Biol. 2010, 6, 343. [Google Scholar] [CrossRef]
  38. Lipscomb, C.E. Medical Subject Headings (MeSH). Bull Med. Libr. Assoc. 2000, 88, 265–266. [Google Scholar]
  39. Zhu, F.; Shi, Z.; Qin, C.; Tao, L.; Liu, X.; Xu, F.; Zhang, L.; Song, Y.; Liu, X.; Zhang, J.; et al. Therapeutic target database update 2012: A resource for facilitating target-oriented drug discovery. Nucleic Acids Res. 2012, 40, D1128–D1136. [Google Scholar] [CrossRef]
  40. Fazel, M. Matrix Rank Minimization with Applications. Ph.D. Thesis, Stanford University, Stanford, CA, USA, 2002. [Google Scholar]
  41. Hu, Y.; Zhang, D.; Ye, J.; Li, X.; He, X. Fast and Accurate Matrix Completion via Truncated Nuclear Norm Regularization. IEEE Trans. Pattern Anal. Mach. Intell. 2013, 35, 2117–2130. [Google Scholar] [CrossRef]
  42. Lee, C.; Lam, E.Y. Computationally Efficient Truncated Nuclear Norm Minimization for High Dynamic Range Imaging. IEEE Trans. Image Process. 2016, 25, 4145–4157. [Google Scholar] [CrossRef] [PubMed]
  43. Cai, J.F.; Candès, E.J.; Shen, Z. A singular value thresholding algorithm for matrix completion. SIAM J. Optim. 2010, 20, 1956–1982. [Google Scholar] [CrossRef]
  44. Chen, C.; He, B.; Yuan, X. Matrix completion via an alternating direction method. IMA J. Numer. Anal. 2012, 32, 227–245. [Google Scholar] [CrossRef]
  45. Khorrami, S.; Zavaran Hosseini, A.; Mowla, S.J.; Soleimani, M.; Rakhshani, N.; Malekzadeh, R. MicroRNA-146a induces immune suppression and drug-resistant colorectal cancer cells. Tumor Biol. 2017, 39, 1010428317698365. [Google Scholar] [CrossRef] [Green Version]
  46. Zhang, C.l.; Wang, H.; Yan, C.y.; Gao, X.f.; Ling, X.j. Deregulation of RUNX2 by miR-320a deficiency impairs steroidogenesis in cumulus granulosa cells from polycystic ovary syndrome (PCOS) patients. Biochem. Biophys. Res. Commun. 2017, 482, 1469–1476. [Google Scholar] [CrossRef]
  47. Yu, X.; Shi, W.; Zhang, Y.; Wang, X.; Sun, S.; Song, Z.; Liu, M.; Zeng, Q.; Cui, S.; Qu, X. CXCL12/CXCR4 axis induced miR-125b promotes invasion and confers 5-fluorouracil resistance through enhancing autophagy in colorectal cancer. Sci. Rep. 2017, 7, 1–13. [Google Scholar] [CrossRef]
  48. Yin, J.; Shen, X.; Li, M.; Ni, F.; Xu, L.; Lu, H. miR-329 regulates the sensitivity of 5-FU in chemotherapy of colorectal cancer by targeting E2F1. Oncol. Lett. 2018, 16, 3587–3592. [Google Scholar] [CrossRef] [Green Version]
  49. Peng, J.; Mo, R.; Ma, J.; Fan, J. let-7b and let-7c are determinants of intrinsic chemoresistance in renal cell carcinoma. World J. Surg. Oncol. 2015, 13, 1–8. [Google Scholar] [CrossRef] [Green Version]
  50. Wang, T.; Huang, B.; Guo, R.; Ma, J.; Peng, C.; Zu, X.; Tang, H.; Lei, X. A let-7b binding site SNP in the 3’-UTR of the Bcl-xL gene enhances resistance to 5-fluorouracil and doxorubicin in breast cancer cells. Oncol. Lett. 2015, 9, 1907–1911. [Google Scholar] [CrossRef]
  51. Bamodu, O.A.; Yang, C.K.; Cheng, W.H.; Tzeng, D.T.; Kuo, K.T.; Huang, C.C.; Deng, L.; Hsiao, M.; Lee, W.H.; Yeh, C.T. 4-Acetyl-antroquinonol B suppresses SOD2-enhanced cancer stem cell-like phenotypes and chemoresistance of colorectal cancer cells by inducing hsa-miR-324 re-expression. Cancers 2018, 10, 269. [Google Scholar] [CrossRef] [Green Version]
  52. Han, J.; Liu, Z.; Wang, N.; Pan, W. MicroRNA-874 inhibits growth, induces apoptosis and reverses chemoresistance in colorectal cancer by targeting X-linked inhibitor of apoptosis protein. Oncol. Rep. 2016, 36, 542–550. [Google Scholar] [CrossRef] [PubMed] [Green Version]
  53. Liu, Y.; Dong, Z.; Liang, J.; Guo, Y.; Guo, X.; Shen, S.; Kuang, G.; Guo, W. Methylation-mediated repression of potential tumor suppressor miR-203a and miR-203b contributes to esophageal squamous cell carcinoma development. Tumor Biol. 2016, 37, 5621–5632. [Google Scholar] [CrossRef] [PubMed]
  54. Li, Y.; Xu, Z.; Li, B.; Zhang, Z.; Luo, H.; Wang, Y.; Lu, Z.; Wu, X. Epigenetic silencing of miRNA-9 is correlated with promoter-proximal CpG island hypermethylation in gastric cancer in vitro and in vivo. Int. J. Oncol. 2014, 45, 2576–2586. [Google Scholar] [CrossRef] [PubMed] [Green Version]
  55. Xu, W.Q.; Huang, Y.M.; Xiao, H.F. Expression analysis and epigenetics of microRNA let-7b in acute lymphoblastic leukemia. Zhongguo Shi Yan Xue Ye Xue Za Zhi 2015, 23, 1535–1541. [Google Scholar] [PubMed]
  56. Sun, J.; Song, Y.; Wang, Z.; Wang, G.; Gao, P.; Chen, X.; Gao, Z.; Xu, H. Clinical significance of promoter region hypermethylation of microRNA-148a in gastrointestinal cancers. OncoTargets Ther. 2014, 7, 853. [Google Scholar]
  57. Correia de Sousa, M.; Gjorgjieva, M.; Dolicka, D.; Sobolewski, C.; Foti, M. Deciphering miRNAs’ action through miRNA editing. Int. J. Mol. Sci. 2019, 20, 6249. [Google Scholar] [CrossRef] [Green Version]
  58. Yu, S.; Wang, M.; Pang, S.; Song, L.; Qiao, S. Intelligent fault diagnosis and visual interpretability of rotating machinery based on residual neural network. Measurement 2022, 196, 111228. [Google Scholar] [CrossRef]
  59. Yang, J.; Yuan, X. Linearized augmented Lagrangian and alternating direction methods for nuclear norm minimization. Math. Comput. 2013, 82, 301–329. [Google Scholar] [CrossRef] [Green Version]
Figure 1. The framework of AMCSMMA. (1) Integrating different biological data similarities. (2) Constructing the SM–miRNA heterogeneous network and the target matrix. (3) Constructing the objective function and the optimization algorithm. (4) Obtaining the prediction score matrix through matrix division.
Cells 12 01123 g001
Figure 2. The influence of parameter r on the predictive performance of AMCSMMA.
Cells 12 01123 g002
Figure 3. The ROC curve and AUC value of Validation Experiment B.
Cells 12 01123 g003
Figure 4. (a) The ROC curves and AUC values of five folds based on Dataset 1. (b) The ROC curves and AUC values of five folds based on Dataset 2.
Cells 12 01123 g004
Table 1. The main innovative points and limitations of the proposed models.
ModelMain Innovative PointsMain Limitations
BNNRSMMABounded nuclear normFailing to obtain the unbiased solution and adjust the target rank
DCMFWKNKN methodFailing to adjust the target rank
TLHNSMMATriple layer heterogeneous networkFailing to predict miRNAs/SMs associated with new SMs/miRNAs
GISMMAGraphlet interactionsFailing to avoid noise interference
SLHGISMMASparse learning method (SLM)Failing to restrict prediction scores in [0, 1]
SMiR-NBIResources allocationFailing to predict miRNAs/SMs associated with new SMs/miRNAs
Table 2. The complete data information for three datasets.
DatasetNumber of SMs: n s Number of miRNAs: n m Number of Known AssociationsNumber of Unknown AssociationsDimension of Association Matrix
Dataset 1831541664448,907 831 × 541
Dataset 23928666410,490 39 × 286
Dataset 3831541132449,439 831 × 541
Table 3. The result of Experiment B in terms of the Precision, Recall, F1 Score, Accuracy, and MCC value.
Threshold SettingPrecisionRecallF1 ScoreAccuracyMCC
t 1 0.98510.98610.98560.98550.9711
t 2 0.98820.98300.98550.98560.9708
t 3 0.98680.98390.98520.98530.9713
Note: t 1 , t 2 , and t 3 are the thresholds that maximize the F1 Score, Accuracy, and MCC separately.
Table 4. The result comparison in terms of the AUC values between AMCSMMA, BNNRSMMA, DCMF, TLHNSMMA, GISMMA, SLHGISMMA, and SMiR-NBI in four kinds of cross-validation experiments based on two datasets.
DatasetModel5-Fold CVGlobal LOOCVmiRNA-Fixed Local LOOCVSM-Fixed Local LOOCV
Dataset1AMCSMMA 0 . 9910 ± 0 . 0004 0 . 9923 0 . 9898 0.8222
BNNRSMMA0.9758 ± 0.00290.98220.97930.8253
DCMF0.9836 ± 0.00300.98680.98330.8377
TLHNSMMA0.9851 ± 0.00120.98590.98450.7645
GISMMA0.9263 ± 0.00260.92910.95050.7702
SLHGISMMA0.9241 ± 0.00520.92730.93650.7703
SMiR-NBI0.8554 ± 0.00630.88430.88370.7497
Dataset2AMCSMMA 0 . 8768 ± 0 . 0039 0 . 8861 0 . 8880 0.7232
BNNRSMMA0.8759 ± 0.00410.84330.88520.7350
DCMF0.8632 ± 0.00420.87700.88360.7591
TLHNSMMA0.8168 ± 0.00220.81490.82440.6057
GISMMA0.8088 ± 0.00440.82030.86400.6591
SLHGISMMA0.7724 ± 0.00320.77740.79730.6556
SMiR-NBI0.7104 ± 0.00870.72640.78460.6100
Note: Each bold value means that it is the best value in the experiment.
Table 5. The top 20 SM–miRNA associations predicted by AMCSMMA in the first type of case study.
Small MoleculemiRNAEvidenceSmall MoleculemiRNAEvidence
CID:3385hsa-mir-125b-128176874CID:3385hsa-let-7b25789066
CID:3385hsa-mir-125b-228176874CID:3385hsa-mir-12626062749
CID:36314hsa-mir-518cunconfirmedCID:3385hsa-mir-26a-2unconfirmed
CID:3385hsa-mir-26a-1unconfirmedCID:3229hsa-let-7gunconfirmed
CID:3385hsa-mir-10726636340CID:3385hsa-mir-181b-119948396
CID:3229hsa-let-7eunconfirmedCID:3385hsa-mir-146a28466779
CID:3385hsa-mir-103a-1unconfirmedCID:451668hsa-mir-15bunconfirmed
CID:3229hsa-mir-27bunconfirmedCID:60750hsa-mir-23aunconfirmed
CID:451668hsa-mir-23aunconfirmedCID:3229hsa-mir-27aunconfirmed
CID:3385hsa-mir-181a-129795190CID:3385hsa-mir-15528347920
Note: (1) The top 1–10 associations and corresponding evidence are presented in the first three columns, while the top 11–20 are presented in the last three columns. (2) CID denotes the compound number from the Pubchem database. (3) Evidence shows the PubMed IDs of the experimental literature.
Table 6. The number of confirmed SM–miRNA associations in the top 20 associations predicted by AMCSMMA and other models separately.
AMCSMMABNNRSMMADCMFTLHNSMMAGISMMASLHGISMMA
Number967715
Table 7. The top 50 SM–miRNA associations predicted by AMCSMMA in the second type of case study to the SM 5-FU.
miRNAEvidencemiRNAEvidence
hsa-let-7a-126198104hsa-mir-217unconfirmed
hsa-let-7b25789066hsa-mir-23a26198104
hsa-let-7c25951903hsa-mir-24-226198104
hsa-let-7d26198104hsa-mir-26a-1unconfirmed
hsa-mir-122626198104hsa-mir-27a26198104
hsa-mir-125b-128176874hsa-mir-299unconfirmed
hsa-mir-125b-228176874hsa-mir-320a26198104
hsa-mir-128-126198104hsa-mir-32430103475
hsa-mir-128-226198104hsa-mir-328unconfirmed
hsa-mir-13226198104hsa-mir-329-130127965
hsa-mir-133a-126198104hsa-mir-329-230127965
hsa-mir-13927173050hsa-mir-34226198104
hsa-mir-15528347920hsa-mir-345unconfirmed
hsa-mir-16-126198104hsa-mir-346unconfirmed
hsa-mir-18a26198104hsa-mir-34bunconfirmed
hsa-mir-181a-129795190hsa-mir-372unconfirmed
hsa-mir-181a-224462870hsa-mir-409unconfirmed
hsa-mir-181b-119948396hsa-mir-412unconfirmed
hsa-mir-181b-219948396hsa-mir-431unconfirmed
hsa-mir-24-126198104hsa-mir-45521743970
hsa-mir-19726198104hsa-mir-500aunconfirmed
hsa-mir-199a-226198104hsa-mir-50126198104
hsa-mir-202unconfirmedhsa-mir-518cunconfirmed
hsa-mir-2126198104hsa-mir-650unconfirmed
hsa-mir-212unconfirmedhsa-mir-87427221209
Note: (1) Evidence shows the PubMed IDs of the experimental literature. (2) “26198104" denotes the SM2miR v1.0 database [27]. (3) 20 (34) of the top 20 (50) associations were verified successfully.
Table 8. The top 50 SM–miRNA associations predicted by AMCSMMA in the second type of case study to the SM 5-Aza-2’-deoxycytidine.
miRNAEvidencemiRNAEvidence
hsa-mir-125b-126198104hsa-mir-197unconfirmed
hsa-mir-125b-226198104hsa-mir-199a-2unconfirmed
hsa-mir-203a26577858hsa-mir-133a-1unconfirmed
hsa-let-7b26708866hsa-mir-133a-2unconfirmed
hsa-let-7c24704393hsa-mir-20a26198104
hsa-let-7d26802971hsa-mir-200c23626803
hsa-mir-19b-125270964hsa-let-7a-1unconfirmed
hsa-mir-132unconfirmedhsa-mir-205unconfirmed
hsa-mir-181a-126198104hsa-mir-2126198104
hsa-mir-181a-226198104hsa-mir-221unconfirmed
hsa-mir-13723200812hsa-mir-222unconfirmed
hsa-mir-141unconfirmedhsa-mir-23a25213664
hsa-mir-14526198104hsa-mir-24-226198104
hsa-mir-148a24920927hsa-mir-26a-1unconfirmed
hsa-mir-149unconfirmedhsa-mir-27a26198104
hsa-mir-15526198104hsa-mir-27b26198104
hsa-mir-16-126198104hsa-mir-29a26198104
hsa-mir-1726198104hsa-mir-324unconfirmed
hsa-mir-18aunconfirmedhsa-mir-32823991164
hsa-mir-19a26198104hsa-mir-342unconfirmed
hsa-mir-1226unconfirmedhsa-mir-346unconfirmed
hsa-mir-181b-1unconfirmedhsa-mir-500aunconfirmed
hsa-mir-181b-2unconfirmedhsa-mir-501unconfirmed
hsa-mir-24-126198104hsa-mir-650unconfirmed
hsa-mir-194-1unconfirmedhsa-mir-874unconfirmed
Note: (1) Evidence shows the PubMed IDs of the experimental literature. (2) “26198104" denotes the SM2miR v1.0 database [27]. (3) 16 (26) of the top 20 (50) associations were verified successfully.
Table 9. The number of confirmed SM–miRNA associations in the top 20/50 associations predicted by AMCSMMA, BNNRSMMA, and DCMF.
ModelNumber ANumber BNumber CNumber D
AMCSMMA20341626
BNNRSMMA17321627
DCMF17291627
Note: Number A/B denotes the number of confirmed SM–miRNA associations in the top 20/50 associations to SM 5-FU. Number C/D denotes the number of confirmed SM–miRNA associations in the top 20/50 associations to SM 5-Aza-2’-deoxycytidine.
Disclaimer/Publisher’s Note: The statements, opinions and data contained in all publications are solely those of the individual author(s) and contributor(s) and not of MDPI and/or the editor(s). MDPI and/or the editor(s) disclaim responsibility for any injury to people or property resulting from any ideas, methods, instructions or products referred to in the content.

