
Heparanase Modulates Chromatin Accessibility
 , , and
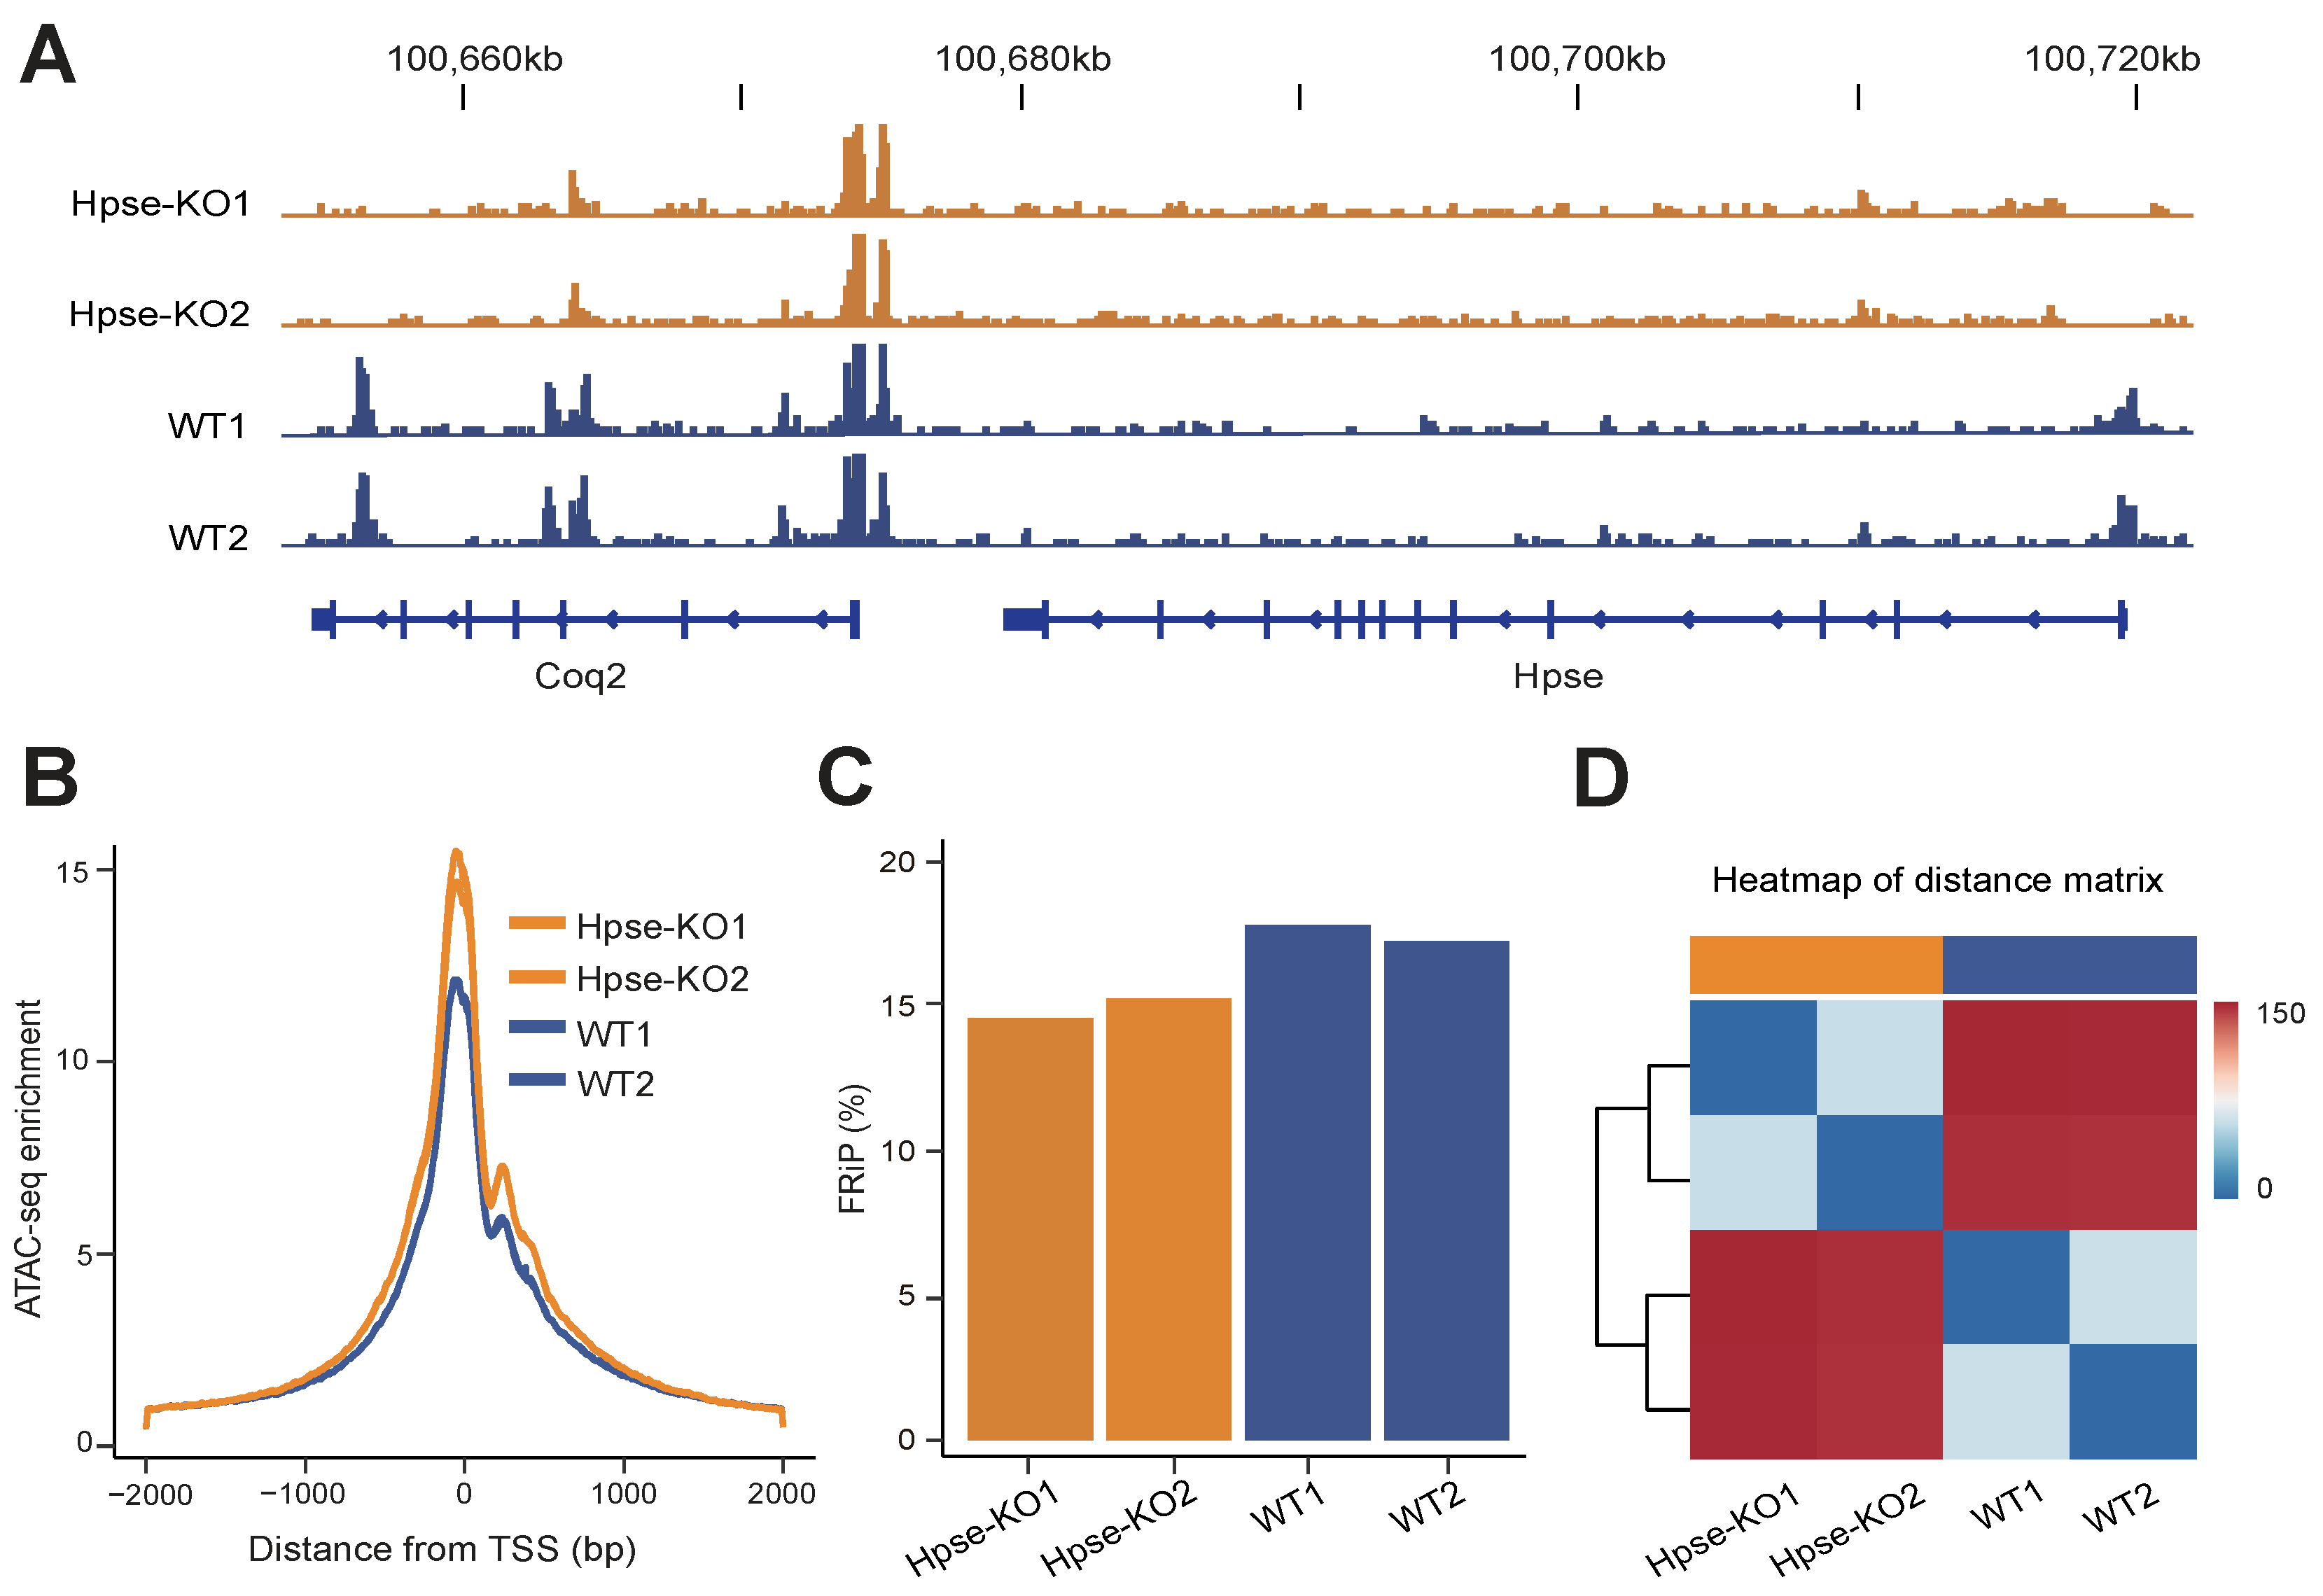
Abstract
:1. Introduction
2. Materials and Methods
Statistical Analysis
3. Results
3.1. Suppressed Activity of Promoters in Hpse-KO MEFs
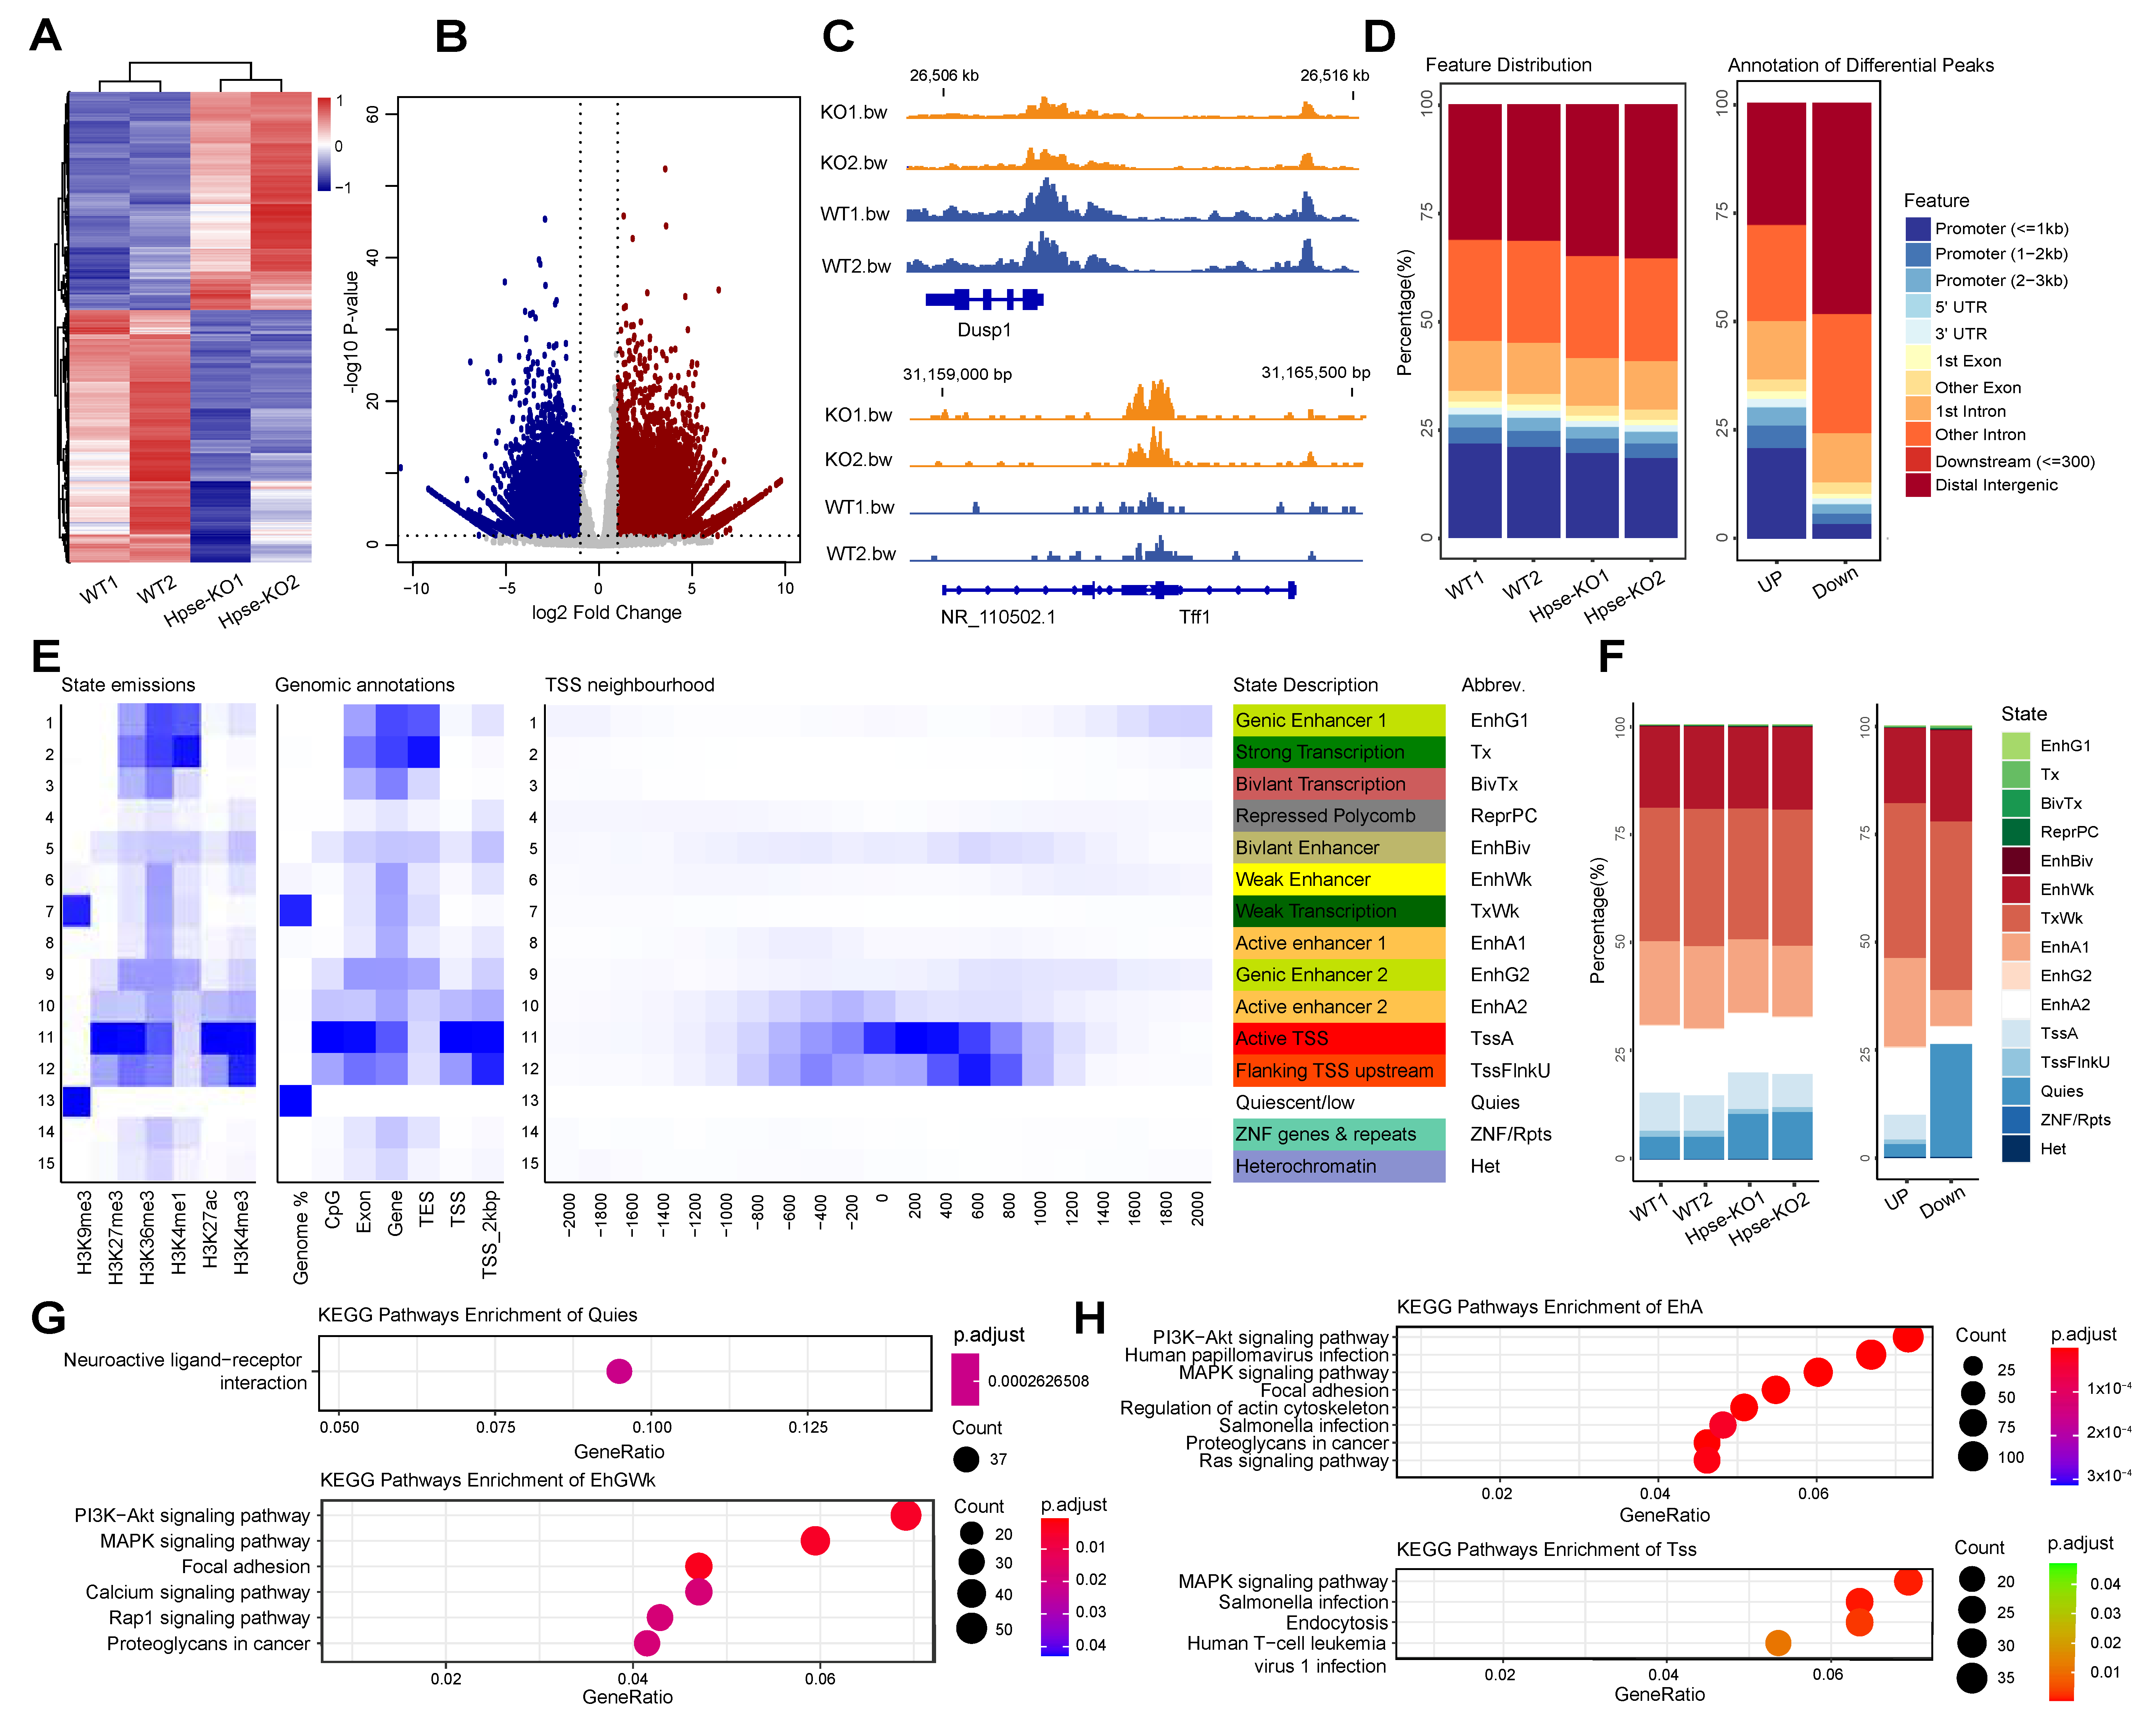
3.2. Identification and Characterization of Significantly Differential Peaks
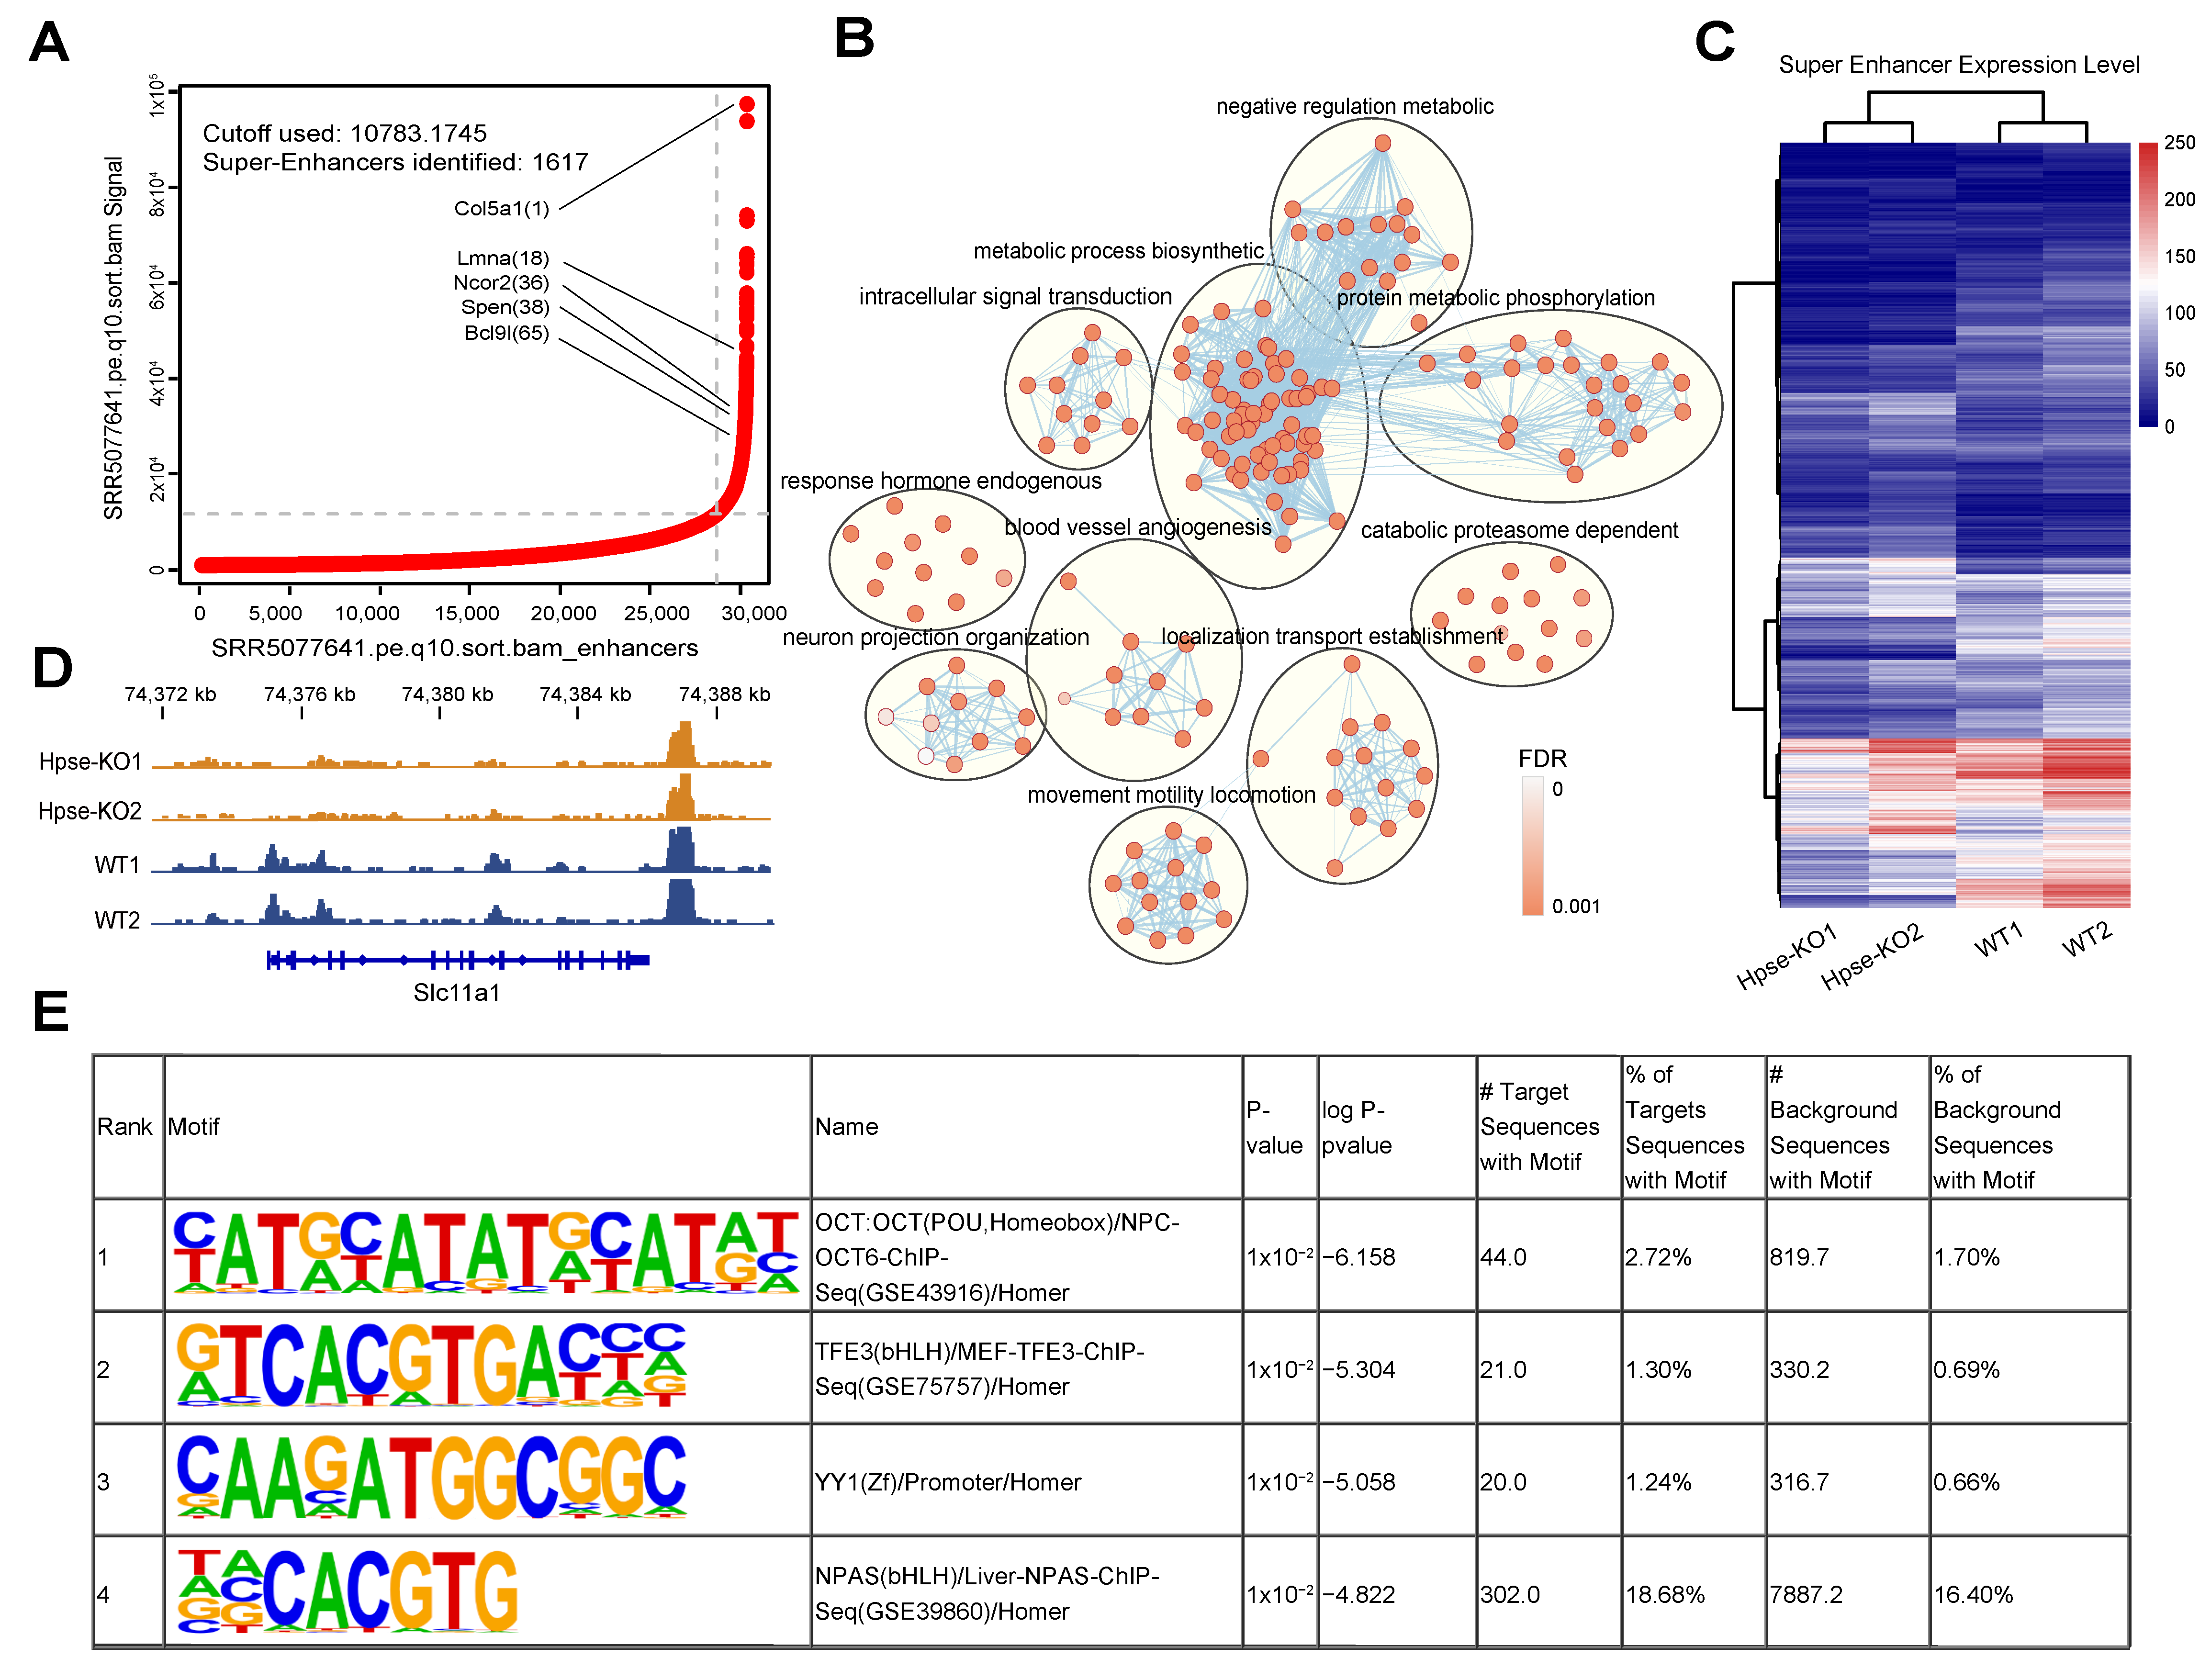
3.3. Suppressed Super-Enhancer in Hpse-KO MEFs
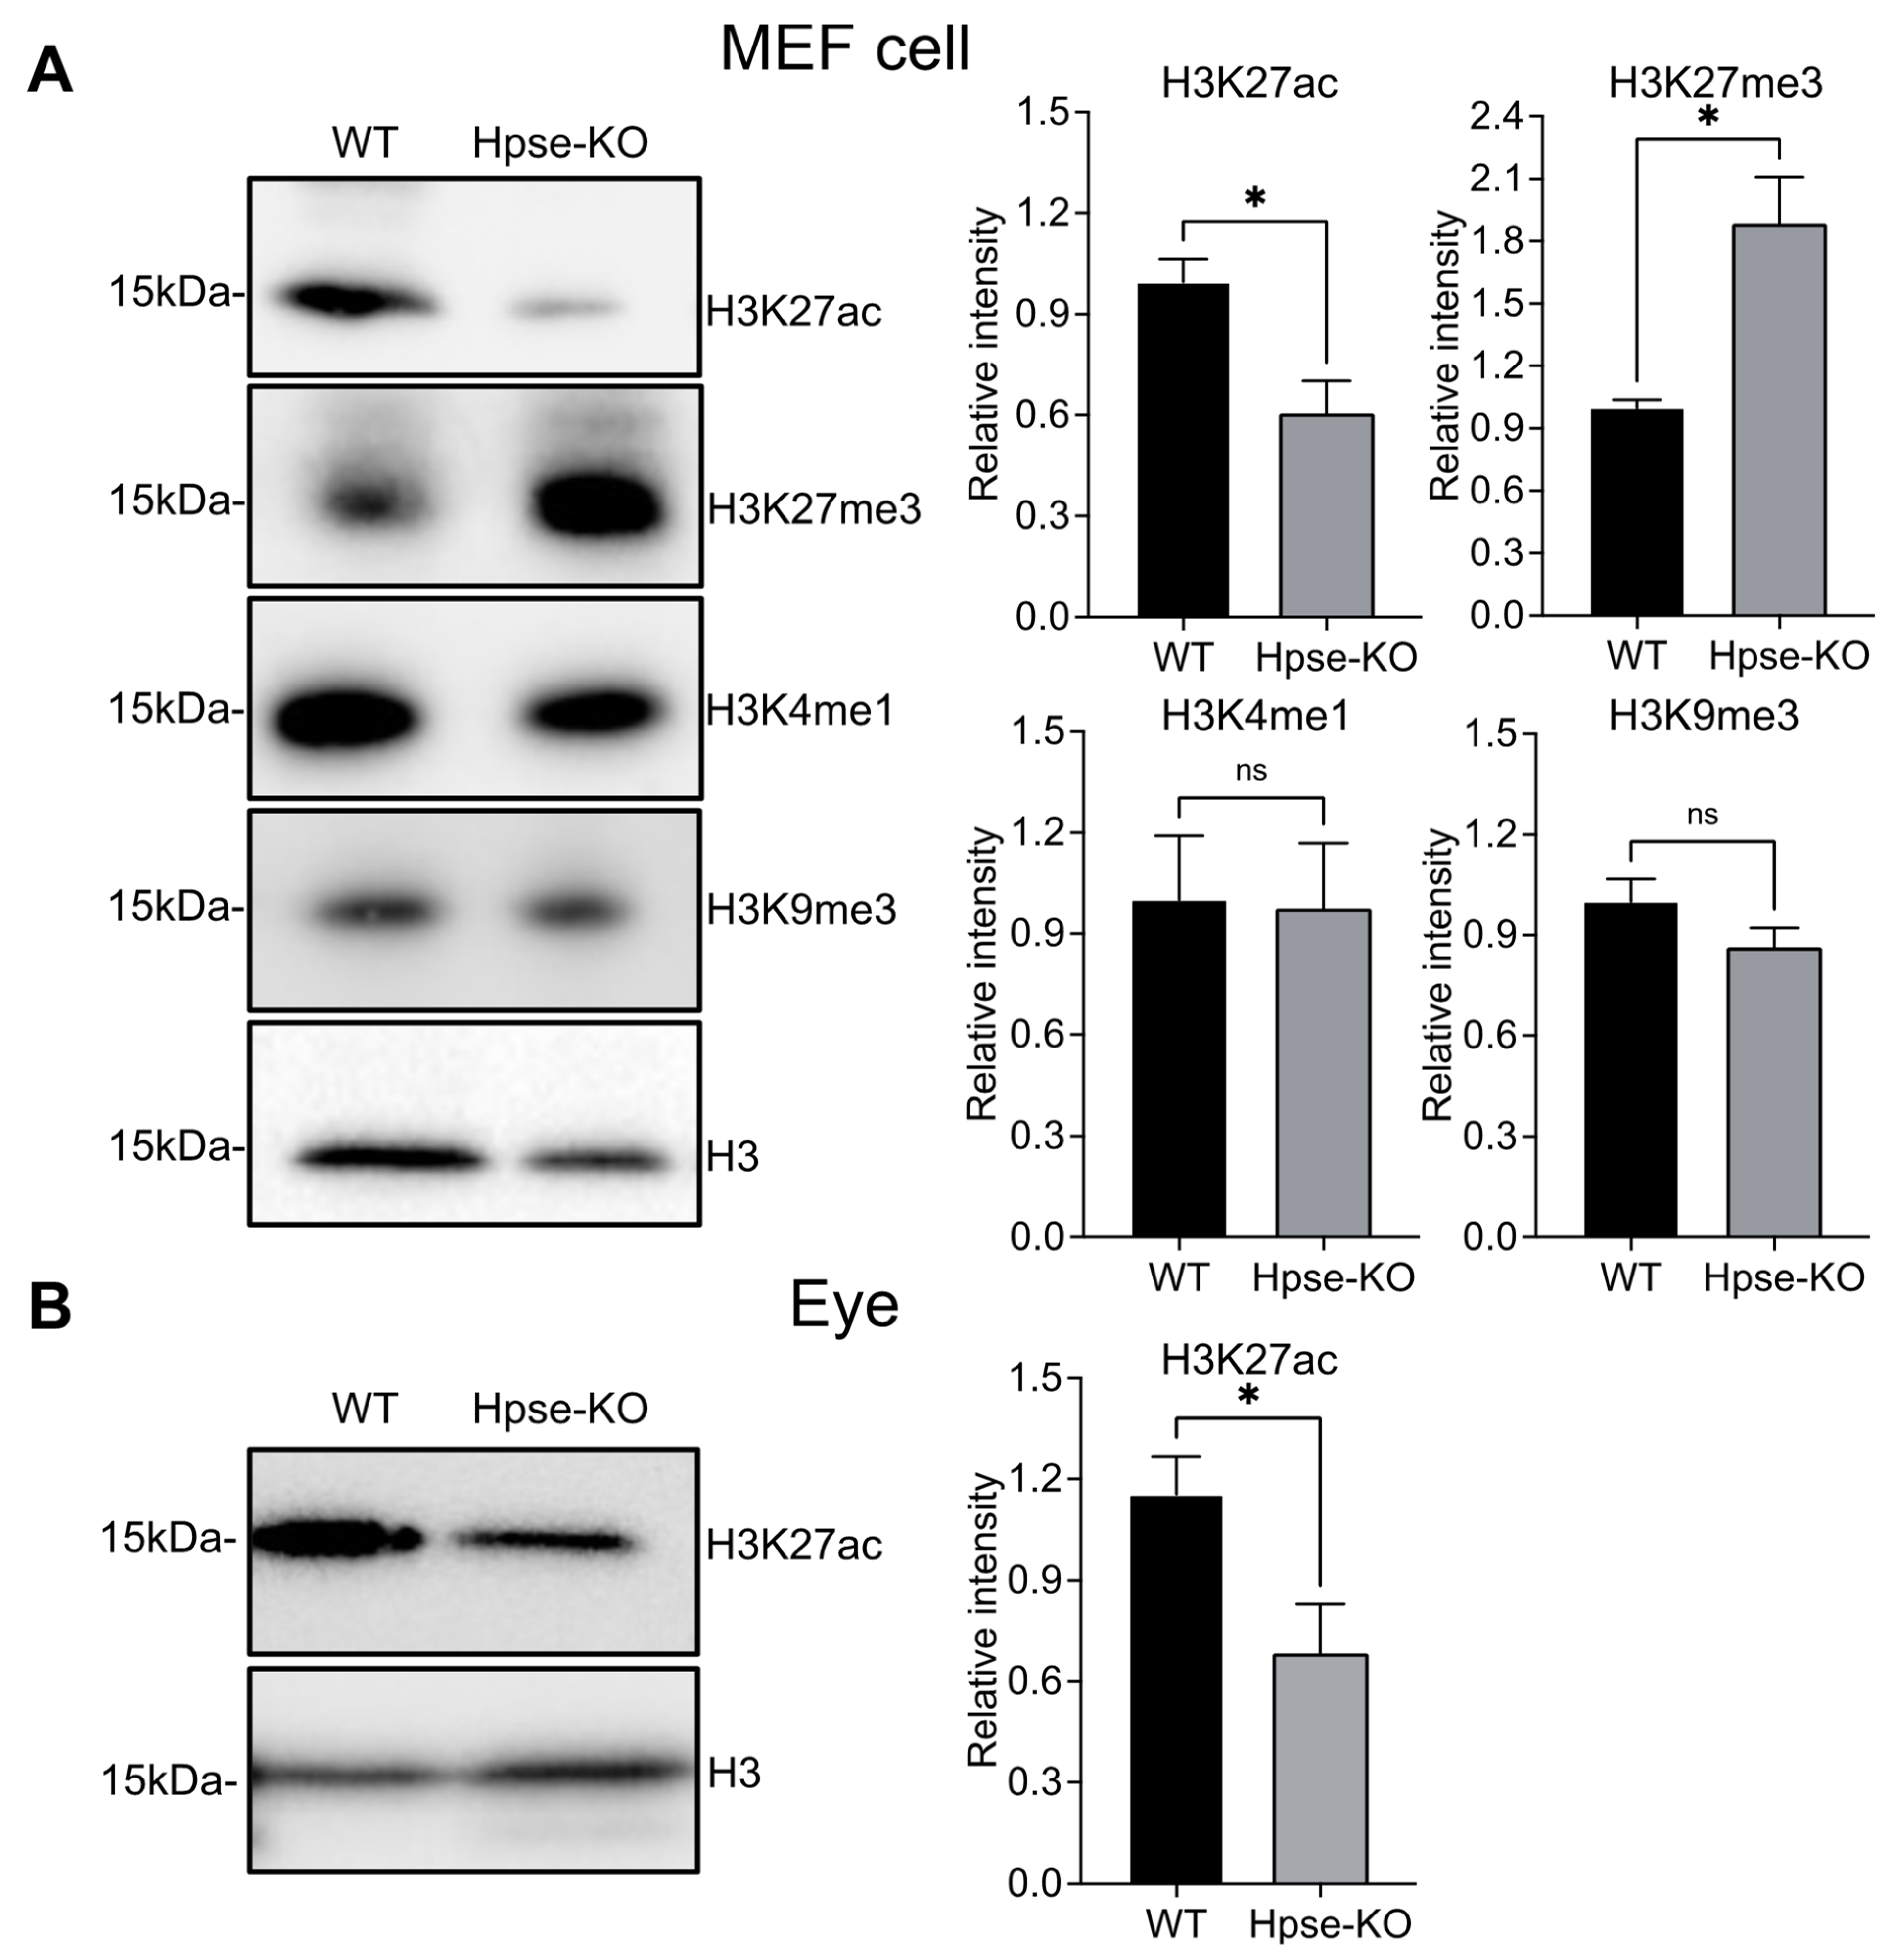
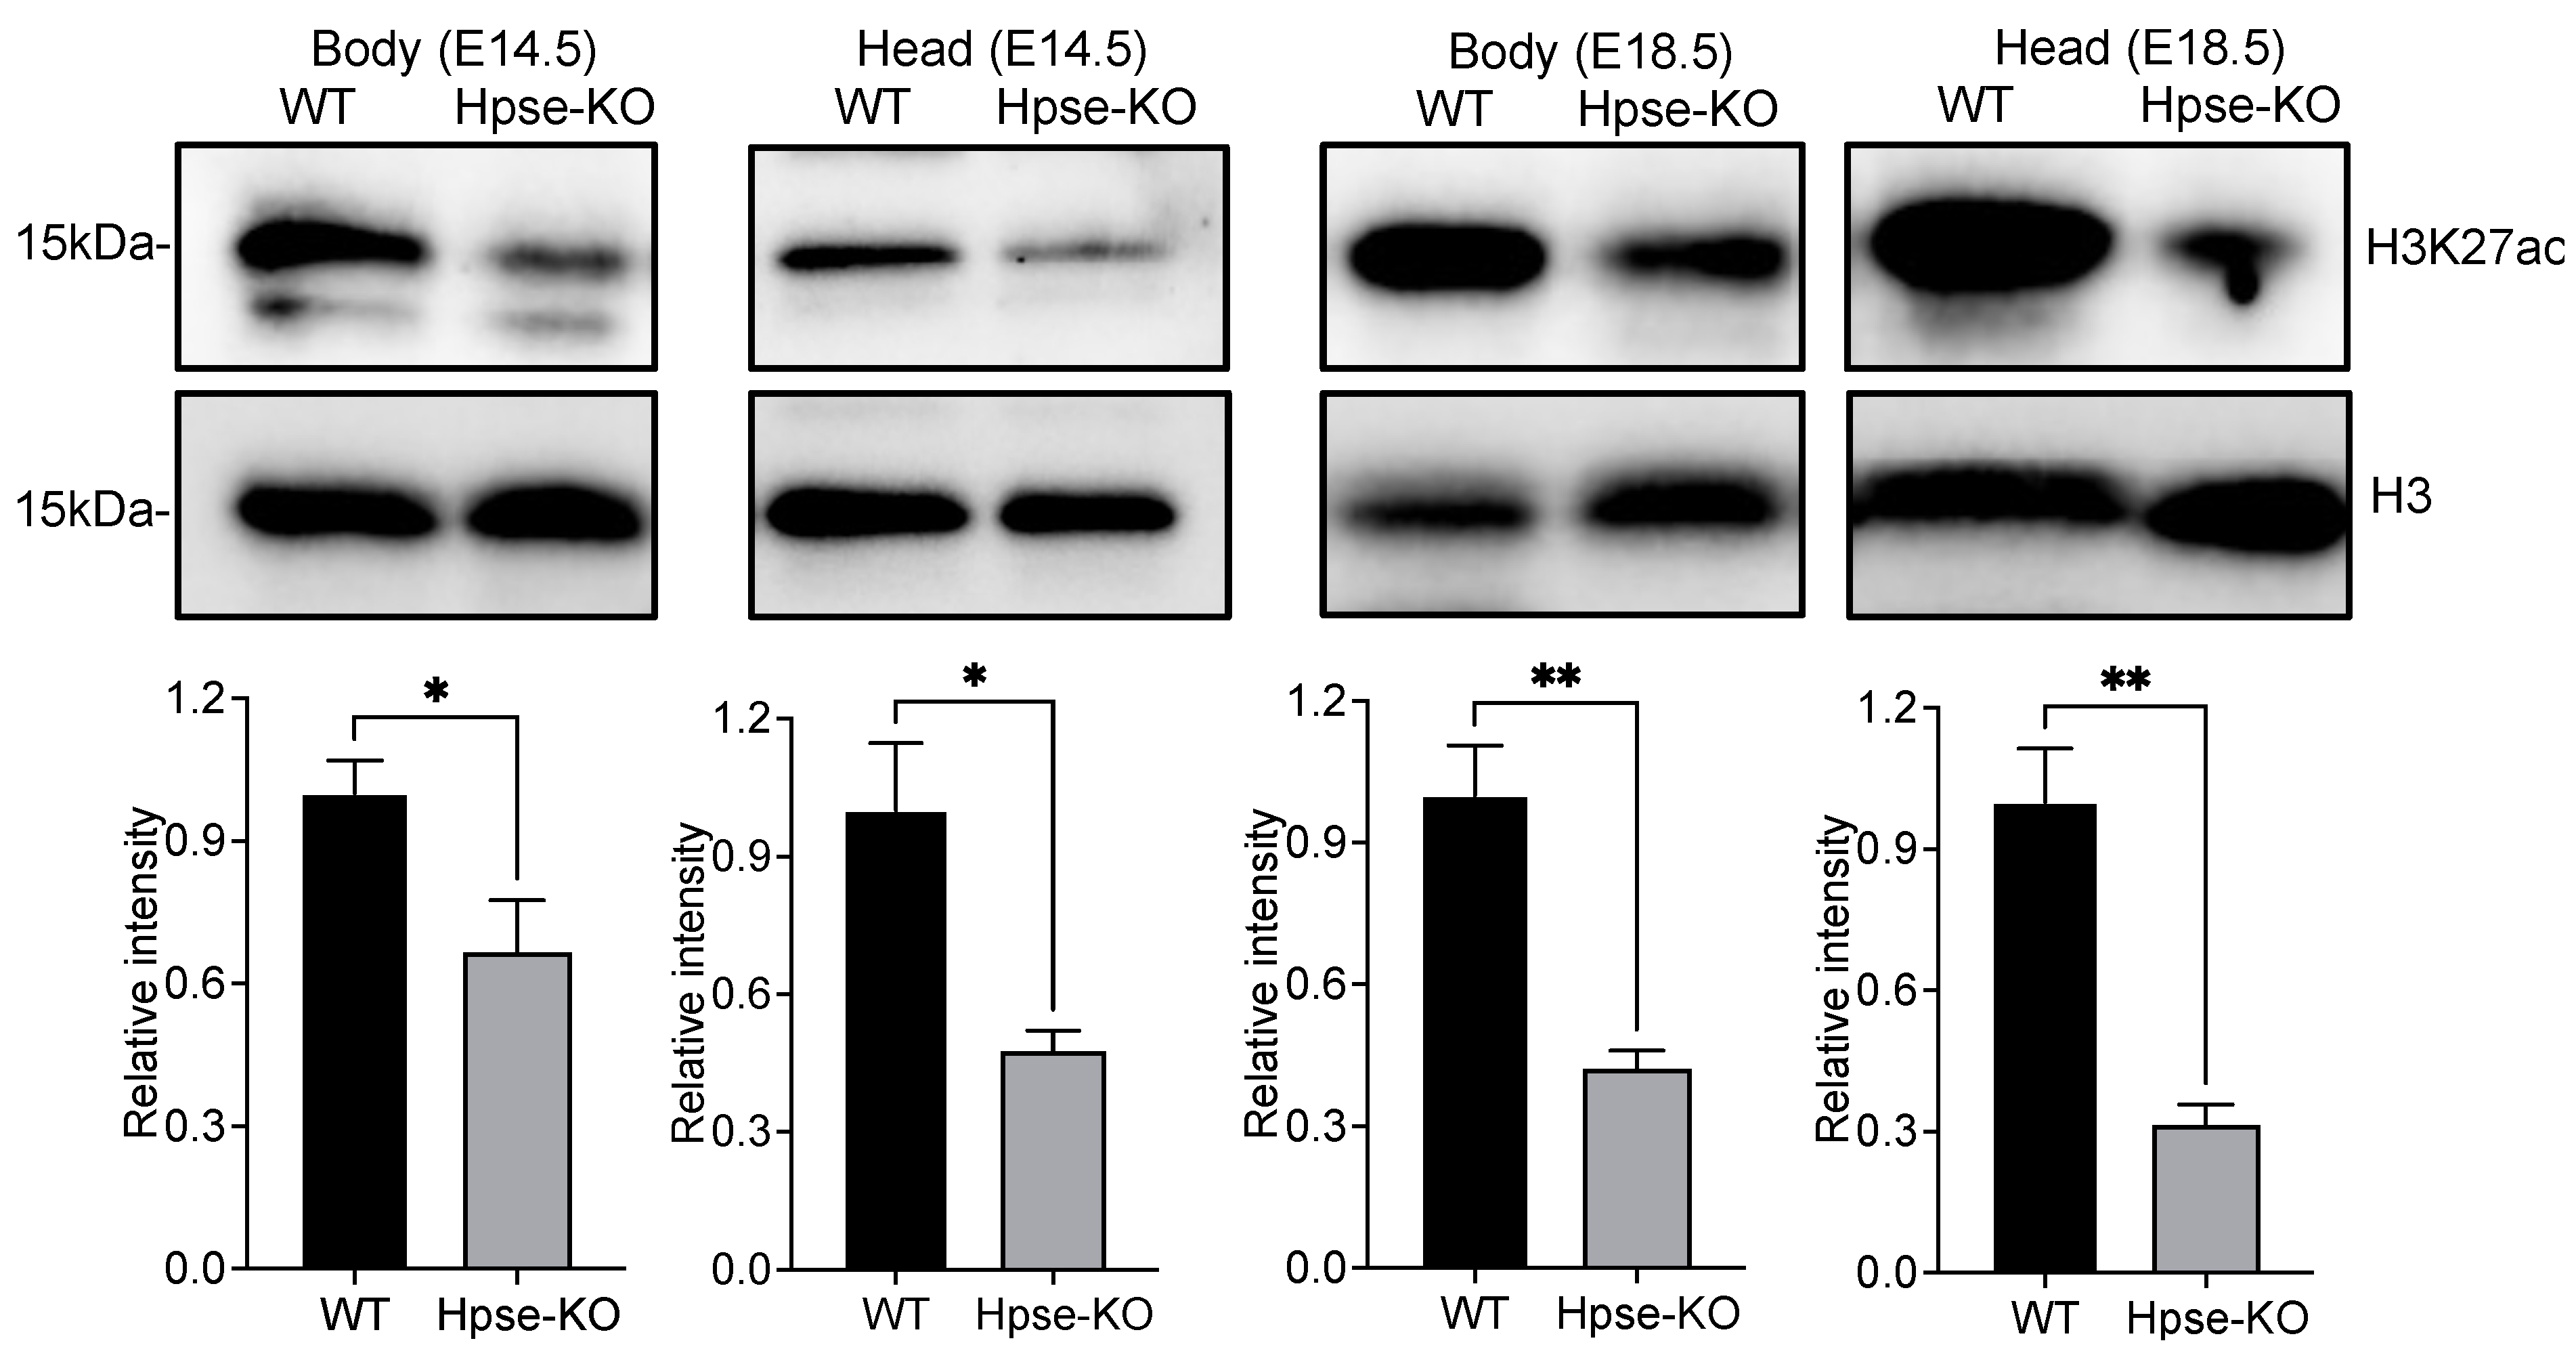
3.4. Histone Modifications of H3 in Hpse-KO MEFs and Organs
4. Discussion
Author Contributions
Funding
Institutional Review Board Statement
Informed Consent Statement
Data Availability Statement
Conflicts of Interest
References
- Wu, L.; Viola, C.M.; Brzozowski, A.M.; Davies, G.J. Structural characterization of human heparanase reveals insights into substrate recognition. Nat. Struct. Mol. Biol. 2015, 22, 1016–1022. [Google Scholar] [CrossRef] [Green Version]
- Jayatilleke, K.M.; Hulett, M.D. Heparanase and the hallmarks of cancer. J. Transl. Med. 2020, 18, 453. [Google Scholar] [CrossRef] [PubMed]
- Mayfosh, A.J.; Nguyen, T.K.; Hulett, M.D. The Heparanase Regulatory Network in Health and Disease. Int. J. Mol. Sci. 2021, 22, 11096. [Google Scholar] [CrossRef]
- Vlodavsky, I.; Singh, P.; Boyango, I.; Gutter-Kapon, L.; Elkin, M.; Sanderson, R.D.; Ilan, N. Heparanase: From basic research to therapeutic applications in cancer and inflammation. Drug Resist. Updat. 2016, 29, 54–75. [Google Scholar] [CrossRef] [PubMed] [Green Version]
- Weissmann, M.; Arvatz, G.; Horowitz, N.; Feld, S.; Naroditsky, I.; Zhang, Y.; Ng, M.; Hammond, E.; Nevo, E.; Vlodavsky, I.; et al. Heparanase-neutralizing antibodies attenuate lymphoma tumor growth and metastasis. Proc. Natl. Acad. Sci. USA 2016, 113, 704–709. [Google Scholar] [CrossRef] [Green Version]
- Agelidis, A.; Suryawanshi, R.K.; Patil, C.D.; Campeau, A.; Gonzalez, D.J.; Shukla, D. Dissociation of DNA damage sensing by endoglycosidase HPSE. iScience 2021, 24, 102242. [Google Scholar] [CrossRef]
- Mayfosh, A.J.; Goodall, K.J.; Nguyen, T.; Baschuk, N.; Hulett, M.D. Heparanase is a regulator of natural killer cell activation and cytotoxicity. J. Leukoc. Biol. 2022, 111, 1211–1224. [Google Scholar] [CrossRef]
- Karamanos, N.K.; Piperigkou, Z.; Passi, A.; Gotte, M.; Rousselle, P.; Vlodavsky, I. Extracellular matrix-based cancer targeting. Trends Mol. Med. 2021, 27, 1000–1013. [Google Scholar] [CrossRef]
- Lerner, I.; Hermano, E.; Zcharia, E.; Rodkin, D.; Bulvik, R.; Doviner, V.; Rubinstein, A.M.; Ishai-Michaeli, R.; Atzmon, R.; Sherman, Y.; et al. Heparanase powers a chronic inflammatory circuit that promotes colitis-associated tumorigenesis in mice. J. Clin. Investig. 2011, 121, 1709–1721. [Google Scholar] [CrossRef] [PubMed]
- Schmidt, E.P.; Yang, Y.; Janssen, W.J.; Gandjeva, A.; Perez, M.J.; Barthel, L.; Zemans, R.L.; Bowman, J.C.; Koyanagi, D.E.; Yunt, Z.X.; et al. The pulmonary endothelial glycocalyx regulates neutrophil adhesion and lung injury during experimental sepsis. Nat. Med. 2012, 18, 1217–1223. [Google Scholar] [CrossRef] [Green Version]
- Xie, M.; Li, J.P. Heparan sulfate proteoglycan—A common receptor for diverse cytokines. Cell. Signal. 2019, 54, 115–121. [Google Scholar] [CrossRef] [PubMed]
- Freeman, C.; Hopwood, J. Lysosomal degradation of heparin and heparan sulphate. Adv. Exp. Med. Biol. 1992, 313, 121–134. [Google Scholar] [PubMed]
- Sanderson, R.D.; Bandari, S.K.; Vlodavsky, I. Proteases and glycosidases on the surface of exosomes: Newly discovered mechanisms for extracellular remodeling. Matrix Biol. 2019, 75–76, 160–169. [Google Scholar] [CrossRef]
- Ishihara, M.; Fedarko, N.S.; Conrad, H.E. Transport of heparan sulfate into the nuclei of hepatocytes. J. Biol. Chem. 1986, 261, 13575–13580. [Google Scholar] [CrossRef] [PubMed]
- Stewart, M.D.; Sanderson, R.D. Heparan sulfate in the nucleus and its control of cellular functions. Matrix Biol. 2014, 35, 56–59. [Google Scholar] [CrossRef]
- Li, M.; Yuan, S.; Chen, J.; Lv, L.; Guo, S.; Zhou, W. Design and synthesis of structurally defined heparan sulfate (HS)-FK506 conjugates as an exogenous approach to investigate biological functions of nucleus HS. Bioorg. Chem. 2018, 81, 203–210. [Google Scholar] [CrossRef]
- Schubert, S.Y.; Ilan, N.; Shushy, M.; Ben-Izhak, O.; Vlodavsky, I.; Goldshmidt, O. Human heparanase nuclear localization and enzymatic activity. Lab. Investig. J. Tech. Methods Pathol. 2004, 84, 535–544. [Google Scholar] [CrossRef] [PubMed] [Green Version]
- Amin, R.; Tripathi, K.; Sanderson, R.D. Nuclear Heparanase Regulates Chromatin Remodeling, Gene Expression and PTEN Tumor Suppressor Function. Cells 2020, 9, 2038. [Google Scholar] [CrossRef] [PubMed]
- Yang, S.; Liao, Y.; Zhao, Q.; Xie, Y.; Zheng, A.; Wan, H. Heparanase Is a Critical Regulator of Mitotic Spindles Required for Maintaining Chromosome Stability. DNA Cell Biol. 2018, 37, 291–297. [Google Scholar] [CrossRef]
- He, Y.Q.; Sutcliffe, E.L.; Bunting, K.L.; Li, J.; Goodall, K.J.; Poon, I.K.; Hulett, M.D.; Freeman, C.; Zafar, A.; McInnes, R.L.; et al. The endoglycosidase heparanase enters the nucleus of T lymphocytes and modulates H3 methylation at actively transcribed genes via the interplay with key chromatin modifying enzymes. Transcription 2012, 3, 130–145. [Google Scholar] [CrossRef] [Green Version]
- Lindahl, U.; Li, J.P. Heparanase—Discovery and Targets. Adv. Exp. Med. Biol. 2020, 1221, 61–69. [Google Scholar]
- Fux, L.; Ilan, N.; Sanderson, R.D.; Vlodavsky, I. Heparanase: Busy at the cell surface. Trends Biochem. Sci. 2009, 34, 511–519. [Google Scholar] [CrossRef] [PubMed] [Green Version]
- Buenrostro, J.D.; Giresi, P.G.; Zaba, L.C.; Chang, H.Y.; Greenleaf, W.J. Transposition of native chromatin for fast and sensitive epigenomic profiling of open chromatin, DNA-binding proteins and nucleosome position. Nat. Methods 2013, 10, 1213–1218. [Google Scholar] [CrossRef] [PubMed]
- Zcharia, E.; Jia, J.; Zhang, X.; Baraz, L.; Lindahl, U.; Peretz, T.; Vlodavsky, I.; Li, J.P. Newly generated heparanase knock-out mice unravel co-regulation of heparanase and matrix metalloproteinases. PLoS ONE 2009, 4, e5181. [Google Scholar] [CrossRef] [PubMed] [Green Version]
- Jia, J.; Maccarana, M.; Zhang, X.; Bespalov, M.; Lindahl, U.; Li, J.P. Lack of L-iduronic acid in heparan sulfate affects interaction with growth factors and cell signaling. J. Biol. Chem. 2009, 284, 15942–15950. [Google Scholar] [CrossRef] [PubMed] [Green Version]
- Chen, X.; Shen, Y.; Draper, W.; Buenrostro, J.D.; Litzenburger, U.; Cho, S.W.; Satpathy, A.T.; Carter, A.C.; Ghosh, R.P.; East-Seletsky, A.; et al. ATAC-see reveals the accessible genome by transposase-mediated imaging and sequencing. Nat. Methods 2016, 13, 1013–1020. [Google Scholar] [CrossRef] [PubMed]
- Van Bergen, T.; Etienne, I.; Jia, J.; Li, J.P.; Vlodavsky, I.; Stitt, A.; Vermassen, E.; Feyen, J.H.M. Heparanase Deficiency Is Associated with Disruption, Detachment, and Folding of the Retinal Pigment Epithelium. Curr. Eye Res. 2020, 46, 1166–1170. [Google Scholar] [CrossRef] [PubMed]
- Riaz, A.; Ilan, N.; Vlodavsky, I.; Li, J.P.; Johansson, S. Characterization of heparanase-induced phosphatidylinositol 3-kinase-AKT activation and its integrin dependence. J. Biol. Chem. 2013, 288, 12366–12375. [Google Scholar] [CrossRef] [Green Version]
- Cohen-Kaplan, V.; Jrbashyan, J.; Yanir, Y.; Naroditsky, I.; Ben-Izhak, O.; Ilan, N.; Doweck, I.; Vlodavsky, I. Heparanase induces signal transducer and activator of transcription (STAT) protein phosphorylation: Preclinical and clinical significance in head and neck cancer. J. Biol. Chem. 2012, 287, 6668–6678. [Google Scholar] [CrossRef] [Green Version]
- Batool, T.; Fang, J.; Barash, U.; Moustakas, A.; Vlodavsky, I.; Li, J.P. Overexpression of heparanase attenuated TGF-beta-stimulated signaling in tumor cells. FEBS Open Bio. 2017, 7, 405–413. [Google Scholar] [CrossRef]
- Nobuhisa, T.; Naomoto, Y.; Takaoka, M.; Tabuchi, Y.; Ookawa, K.; Kitamoto, D.; Gunduz, E.; Gunduz, M.; Nagatsuka, H.; Haisa, M.; et al. Emergence of nuclear heparanase induces differentiation of human mammary cancer cells. Biochem. Biophys. Res. Commun. 2005, 331, 175–180. [Google Scholar] [CrossRef]
- Wang, F.; Wang, Y.; Zhang, D.; Puthanveetil, P.; Johnson, J.D.; Rodrigues, B. Fatty acid-induced nuclear translocation of heparanase uncouples glucose metabolism in endothelial cells. Arterioscler. Thromb. Vasc. Biol. 2012, 32, 406–414. [Google Scholar] [CrossRef] [PubMed] [Green Version]
- de Mestre, A.M.; Khachigian, L.M.; Santiago, F.S.; Staykova, M.A.; Hulett, M.D. Regulation of inducible heparanase gene transcription in activated T cells by early growth response 1. J. Biol. Chem. 2003, 278, 50377–50385. [Google Scholar] [CrossRef] [PubMed] [Green Version]
- Hnisz, D.; Abraham, B.J.; Lee, T.I.; Lau, A.; Saint-Andre, V.; Sigova, A.A.; Hoke, H.A.; Young, R.A. Super-enhancers in the control of cell identity and disease. Cell 2013, 155, 934–947. [Google Scholar] [CrossRef] [PubMed] [Green Version]
- Beacon, T.H.; Delcuve, G.P.; Lopez, C.; Nardocci, G.; Kovalchuk, I.; van Wijnen, A.J.; Davie, J.R. The dynamic broad epigenetic (H3K4me3, H3K27ac) domain as a mark of essential genes. Clin. Epigenetics 2021, 13, 138. [Google Scholar] [CrossRef]
- Purushothaman, A.; Hurst, D.R.; Pisano, C.; Mizumoto, S.; Sugahara, K.; Sanderson, R.D. Heparanase-mediated loss of nuclear syndecan-1 enhances histone acetyltransferase (HAT) activity to promote expression of genes that drive an aggressive tumor phenotype. J. Biol. Chem. 2011, 286, 30377–30383. [Google Scholar] [CrossRef] [Green Version]
- Agelidis, A.M.; Hadigal, S.R.; Jaishankar, D.; Shukla, D. Viral Activation of Heparanase Drives Pathogenesis of Herpes Simplex Virus-1. Cell Rep. 2017, 20, 439–450. [Google Scholar] [CrossRef] [Green Version]
- Shaked, Y. Balancing efficacy of and host immune responses to cancer therapy: The yin and yang effects. Nat. Rev. Clin. Oncol. 2016, 13, 611–626. [Google Scholar] [CrossRef]
- Gingis-Velitski, S.; Loven, D.; Benayoun, L.; Munster, M.; Bril, R.; Voloshin, T.; Alishekevitz, D.; Bertolini, F.; Shaked, Y. Host response to short-term, single-agent chemotherapy induces matrix metalloproteinase-9 expression and accelerates metastasis in mice. Cancer Res. 2011, 71, 6986–6996. [Google Scholar] [CrossRef] [Green Version]
- Ramani, V.C.; Vlodavsky, I.; Ng, M.; Zhang, Y.; Barbieri, P.; Noseda, A.; Sanderson, R.D. Chemotherapy induces expression and release of heparanase leading to changes associated with an aggressive tumor phenotype. Matrix Biol. 2016, 55, 22–34. [Google Scholar] [CrossRef]
- Bhattacharya, U.; Gutter-Kapon, L.; Kan, T.; Boyango, I.; Barash, U.; Yang, S.M.; Liu, J.; Gross-Cohen, M.; Sanderson, R.D.; Shaked, Y.; et al. Heparanase and Chemotherapy Synergize to Drive Macrophage Activation and Enhance Tumor Growth. Cancer Res. 2020, 80, 57–68. [Google Scholar] [CrossRef] [PubMed] [Green Version]
- Gutter-Kapon, L.; Alishekevitz, D.; Shaked, Y.; Li, J.P.; Aronheim, A.; Ilan, N.; Vlodavsky, I. Heparanase is required for activation and function of macrophages. Proc. Natl. Acad. Sci. USA 2016, 113, E7808–E7817. [Google Scholar] [CrossRef] [PubMed] [Green Version]
- Barash, U.; Lapidot, M.; Zohar, Y.; Loomis, C.; Moreira, A.; Feld, S.; Goparaju, C.; Yang, H.; Hammond, E.; Zhang, G.; et al. Involvement of Heparanase in the Pathogenesis of Mesothelioma: Basic Aspects and Clinical Applications. J. Natl. Cancer Inst. 2018, 110, 1102–1114. [Google Scholar] [CrossRef] [PubMed]
- Boyango, I.; Barash, U.; Fux, L.; Naroditsky, I.; Ilan, N.; Vlodavsky, I. Targeting heparanase to the mammary epithelium enhances mammary gland development and promotes tumor growth and metastasis. Matrix Biol. 2018, 65, 91–103. [Google Scholar] [CrossRef]
- Zhang, G.L.; Gutter-Kapon, L.; Ilan, N.; Batool, T.; Singh, K.; Digre, A.; Luo, Z.; Sandler, S.; Shaked, Y.; Sanderson, R.D.; et al. Significance of host heparanase in promoting tumor growth and metastasis. Matrix Biol. 2020, 93, 25–42. [Google Scholar] [CrossRef]
- Hermano, E.; Goldberg, R.; Rubinstein, A.M.; Sonnenblick, A.; Maly, B.; Nahmias, D.; Li, J.P.; Bakker, M.A.H.; van der Vlag, J.; Vlodavsky, I.; et al. Heparanase Accelerates Obesity-Associated Breast Cancer Progression. Cancer Res. 2019, 79, 5342–5354. [Google Scholar] [CrossRef] [Green Version]
- Nguyen, T.K.; Paone, S.; Chan, E.; Poon, I.K.H.; Baxter, A.A.; Thomas, S.R.; Hulett, M.D. Heparanase: A Novel Therapeutic Target for the Treatment of Atherosclerosis. Cells 2022, 11, 3198. [Google Scholar] [CrossRef]


Disclaimer/Publisher’s Note: The statements, opinions and data contained in all publications are solely those of the individual author(s) and contributor(s) and not of MDPI and/or the editor(s). MDPI and/or the editor(s) disclaim responsibility for any injury to people or property resulting from any ideas, methods, instructions or products referred to in the content. |
© 2023 by the authors. Licensee MDPI, Basel, Switzerland. This article is an open access article distributed under the terms and conditions of the Creative Commons Attribution (CC BY) license (https://creativecommons.org/licenses/by/4.0/).
Share and Cite
Li, H.; Zhang, H.; Wenz, A.; Kang, Z.; Wang, H.; Vlodavsky, I.; Chen, X.; Li, J. Heparanase Modulates Chromatin Accessibility. Cells 2023, 12, 891. https://doi.org/10.3390/cells12060891
Li H, Zhang H, Wenz A, Kang Z, Wang H, Vlodavsky I, Chen X, Li J. Heparanase Modulates Chromatin Accessibility. Cells. 2023; 12(6):891. https://doi.org/10.3390/cells12060891
Chicago/Turabian StyleLi, Honglian, Hua Zhang, Amelie Wenz, Ziqi Kang, Helen Wang, Israel Vlodavsky, Xingqi Chen, and Jinping Li. 2023. "Heparanase Modulates Chromatin Accessibility" Cells 12, no. 6: 891. https://doi.org/10.3390/cells12060891