

Blocking Store-Operated Ca2+ Entry to Protect HL-1 Cardiomyocytes from Epirubicin-Induced Cardiotoxicity
 , and
, and 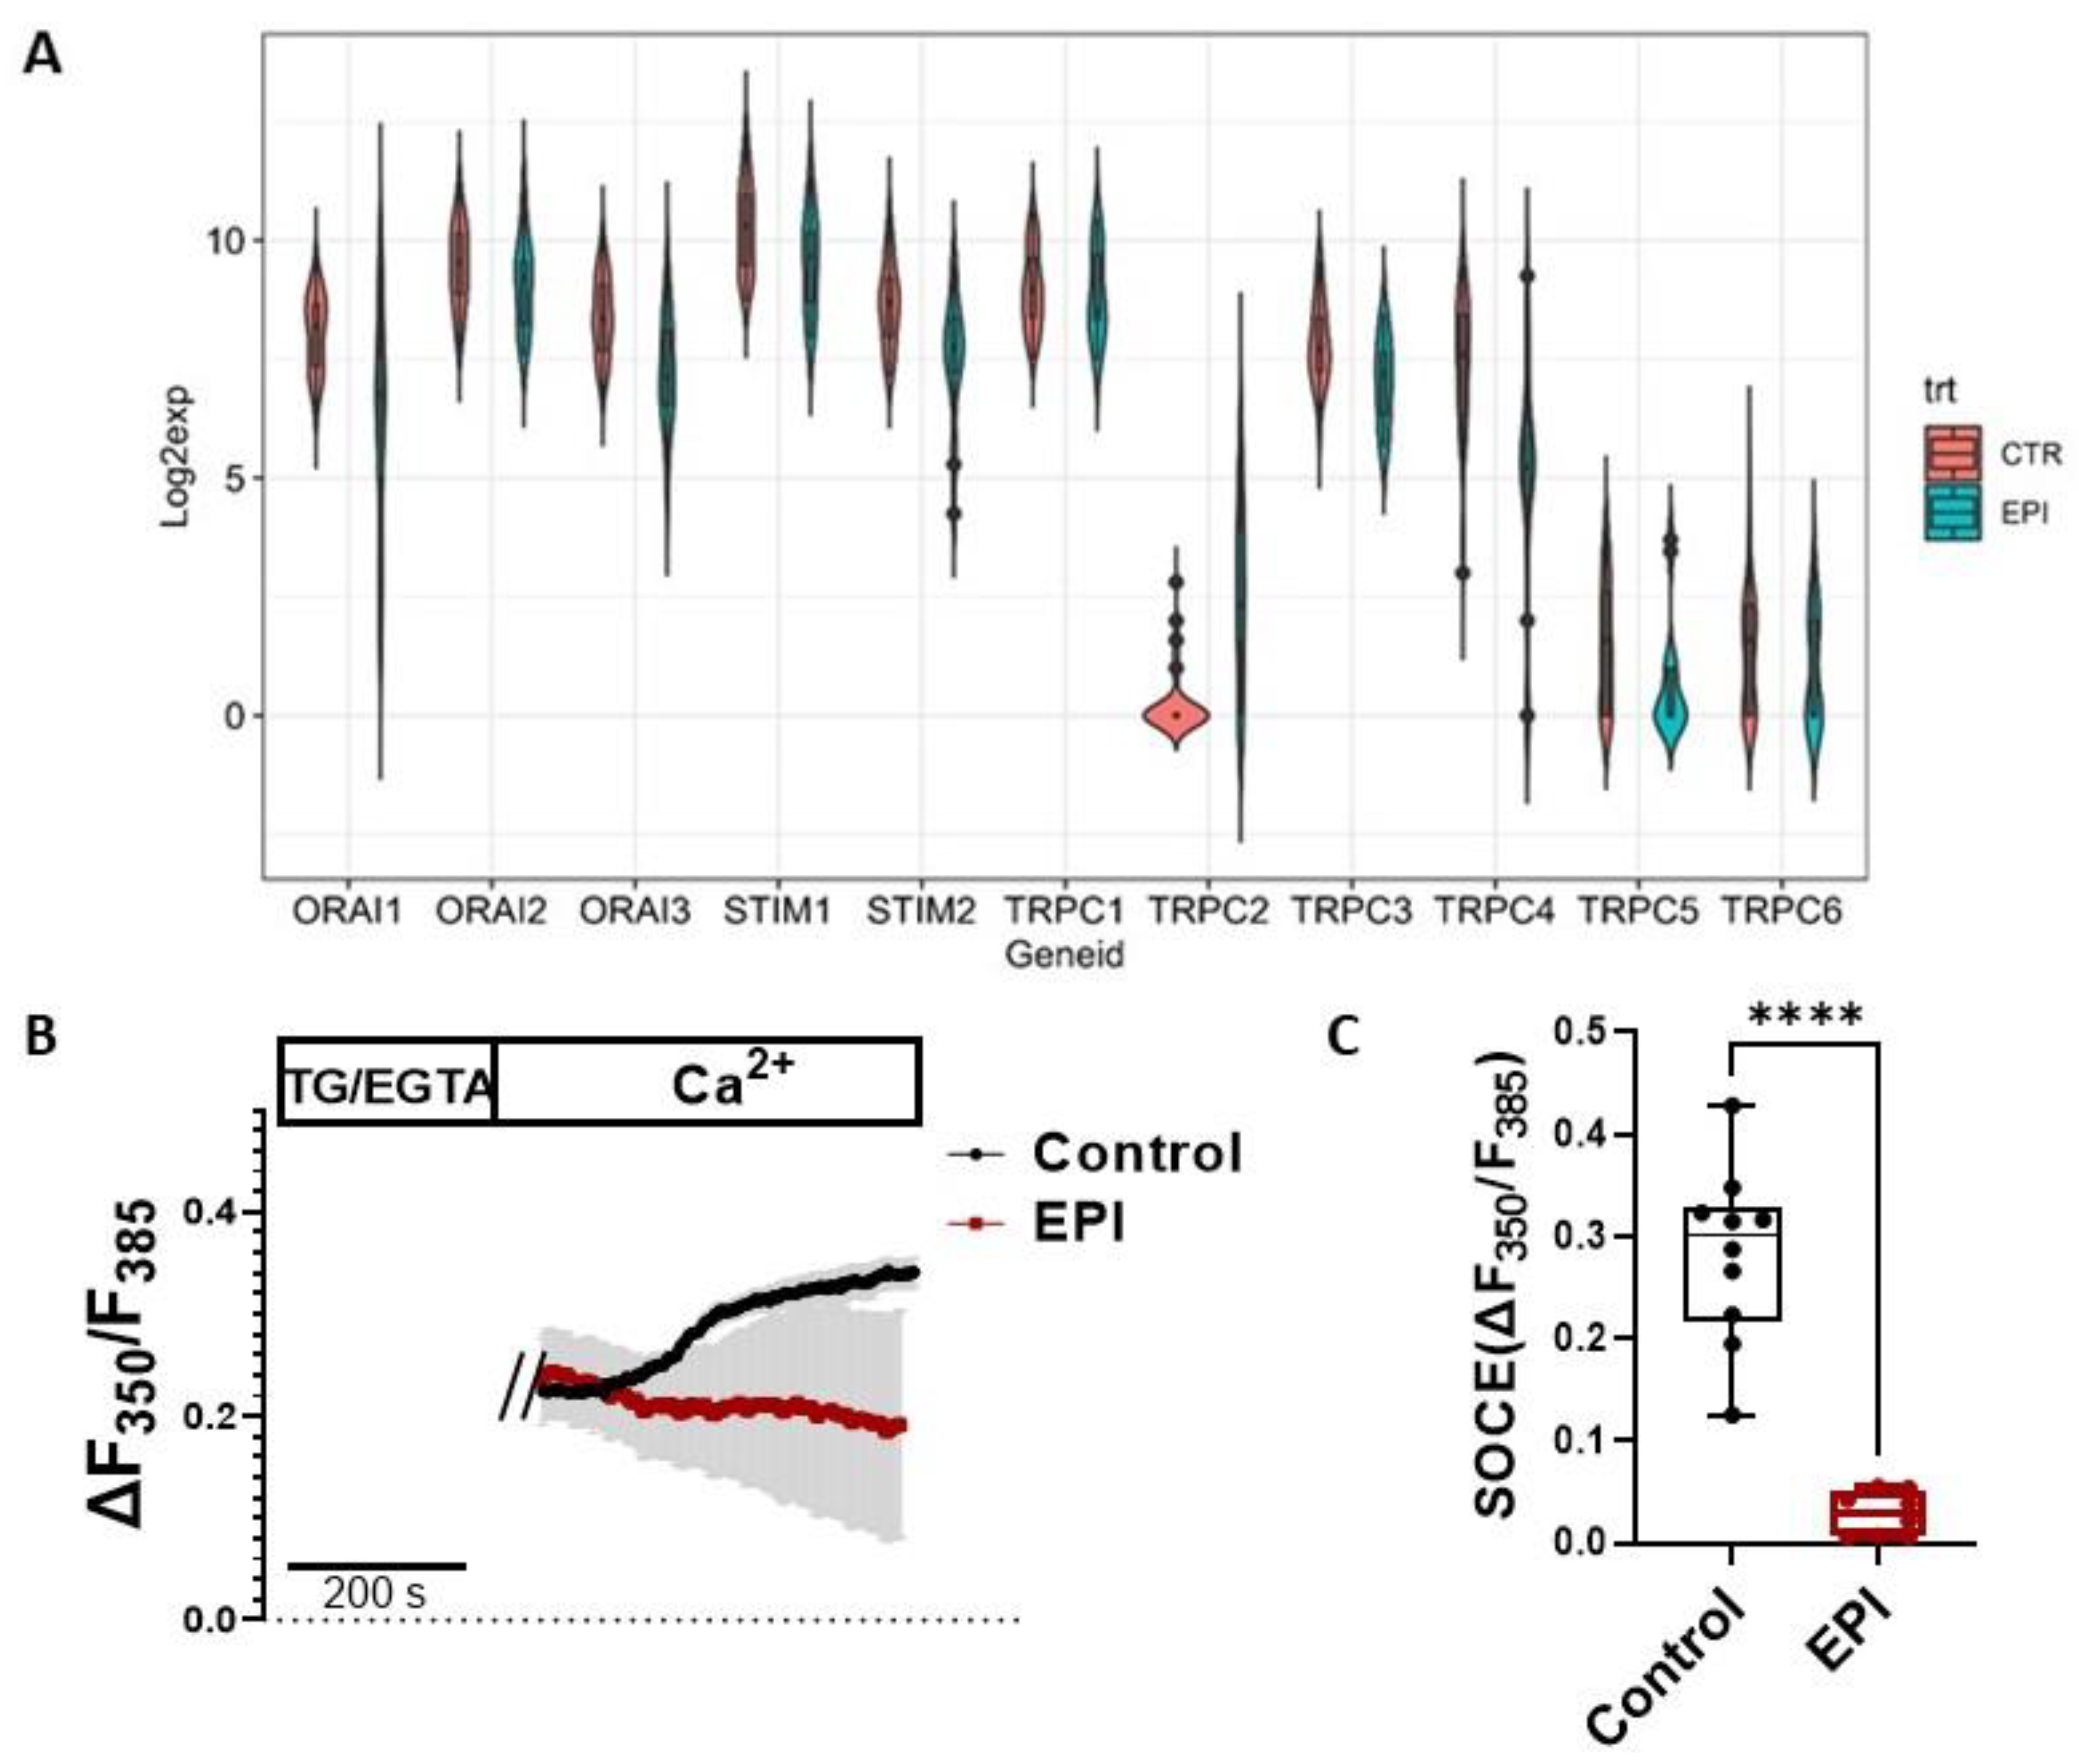
Abstract
:1. Introduction
2. Materials and Methods
2.1. Chemicals and Reagents
2.2. Cell Culture
2.3. Measurement of Intracellular Ca2+ Concentration
2.4. Cytotoxicity Assay
2.5. Western Blotting Analysis
2.6. Cell Size Measurement
2.7. Quantitative Reverse Transcription Polymerase Chain Reaction (qRT-PCR)
2.8. Immunofluorescence Staining
2.9. RNA-Seq Data Analysis
2.10. Statistical Analysis
3. Results
3.1. SOCE Machinery Genes Were Downregulated by EPI Treatment in Human iPSC-Derived Cardiomyocytes
3.2. Acute Treatment of EPI Increased SOCE in HL-1 Cardiomyocytes
3.3. BTP2 Diminished EPI-Induced ROS Production in HL-1 Cardiomyocytes
3.4. BTP2 Inhibited EPI-Induced Apoptosis in HL-1 Cardiomyocytes
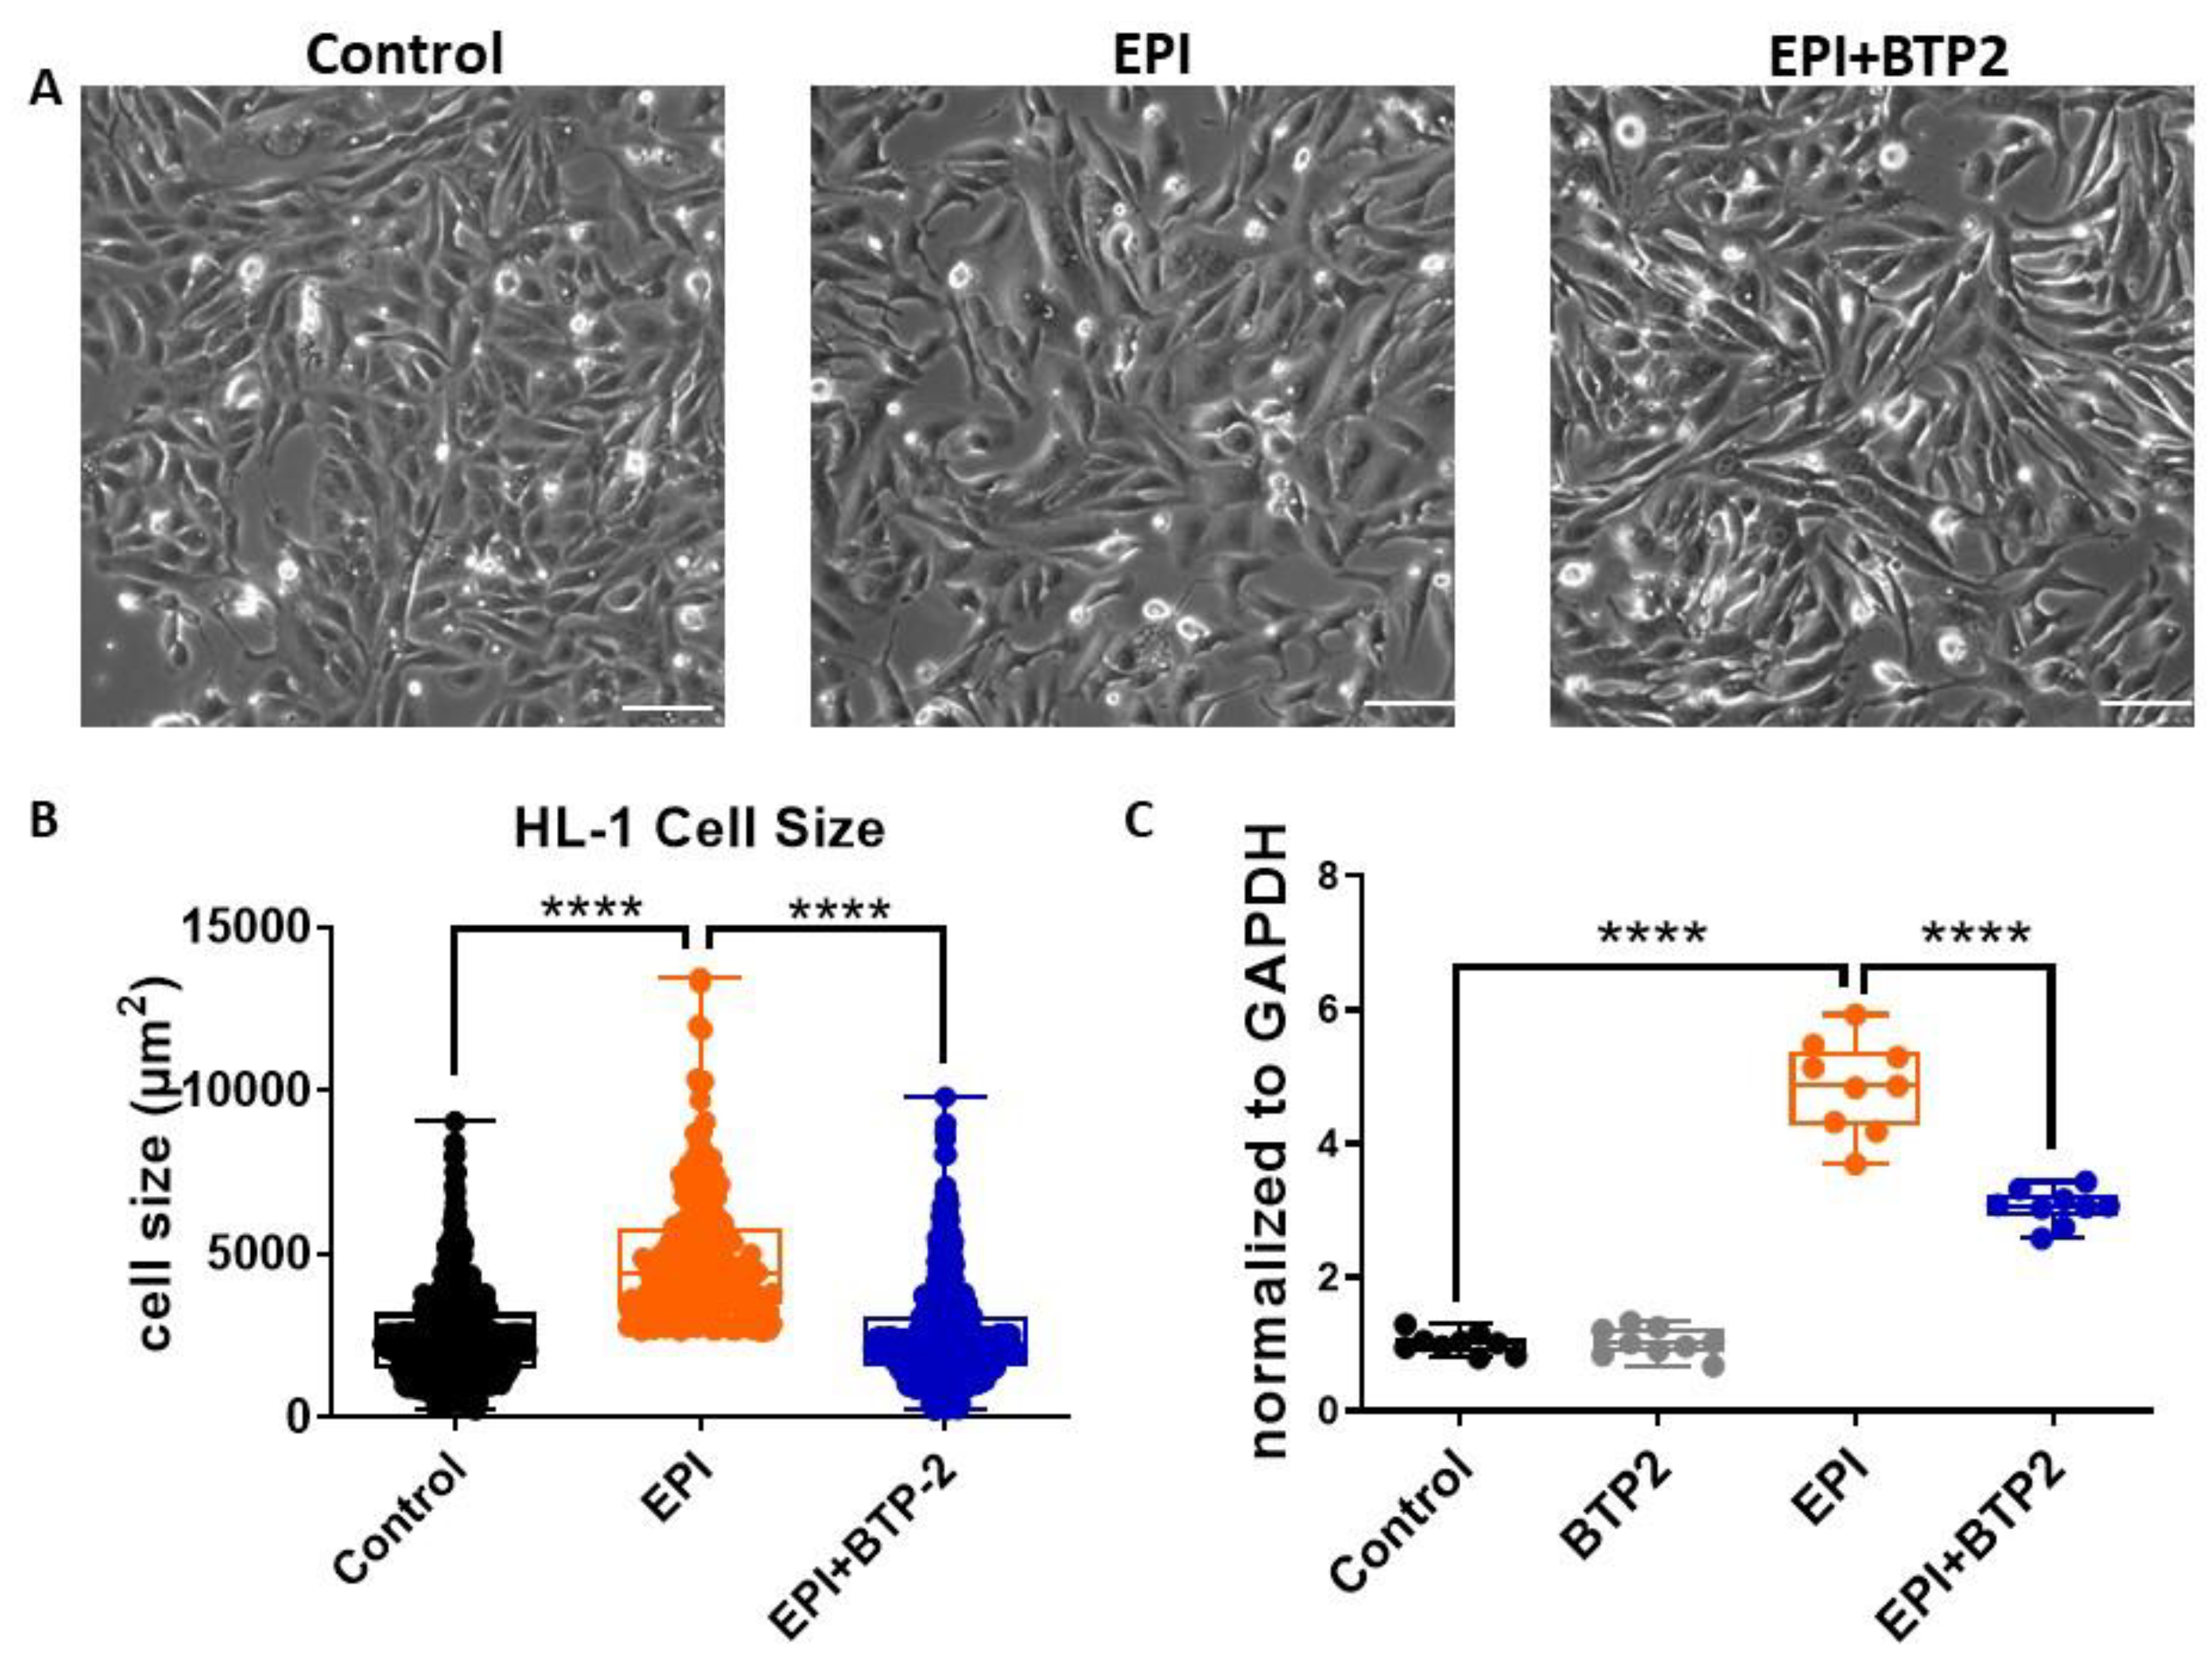
3.5. BTP2 Inhibited EPI-Induced Hypertrophy in HL-1 Cardiomyocytes
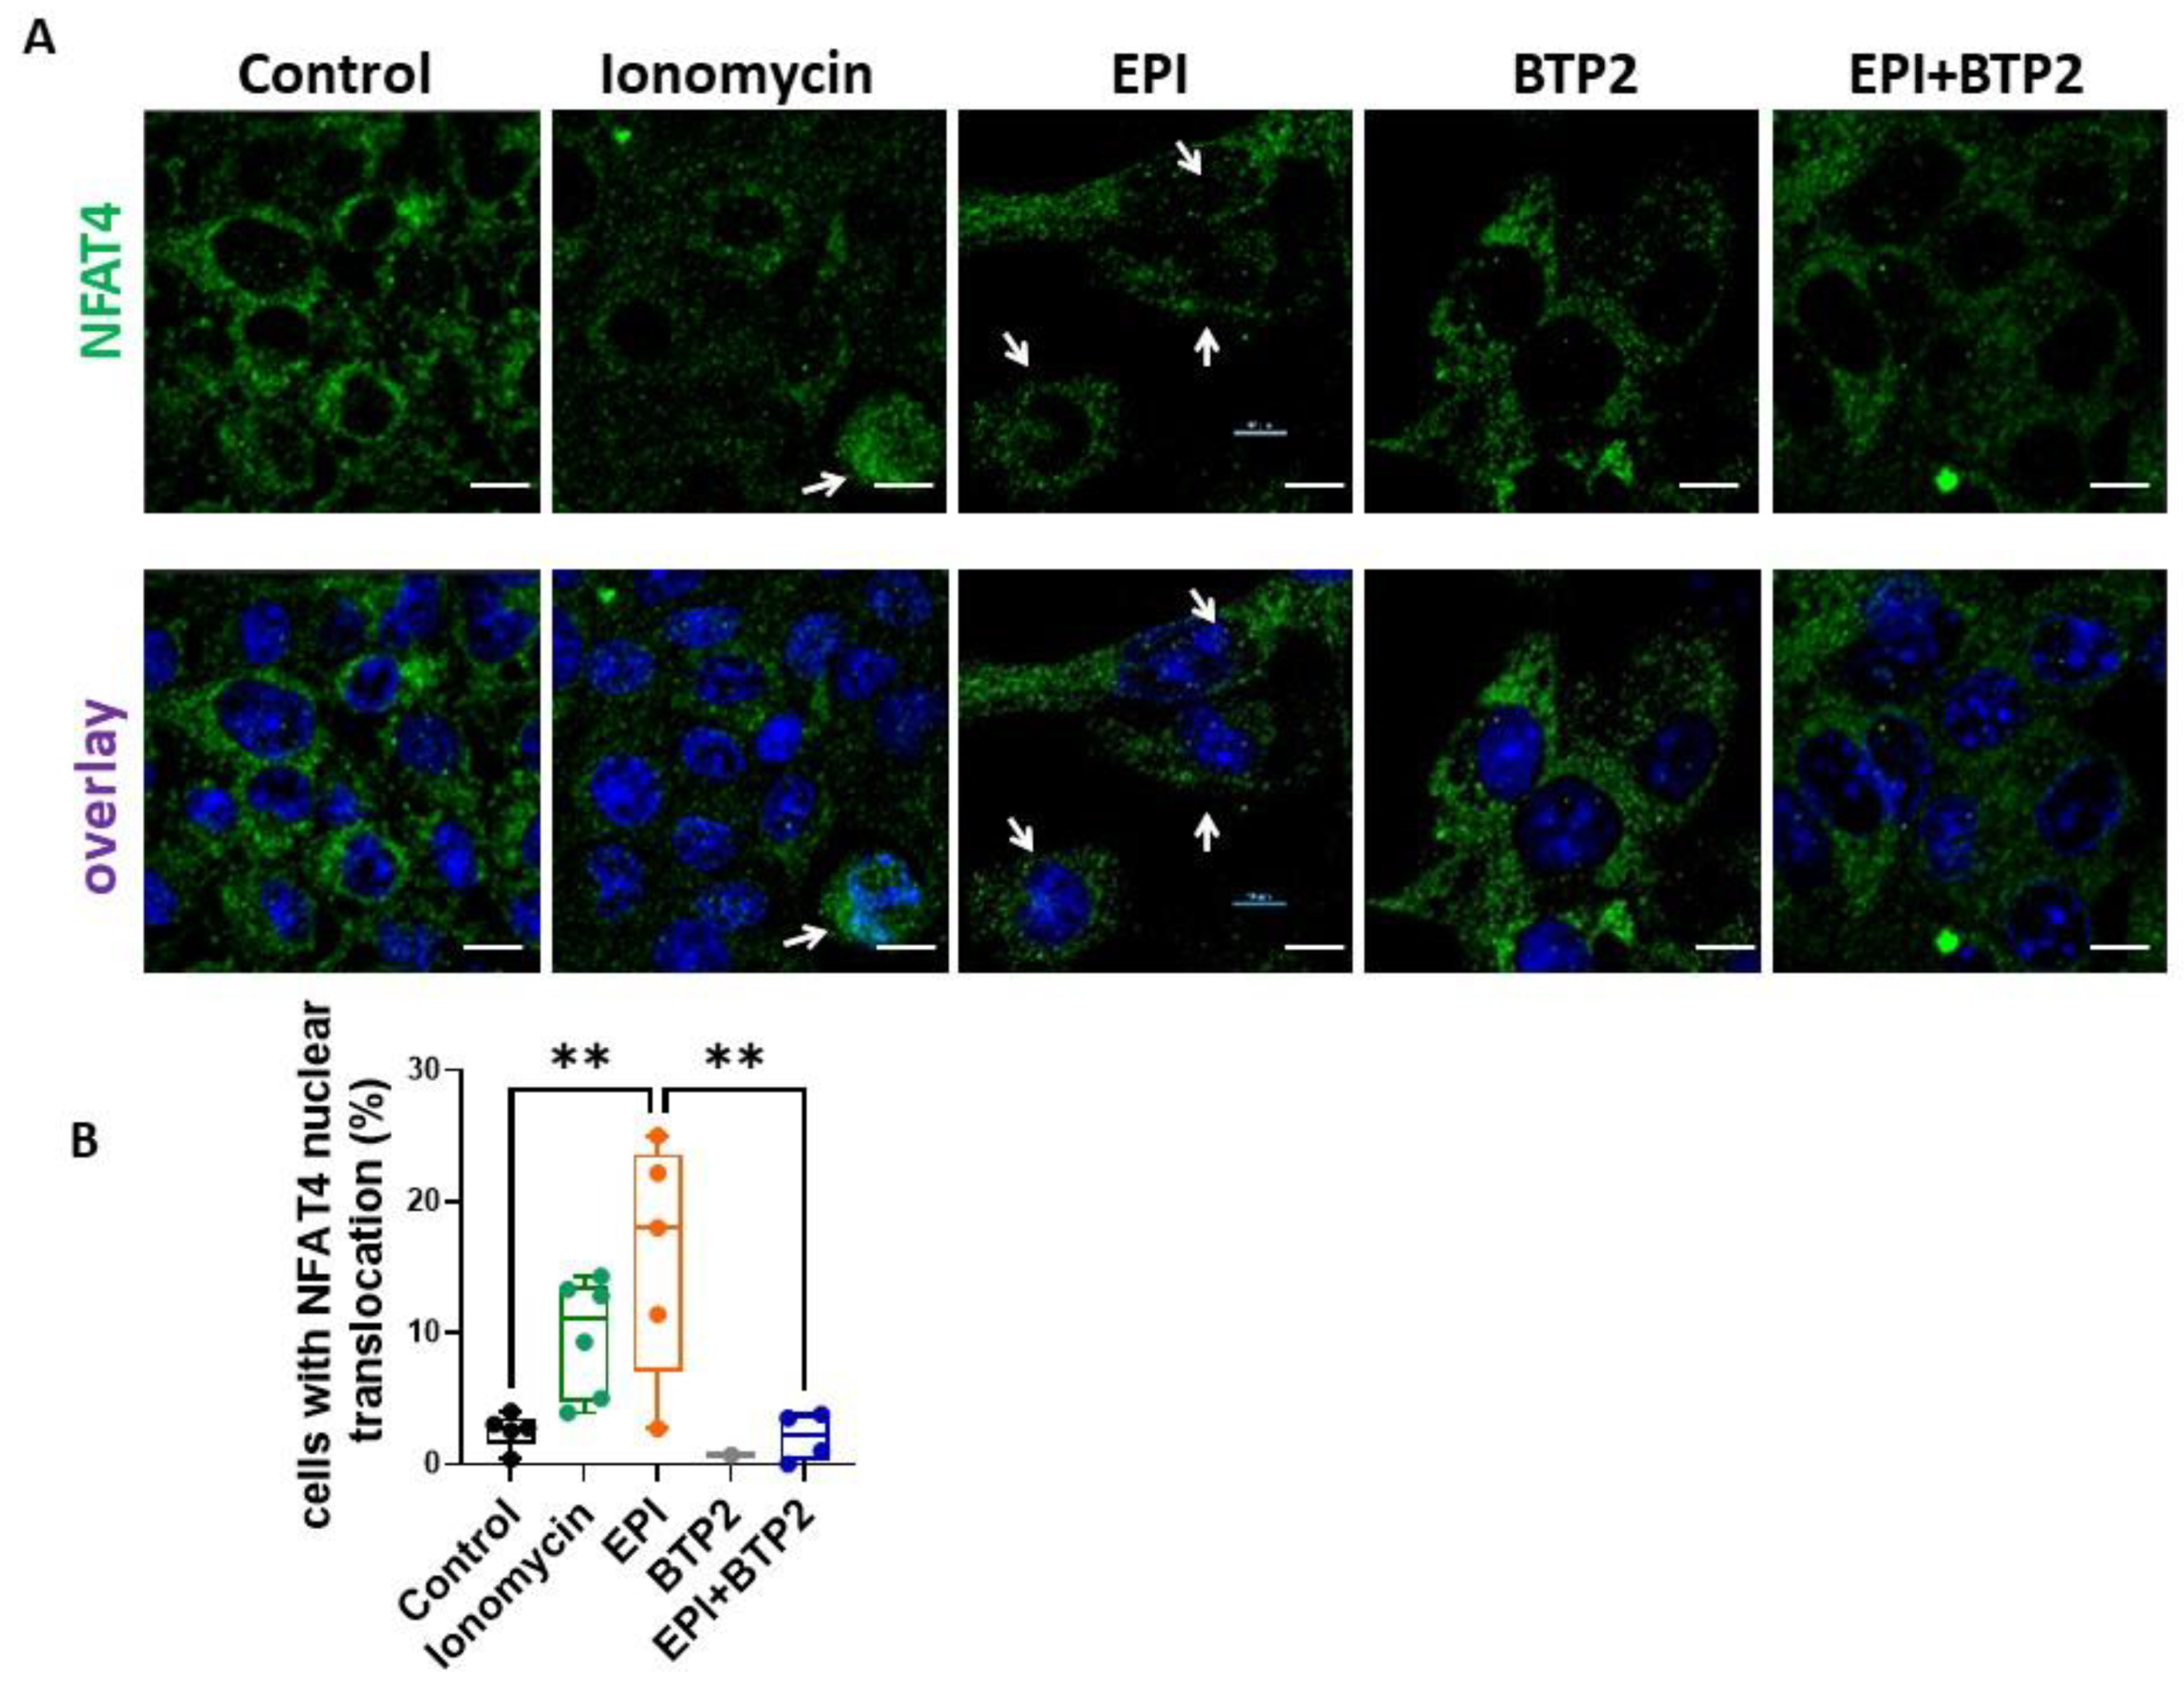
3.6. BTP2 Inhibited EPI-Induced NFAT4 Nuclear Translocation in HL-1 Cardiomyocytes
4. Discussion
Supplementary Materials
Author Contributions
Funding
Institutional Review Board Statement
Informed Consent Statement
Data Availability Statement
Acknowledgments
Conflicts of Interest
References
- World Health Organization. WHO Model List of Essential Medicines—22nd List. 2021. Available online: https://www.who.int/publications/i/item/WHO-MHP-HPS-EML-2021.02 (accessed on 30 September 2021).
- Zamorano, J.L.; Lancellotti, P.; Rodriguez Munoz, D.; Aboyans, V.; Asteggiano, R.; Galderisi, M.; Habib, G.; Lenihan, D.J.; Lip, G.Y.H.; Lyon, A.R.; et al. 2016 ESC Position Paper on cancer treatments and cardiovascular toxicity developed under the auspices of the ESC Committee for Practice Guidelines: The Task Force for cancer treatments and cardiovascular toxicity of the European Society of Cardiology (ESC). Eur. Heart J. 2016, 37, 2768–2801. [Google Scholar] [CrossRef]
- Mitry, M.A.; Edwards, J.G. Doxorubicin induced heart failure: Phenotype and molecular mechanisms. Int. J. Cardiol. Heart Vasc. 2016, 10, 17–24. [Google Scholar] [CrossRef] [Green Version]
- Cardinale, D.; Colombo, A.; Lamantia, G.; Colombo, N.; Civelli, M.; De Giacomi, G.; Rubino, M.; Veglia, F.; Fiorentini, C.; Cipolla, C.M. Anthracycline-induced cardiomyopathy: Clinical relevance and response to pharmacologic therapy. J. Am. Coll. Cardiol. 2010, 55, 213–220. [Google Scholar] [CrossRef] [Green Version]
- Nakamura, M.; Sadoshima, J. Mechanisms of physiological and pathological cardiac hypertrophy. Nat. Rev. Cardiol. 2018, 15, 387–407. [Google Scholar] [CrossRef]
- Hunton, D.L.; Lucchesi, P.A.; Pang, Y.; Cheng, X.; Dell’Italia, L.J.; Marchase, R.B. Capacitative calcium entry contributes to nuclear factor of activated T-cells nuclear translocation and hypertrophy in cardiomyocytes. J. Biol. Chem. 2002, 277, 14266–14273. [Google Scholar] [CrossRef] [Green Version]
- Ohba, T.; Watanabe, H.; Murakami, M.; Sato, T.; Ono, K.; Ito, H. Essential role of STIM1 in the development of cardiomyocyte hypertrophy. Biochem. Biophys. Res. Commun. 2009, 389, 172–176. [Google Scholar] [CrossRef]
- Voelkers, M.; Salz, M.; Herzog, N.; Frank, D.; Dolatabadi, N.; Frey, N.; Gude, N.; Friedrich, O.; Koch, W.J.; Katus, H.A.; et al. Orai1 and Stim1 regulate normal and hypertrophic growth in cardiomyocytes. J. Mol. Cell. Cardiol. 2010, 48, 1329–1334. [Google Scholar] [CrossRef] [Green Version]
- Hulot, J.S.; Fauconnier, J.; Ramanujam, D.; Chaanine, A.; Aubart, F.; Sassi, Y.; Merkle, S.; Cazorla, O.; Ouille, A.; Dupuis, M.; et al. Critical role for stromal interaction molecule 1 in cardiac hypertrophy. Circulation 2011, 124, 796–805. [Google Scholar] [CrossRef]
- Pan, Z.; Brotto, M.; Ma, J. Store-operated Ca2+ entry in muscle physiology and diseases. BMB Rep. 2014, 47, 69–79. [Google Scholar] [CrossRef] [Green Version]
- Luo, R.; Gomez, A.M.; Benitah, J.P.; Sabourin, J. Targeting Orai1-Mediated Store-Operated Ca2+ Entry in Heart Failure. Front. Cell Dev. Biol. 2020, 8, 586109. [Google Scholar] [CrossRef]
- Nan, J.; Li, J.; Lin, Y.; Saif Ur Rahman, M.; Li, Z.; Zhu, L. The interplay between mitochondria and store-operated Ca2+ entry: Emerging insights into cardiac diseases. J. Cell. Mol. Med. 2021, 25, 9496–9512. [Google Scholar] [CrossRef]
- Bozza, W.P.; Takeda, K.; Alterovitz, W.L.; Chou, C.K.; Shen, R.F.; Zhang, B. Anthracycline-Induced Cardiotoxicity: Molecular Insights Obtained from Human-Induced Pluripotent Stem Cell-Derived Cardiomyocytes (hiPSC-CMs). AAPS J. 2021, 23, 44. [Google Scholar] [CrossRef]
- Chan, E.M.; Thomas, M.J.; Bandy, B.; Tibbits, G.F. Effects of doxorubicin, 4’-epirubicin, and antioxidant enzymes on the contractility of isolated cardiomyocytes. Can. J. Physiol. Pharmacol. 1996, 74, 904–910. [Google Scholar] [CrossRef]
- Swift, L.; McHowat, J.; Sarvazyan, N. Inhibition of membrane-associated calcium-independent phospholipase A2 as a potential culprit of anthracycline cardiotoxicity. Cancer Res. 2003, 63, 5992–5998. [Google Scholar]
- Claycomb, W.C.; Lanson, N.A., Jr.; Stallworth, B.S.; Egeland, D.B.; Delcarpio, J.B.; Bahinski, A.; Izzo, N.J., Jr. HL-1 cells: A cardiac muscle cell line that contracts and retains phenotypic characteristics of the adult cardiomyocyte. Proc. Natl. Acad. Sci. USA 1998, 95, 2979–2984. [Google Scholar] [CrossRef] [Green Version]
- Luo, Y.; Liu, X.; Ma, R.; Wang, Y.; Zimering, M.; Pan, Z. Circulating IgGs in Type 2 Diabetes with Atrial Fibrillation Induce IP3-Mediated Calcium Elevation in Cardiomyocytes. iScience 2020, 23, 101036. [Google Scholar] [CrossRef]
- Cui, C.; Chang, Y.; Zhang, X.; Choi, S.; Tran, H.; Penmetsa, K.V.; Viswanadha, S.; Fu, L.; Pan, Z. Targeting Orai1-mediated store-operated calcium entry by RP4010 for anti-tumor activity in esophagus squamous cell carcinoma. Cancer Lett. 2018, 432, 169–179. [Google Scholar] [CrossRef]
- Choi, S.; Cui, C.; Luo, Y.; Kim, S.H.; Ko, J.K.; Huo, X.; Ma, J.; Fu, L.W.; Souza, R.F.; Korichneva, I.; et al. Selective inhibitory effects of zinc on cell proliferation in esophageal squamous cell carcinoma through Orai1. FASEB J. Off. Publ. Fed. Am. Soc. Exp. Biol. 2018, 32, 404–416. [Google Scholar] [CrossRef] [Green Version]
- Hansen, J.; Xiong, Y.; Dhanan, P.; Hu, B.; Jayaraman, G.; Tolentino, R.; Chen, Y.; Beaumont, K.G.; Sebra, R.; Vidovic, D.; et al. Transcriptomic Profiling of Drug-Treated Human Induced Pluripotent Stem Cells (iPSCs). 2022. Available online: https://www.ncbi.nlm.nih.gov/geo/query/acc.cgi?acc=GSE217421 (accessed on 3 May 2021).
- Hawkins, B.J.; Irrinki, K.M.; Mallilankaraman, K.; Lien, Y.C.; Wang, Y.; Bhanumathy, C.D.; Subbiah, R.; Ritchie, M.F.; Soboloff, J.; Baba, Y.; et al. S-glutathionylation activates STIM1 and alters mitochondrial homeostasis. J. Cell Biol. 2010, 190, 391–405. [Google Scholar] [CrossRef] [Green Version]
- Suarez-Huerta, N.; Mosselmans, R.; Dumont, J.E.; Robaye, B. Actin depolymerization and polymerization are required during apoptosis in endothelial cells. J. Cell. Physiol. 2000, 184, 239–245. [Google Scholar] [CrossRef]
- Toldo, S.; Goehe, R.W.; Lotrionte, M.; Mezzaroma, E.; Sumner, E.T.; Biondi-Zoccai, G.G.; Seropian, I.M.; Van Tassell, B.W.; Loperfido, F.; Palazzoni, G.; et al. Comparative cardiac toxicity of anthracyclines in vitro and in vivo in the mouse. PLoS ONE 2013, 8, e58421. [Google Scholar] [CrossRef]
- Eder, P.; Molkentin, J.D. TRPC channels as effectors of cardiac hypertrophy. Circ. Res. 2011, 108, 265–272. [Google Scholar] [CrossRef] [Green Version]
- Pu, W.T.; Ma, Q.; Izumo, S. NFAT transcription factors are critical survival factors that inhibit cardiomyocyte apoptosis during phenylephrine stimulation in vitro. Circ. Res. 2003, 92, 725–731. [Google Scholar] [CrossRef] [Green Version]
- Kar, P.; Parekh, A.B. Distinct spatial Ca2+ signatures selectively activate different NFAT transcription factor isoforms. Mol. Cell 2015, 58, 232–243. [Google Scholar] [CrossRef] [Green Version]
- Touchberry, C.D.; Elmore, C.J.; Nguyen, T.M.; Andresen, J.J.; Zhao, X.; Orange, M.; Weisleder, N.; Brotto, M.; Claycomb, W.C.; Wacker, M.J. Store-operated calcium entry is present in HL-1 cardiomyocytes and contributes to resting calcium. Biochem. Biophys. Res. Commun. 2011, 416, 45–50. [Google Scholar] [CrossRef] [Green Version]
- Yuan, J.P.; Zeng, W.; Huang, G.N.; Worley, P.F.; Muallem, S. STIM1 heteromultimerizes TRPC channels to determine their function as store-operated channels. Nat. Cell Biol. 2007, 9, 636–645. [Google Scholar] [CrossRef] [Green Version]
- Zhang, X.; Xin, P.; Yoast, R.E.; Emrich, S.M.; Johnson, M.T.; Pathak, T.; Benson, J.C.; Azimi, I.; Gill, D.L.; Monteith, G.R.; et al. Distinct pharmacological profiles of ORAI1, ORAI2, and ORAI3 channels. Cell Calcium 2020, 91, 102281. [Google Scholar] [CrossRef]
- He, L.P.; Hewavitharana, T.; Soboloff, J.; Spassova, M.A.; Gill, D.L. A functional link between store-operated and TRPC channels revealed by the 3,5-bis(trifluoromethyl)pyrazole derivative, BTP2. J. Biol. Chem. 2005, 280, 10997–11006. [Google Scholar] [CrossRef] [Green Version]
- Benard, L.; Oh, J.G.; Cacheux, M.; Lee, A.; Nonnenmacher, M.; Matasic, D.S.; Kohlbrenner, E.; Kho, C.; Pavoine, C.; Hajjar, R.J.; et al. Cardiac Stim1 Silencing Impairs Adaptive Hypertrophy and Promotes Heart Failure Through Inactivation of mTORC2/Akt Signaling. Circulation 2016, 133, 1458–1471; discussion 1471. [Google Scholar] [CrossRef] [Green Version]
- Luo, X.; Hojayev, B.; Jiang, N.; Wang, Z.V.; Tandan, S.; Rakalin, A.; Rothermel, B.A.; Gillette, T.G.; Hill, J.A. STIM1-dependent store-operated Ca2+ entry is required for pathological cardiac hypertrophy. J. Mol. Cell. Cardiol. 2012, 52, 136–147. [Google Scholar] [CrossRef] [Green Version]
- Garlick, P.B.; Davies, M.J.; Hearse, D.J.; Slater, T.F. Direct detection of free radicals in the reperfused rat heart using electron spin resonance spectroscopy. Circ. Res. 1987, 61, 757–760. [Google Scholar] [CrossRef] [Green Version]
- Haines, D.D.; Juhasz, B.; Tosaki, A. Management of multicellular senescence and oxidative stress. J. Cell. Mol. Med. 2013, 17, 936–957. [Google Scholar] [CrossRef] [Green Version]
- Miller, B.A. The role of TRP channels in oxidative stress-induced cell death. J. Membr. Biol. 2006, 209, 31–41. [Google Scholar] [CrossRef]
- Poteser, M.; Graziani, A.; Rosker, C.; Eder, P.; Derler, I.; Kahr, H.; Zhu, M.X.; Romanin, C.; Groschner, K. TRPC3 and TRPC4 associate to form a redox-sensitive cation channel. Evidence for expression of native TRPC3-TRPC4 heteromeric channels in endothelial cells. J. Biol. Chem. 2006, 281, 13588–13595. [Google Scholar] [CrossRef] [Green Version]
- Venkatakrishnan, C.D.; Tewari, A.K.; Moldovan, L.; Cardounel, A.J.; Zweier, J.L.; Kuppusamy, P.; Ilangovan, G. Heat shock protects cardiac cells from doxorubicin-induced toxicity by activating p38 MAPK and phosphorylation of small heat shock protein 27. Am. J. Physiol. Heart Circ. Physiol. 2006, 291, H2680–H2691. [Google Scholar] [CrossRef] [Green Version]
- Grzanka, D.; Domaniewski, J.; Grzanka, A. Effect of doxorubicin on actin reorganization in Chinese hamster ovary cells. Neoplasma 2005, 52, 46–51. [Google Scholar]
- Taskin, E.; Guven, C.; Kaya, S.T.; Sahin, L.; Kocahan, S.; Degirmencioglu, A.Z.; Gur, F.M.; Sevgiler, Y. The role of toll-like receptors in the protective effect of melatonin against doxorubicin-induced pancreatic beta cell toxicity. Life Sci. 2019, 233, 116704. [Google Scholar] [CrossRef]
- Mustafa, E.H.; Mahmoud, H.T.; Al-Hudhud, M.Y.; Abdalla, M.Y.; Ahmad, I.M.; Yasin, S.R.; Elkarmi, A.Z.; Tahtamouni, L.H. 2-deoxy-D-Glucose Synergizes with Doxorubicin or L-Buthionine Sulfoximine to Reduce Adhesion and Migration of Breast Cancer Cells. Asian Pac. J. Cancer Prev. 2015, 16, 3213–3222. [Google Scholar] [CrossRef] [Green Version]
- Zhu, H.; Zhang, H.; Jin, F.; Fang, M.; Huang, M.; Yang, C.S.; Chen, T.; Fu, L.; Pan, Z. Elevated Orai1 expression mediates tumor-promoting intracellular Ca2+ oscillations in human esophageal squamous cell carcinoma. Oncotarget 2014, 5, 3455–3471. [Google Scholar] [CrossRef] [Green Version]
- Pan, Z.; Ma, J. Open Sesame: Treasure in store-operated calcium entry pathway for cancer therapy. Sci. China. Life Sci. 2015, 58, 48–53. [Google Scholar] [CrossRef] [Green Version]
- Cui, C.; Merritt, R.; Fu, L.; Pan, Z. Targeting calcium signaling in cancer therapy. Acta Pharm. Sin. B 2017, 7, 3–17. [Google Scholar] [CrossRef] [PubMed]


Disclaimer/Publisher’s Note: The statements, opinions and data contained in all publications are solely those of the individual author(s) and contributor(s) and not of MDPI and/or the editor(s). MDPI and/or the editor(s) disclaim responsibility for any injury to people or property resulting from any ideas, methods, instructions or products referred to in the content. |
© 2023 by the authors. Licensee MDPI, Basel, Switzerland. This article is an open access article distributed under the terms and conditions of the Creative Commons Attribution (CC BY) license (https://creativecommons.org/licenses/by/4.0/).
Share and Cite
Liu, X.; Chang, Y.; Choi, S.; Cai, C.; Zhang, X.; Pan, Z. Blocking Store-Operated Ca2+ Entry to Protect HL-1 Cardiomyocytes from Epirubicin-Induced Cardiotoxicity. Cells 2023, 12, 723. https://doi.org/10.3390/cells12050723
Liu X, Chang Y, Choi S, Cai C, Zhang X, Pan Z. Blocking Store-Operated Ca2+ Entry to Protect HL-1 Cardiomyocytes from Epirubicin-Induced Cardiotoxicity. Cells. 2023; 12(5):723. https://doi.org/10.3390/cells12050723
Chicago/Turabian StyleLiu, Xian, Yan Chang, Sangyong Choi, Chuanxi Cai, Xiaoli Zhang, and Zui Pan. 2023. "Blocking Store-Operated Ca2+ Entry to Protect HL-1 Cardiomyocytes from Epirubicin-Induced Cardiotoxicity" Cells 12, no. 5: 723. https://doi.org/10.3390/cells12050723