


Differential Expression of AP-2 Transcription Factors Family in Lung Adenocarcinoma and Lung Squamous Cell Carcinoma—A Bioinformatics Study
 , , , , and
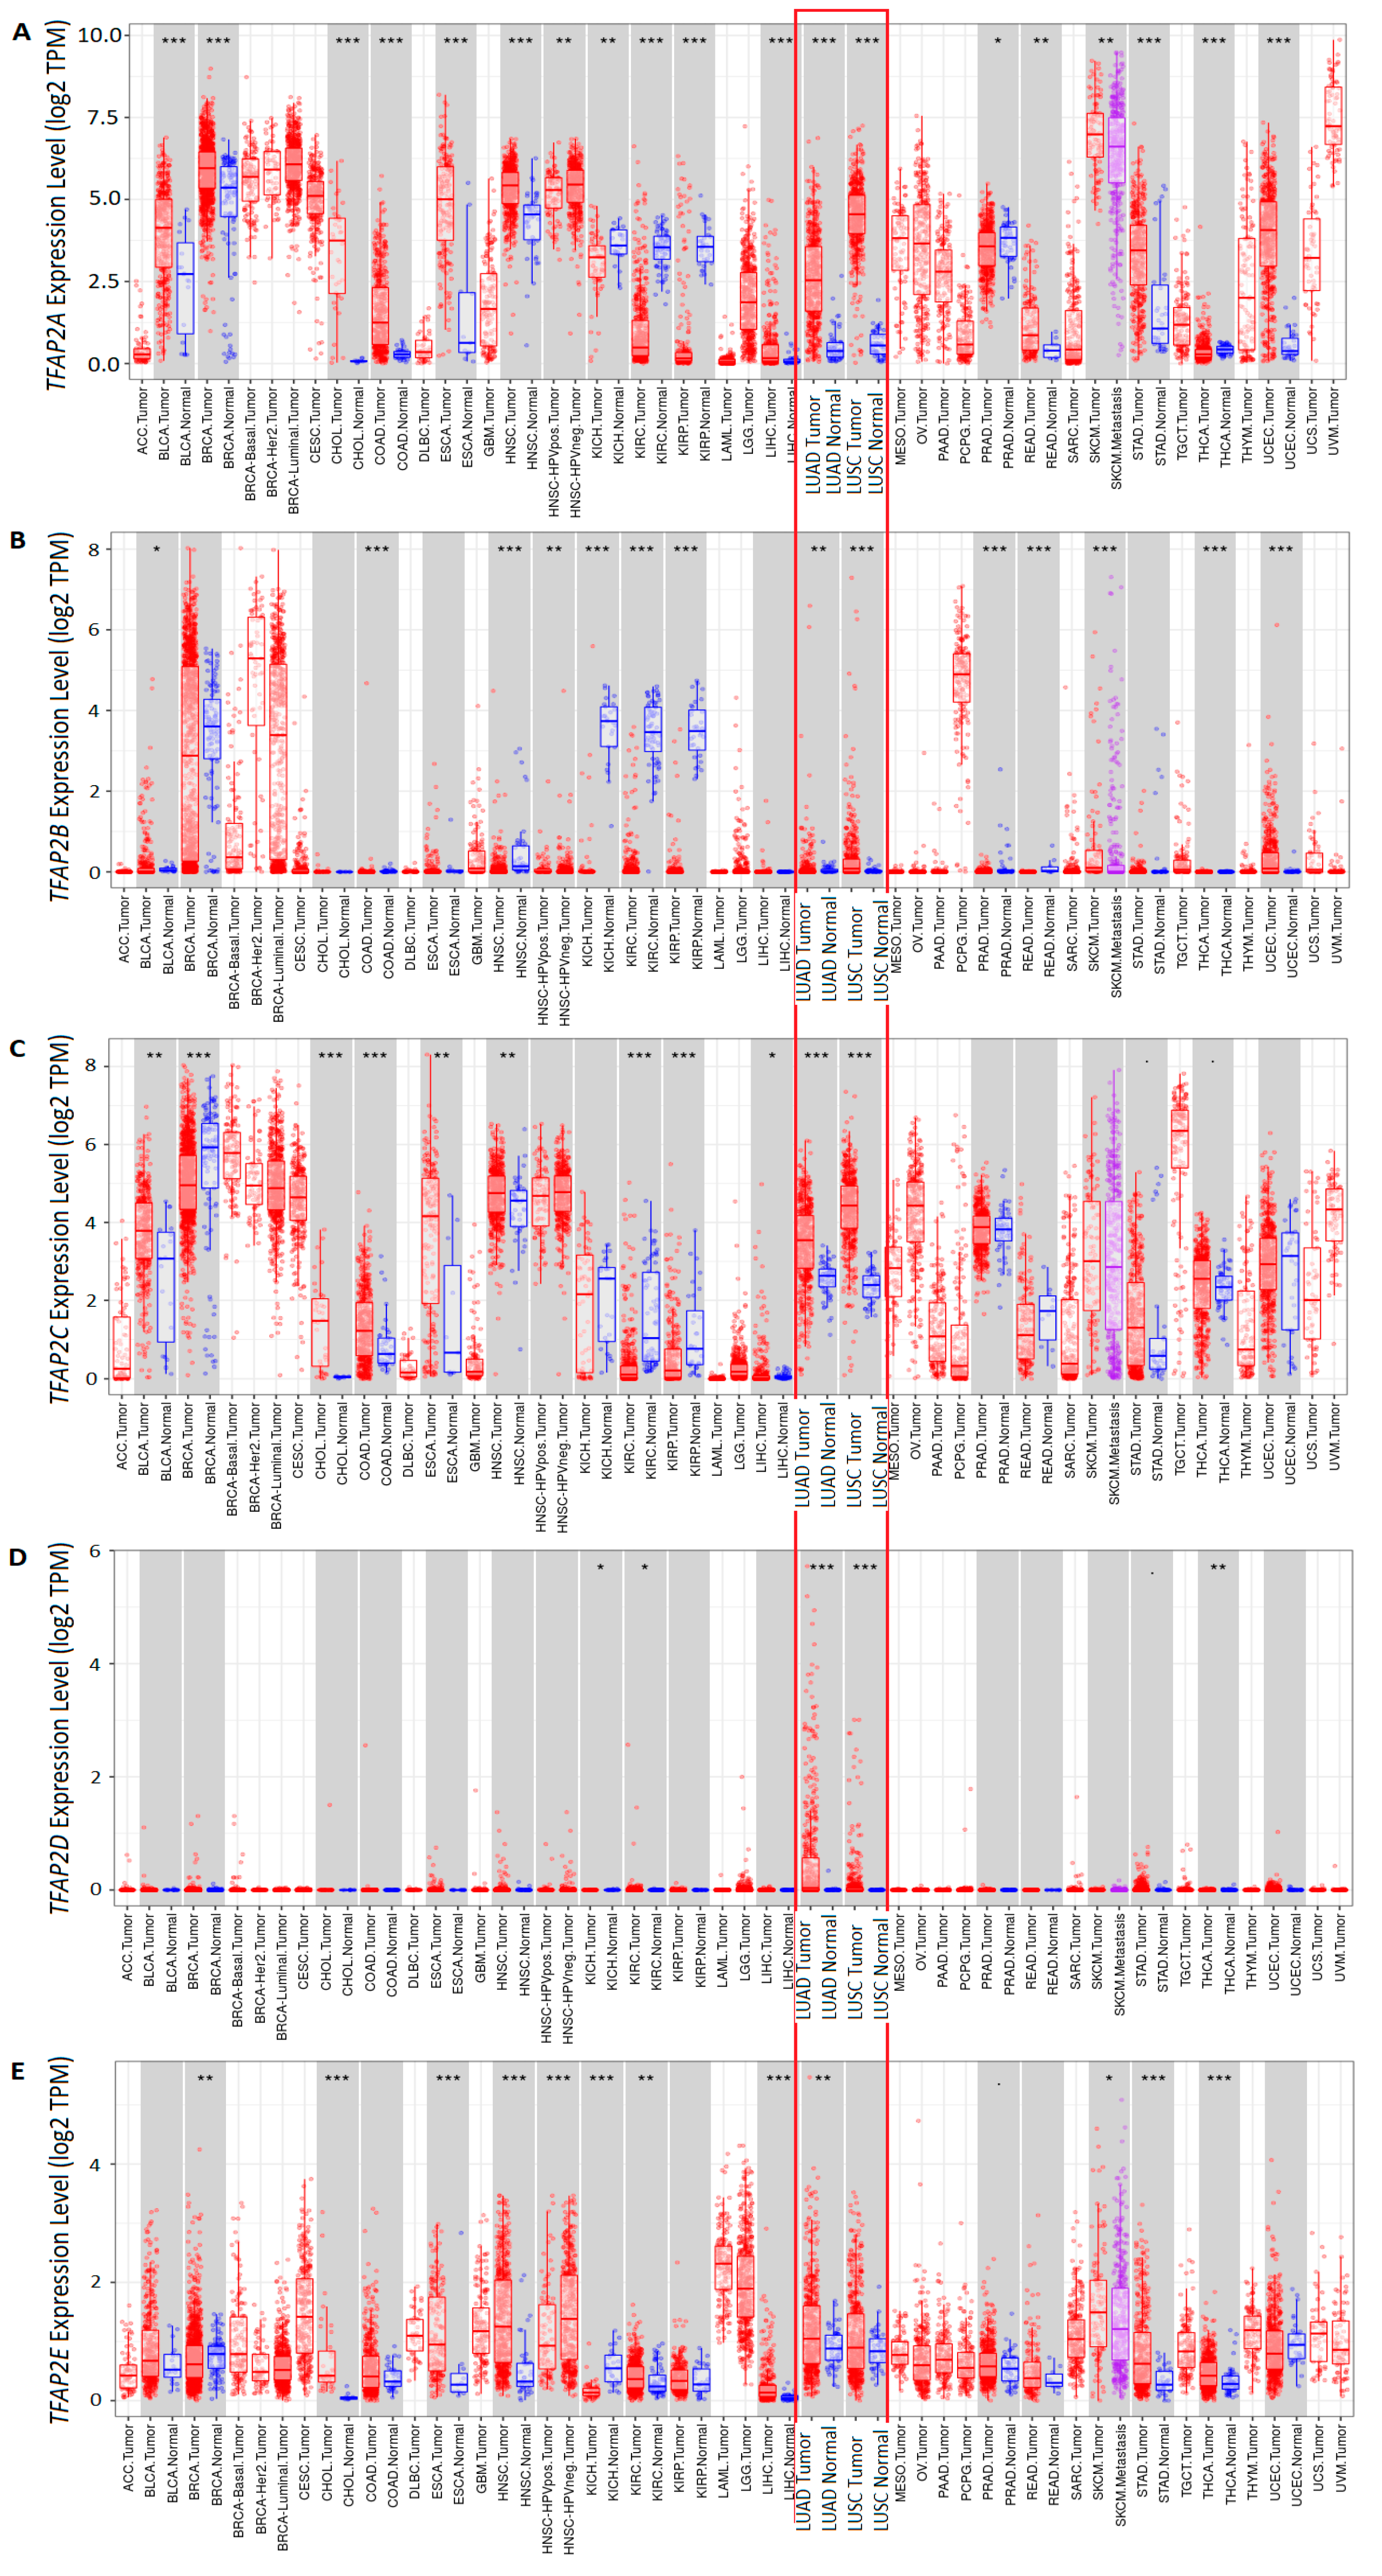
Abstract
:1. Introduction
2. Materials and Methods
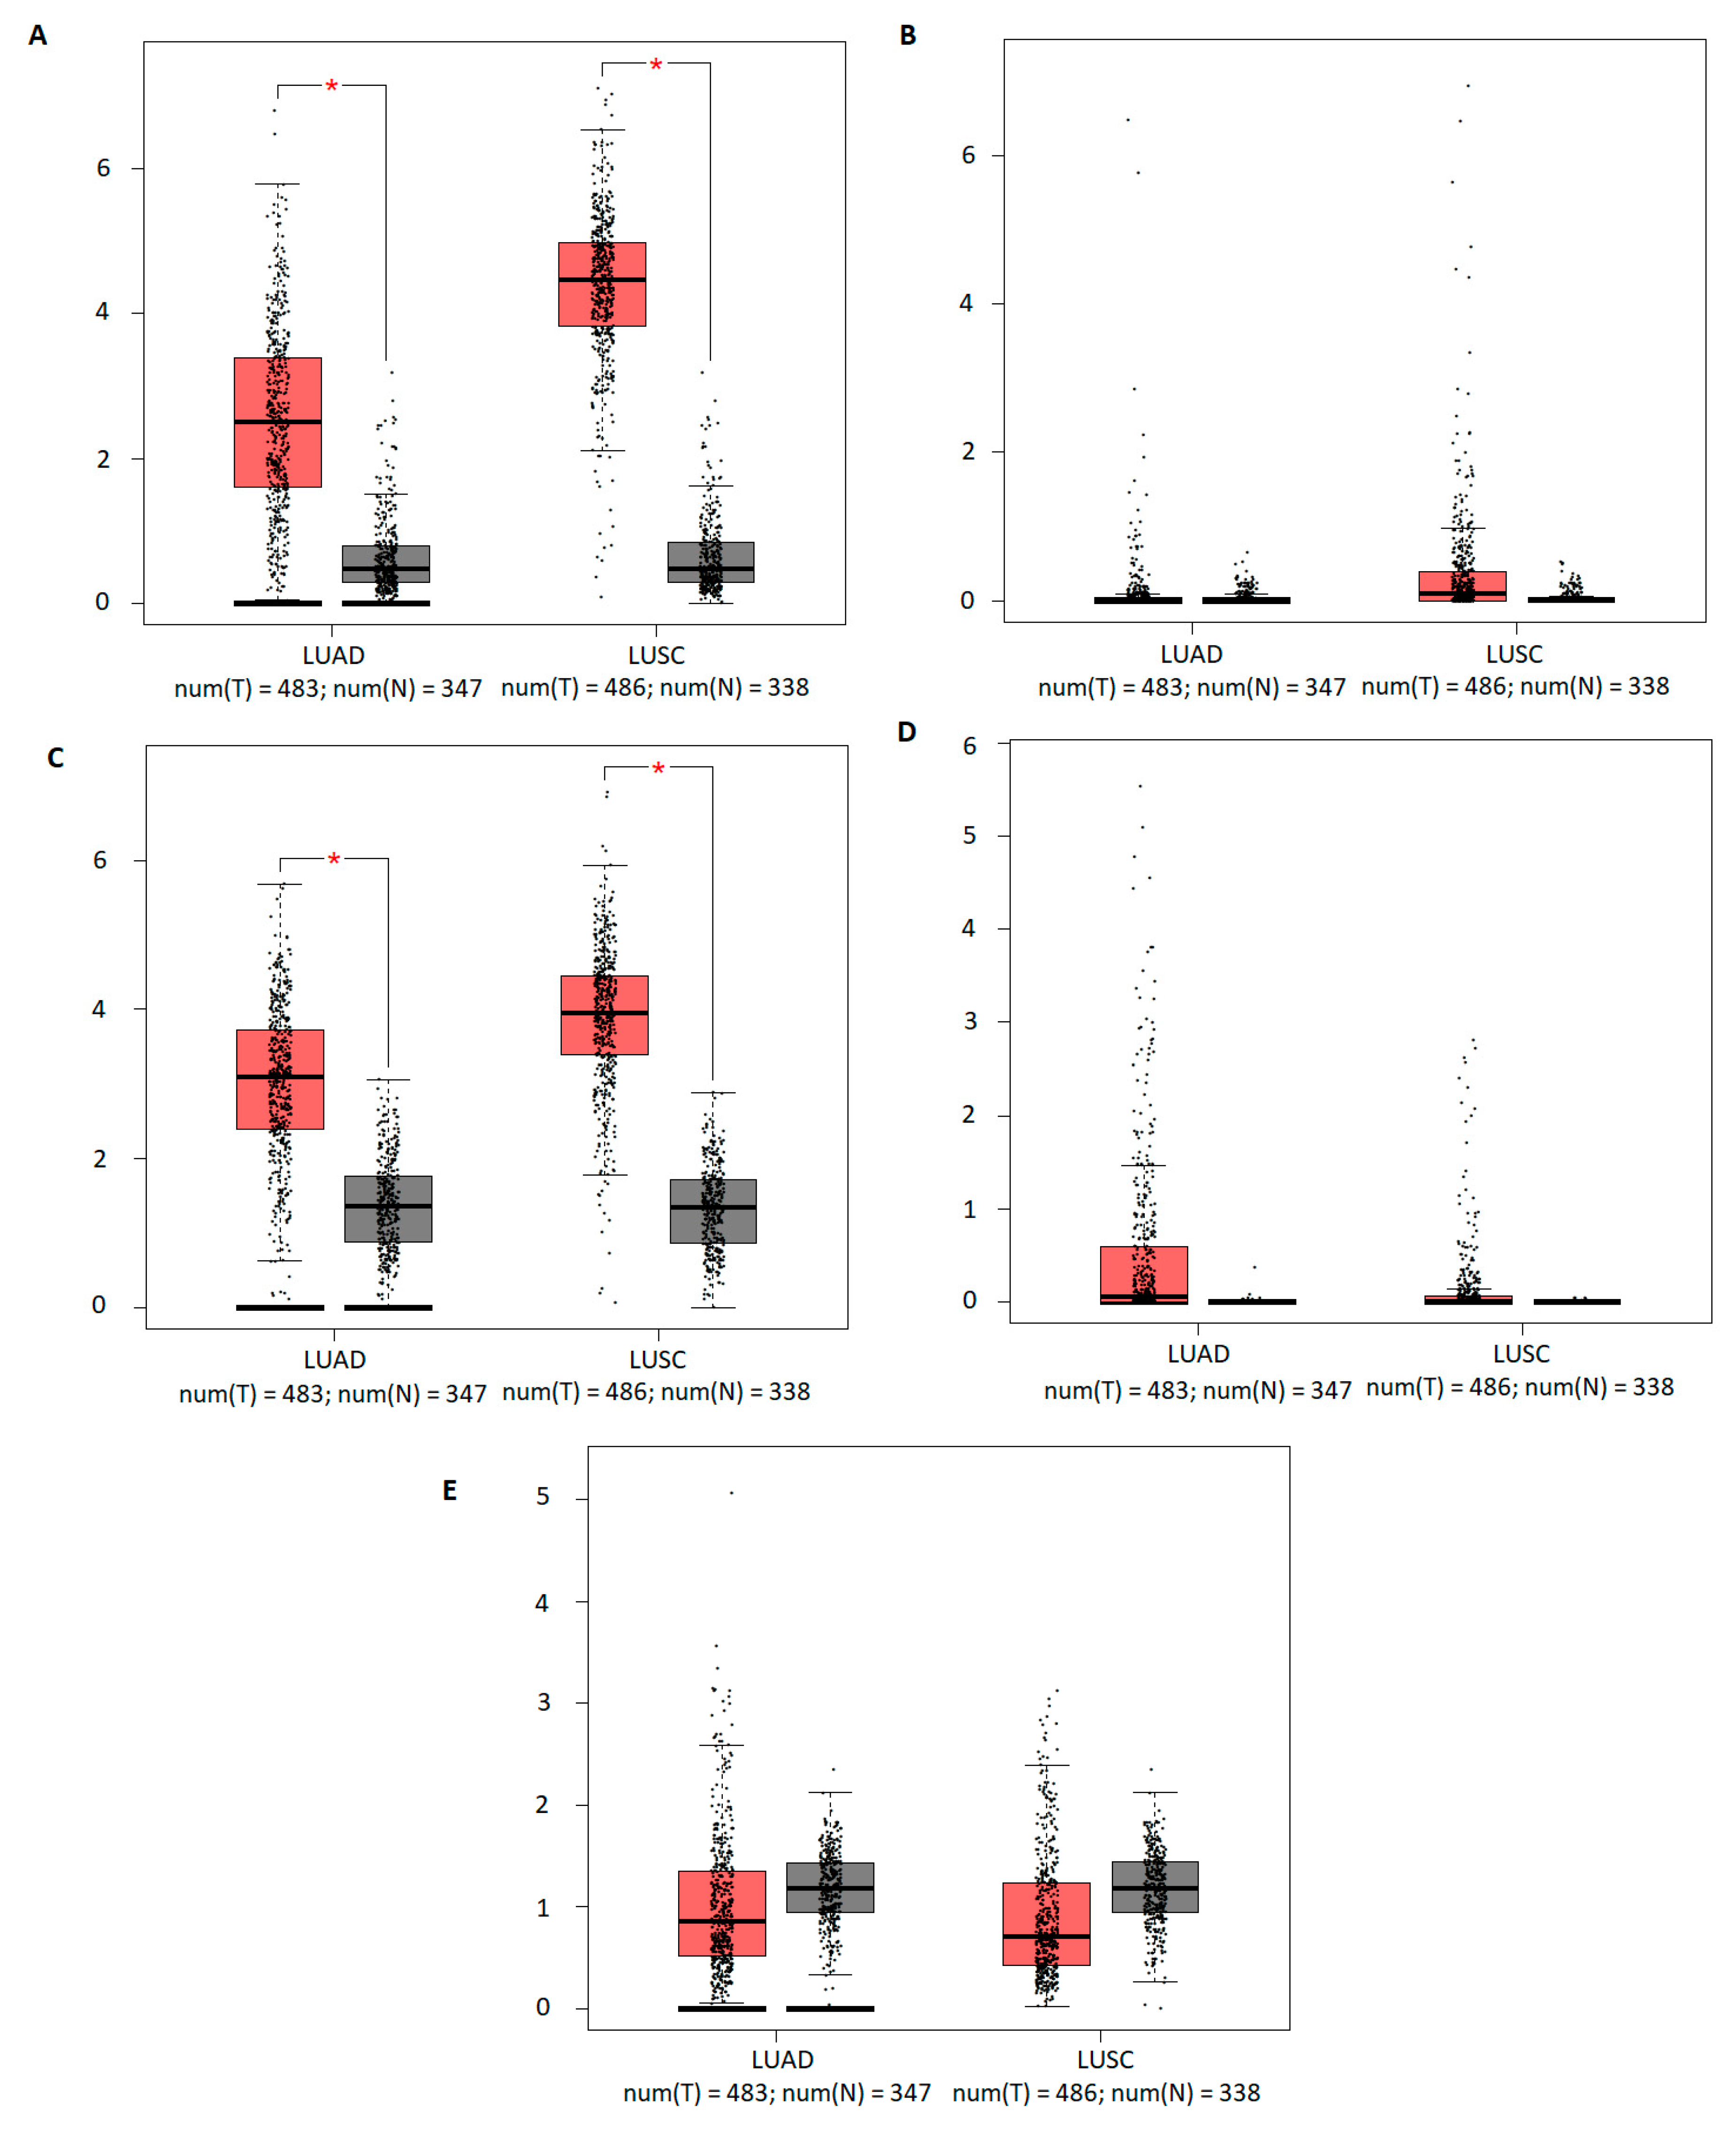
2.1. The mRNA Expression of Five TFAP2 Family Members in Cancer versus Normal Tissues
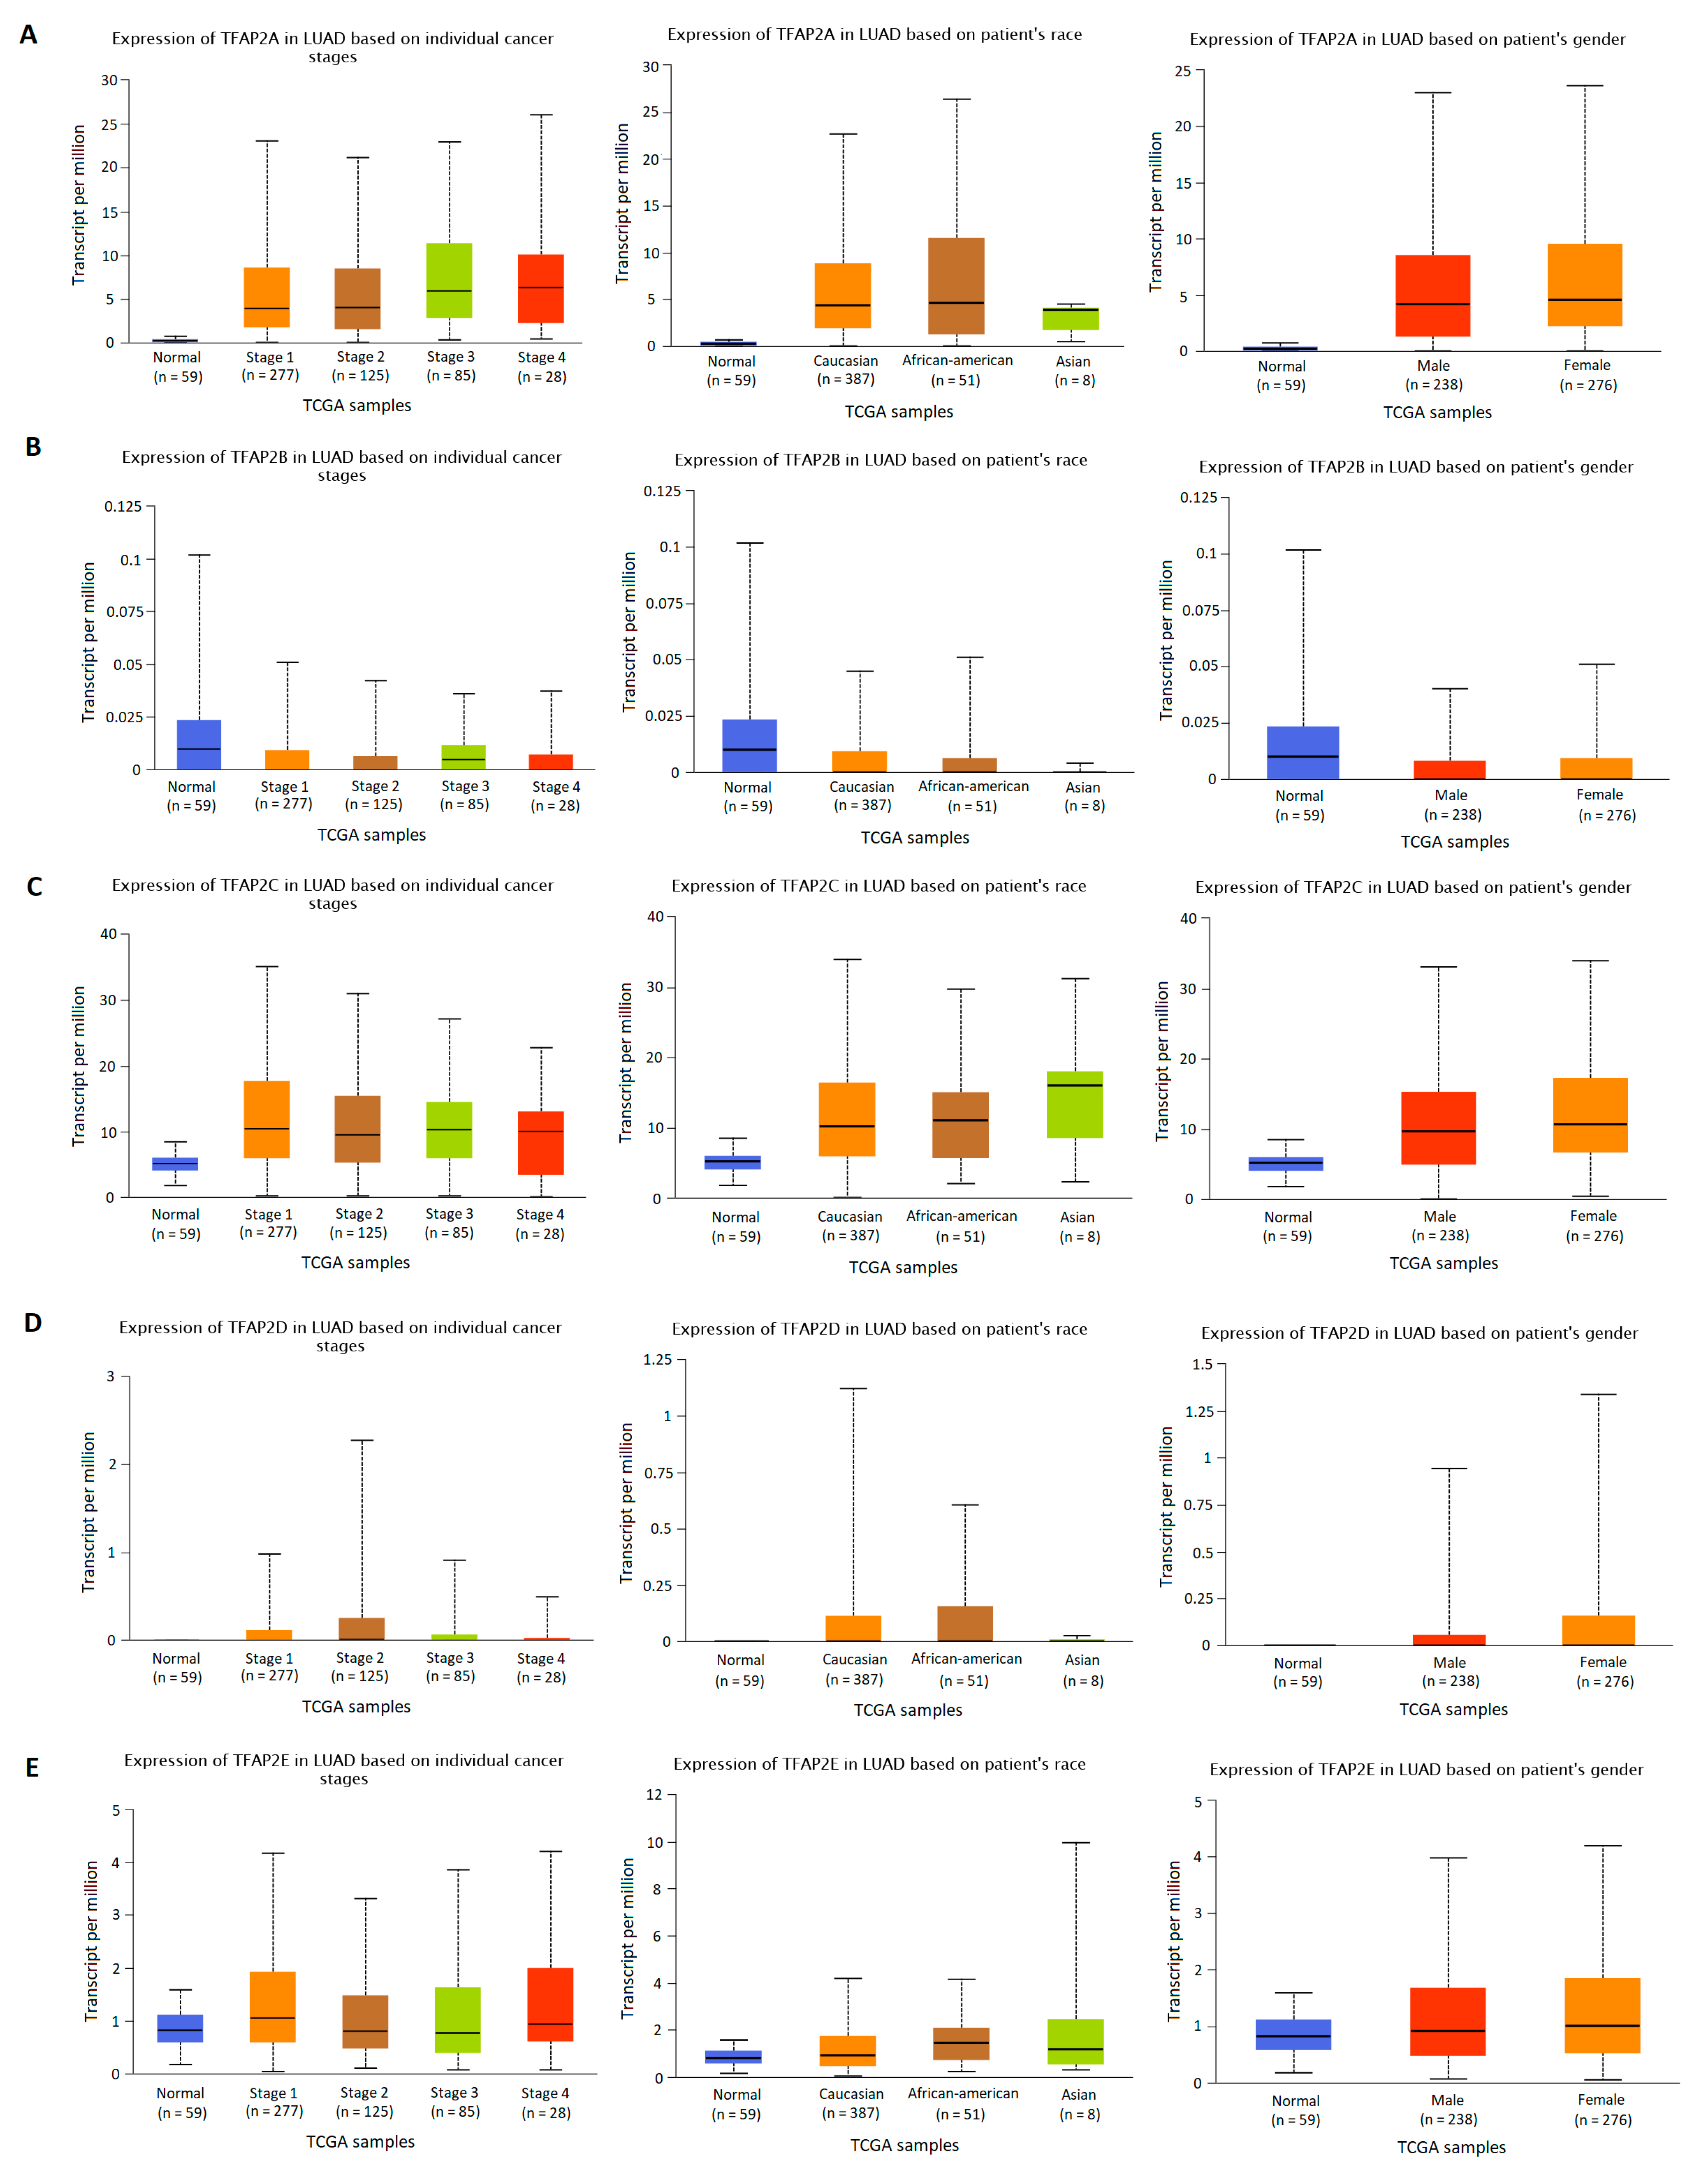
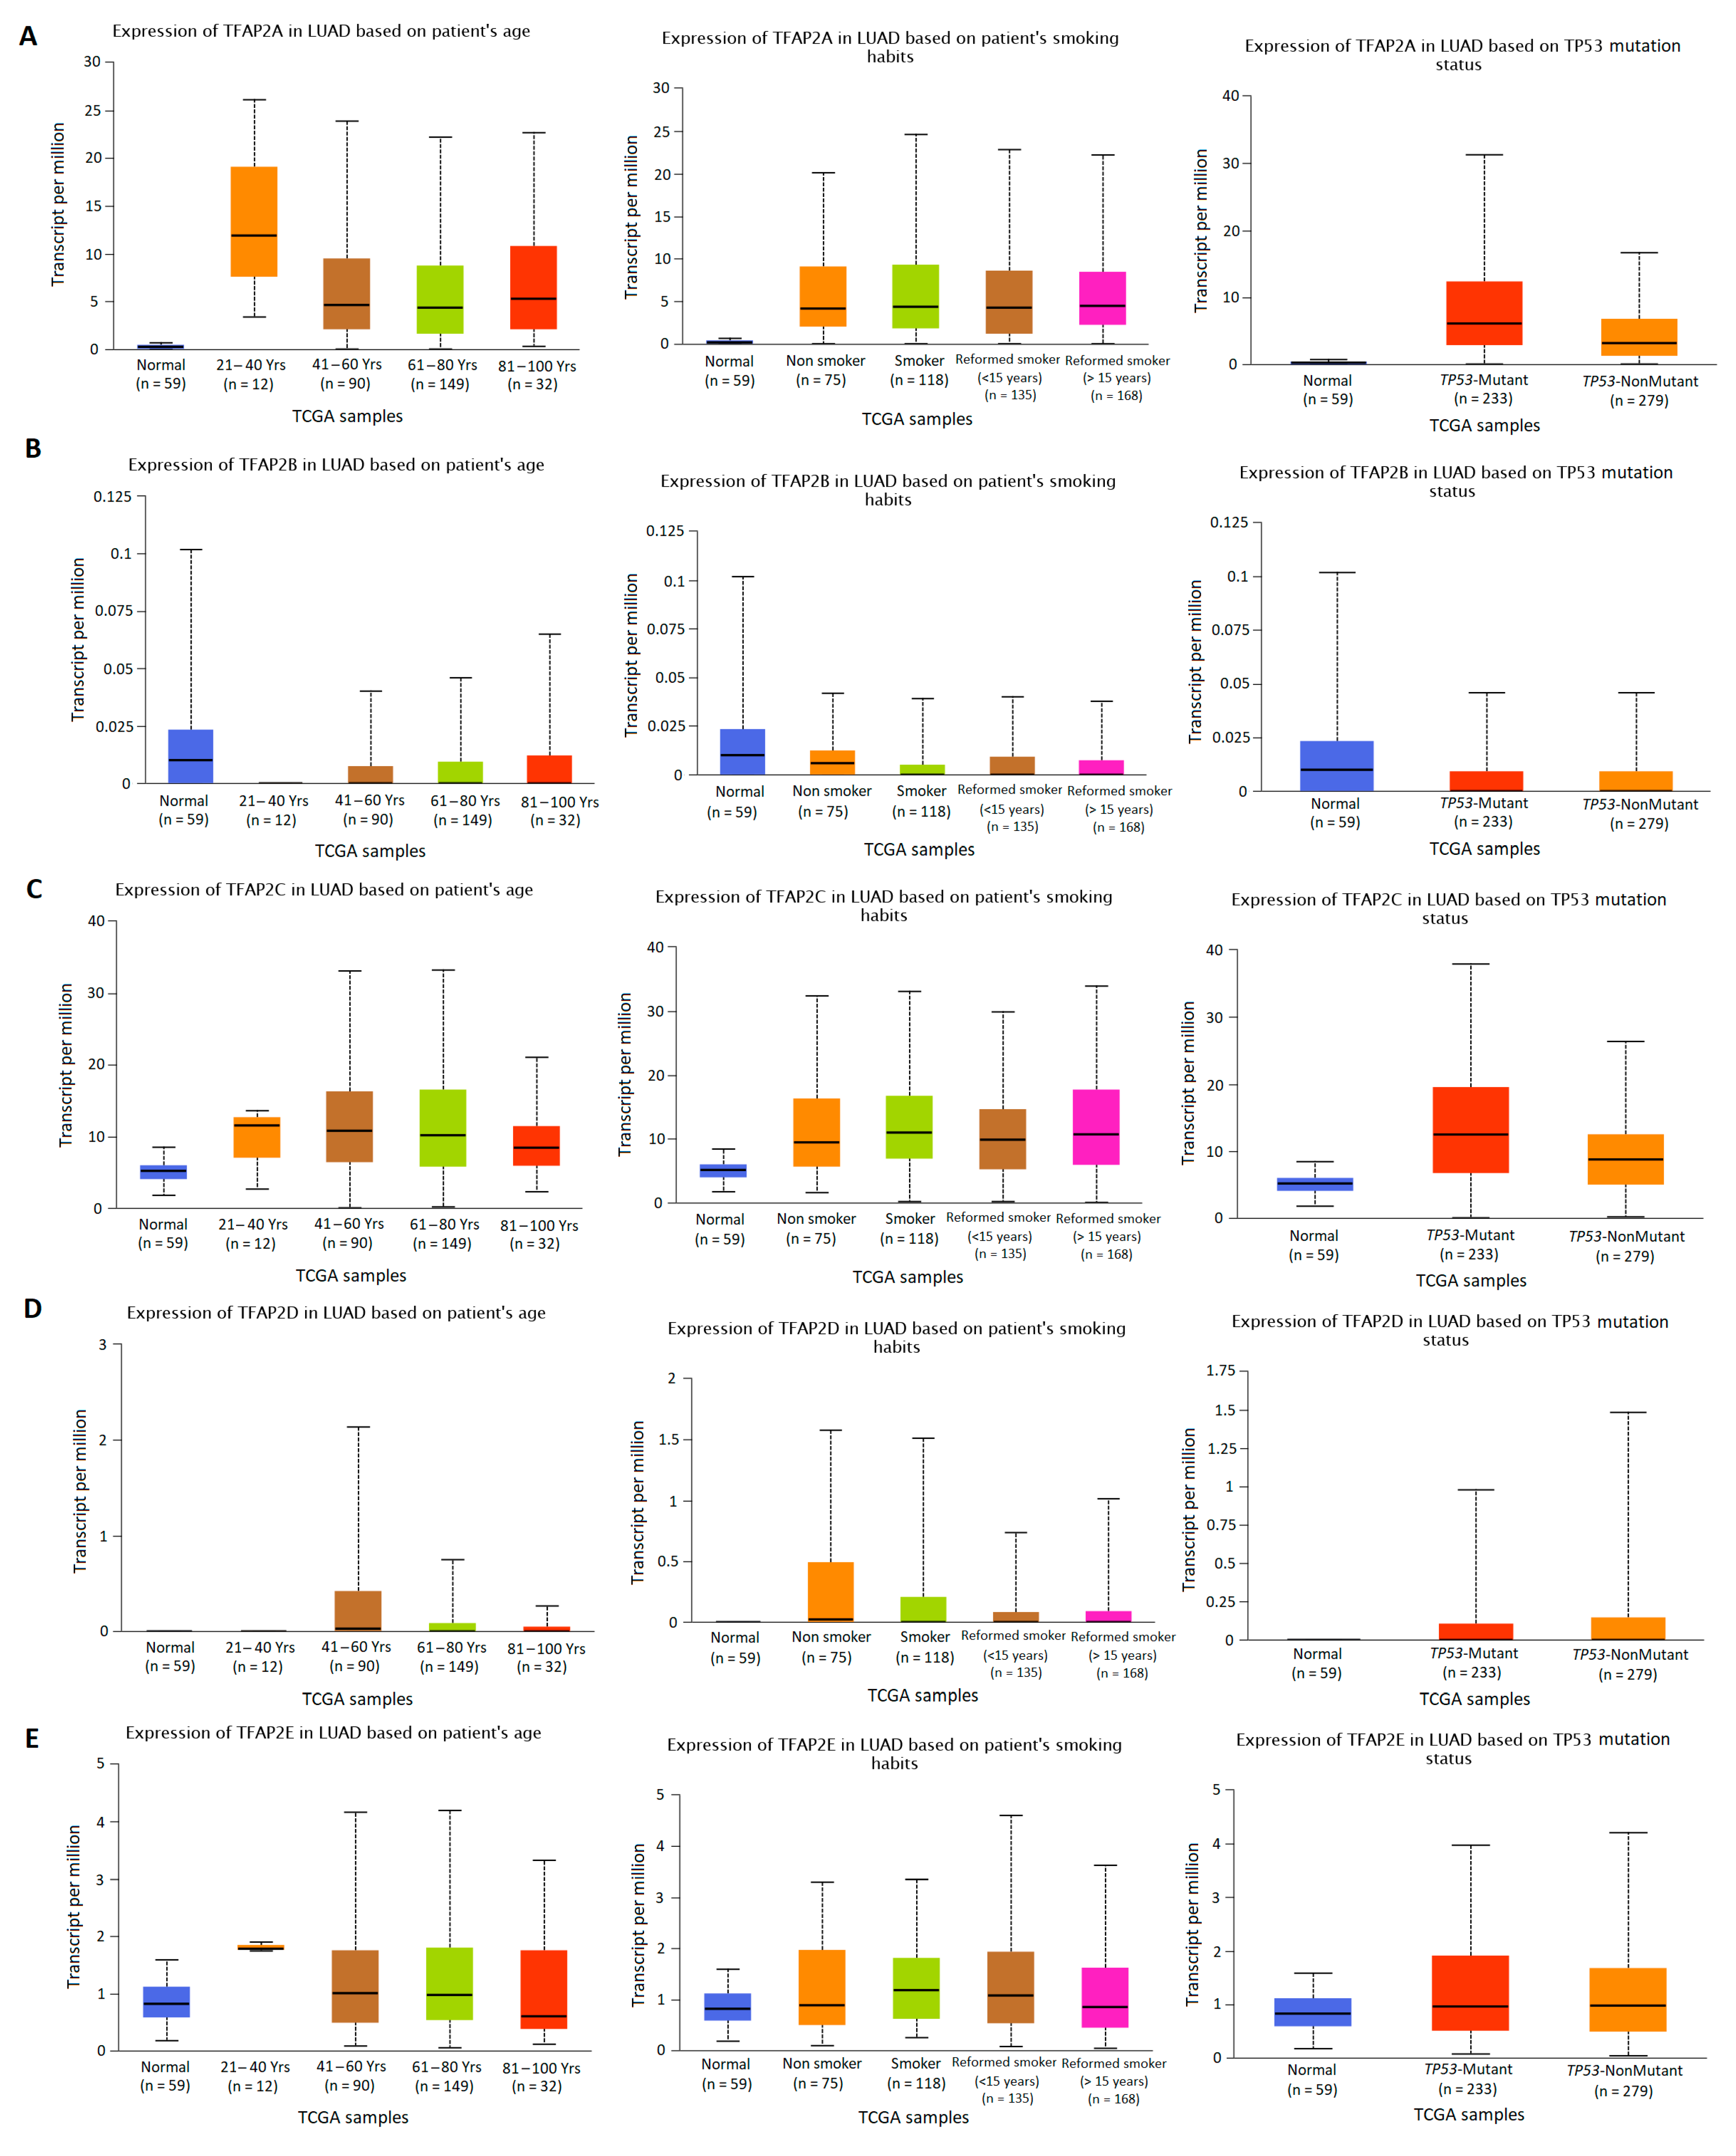
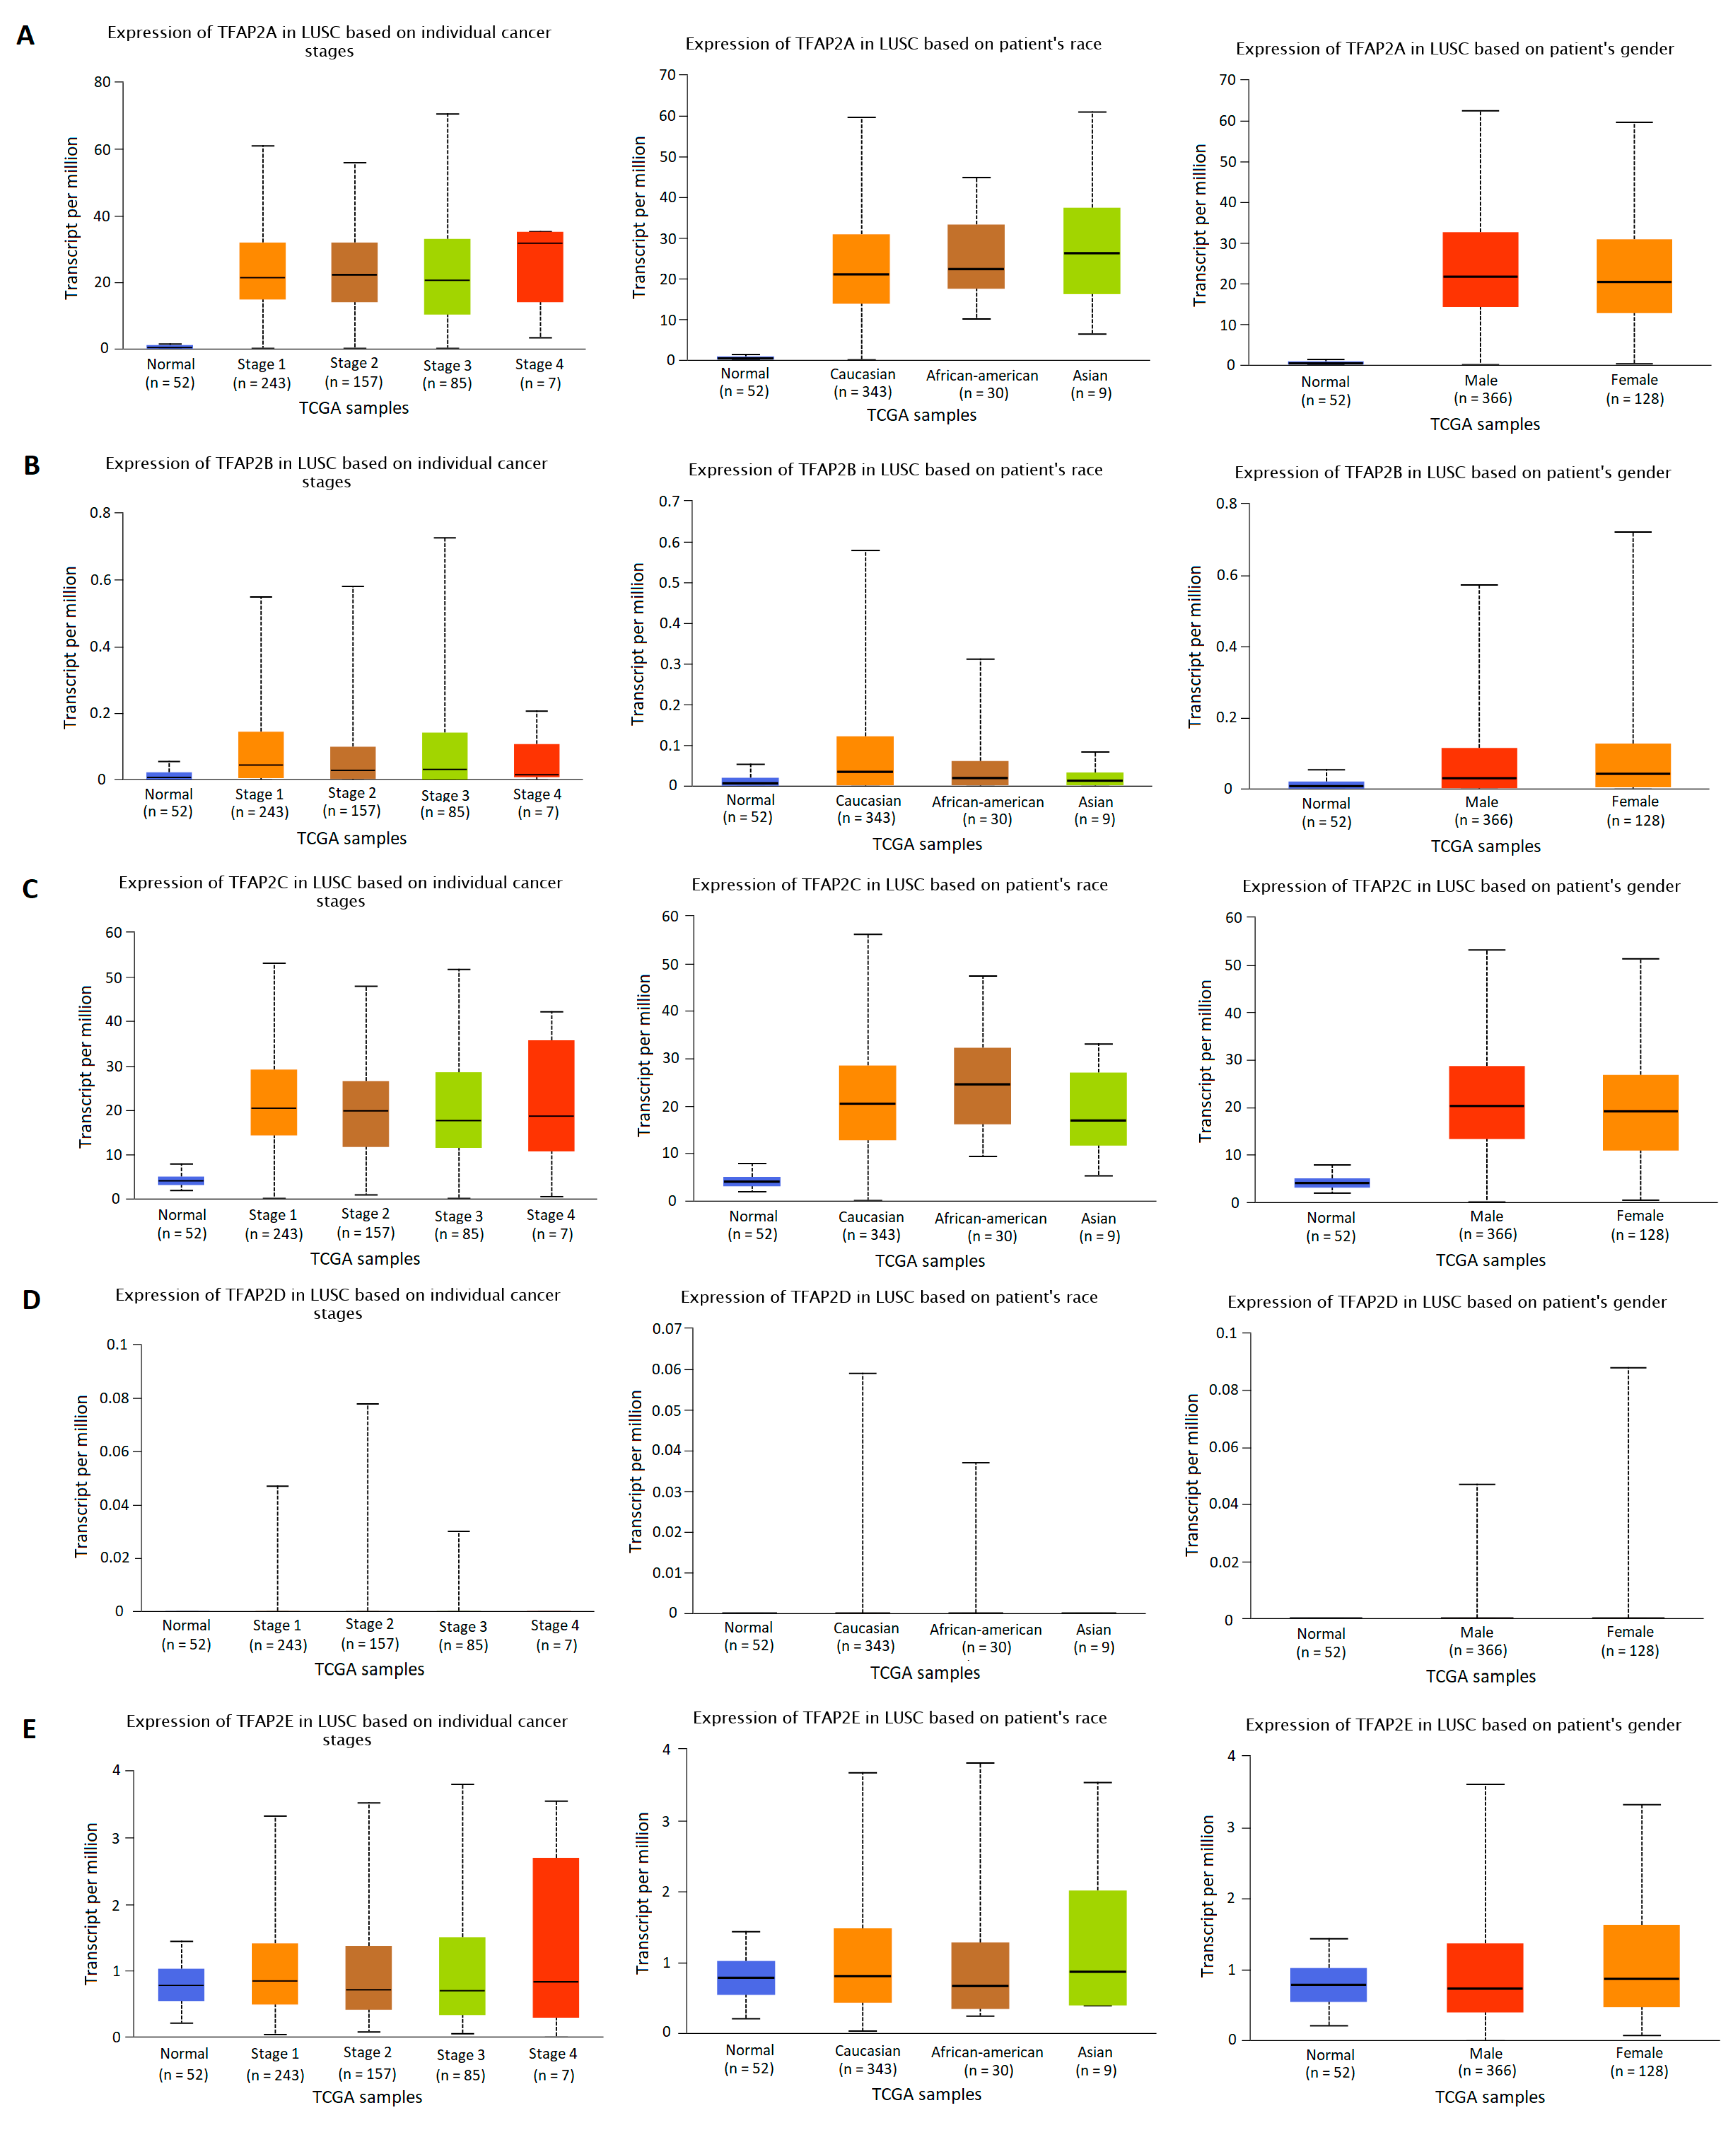
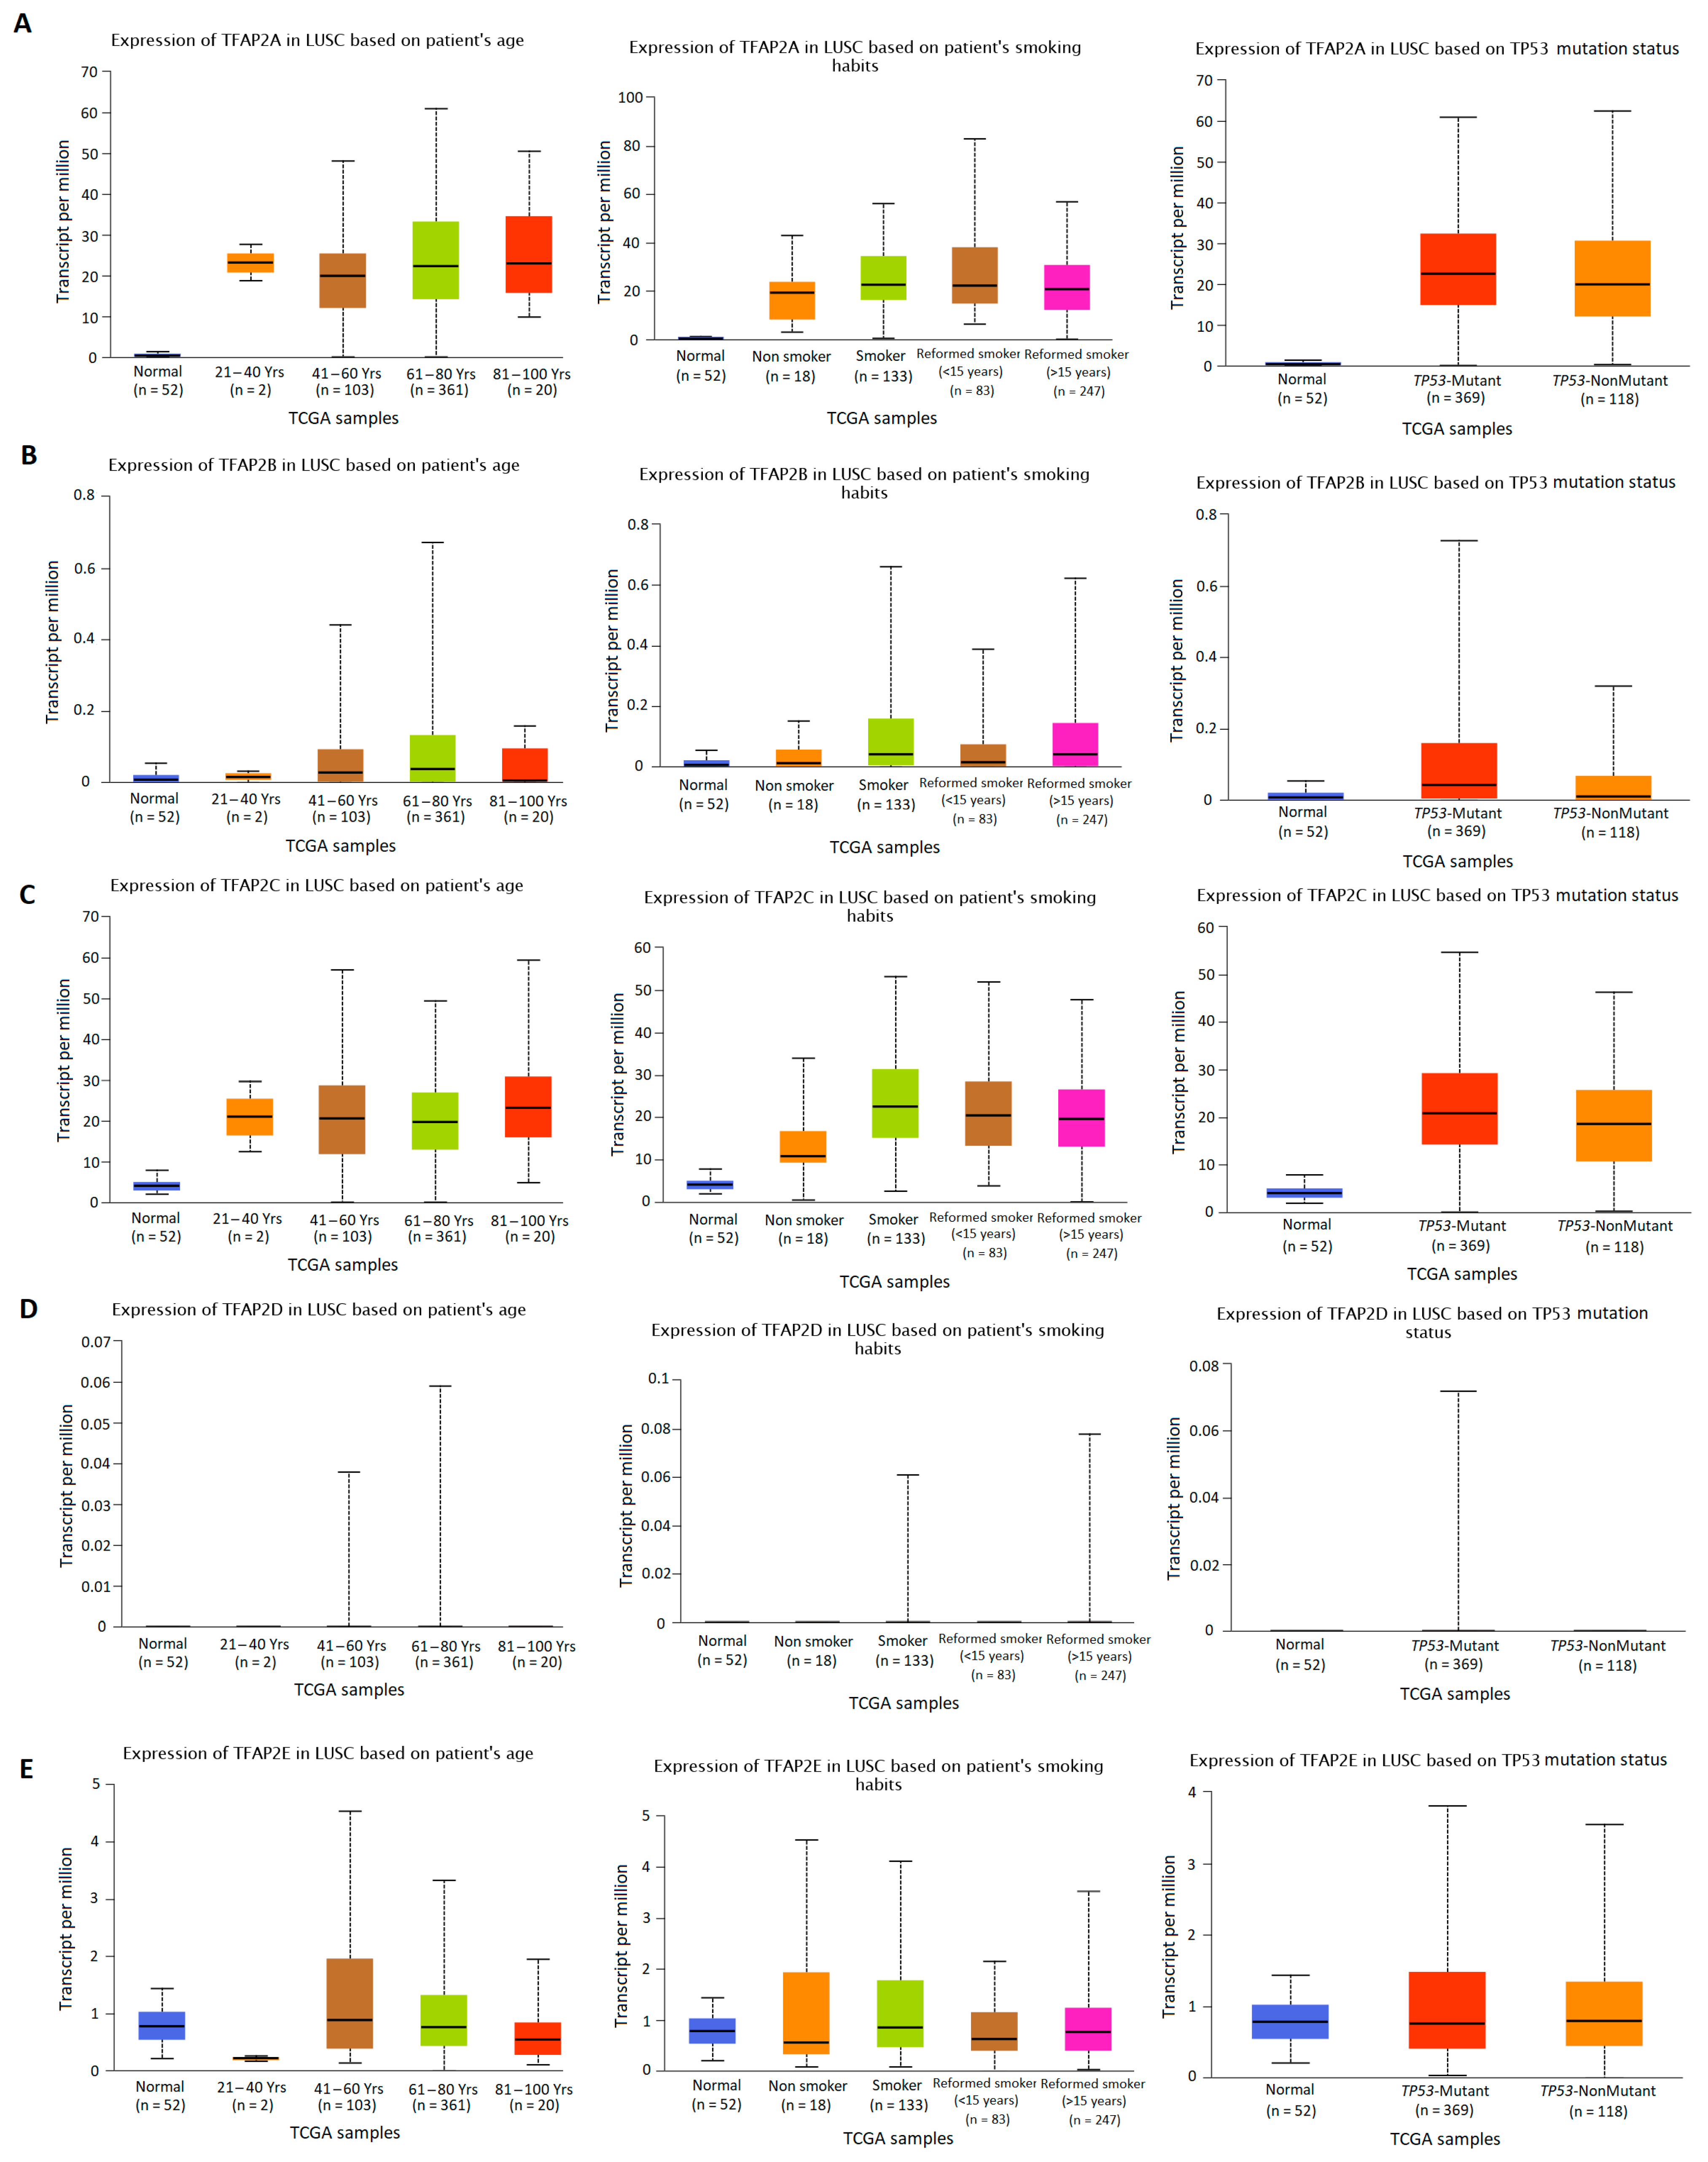
2.2. TFAP2 Family Members Expression Analysis Based on Clinical Characteristics in LUAD and LUSC
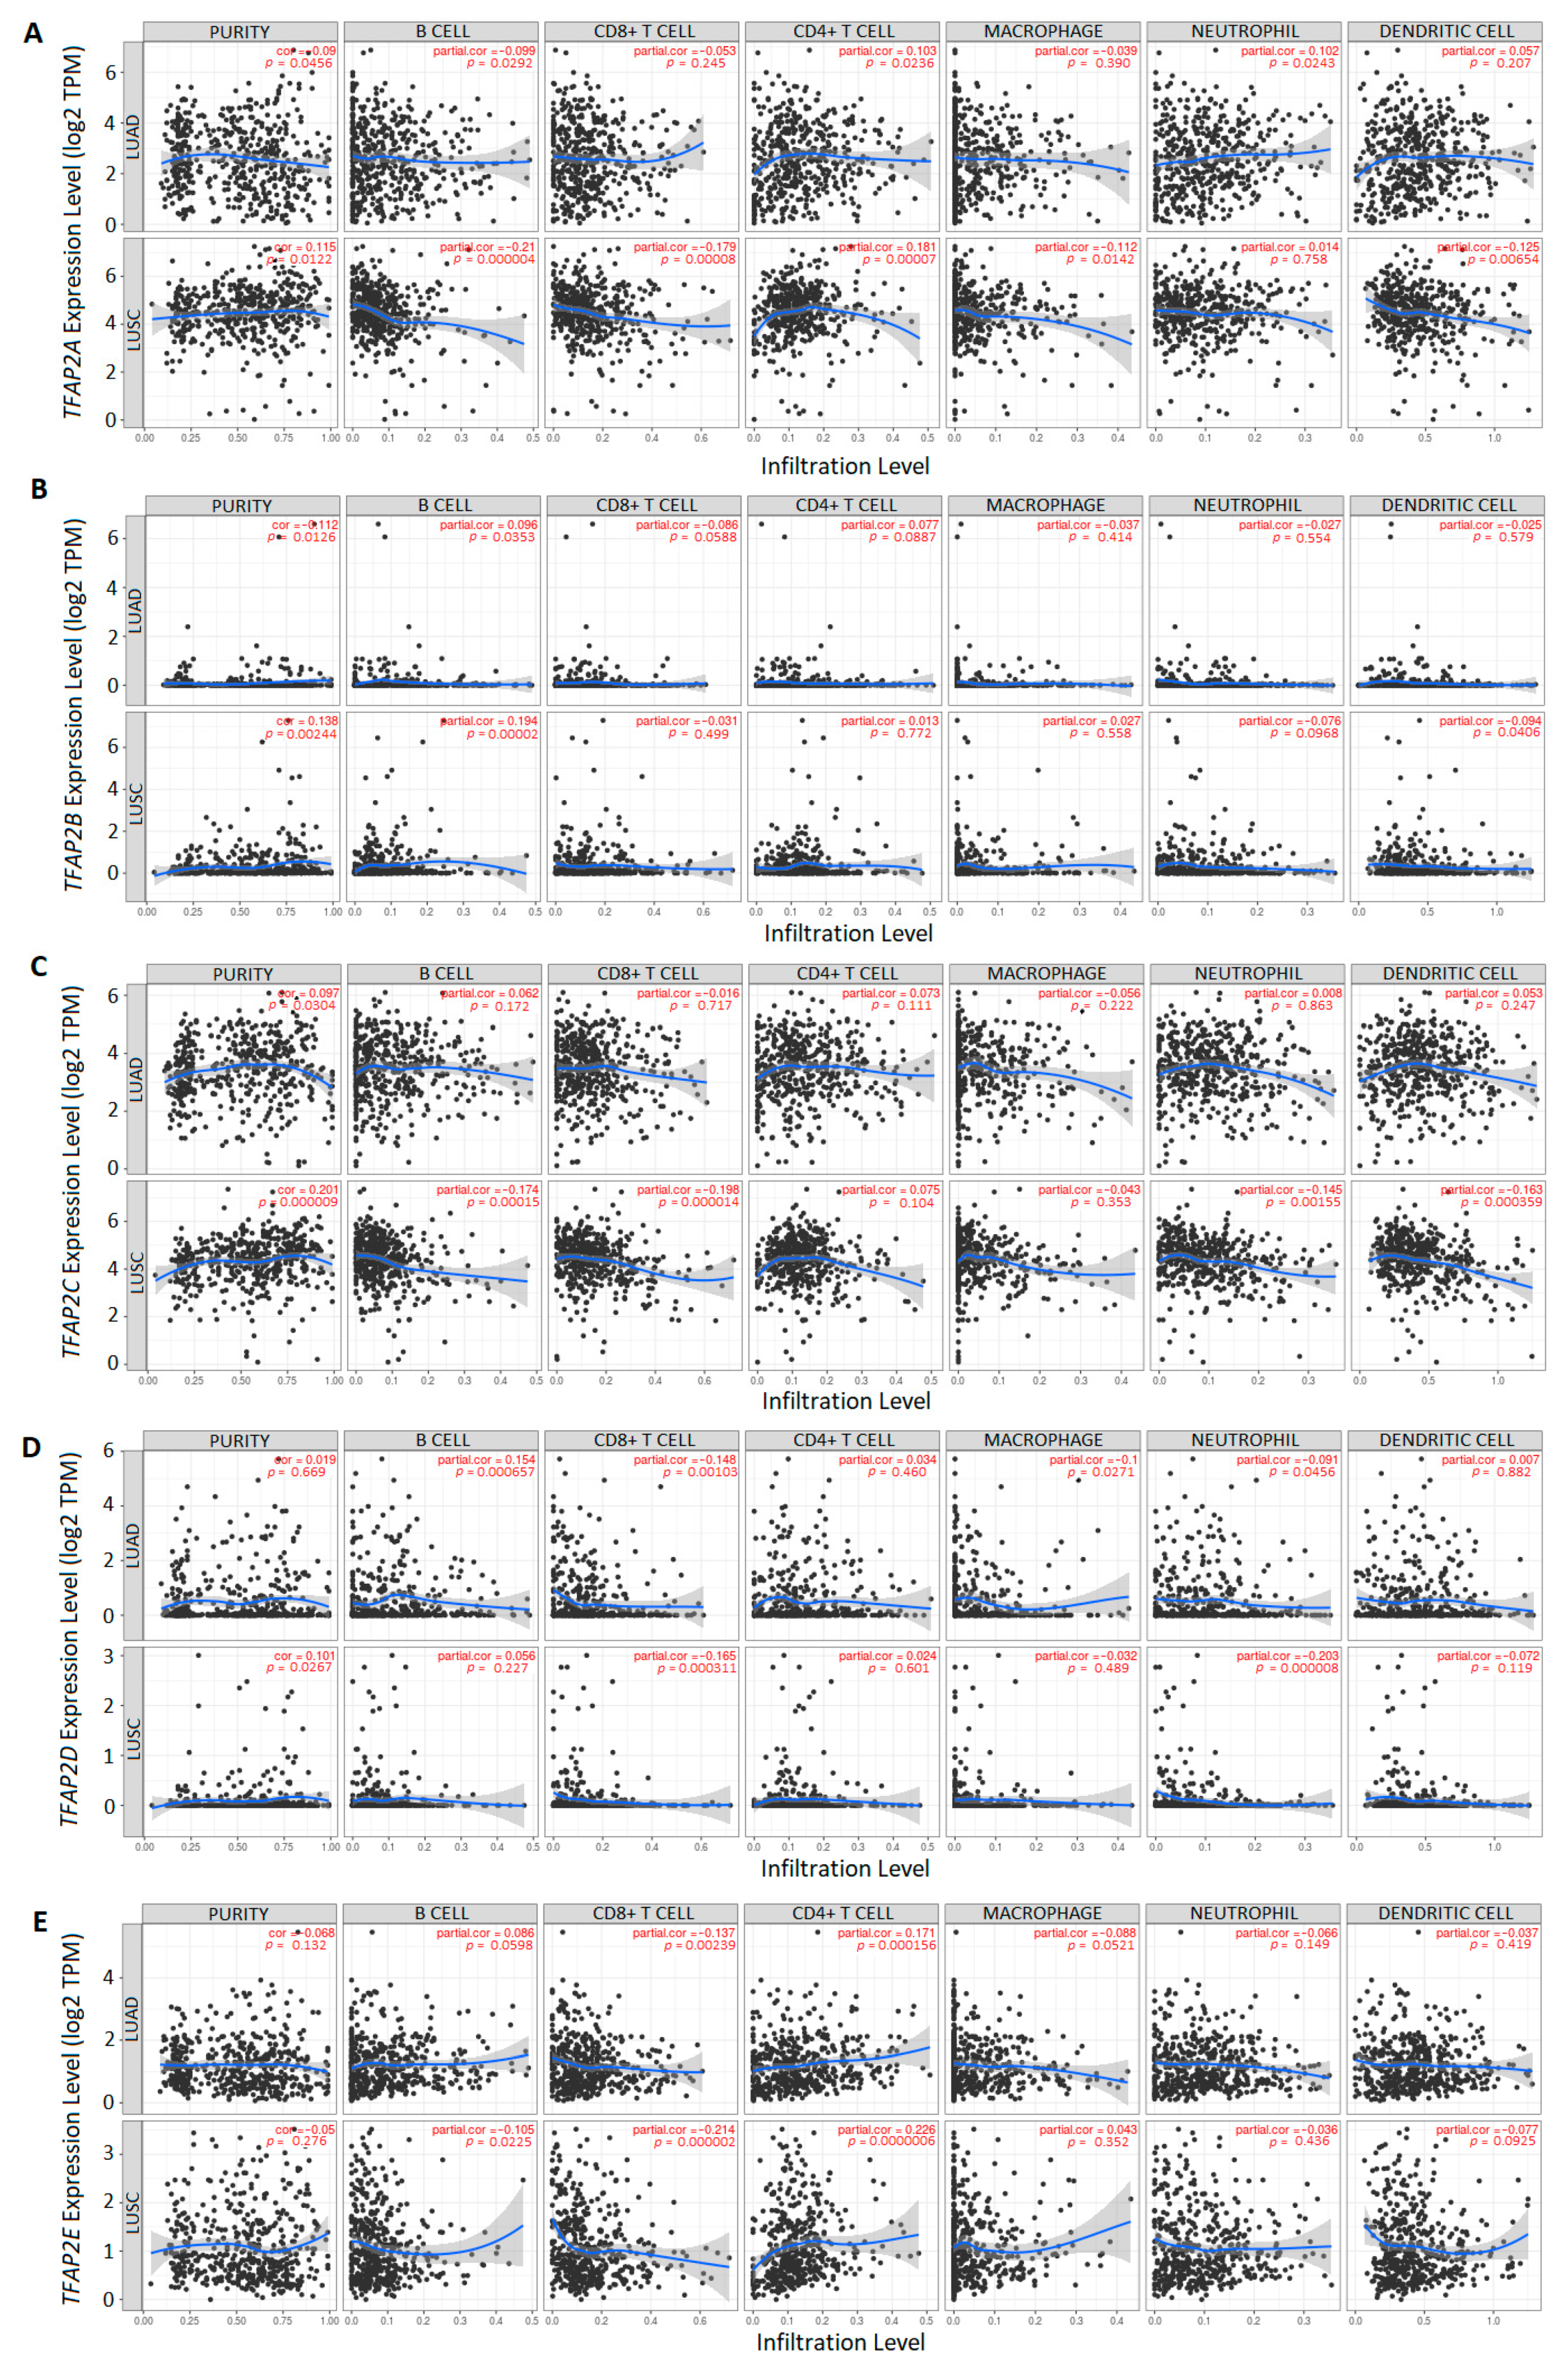
2.3. Immune Cells Infiltration Analysis Related to TFAP2 Family Members Expression in LUAD and LUSC
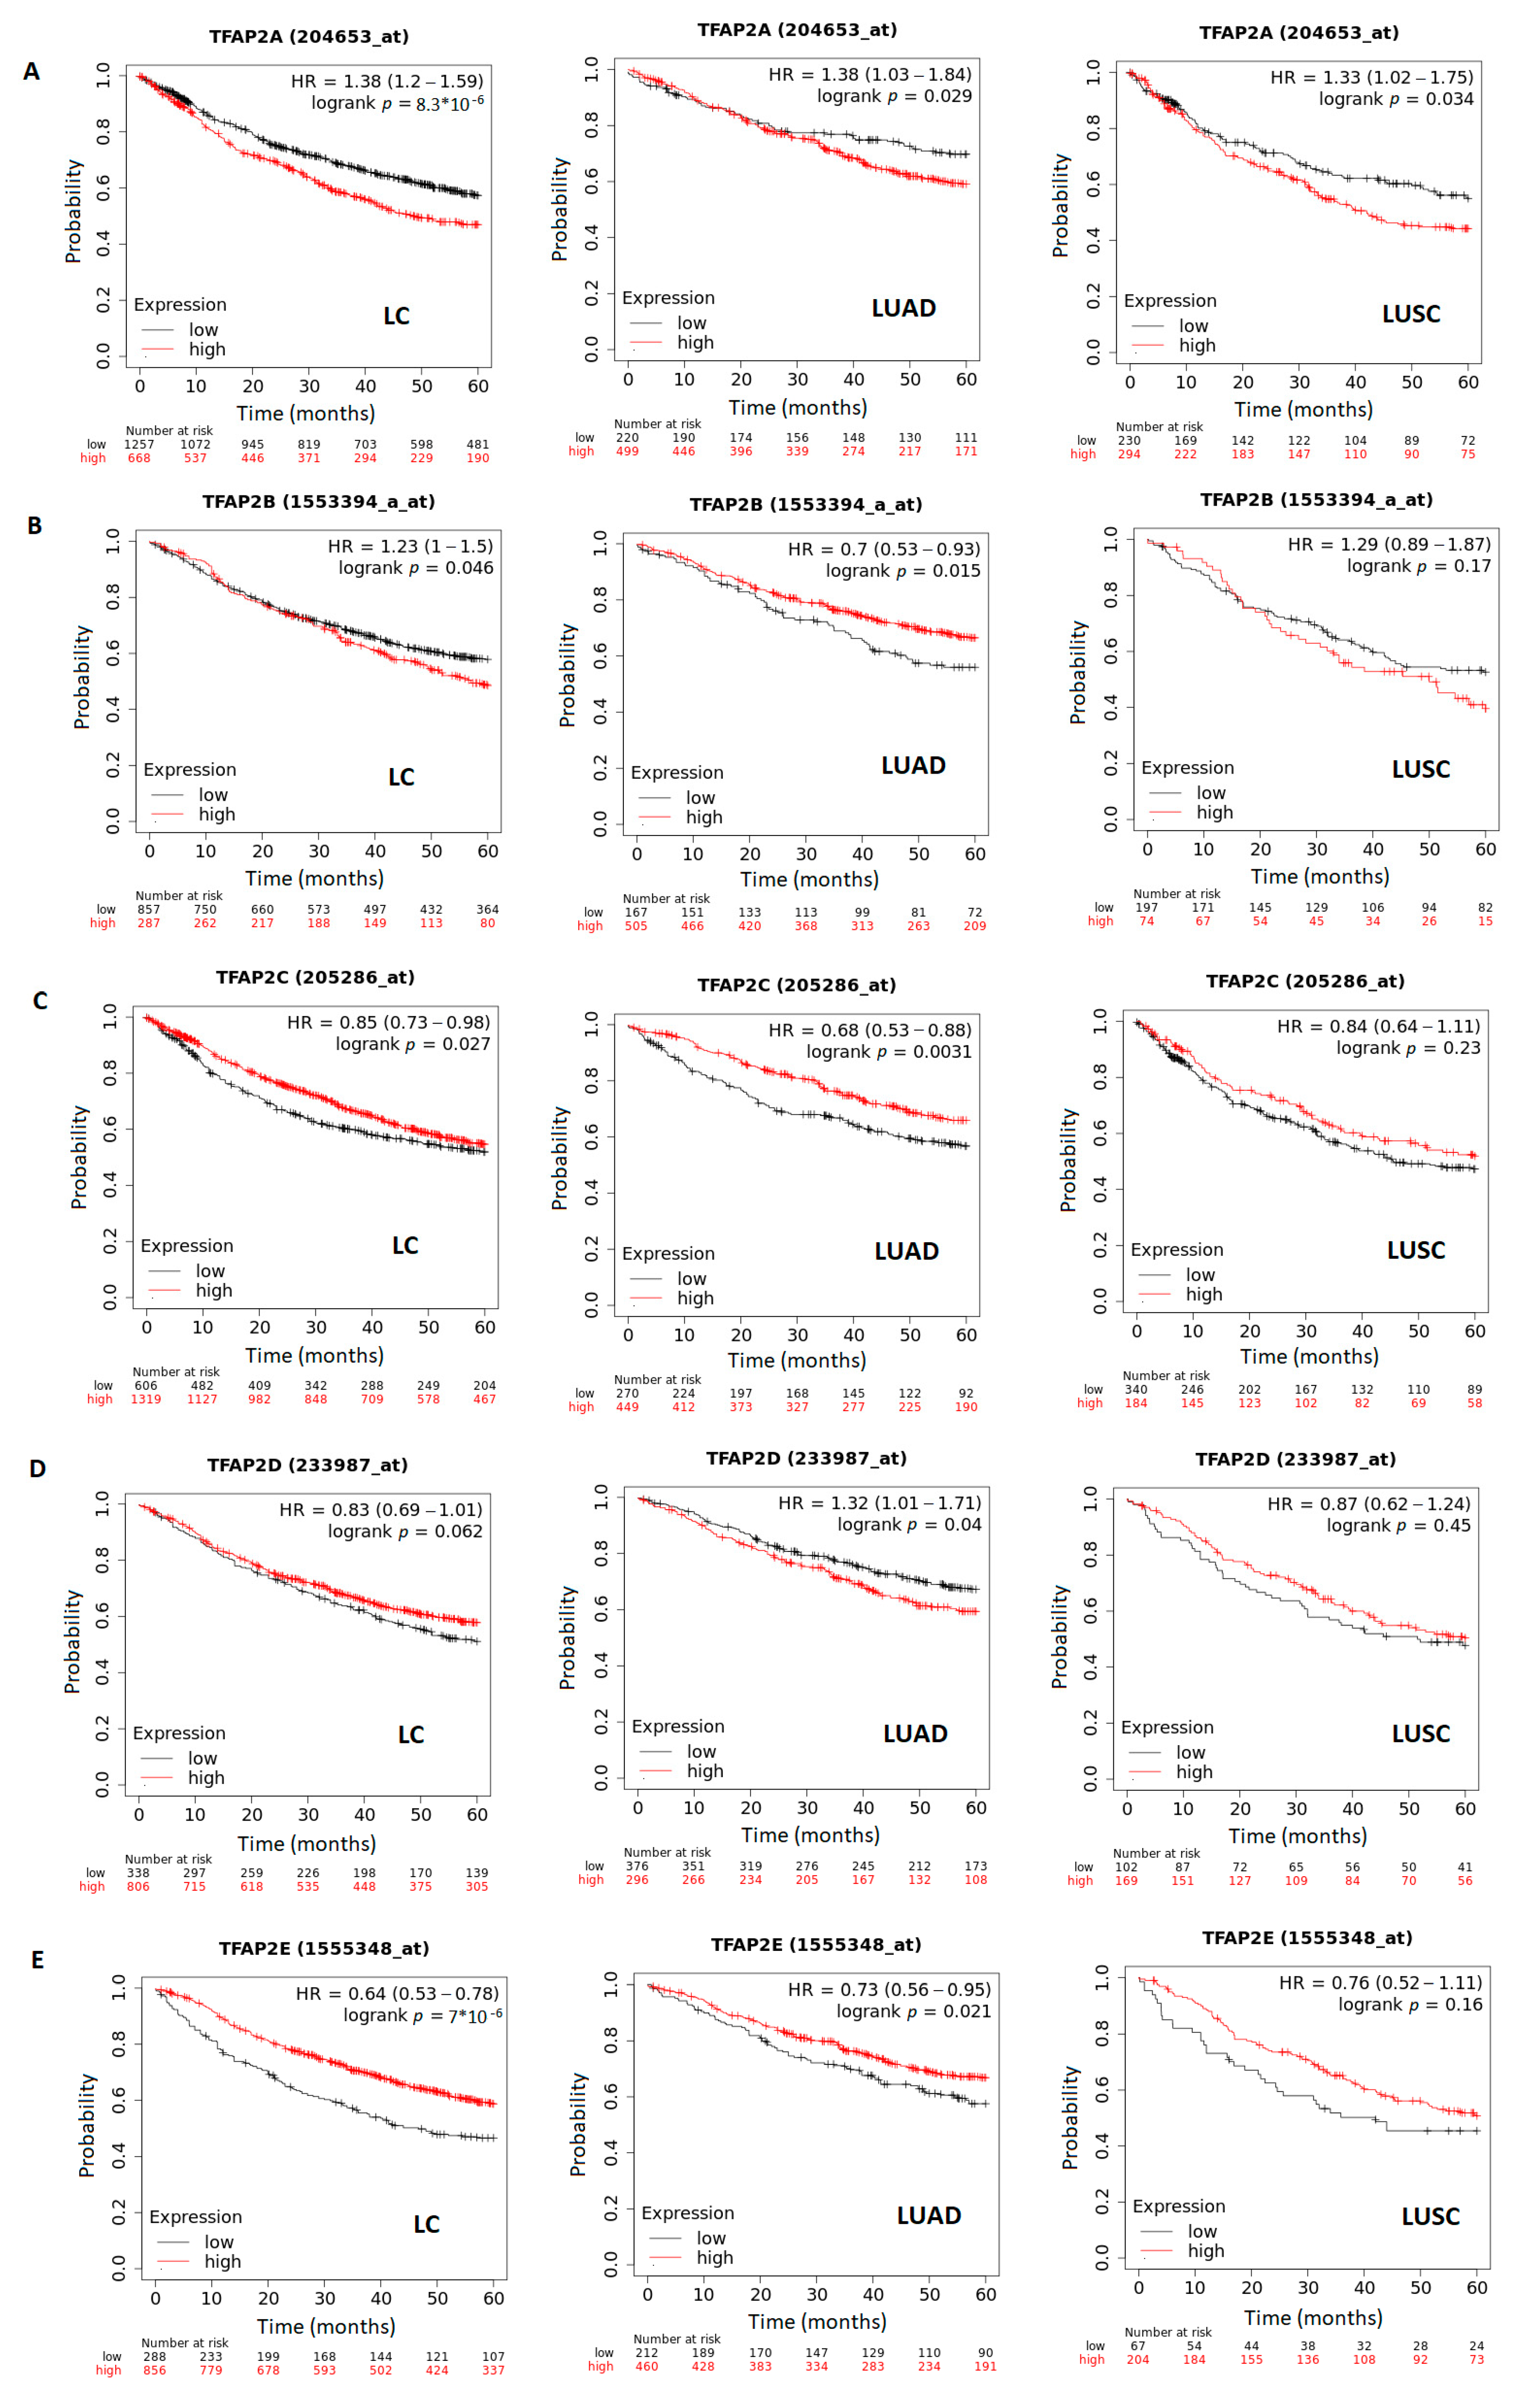
2.4. Survival Analysis Related to TFAP2 Family Members Expression in LUAD and LUSC
2.5. TFAP2 Family Members Mutations, Structural Variants and Copy Number Alterations in LUAD and LUSC
3. Results
3.1. The mRNA Expression of Five TFAP2 Family Members in Cancer versus Normal Tissues and in LUAD and LUSC Subtypes
3.2. The Results of TFAP2 Gene Family Members Expression Analysis Based on Clinical Characteristics in LUAD and LUSC
3.3. The Correlation between TFAP2 Gene Family Members Expression and Immune Cells Infiltration in LUAD and LUSC
3.4. The Correlation between Survival and TFAP2 Family Members Expression in LC, LUAD and LUSC
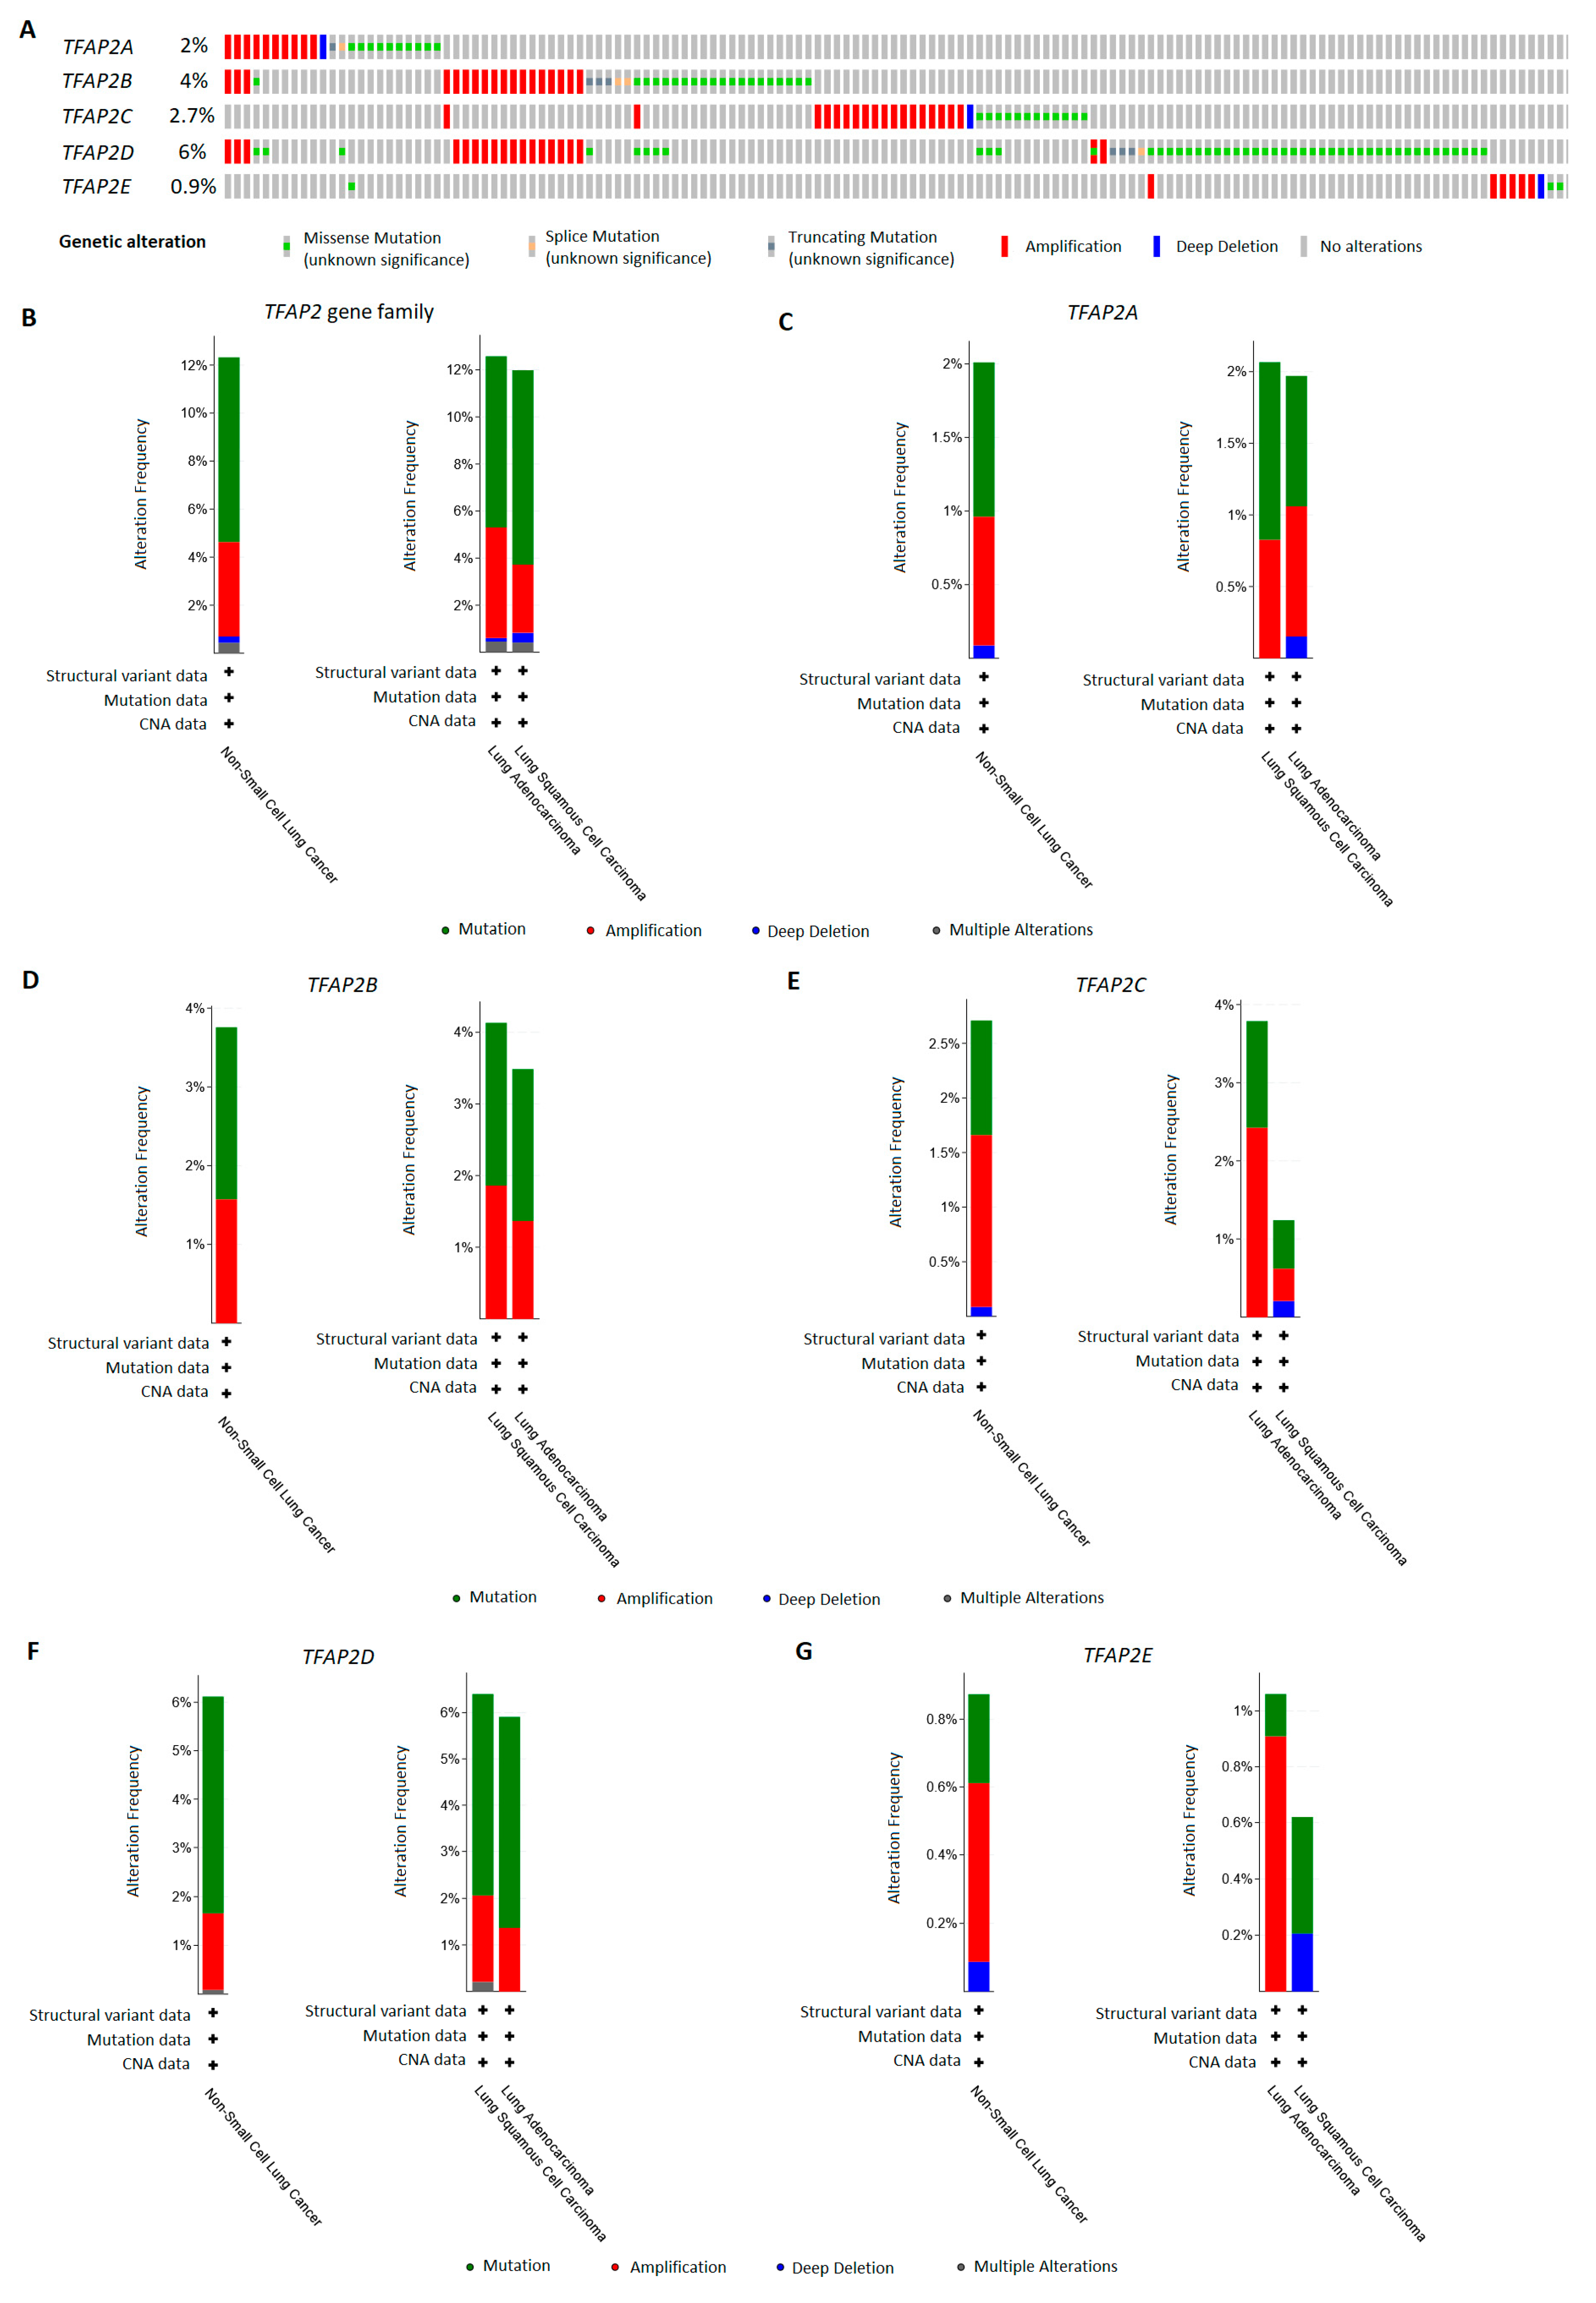
3.5. TFAP2 Family Members Alterations Frequency in LUAD and LUSC Patients
4. Discussion
Author Contributions
Funding
Institutional Review Board Statement
Informed Consent Statement
Data Availability Statement
Conflicts of Interest
References
- Chen, J.W.; Dhahbi, J. Lung adenocarcinoma and lung squamous cell carcinoma cancer classification, biomarker identification, and gene expression analysis using overlapping feature selection methods. Sci. Rep. 2021, 11, 13323. [Google Scholar] [CrossRef] [PubMed]
- Chen, Z.; Fillmore, C.M.; Hammerman, P.S.; Kim, C.F.; Wong, K.K. Non-small-cell lung cancers: A heterogeneous set of diseases. Nat. Rev. Cancer 2014, 14, 535–546, Correction in Nat. Rev. Cancer 2015, 15, 247. [Google Scholar] [CrossRef] [PubMed]
- Relli, V.; Trerotola, M.; Guerra, E.; Alberti, S. Abandoning the Notion of Non-Small Cell Lung Cancer. Trends Mol. Med. 2019, 25, 585–594. [Google Scholar] [CrossRef] [PubMed]
- Ding, Y.; Zhang, L.; Guo, L.; Wu, C.; Zhou, J.; Zhou, Y.; Ma, J.; Li, X.; Ji, P.; Wang, M.; et al. Comparative study on the mutational profile of adenocarcinoma and squamous cell carcinoma predominant histologic subtypes in Chinese non-small cell lung cancer patients. Thorac. Cancer 2020, 11, 103–112. [Google Scholar] [CrossRef] [PubMed]
- Xiao, J.; Lu, X.; Chen, X.; Zou, Y.; Liu, A.; Li, W.; He, B.; He, S.; Chen, Q. Eight potential biomarkers for distinguishing between lung adenocarcinoma and squamous cell carcinoma. Oncotarget 2017, 8, 71759–71771. [Google Scholar] [CrossRef] [PubMed]
- Kołat, D.; Kałuzińska, Ż.; Bednarek, A.K.; Płuciennik, E. The biological characteristics of transcription factors AP-2α and AP-2γ and their importance in various types of cancers. Biosci. Rep. 2019, 39, BSR20181928. [Google Scholar] [CrossRef] [Green Version]
- Wenke, A.K.; Bosserhoff, A.K. Roles of AP-2 transcription factors in the regulation of cartilage and skeletal development. FEBS J. 2010, 277, 894–902. [Google Scholar] [CrossRef]
- Eckert, D.; Buhl, S.; Weber, S.; Jäger, R.; Schorle, H. The AP-2 family of transcription factors. Genome Biol. 2005, 6, 246. [Google Scholar] [CrossRef] [Green Version]
- Kannan, P.; Tainsky, M.A. Coactivator PC4 mediates AP-2 transcriptional activity and suppresses ras-induced transformation dependent on AP-2 transcriptional interference. Mol. Cell Biol. 1999, 19, 899–908. [Google Scholar] [CrossRef] [Green Version]
- Hilger-Eversheim, K.; Moser, M.; Schorle, H.; Buettner, R. Regulatory roles of AP-2 transcription factors in vertebrate development, apoptosis and cell-cycle control. Gene 2000, 260, 1–12. [Google Scholar] [CrossRef]
- Zhao, F.; Satoda, M.; Licht, J.D.; Hayashizaki, Y.; Gelb, B.D. Cloning and characterization of a novel mouse AP-2 transcription factor, AP-2delta, with unique DNA binding and transactivation properties. J. Biol. Chem. 2001, 276, 40755–40760. [Google Scholar] [CrossRef] [Green Version]
- Kołat, D.; Kałuzińska, Ż.; Orzechowska, M.; Bednarek, A.K.; Płuciennik, E. Functional genomics of AP-2α and AP-2γ in cancers: In silico study. BMC Med. Genom. 2020, 13, 174. [Google Scholar] [CrossRef] [PubMed]
- Li, Q.; Dashwood, R.H. Activator protein 2alpha associates with adenomatous polyposis coli/beta-catenin and Inhibits beta-catenin/T-cell factor transcriptional activity in colorectal cancer cells. J. Biol. Chem. 2004, 279, 45669–45675. [Google Scholar] [CrossRef] [PubMed] [Green Version]
- Yang, Y.L.; Zhao, L.Y. AP-2 Family of Transcription Factors: Critical Regulators of Human Development and Cancer. J. Cancer Treatment Diagn. 2021, 5, 1–4. [Google Scholar] [CrossRef]
- Orso, F.; Penna, E.; Cimino, D.; Astanina, E.; Maione, F.; Valdembri, D.; Giruado, E.; Serini, G.; Sismondi, P.; De Bortoli, M.; et al. AP-2alpha and AP-2gamma regulate tumor progression via specific genetic programs. FASEB J. 2008, 22, 2702–2714. [Google Scholar] [CrossRef]
- Hallberg, A.R.; Vorrink, S.U.; Hudachek, D.R.; Cramer-Morales, K.; Milhem, M.M.; Cornell, R.A.; Domann, F.E. Aberrant CpG methylation of the TFAP2A gene constitutes a mechanism for loss of TFAP2A expression in human metastatic melanoma. Epigenetics 2014, 9, 1641–1647. [Google Scholar] [CrossRef] [Green Version]
- Li, H.; Watts, G.S.; Oshiro, M.M.; Futscher, B.W.; Domann, F.E. AP-2alpha and AP-2gamma are transcriptional targets of p53 in human breast carcinoma cells. Oncogene 2006, 25, 5405–5415. [Google Scholar] [CrossRef] [PubMed] [Green Version]
- Sotiriou, C.; Wirapati, P.; Loi, S.; Harris, A.; Fox, S.; Smeds, J.; Nordgren, H.; Farmer, P.; Praz, V.; Haibe-Kains, B.; et al. Gene expression profiling in breast cancer: Understanding the molecular basis of histologic grade to improve prognosis. J. Natl. Cancer Inst. 2006, 98, 262–272. [Google Scholar] [CrossRef]
- Lian, W.; Zhang, L.; Yang, L.; Chen, W. AP-2α reverses vincristine-induced multidrug resistance of SGC7901 gastric cancer cells by inhibiting the Notch pathway. Apoptosis 2017, 22, 933–941. [Google Scholar] [CrossRef]
- Makhov, P.B.; Golovine, K.V.; Kutikov, A.; Canter, D.J.; Rybko, V.A.; Roshchin, D.A.; Matveev, V.B.; Uzzo, R.G.; Kolenko, V.M. Reversal of epigenetic silencing of AP-2alpha results in increased zinc uptake in DU-145 and LNCaP prostate cancer cells. Carcinogenesis 2011, 32, 1773–1781. [Google Scholar] [CrossRef] [Green Version]
- Chang, T.-H.; Tsai, M.-F.; Gow, C.-H.; Wu, S.-G.; Liu, Y.-N.; Chang, Y.-L.; Yu, S.-L.; Tsai, H.-C.; Lin, S.-W.; Chen, Y.-W.; et al. Upregulation of microRNA-137 expression by Slug promotes tumor invasion and metastasis of non-small cell lung cancer cells through suppression of TFAP2C. Cancer Lett. 2017, 402, 190–202. [Google Scholar] [CrossRef] [PubMed]
- Gao, S.L.; Wang, L.Z.; Liu, H.Y.; Liu, D.L.; Xie, L.M.; Zhang, Z.W. miR-200a inhibits tumor proliferation by targeting AP-2γ in neuroblastoma cells. Asian Pac. J. Cancer Prev. 2014, 15, 4671–4676. [Google Scholar] [CrossRef] [PubMed] [Green Version]
- Lal, G.; Contreras, P.G.; Kulak, M.; Woodfield, G.; Bair, T.; Domann, F.E.; Weigel, R.J. Human Melanoma cells over-express extracellular matrix 1 (ECM1) which is regulated by TFAP2C. PLoS ONE 2013, 8, e73953. [Google Scholar] [CrossRef] [Green Version]
- Carrière, C.; Mirocha, S.; Deharvengt, S.; Gunn, J.R.; Korc, M. Aberrant expressions of AP-2α splice variants in pancreatic cancer. Pancreas 2011, 40, 695–700. [Google Scholar] [CrossRef] [PubMed] [Green Version]
- Williams, C.M.; Scibetta, A.G.; Friedrich, J.K.; Canosa, M.; Berlato, C.; Moss, C.H.; Hurst, H.C. AP-2gamma promotes proliferation in breast tumour cells by direct repression of the CDKN1A gene. EMBO J. 2009, 28, 3591–3601. [Google Scholar] [CrossRef] [Green Version]
- Kang, J.; Kim, W.; Lee, S.; Kwon, D.; Chun, J.; Son, B.; Kim, E.; Lee, J.-M.; Youn, H.; Youn, B. TFAP2C promotes lung tumorigenesis and aggressiveness through miR-183- and miR-33a-mediated cell cycle regulation. Oncogene 2017, 36, 1585–1596. [Google Scholar] [CrossRef]
- Kim, W.; Kim, E.; Lee, S.; Kim, D.; Chun, J.; Park, K.H.; Youn, H.; Youn, B. TFAP2C-mediated upregulation of TGFBR1 promotes lung tumorigenesis and epithelial-mesenchymal transition. Exp. Mol. Med. 2016, 48, e273. [Google Scholar] [CrossRef] [Green Version]
- Li, T.; Fan, J.; Wang, B.; Traugh, N.; Chen, Q.; Liu, J.S.; Li, B.; Liu, X.S. TIMER: A Web Server for Comprehensive Analysis of Tumor-Infiltrating Immune Cells. Cancer Res. 2017, 77, e108–e110. [Google Scholar] [CrossRef] [Green Version]
- Tang, Z.; Li, C.; Kang, B.; Gao, G.; Li, C.; Zhang, Z. GEPIA: A web server for cancer and normal gene expression profiling and interactive analyses. Nucleic Acids Res. 2017, 45, W98–W102. [Google Scholar] [CrossRef] [Green Version]
- Chandrashekar, D.S.; Karthikeyan, S.K.; Korla, P.K.; Patel, H.; Shovon, A.R.; Athar, M.; Netto, G.J.; Qin, Z.S.; Kumar, S.; Manne, U.; et al. UALCAN: An update to the integrated cancer data analysis platform. Neoplasia 2022, 25, 18–27. [Google Scholar] [CrossRef]
- Chandrashekar, D.S.; Bashel, B.; Balasubramanya, S.A.H.; Creigthon, C.J.; Ponce-Rodriguez, I.; Chakravarthi, B.V.S.K.; Varambally, S. UALCAN: A Portal for Facilitating Tumor Subgroup Gene Expression and Survival Analyses. Neoplasia 2017, 19, 649–658. [Google Scholar] [CrossRef]
- Győrffy, B.; Surowiak, P.; Budczies, J.; Lánczky, A. Online survival analysis software to assess the prognostic value of biomarkers using transcriptomic data in non-small-cell lung cancer. PLoS ONE 2013, 8, e82241, Correction in PLoS ONE 2014, 9, e111842. [Google Scholar] [CrossRef] [Green Version]
- Gao, J.; Aksoy, B.A.; Dogrusoz, U.; Dresdner, G.; Gross, B.; Sumer, S.O.; Sun, Y.; Jacobsen, A.; Sinha, R.; Larsson, E.; et al. Integrative analysis of complex cancer genomics and clinical profiles using the cBioPortal. Sci. Signal. 2013, 6, pl1. [Google Scholar] [CrossRef] [PubMed] [Green Version]
- Cerami, E.; Gao, J.; Dogrusoz, U.; Gross, B.E.; Sumer, S.O.; Aksoy, B.A.; Jacobsen, A.; Byrne, C.J.; Heuer, M.L.; Larsson, E.; et al. The cBio cancer genomics portal: An open platform for exploring multidimensional cancer genomics data. Cancer Discov. 2012, 2, 401–404, Correction in Cancer Discov. 2012, 2, 960. [Google Scholar] [CrossRef] [PubMed] [Green Version]
- Liao, H.; Lin, P. The comprehensive investigation of transcription factor AP-2 alpha in lung adenocarcinoma. Transl. Cancer Res. 2020, 9, 1547–1557. [Google Scholar] [CrossRef] [PubMed]
- Cheng, C.; Ai, Z.; Zhao, L. Comprehensive analysis of the expression and prognosis for TFAP2 in human lung carcinoma. Genes Genom. 2020, 42, 779–789. [Google Scholar] [CrossRef] [PubMed]
- Fu, L.; Shi, K.; Wang, J.; Chen, W.; Shi, D.; Tian, Y.; Guo, W.; Yu, W.; Xiao, X.; Kang, T.; et al. TFAP2B overexpression contributes to tumor growth and a poor prognosis of human lung adenocarcinoma through modulation of ERK and VEGF/PEDF signaling. Mol. Cancer 2014, 13, 89. [Google Scholar] [CrossRef] [Green Version]
- Kołat, D.; Zhao, L.Y.; Kciuk, M.; Płuciennik, E.; Kałuzińska-Kołat, Ż. AP-2δ Is the Most Relevant Target of AP-2 Family-Focused Cancer Therapy and Affects Genome Organization. Cells 2022, 11, 4124. [Google Scholar] [CrossRef]
- Stabach, P.R.; Thiyagarajan, M.M.; Woodfield, G.W.; Weigel, R.J. AP2alpha alters the transcriptional activity and stability of p53. Oncogene 2006, 25, 2148–2159. [Google Scholar] [CrossRef] [PubMed] [Green Version]
- Meng, X.; Meng, C.; Yang, B.; Zhao, L.; Sun, X.; Liu, H.; Fan, F.; Liu, X.; Jia, L. AP-2α downregulation by cigarette smoke condensate is counteracted by p53 in human lung cancer cells. Int. J. Mol. Med. 2014, 34, 1094–1100. [Google Scholar] [CrossRef] [Green Version]
- Zheng, X.; Hu, Y.; Yao, C. The paradoxical role of tumor-infiltrating immune cells in lung cancer. Intractable Rare Dis. Res. 2017, 6, 234–241. [Google Scholar] [CrossRef] [PubMed] [Green Version]
- Vahl, J.C.; Drees, C.; Heger, K.; Heink, S.; Fischer, J.C.; Nedjic, J.; Ohkura, N.; Morikawa, H.; Poeck, H.; Schallenberg, S.; et al. Continuous T cell receptor signals maintain a functional regulatory T cell pool. Immunity 2014, 41, 722–736. [Google Scholar] [CrossRef] [PubMed] [Green Version]
- Li, Y.; Zhao, X.; Xiao, H.; Yang, B.; Liu, J.; Rao, W.; Dai, X.; Li, M.; Dai, N.; Yang, Y.; et al. APE1 may influence CD4+ naïve T cells on recurrence free survival in early stage NSCLC. BMC Cancer 2021, 21, 233. [Google Scholar] [CrossRef] [PubMed]
- Donnem, T.; Hald, S.M.; Paulsen, E.E.; Richardsen, E.; Al-Saad, S.; Kilvaer, T.K.; Brustugun, O.T.; Helland, A.; Lund-Iversen, M.; Poehl, M.; et al. Stromal CD8+ T-cell Density—A Promising Supplement to TNM Staging in Non-Small Cell Lung Cancer. Clin. Cancer Res. 2015, 21, 2635–2643. [Google Scholar] [CrossRef] [PubMed] [Green Version]
- Wang, L.-N.; Yang, Y.-L.; Zhao, L.-Y. TFAP-2: A Special Regulator with Bidirectional Effect in Human Cancer. J. Cancer Immunol. 2021, 3, 1–5. [Google Scholar] [CrossRef]


Disclaimer/Publisher’s Note: The statements, opinions and data contained in all publications are solely those of the individual author(s) and contributor(s) and not of MDPI and/or the editor(s). MDPI and/or the editor(s) disclaim responsibility for any injury to people or property resulting from any ideas, methods, instructions or products referred to in the content. |
© 2023 by the authors. Licensee MDPI, Basel, Switzerland. This article is an open access article distributed under the terms and conditions of the Creative Commons Attribution (CC BY) license (https://creativecommons.org/licenses/by/4.0/).
Share and Cite
Szmajda-Krygier, D.; Krygier, A.; Żebrowska-Nawrocka, M.; Pietrzak, J.; Świechowski, R.; Wosiak, A.; Jeleń, A.; Balcerczak, E. Differential Expression of AP-2 Transcription Factors Family in Lung Adenocarcinoma and Lung Squamous Cell Carcinoma—A Bioinformatics Study. Cells 2023, 12, 667. https://doi.org/10.3390/cells12040667
Szmajda-Krygier D, Krygier A, Żebrowska-Nawrocka M, Pietrzak J, Świechowski R, Wosiak A, Jeleń A, Balcerczak E. Differential Expression of AP-2 Transcription Factors Family in Lung Adenocarcinoma and Lung Squamous Cell Carcinoma—A Bioinformatics Study. Cells. 2023; 12(4):667. https://doi.org/10.3390/cells12040667
Chicago/Turabian StyleSzmajda-Krygier, Dagmara, Adrian Krygier, Marta Żebrowska-Nawrocka, Jacek Pietrzak, Rafał Świechowski, Agnieszka Wosiak, Agnieszka Jeleń, and Ewa Balcerczak. 2023. "Differential Expression of AP-2 Transcription Factors Family in Lung Adenocarcinoma and Lung Squamous Cell Carcinoma—A Bioinformatics Study" Cells 12, no. 4: 667. https://doi.org/10.3390/cells12040667