
Post-Stroke Environmental Enrichment Improves Neurogenesis and Cognitive Function and Reduces the Generation of Aberrant Neurons in the Mouse Hippocampus
 and
and 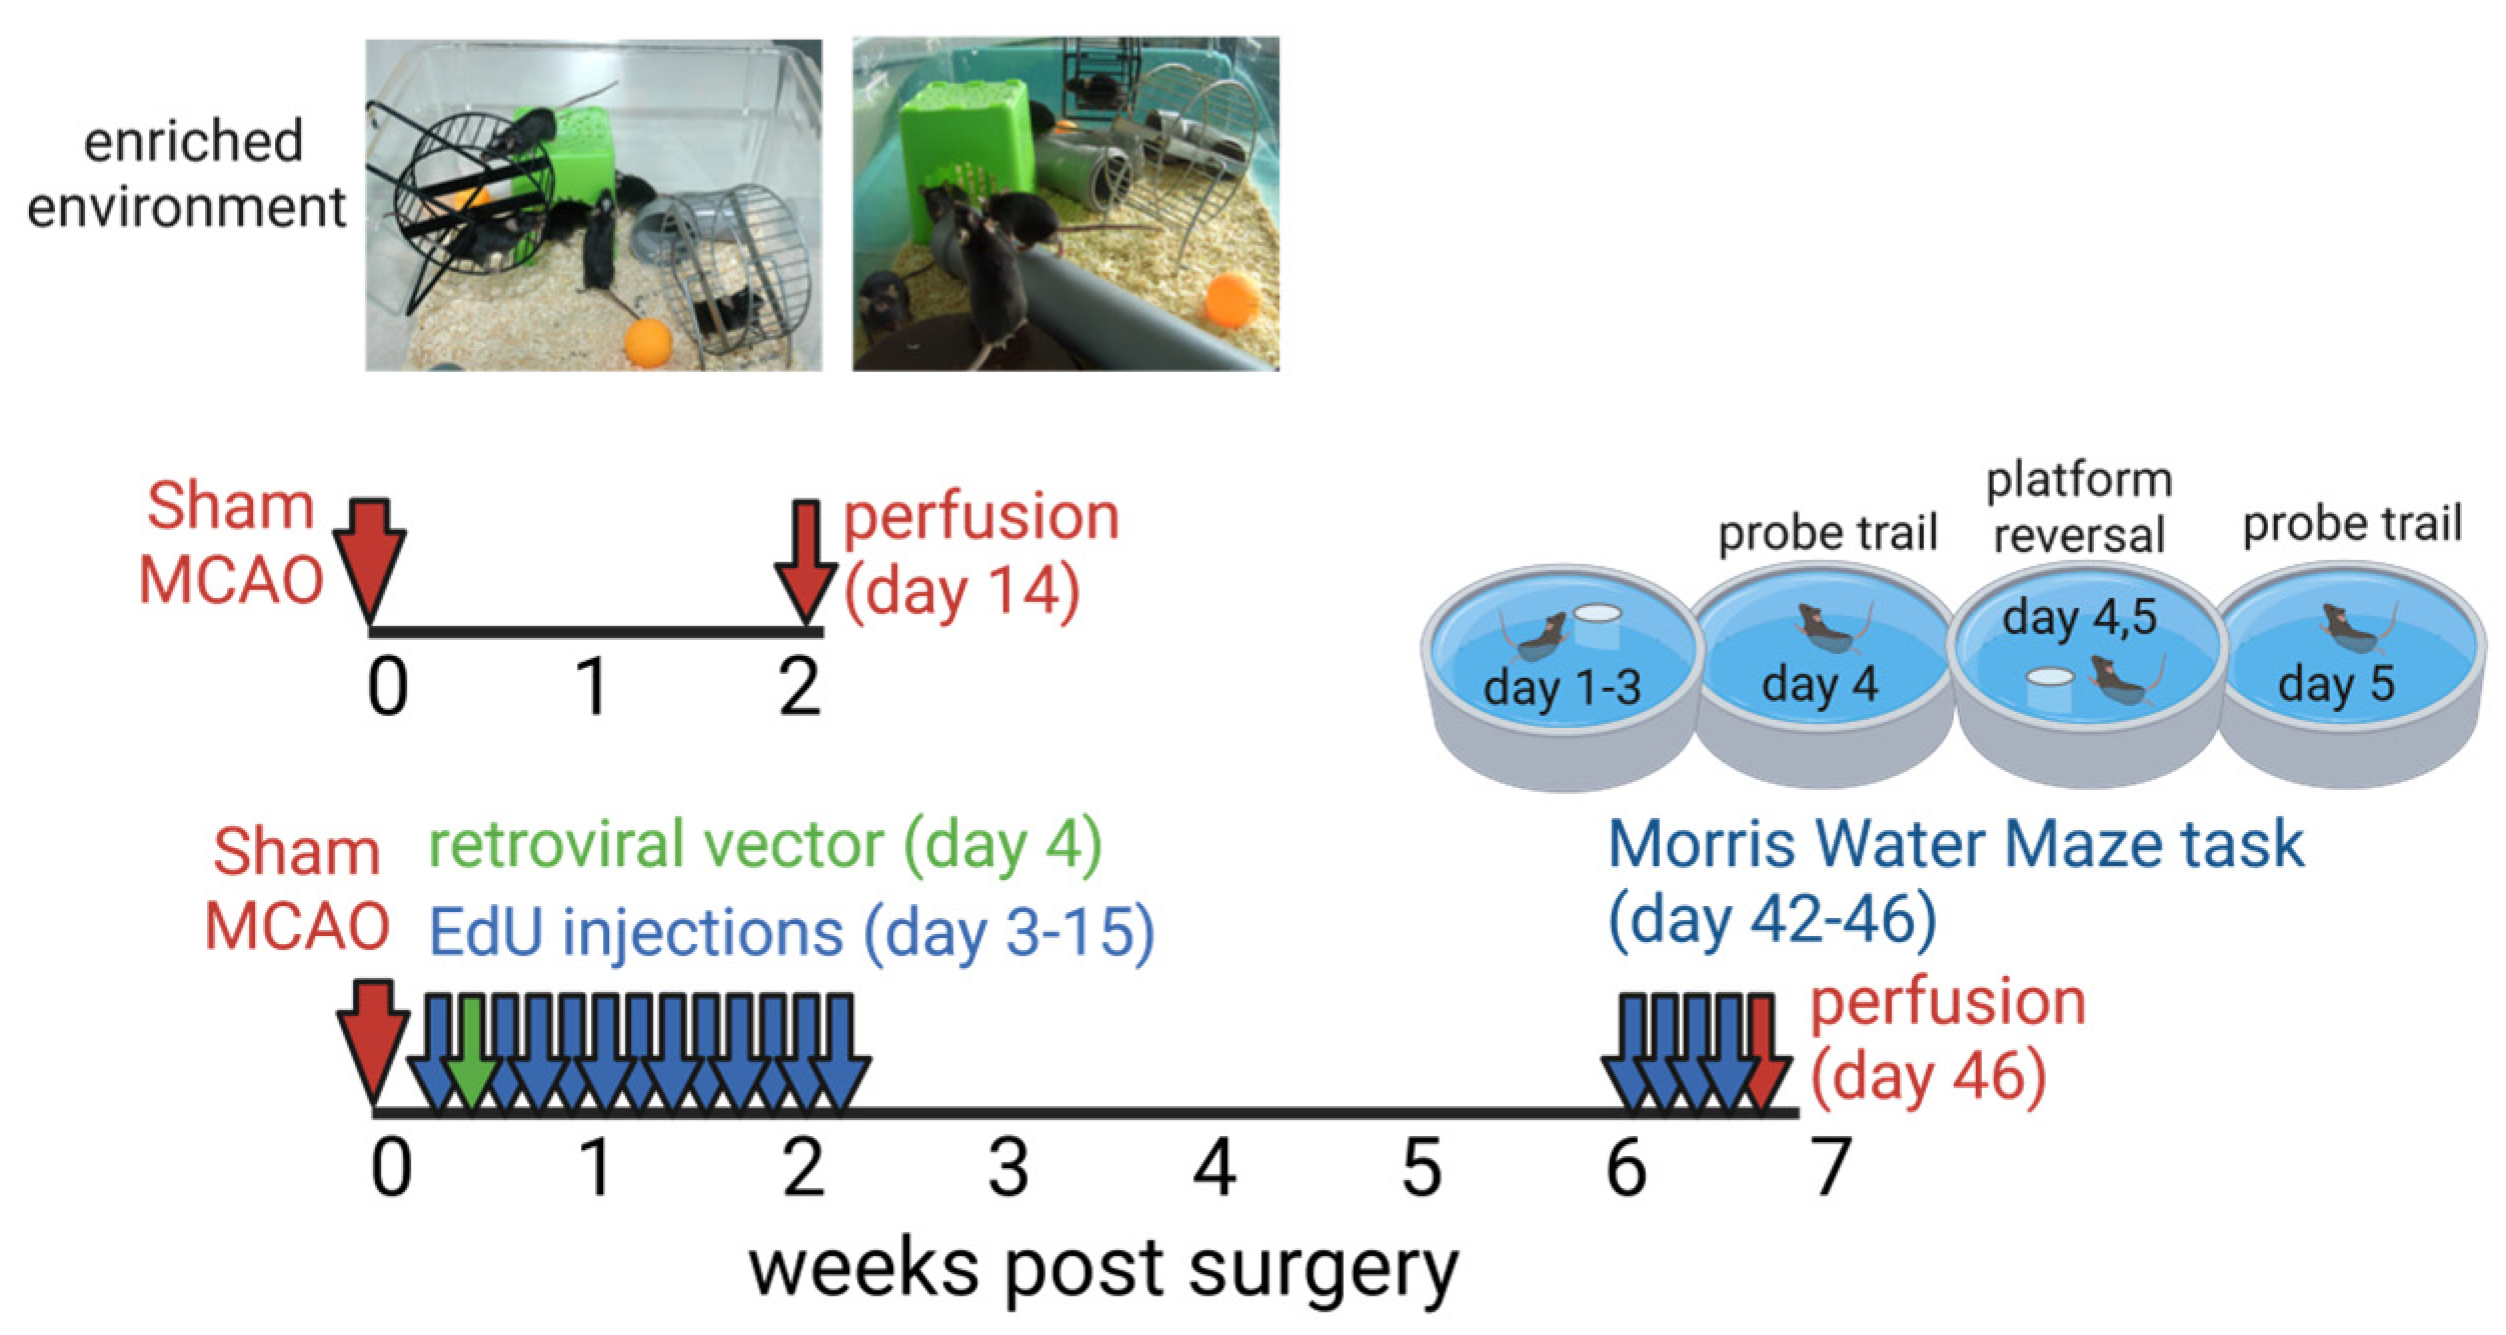
Abstract
:1. Introduction
2. Materials and Methods
2.1. Animals and Experimental Design
2.2. Cerebral Ischemia Model
2.3. Injections of 5-ethynyl-2′-deoxyuridine (EdU)
2.4. Stereotactic Injections of a Retroviral Vector
2.5. Tissue Preparation
2.6. Stainings
2.6.1. MAP2, MCM2 and DCX Staining
2.6.2. DCX/MCM2/DAPI Staining
2.6.3. EdU/NeuN/DAPI Staining
2.6.4. GFP/NeuN/DAPI Staining
2.7. Brain and Infarct Volume Quantifications
2.8. Cell Quantification
2.9. Assessment of Neuronal Morphology
2.10. Morris Water Maze Test
2.11. Statistical Analysis
3. Results
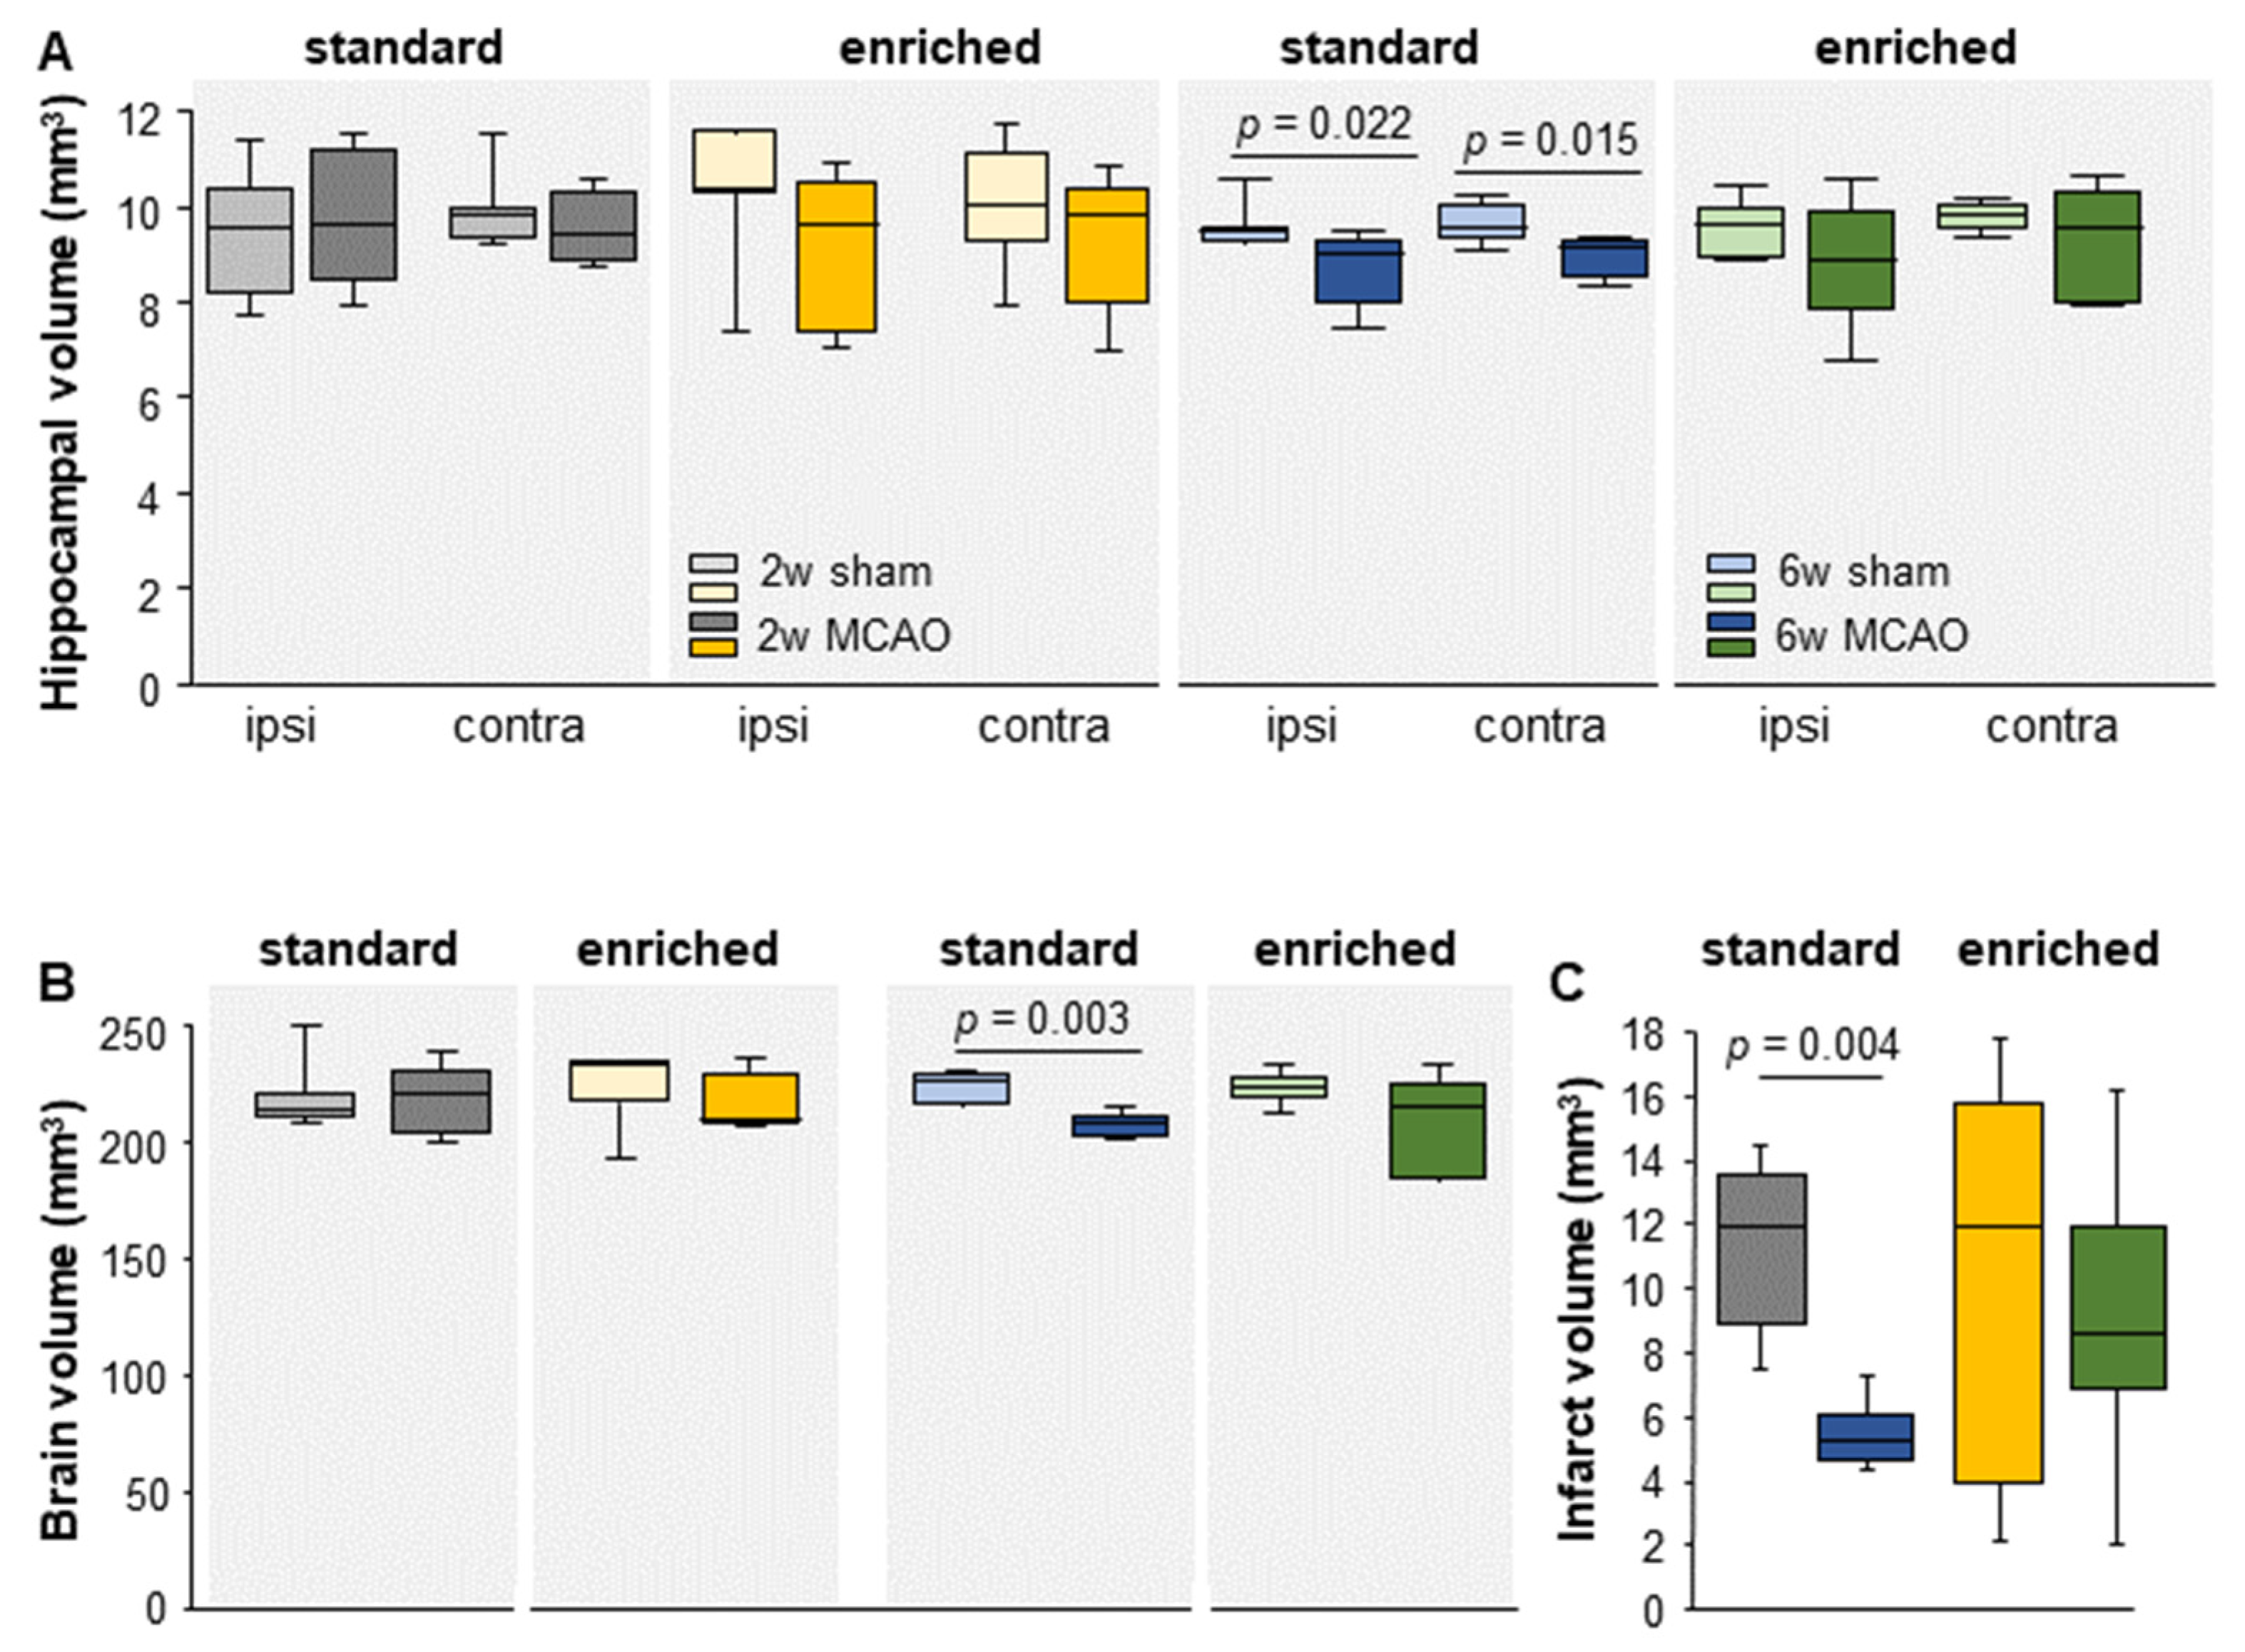
3.1. Brain- and Hippocampal Volume
3.2. Time-Dependent Reduction in Infarct Volume under Standard Housing

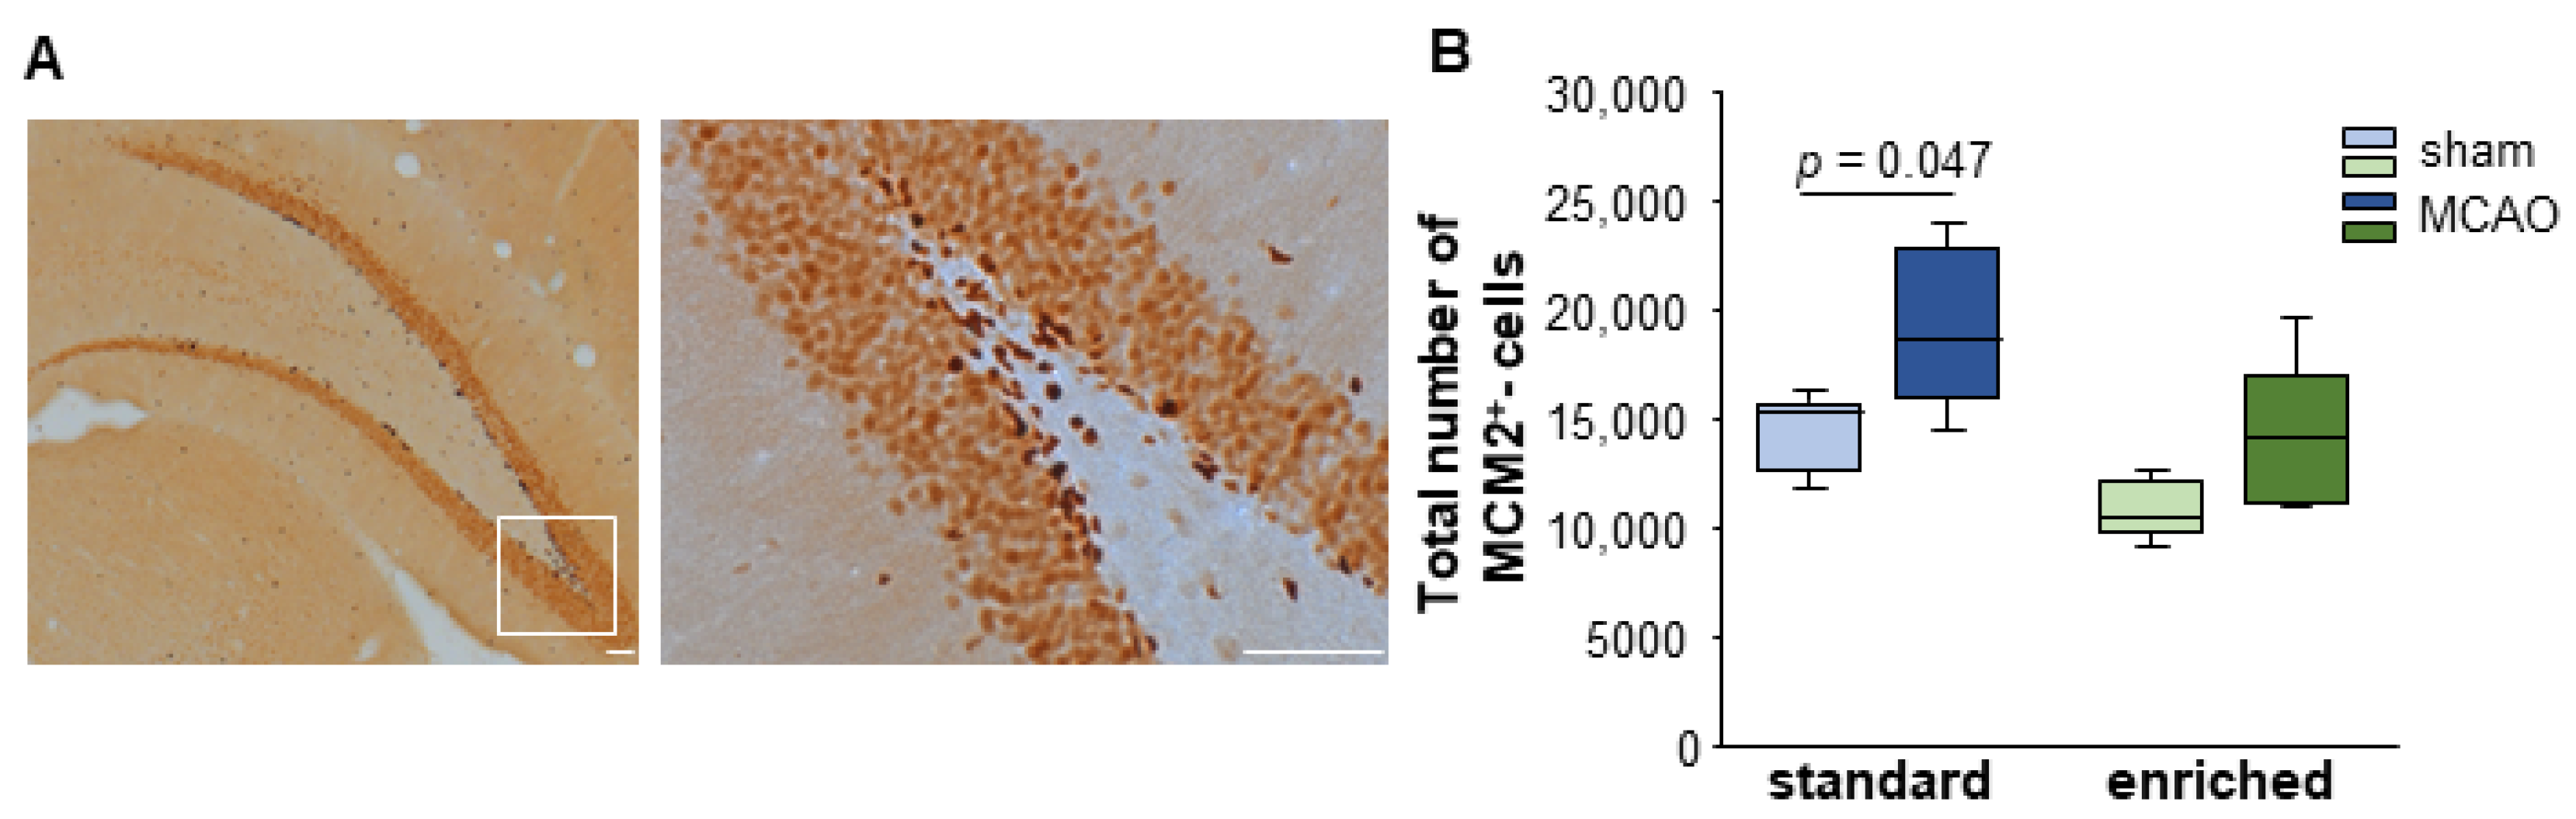
3.3. Cell Proliferation after Stroke
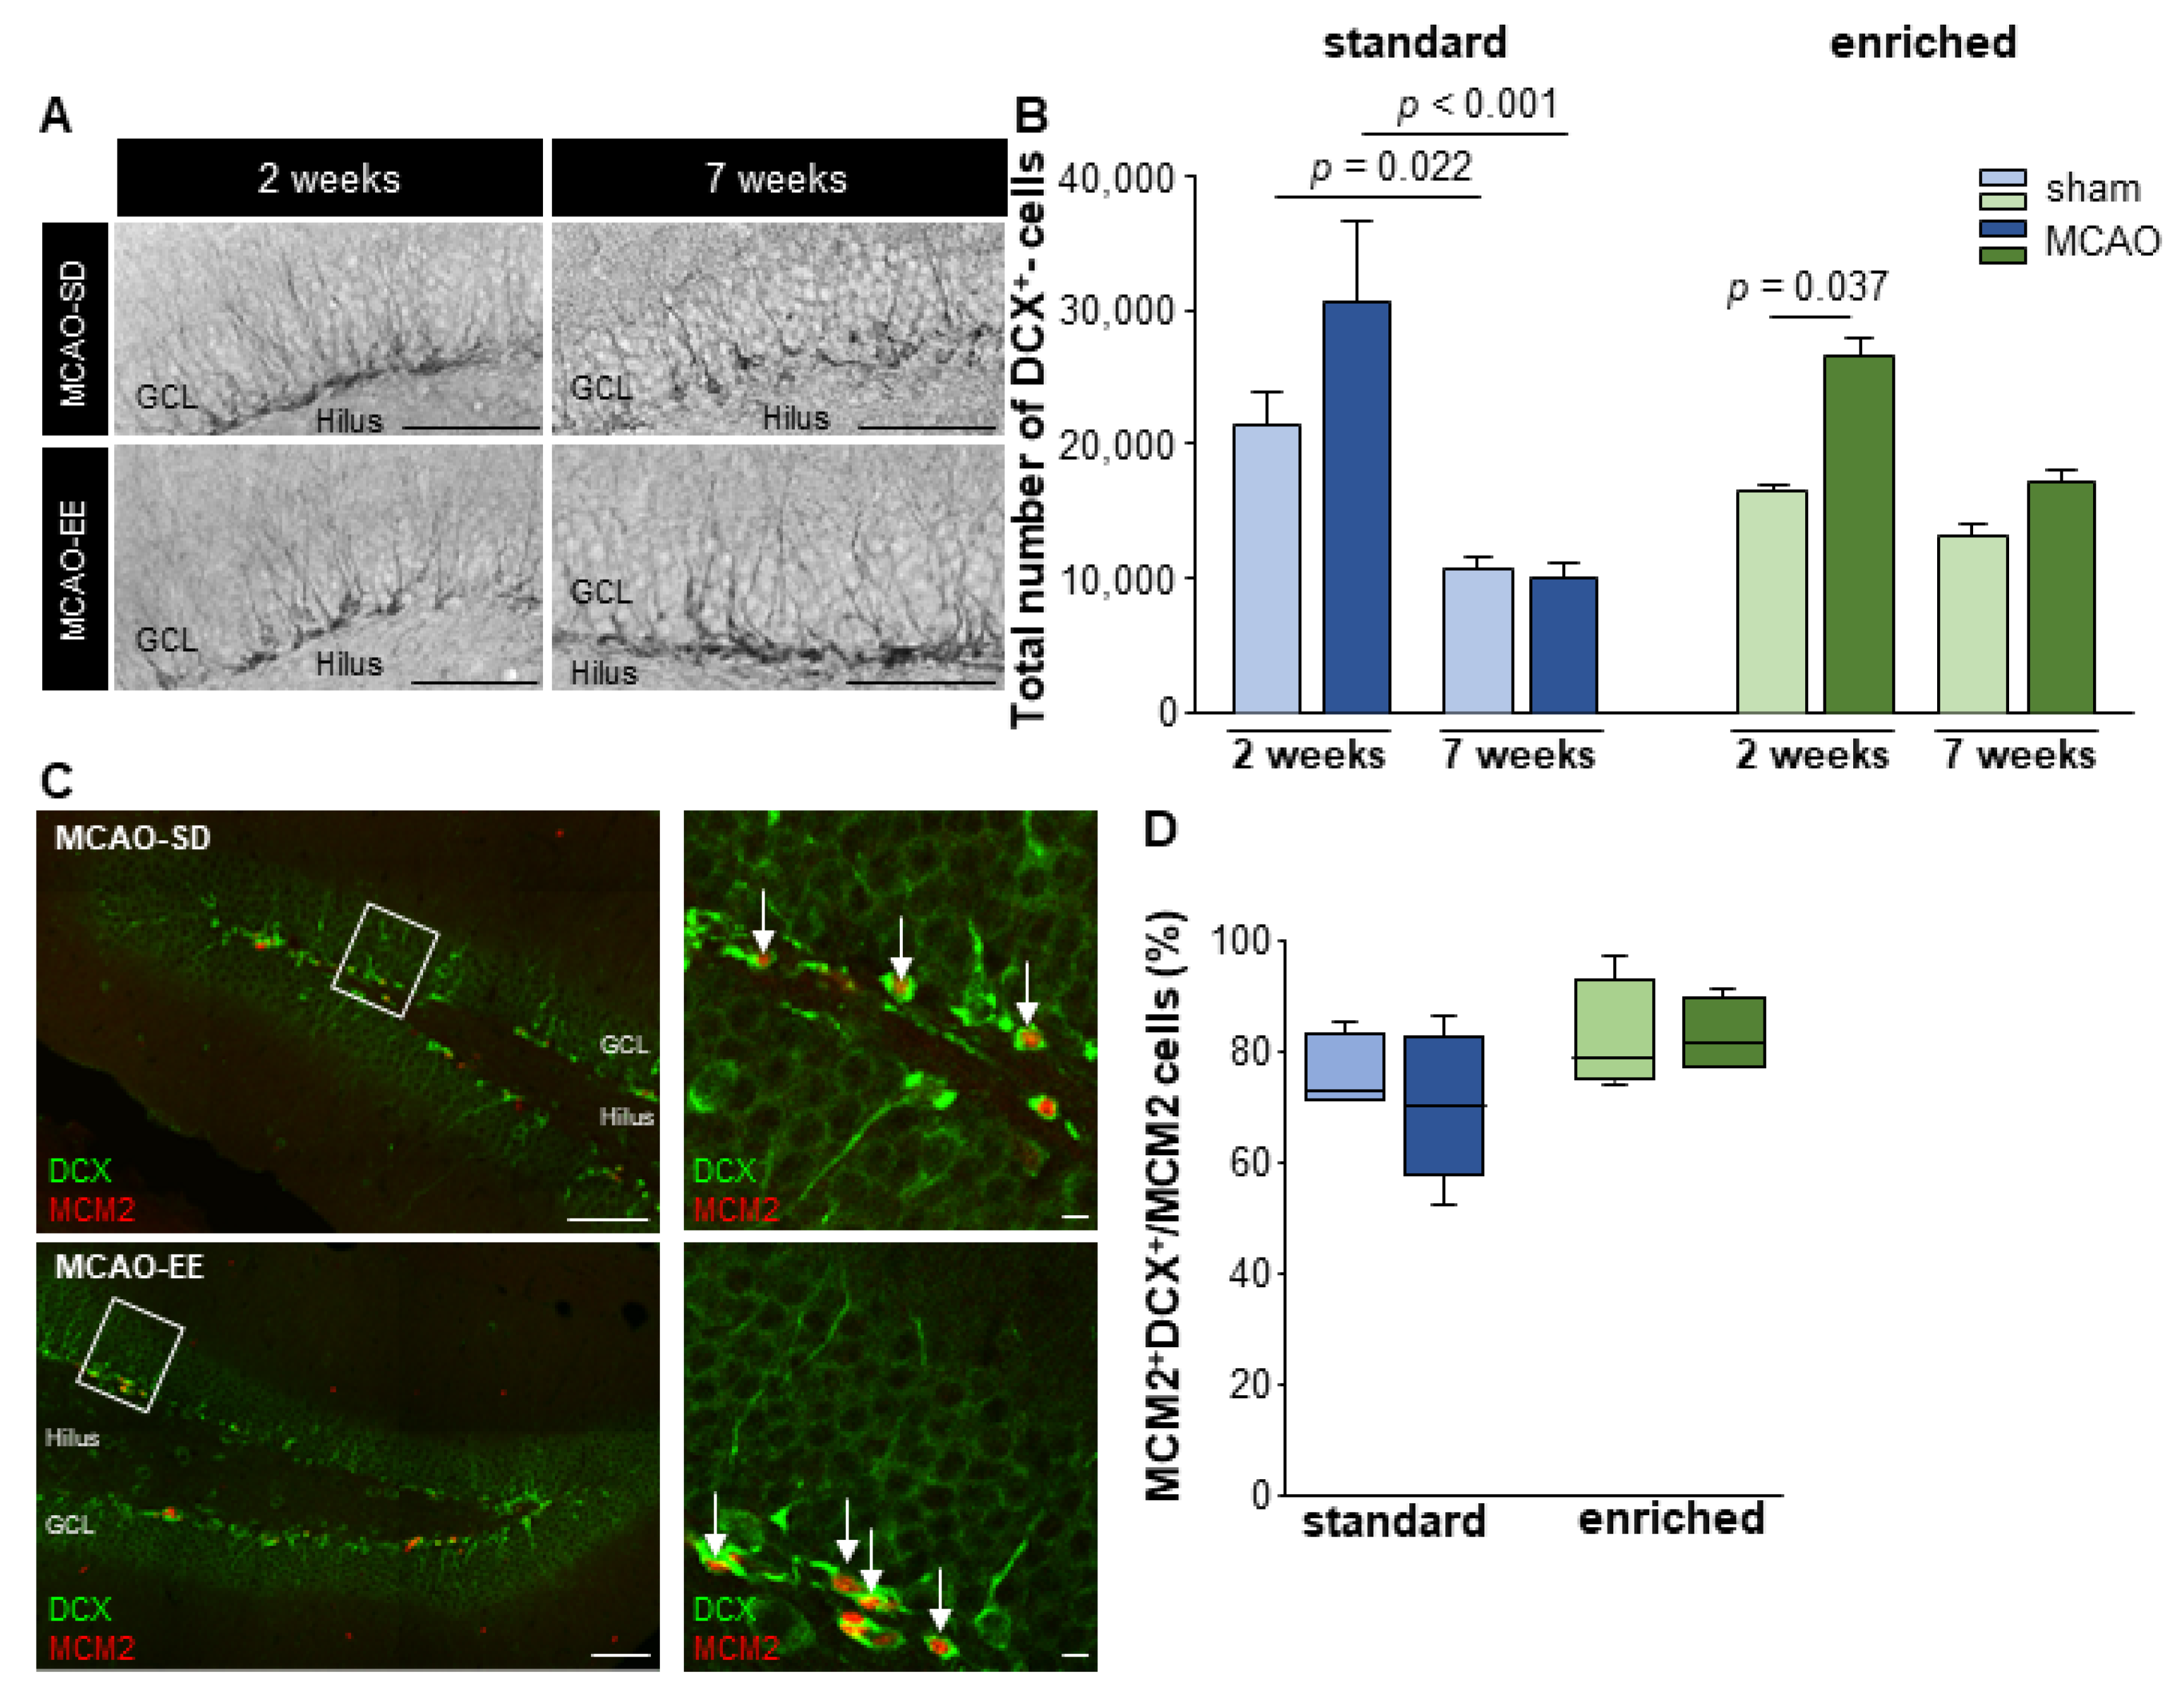
3.4. Neural Cell Fate Choice after Stroke
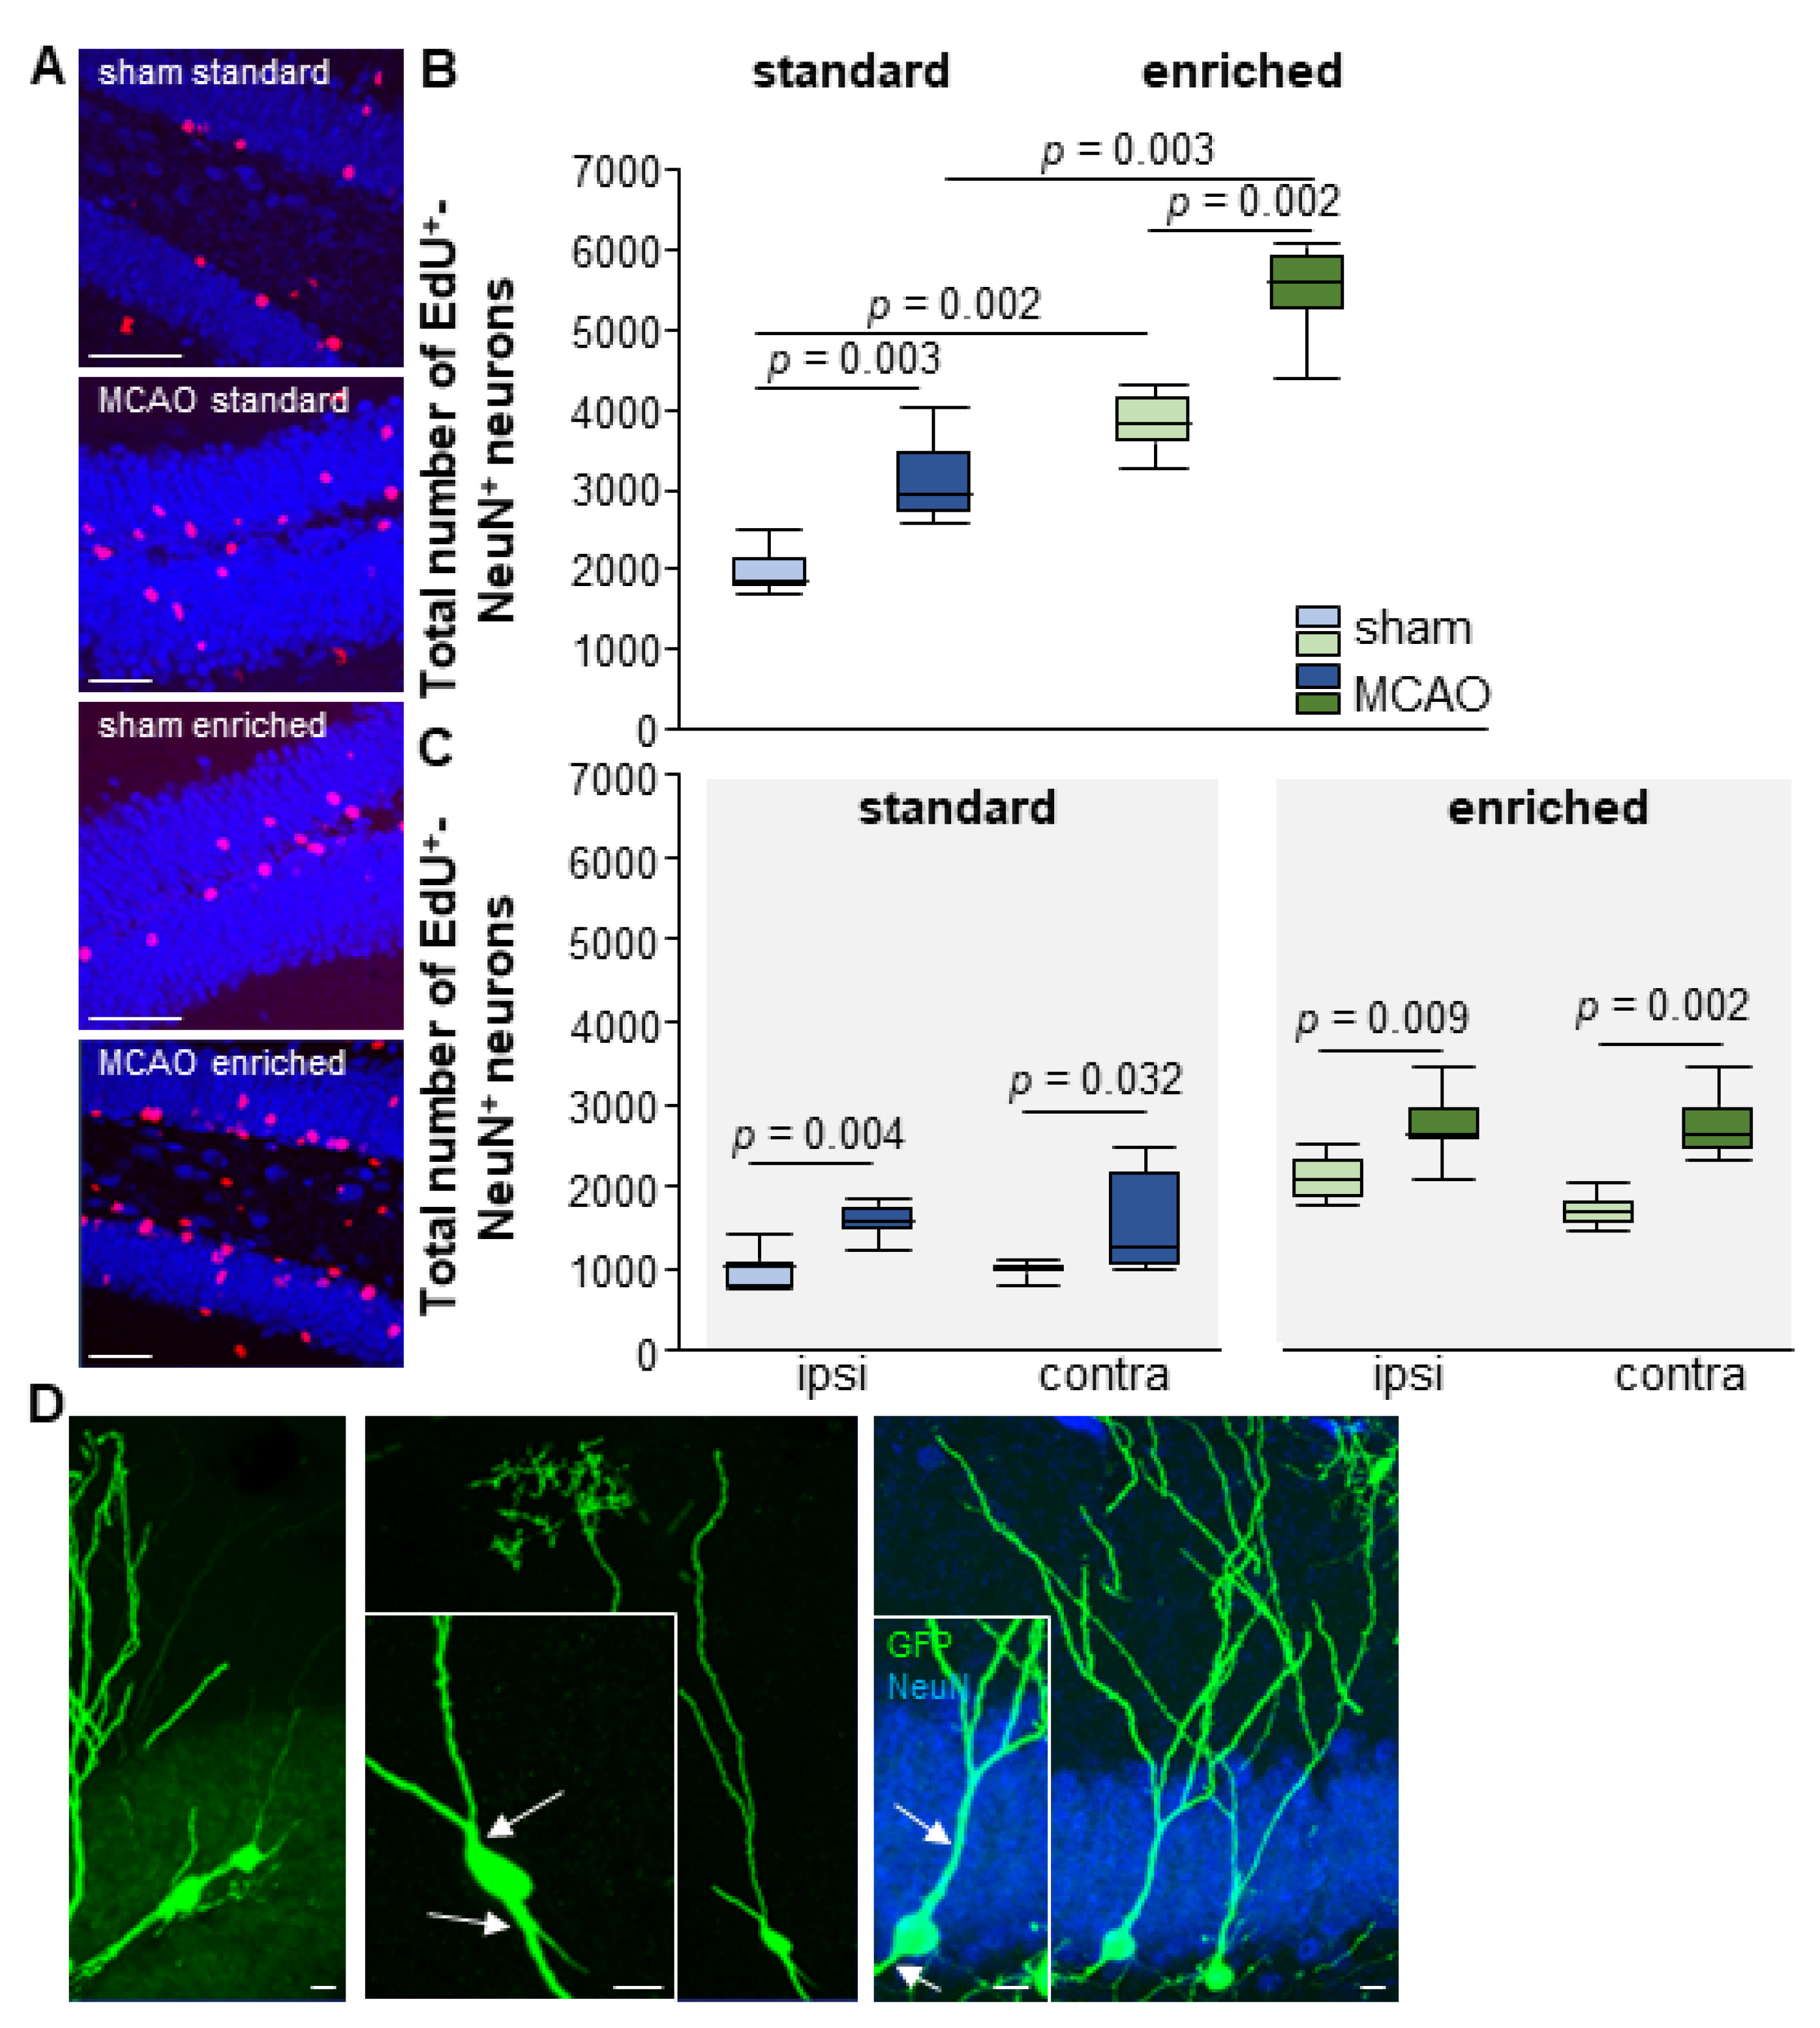
3.5. Enriched Environment Increases Adult Neurogenesis but Not Aberrant Neurons after Stroke
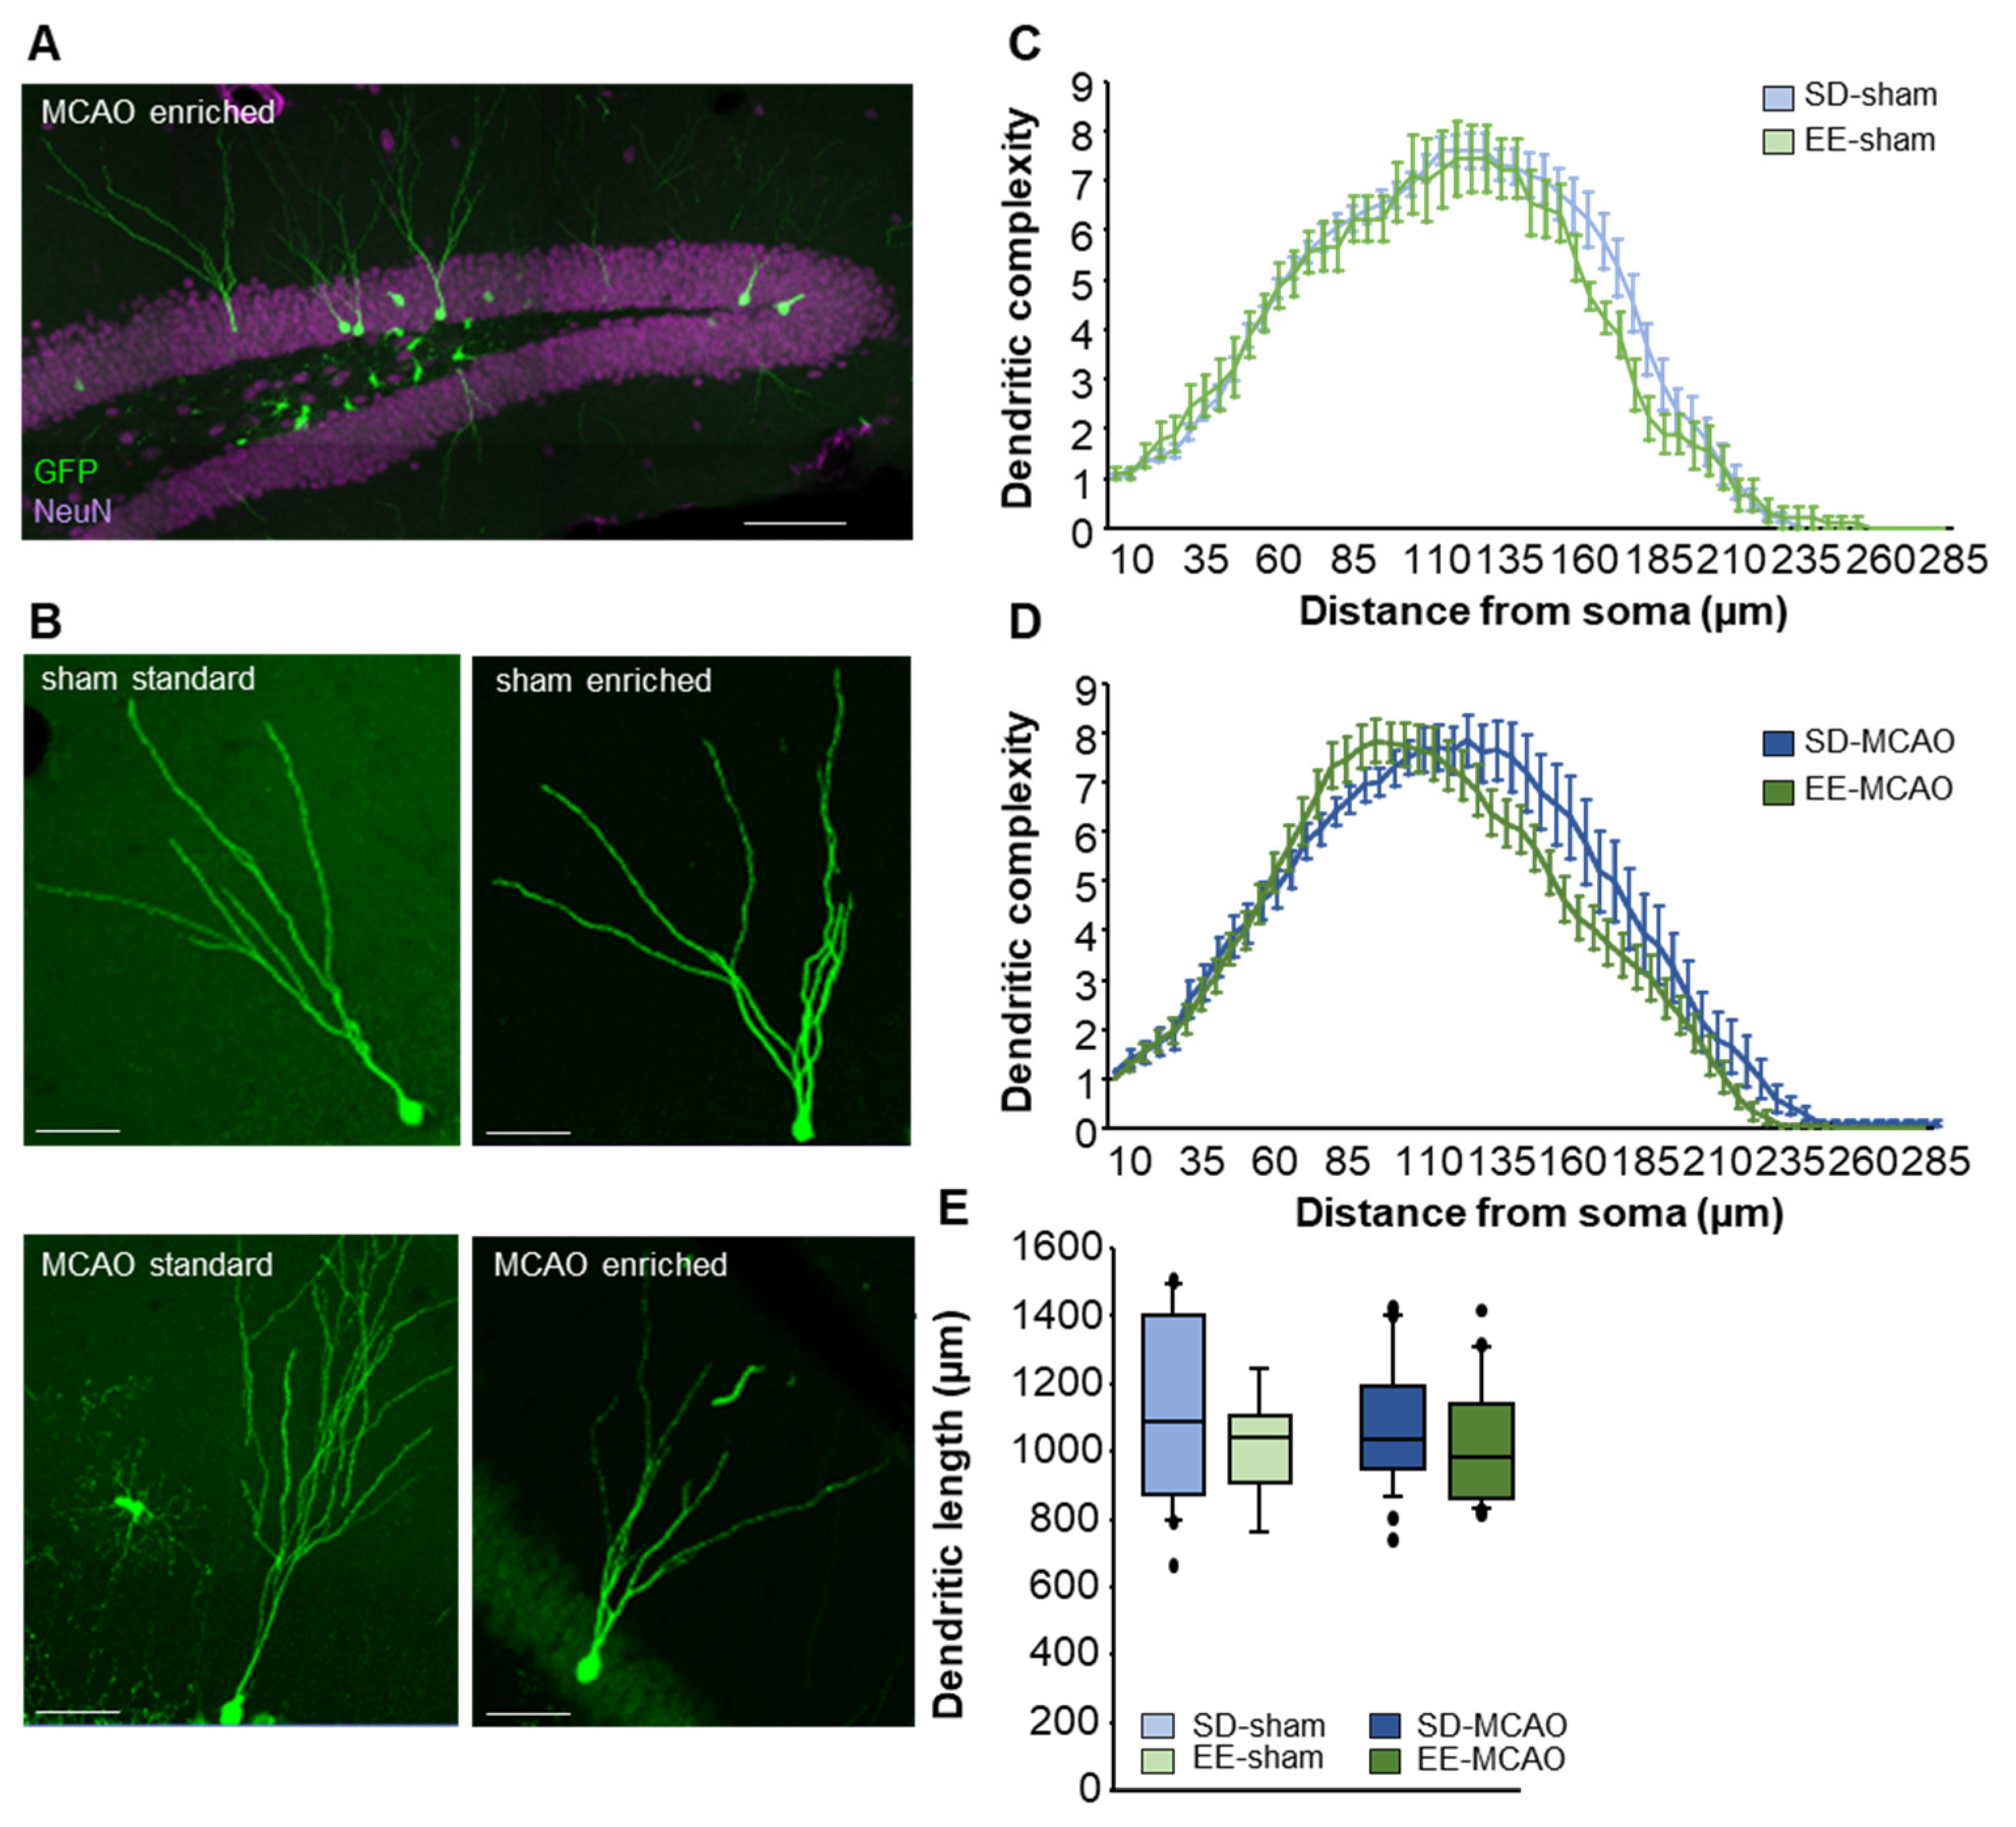
3.6. No Changes in Morphology of Neurons due to Stroke or Enriched Housing
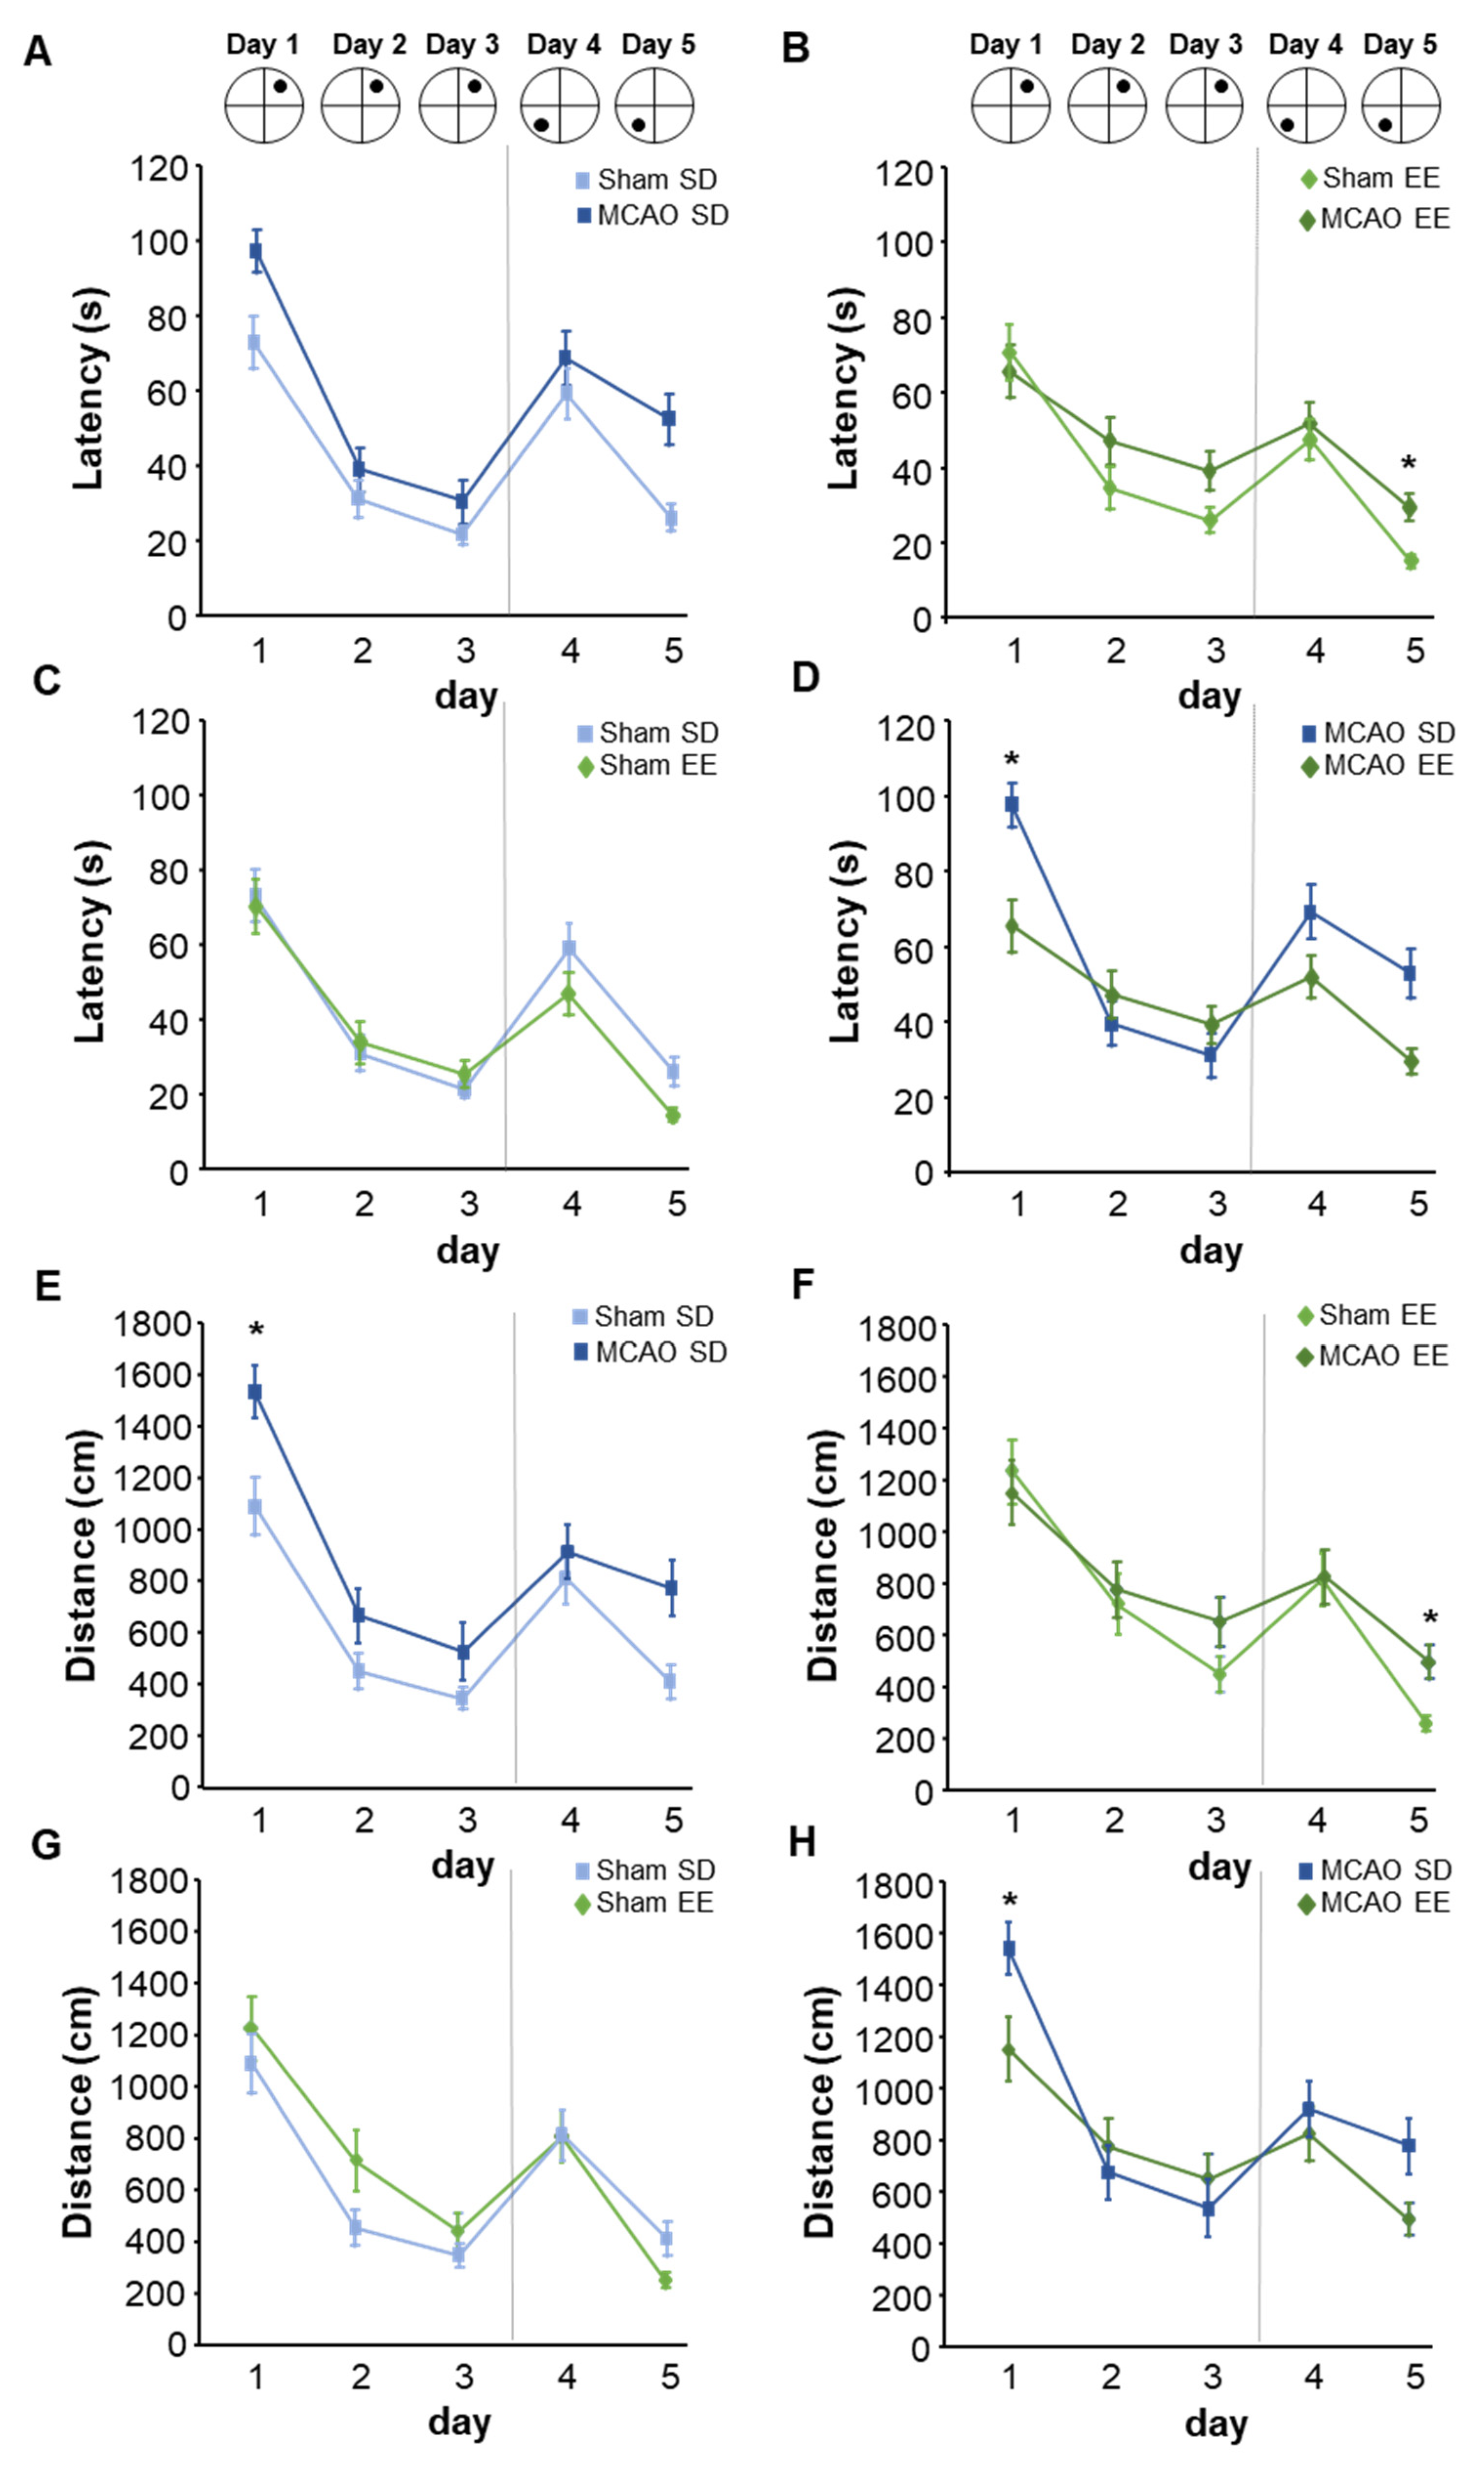
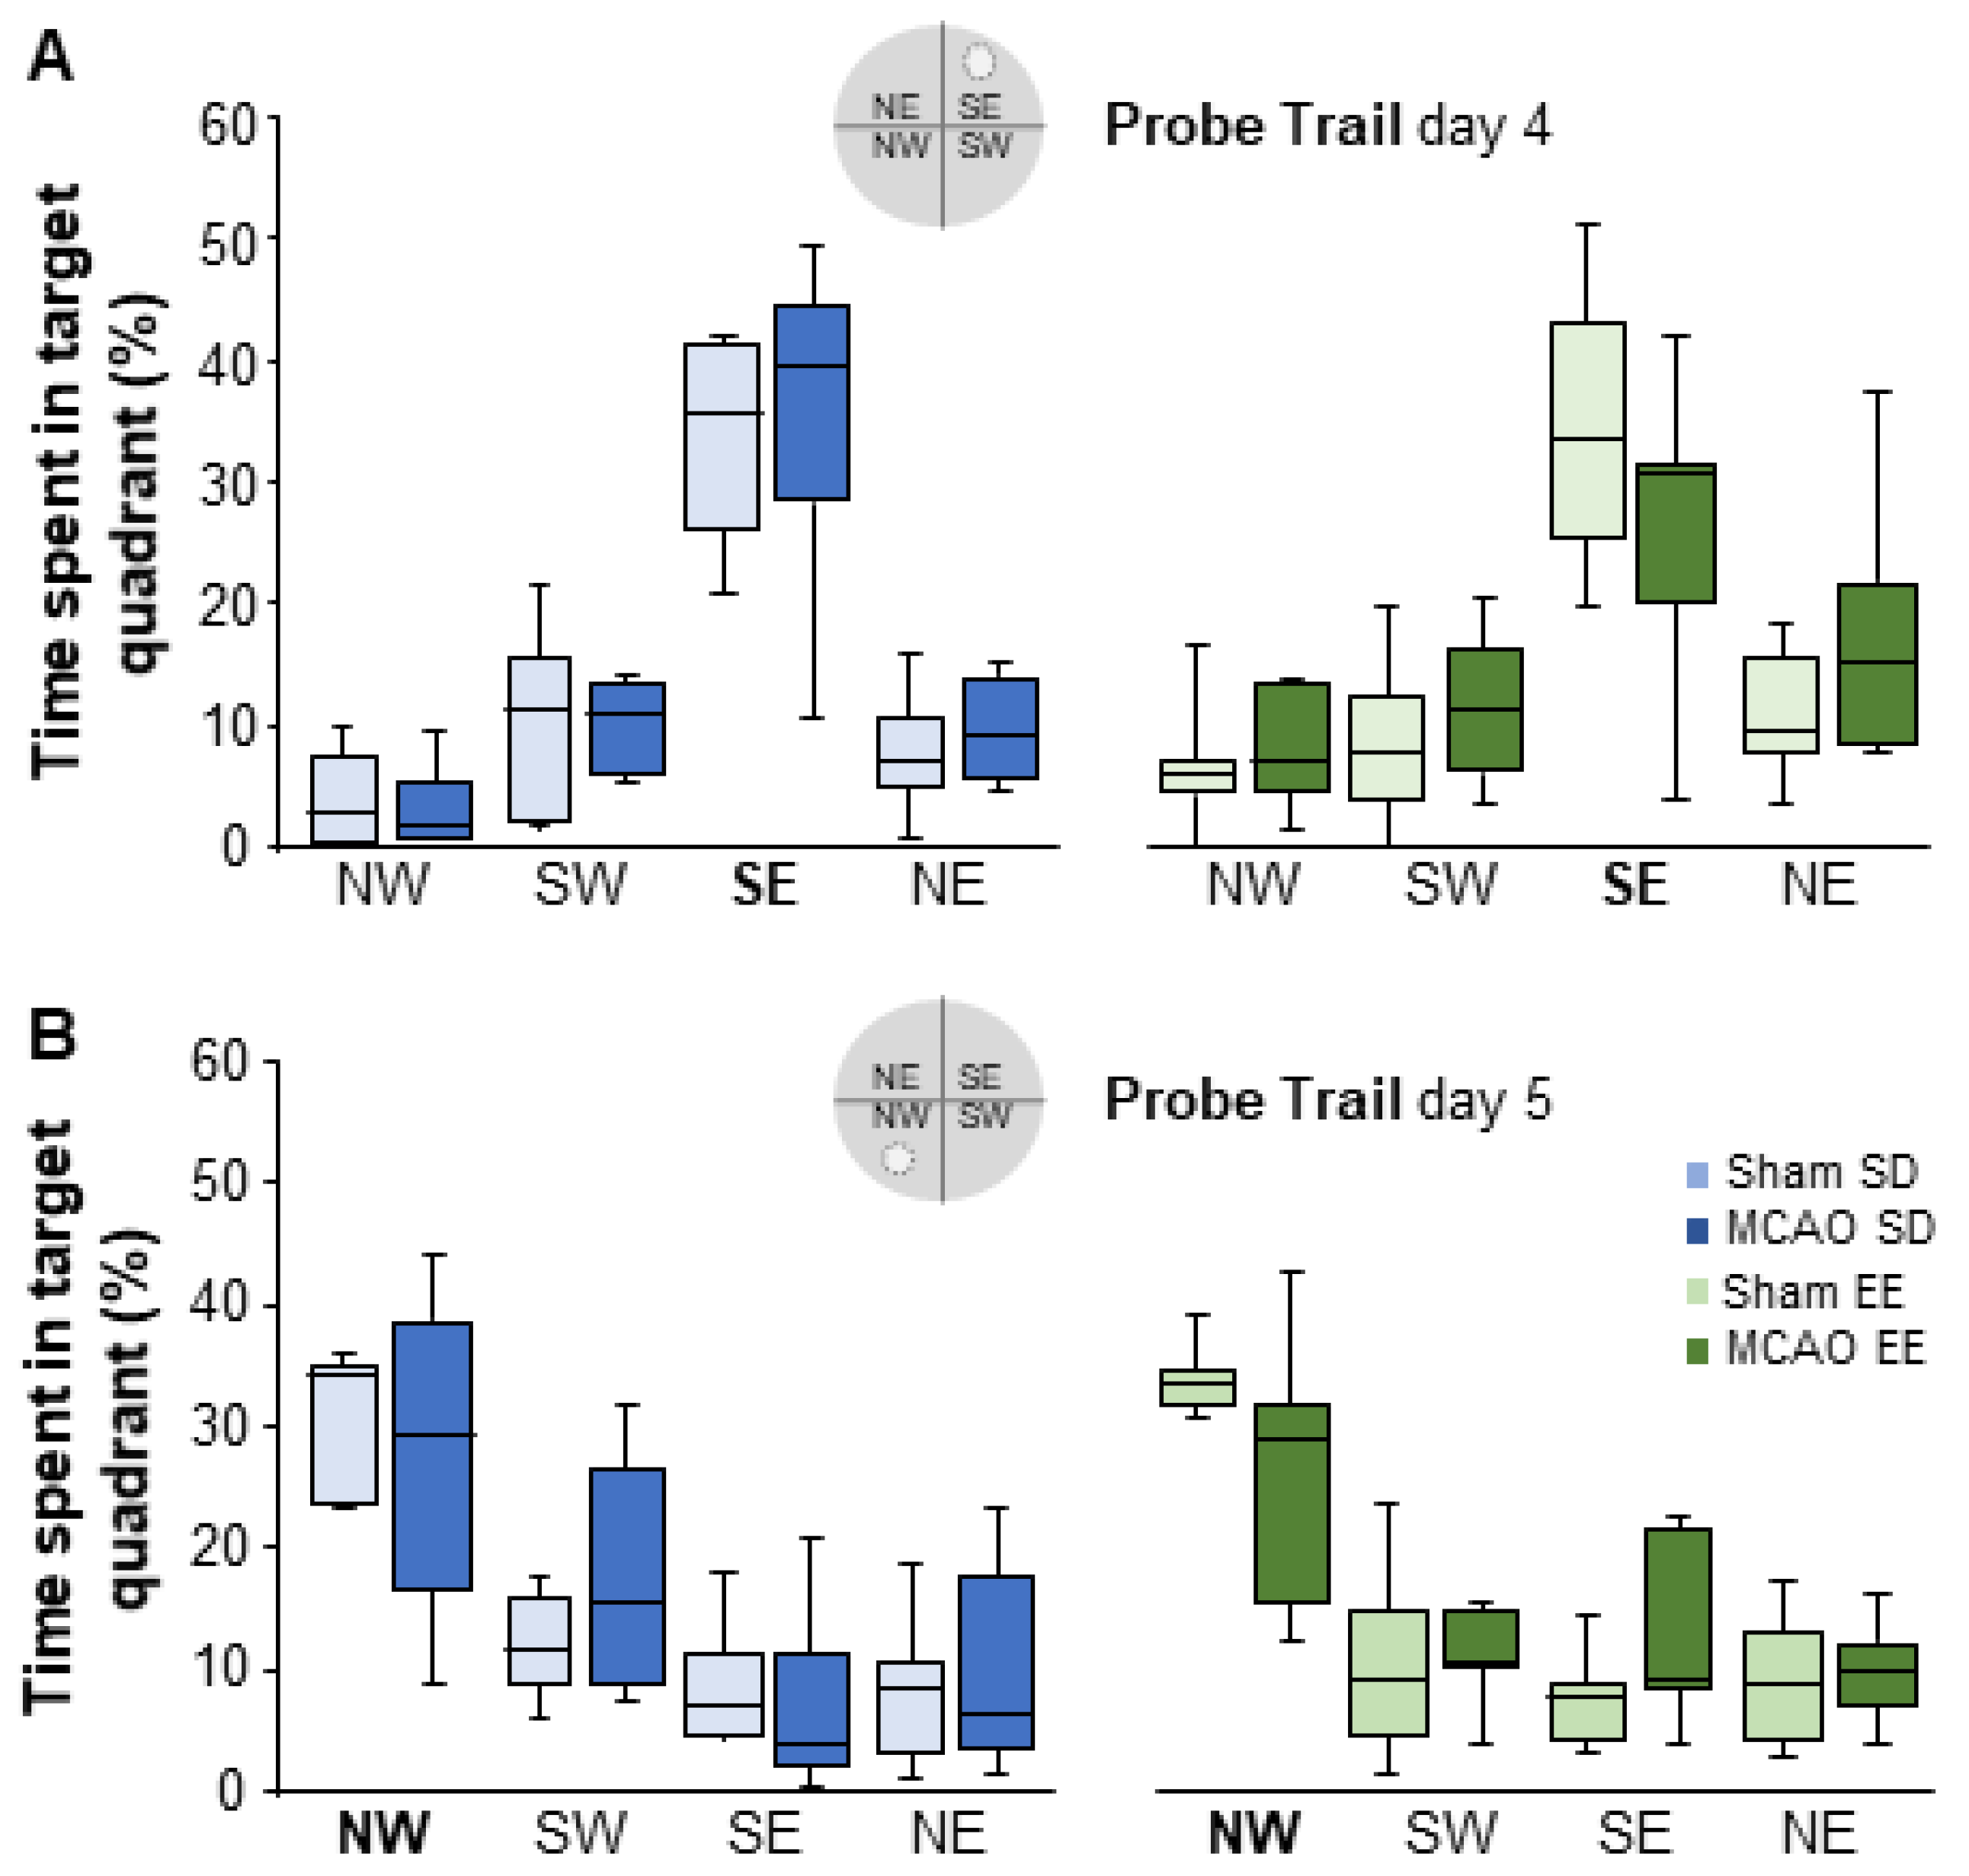
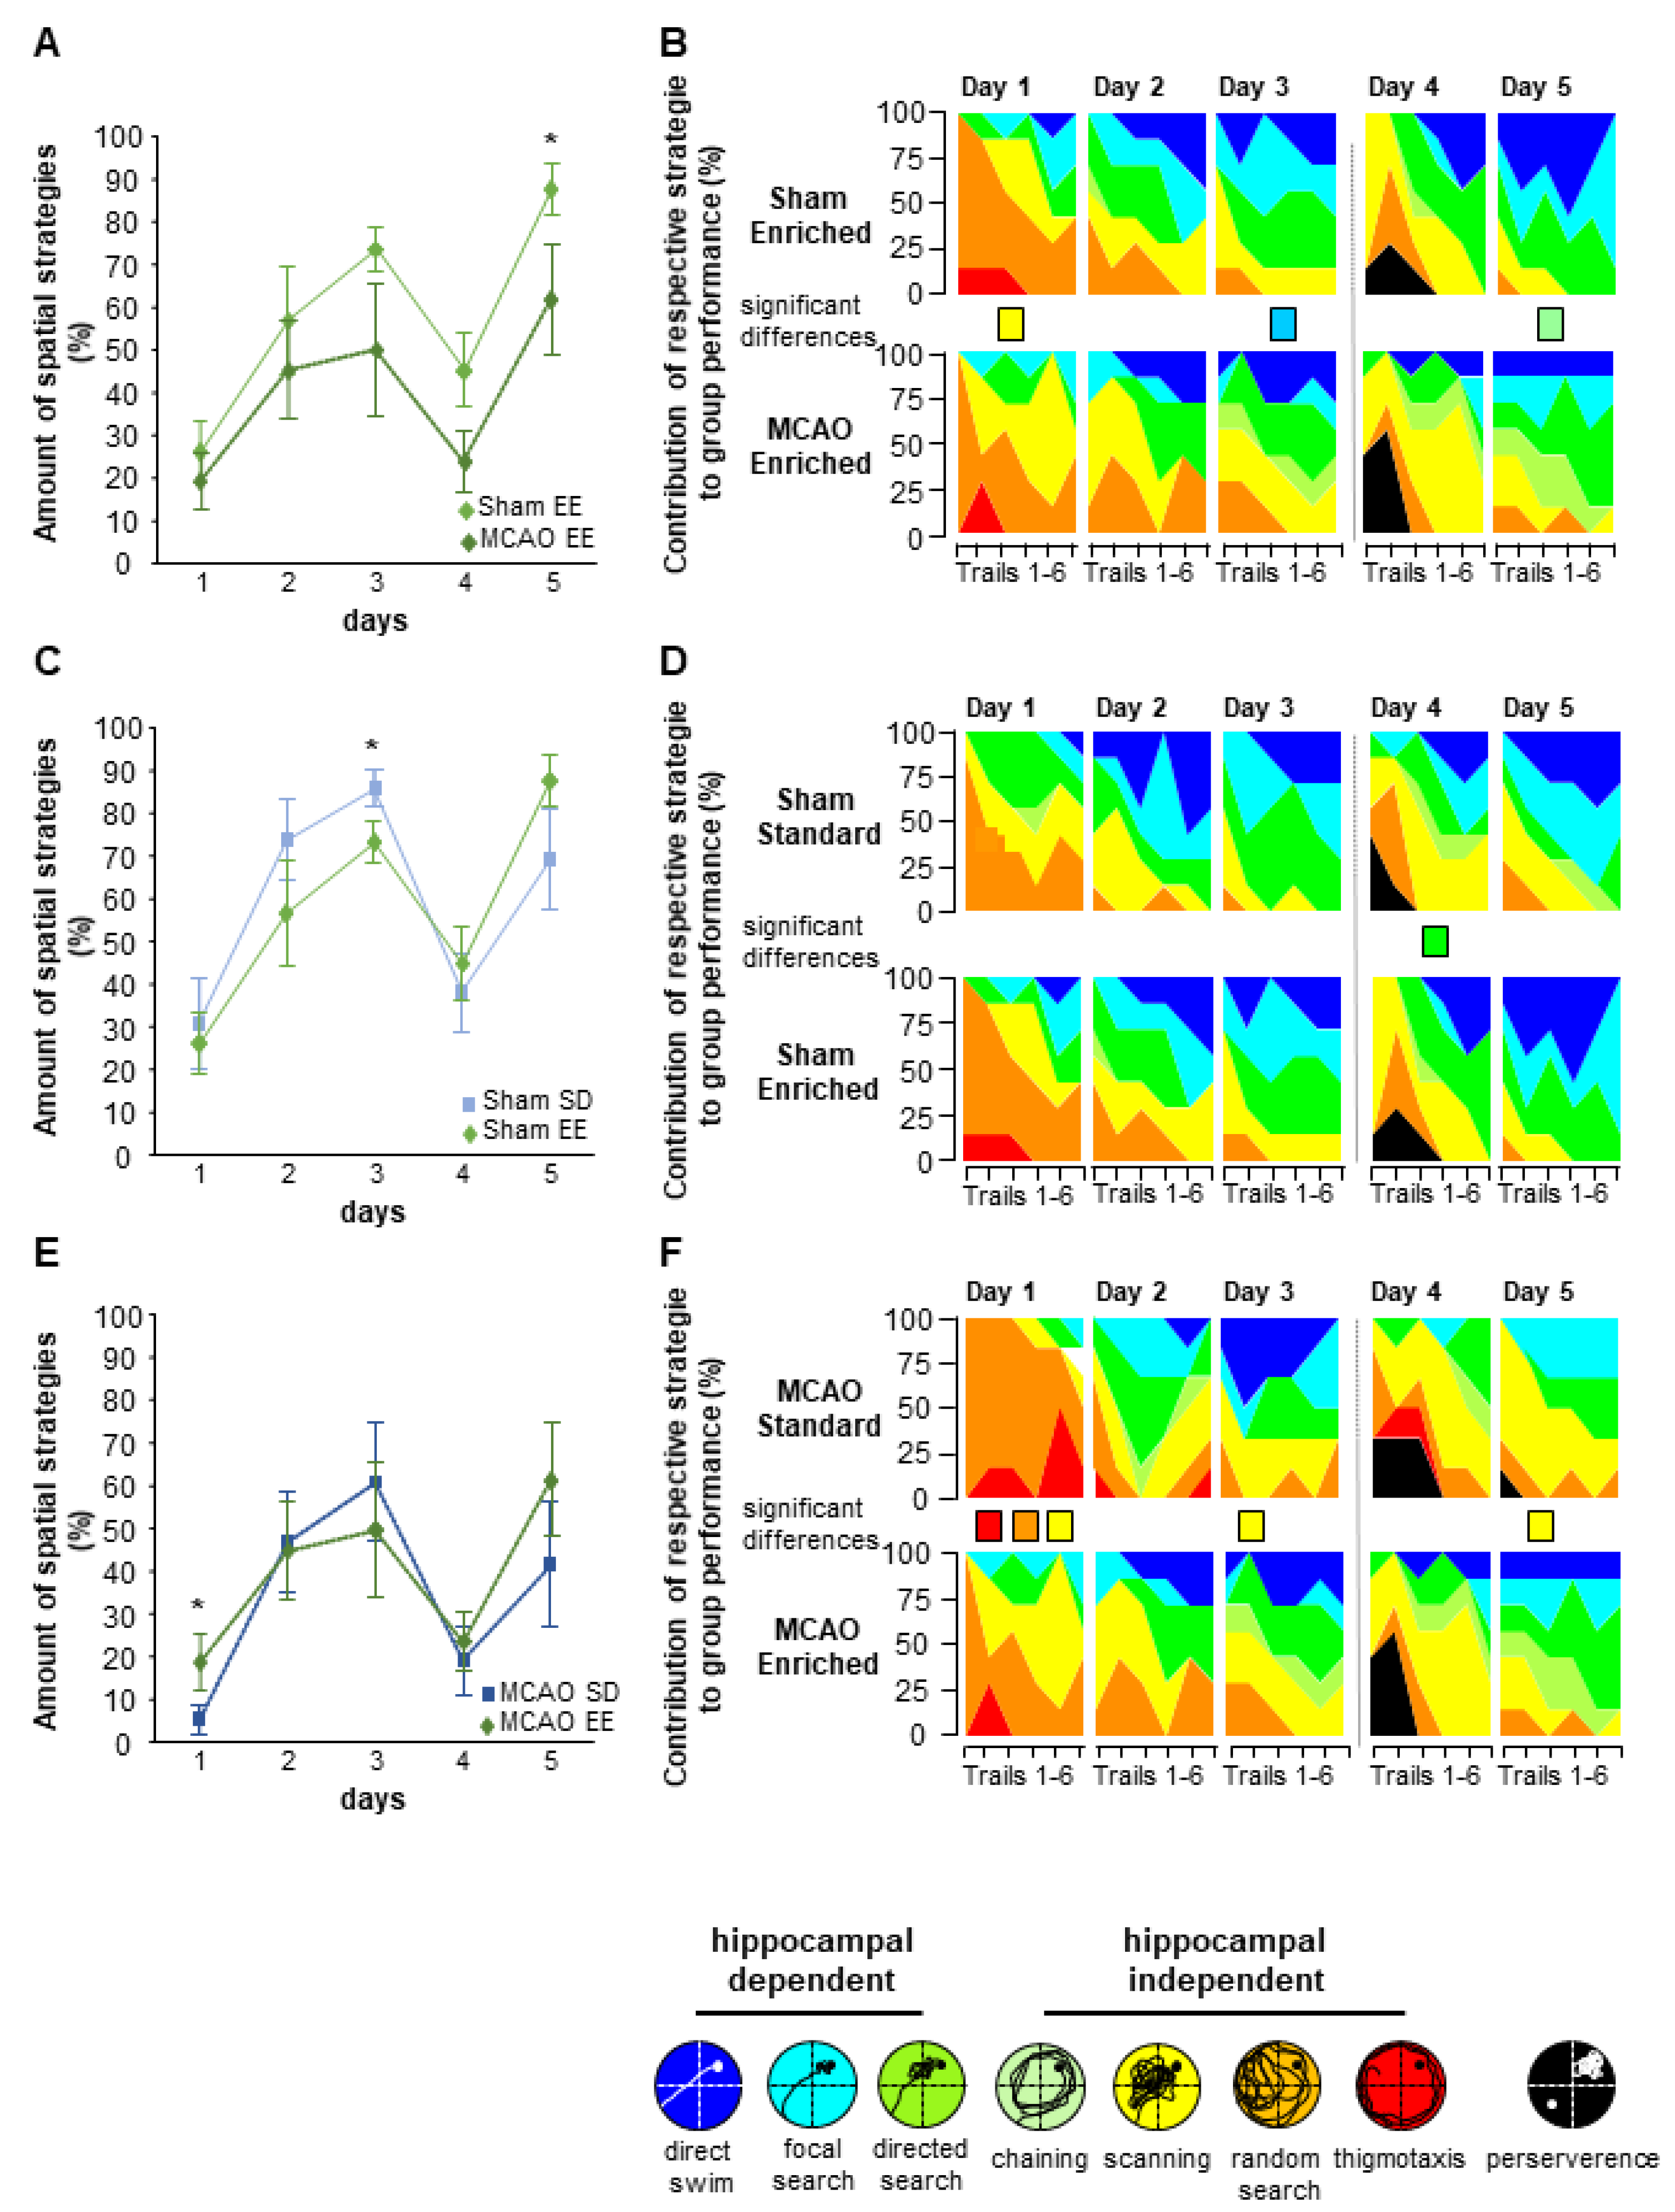
3.7. Enriched Environment Housing Improves Flexible Learning in the Morris Water Maze Task
4. Discussion
5. Conclusions
Author Contributions
Funding
Institutional Review Board Statement
Informed Consent Statement
Data Availability Statement
Acknowledgments
Conflicts of Interest
References
- Katan, M.; Luft, A. Global Burden of Stroke. Semin. Neurol. 2018, 38, 208–211. [Google Scholar] [CrossRef] [PubMed] [Green Version]
- Zhao, Y.; Zhang, X.; Chen, X.; Wei, Y. Neuronal injuries in cerebral infarction and ischemic stroke: From mechanisms to treatment (Review). Int. J. Mol. Med. 2022, 49, 15. [Google Scholar] [CrossRef] [PubMed]
- Petcu, E.B.; Sfredel, V.; Platt, D.; Herndon, J.G.; Kessler, C.; Popa-Wagner, A. Cellular and molecular events underlying the dysregulated response of the aged brain to stroke: A mini-review. Gerontology 2008, 54, 6–17. [Google Scholar] [CrossRef]
- Wall, K.J.; Isaacs, M.L.; Copland, D.; Cumming, T. Assessing cognition after stroke. Who misses out? A systematic review. Int. J. Stroke 2015, 10, 665–671. [Google Scholar] [CrossRef] [PubMed]
- Cojocaru, G.R.; Popa-Wagner, A.; Stanciulescu, E.C.; Babadan, L.; Buga, A.-M. Post-stroke depression and the aging brain. J. Mol. Psychiatry 2013, 1, 14. [Google Scholar] [CrossRef] [Green Version]
- Prins, J.; Donders, J.C.; Helfet, D.L.; Wellman, D.S.; Klinger, C.E.; Redko, M.; Kloen, P. Periprosthetic femoral nonunions treated with internal fixation and bone grafting. Injury 2018, 49, 2295–2301. [Google Scholar] [CrossRef]
- Blum, S.; Luchsinger, J.A.; Manly, J.J.; Schupf, N.; Stern, Y.; Brown, T.R.; DeCarli, C.; Small, S.A.; Mayeux, R.; Brickman, A.M. Memory after silent stroke: Hippocampus and infarcts both matter. Neurology 2012, 78, 38–46. [Google Scholar] [CrossRef] [Green Version]
- Jokinen, H.; Melkas, S.; Ylikoski, R.; Pohjasvaara, T.; Kaste, M.; Erkinjuntti, T.; Hietanen, M. Post-stroke cognitive impairment is common even after successful clinical recovery. Eur. J. Neurol. 2015, 22, 1288–1294. [Google Scholar] [CrossRef]
- Sharma, D.; Smith, M. The intensive care management of acute ischaemic stroke. Curr. Opin. Crit. Care 2022, 28, 157–165. [Google Scholar] [CrossRef]
- Tsivgoulis, G.; Kargiotis, O.; Alexandrov, A.V. Intravenous thrombolysis for acute ischemic stroke: A bridge between two centuries. Expert Rev. Neurother. 2017, 17, 819–837. [Google Scholar] [CrossRef]
- Berkhemer, O.; van der Lugt, A. Extracranial Carotid Disease and Effect of Intra-arterial Treatment in Patients With Proximal Anterior Circulation Stroke. Ann. Intern. Med. 2018, 168, 83–84. [Google Scholar] [CrossRef] [PubMed]
- Campbell, B.C.; Parsons, M.W. Repeat brain imaging after thrombolysis is important. Int. J. Stroke 2015, 10, E18. [Google Scholar] [CrossRef] [PubMed]
- Bracard, S.; Ducrocq, X.; Mas, J.L.; Soudant, M.; Oppenheim, C.; Moulin, T.; Guillemin, F. Mechanical thrombectomy after intravenous alteplase versus alteplase alone after stroke (THRACE): A randomised controlled trial. Lancet Neurol. 2016, 15, 1138–1147. [Google Scholar] [CrossRef] [PubMed]
- Kollen, B.; Kwakkel, G.; Lindeman, E. Functional recovery after stroke: A review of current developments in stroke rehabilitation research. Rev. Recent Clin. Trials 2006, 1, 75–80. [Google Scholar] [CrossRef]
- Nie, J.; Yang, X. Modulation of Synaptic Plasticity by Exercise Training as a Basis for Ischemic Stroke Rehabilitation. Cell. Mol. Neurobiol. 2017, 37, 5–16. [Google Scholar] [CrossRef]
- Mijajlovic, M.D.; Pavlović, A.; Brainin, M.; Heiss, W.D.; Quinn, T.J.; Ihle-Hansen, H.B.; Hermann, D.M.; Assayag, E.B.; Richard, E.; Thiel, A.; et al. Post-stroke dementia—A comprehensive review. BMC Med. 2017, 15, 11. [Google Scholar] [CrossRef] [Green Version]
- Ming, G.L.; Song, H. Adult neurogenesis in the mammalian central nervous system. Annu. Rev. Neurosci. 2005, 28, 223–250. [Google Scholar] [CrossRef]
- Gage, F.H. Adult neurogenesis in mammals. Science 2019, 364, 827–828. [Google Scholar] [CrossRef]
- Ceanga, M.; Dahab, M.; Witte, O.W.; Keiner, S. Adult Neurogenesis and Stroke: A Tale of Two Neurogenic Niches. Front. Neurosci. 2021, 15, 700297. [Google Scholar] [CrossRef]
- Ceanga, M.; Guenther, M.; Ingrisch, I.; Kunze, A. Characterization of Hippocampal Adult-borne Granule Cells in a Transient Cerebral Ischemia Model. Bio Protoc. 2021, 11, e3890. [Google Scholar] [CrossRef]
- Geibig, C.W.S.; Keiner, S.; Redecker, C. Functional recruitment of newborn hippocampal neurons after experimental stroke. Neurobiol. Dis. 2012, 46, 431–439. [Google Scholar] [CrossRef] [PubMed]
- Jessberger, S.; Nakashima, K.; Clemenson, G.D.; Mejia, E.; Mathews, E.; Ure, K.; Ogawa, S.; Sinton, C.M.; Gage, F.H.; Hsieh, J. Epigenetic modulation of seizure-induced neurogenesis and cognitive decline. J. Neurosci. 2007, 27, 5967–5975. [Google Scholar] [CrossRef] [PubMed] [Green Version]
- Jessberger, S.; Parent, J.M. Epilepsy and Adult Neurogenesis. Cold Spring Harb. Perspect. Biol. 2015, 7, a020677. [Google Scholar] [CrossRef] [PubMed] [Green Version]
- Tartt, A.N.; Mariani, M.B.; Hen, R.; Mann, J.J.; Boldrini, M. Dysregulation of adult hippocampal neuroplasticity in major depression: Pathogenesis and therapeutic implications. Mol. Psychiatry 2022, 27, 2689–2699. [Google Scholar] [CrossRef] [PubMed]
- Farioli-Vecchioli, S.; Ricci, V.; Middei, S. Adult Hippocampal Neurogenesis in Alzheimer’s Disease: An Overview of Human and Animal Studies with Implications for Therapeutic Perspectives Aimed at Memory Recovery. Neural Plast. 2022, 2022, 9959044. [Google Scholar] [CrossRef] [PubMed]
- Kunze, A.; Grass, S.; Witte, O.W.; Yamaguchi, M.; Kempermann, G.; Redecker, C. Proliferative response of distinct hippocampal progenitor cell populations after cortical infarcts in the adult brain. Neurobiol. Dis. 2006, 21, 324–332. [Google Scholar] [CrossRef]
- Kluska, M.; Witte, O.; Bolz, J.; Redecker, C. Neurogenesis in the adult dentate gyrus after cortical infarcts: Effects of infarct location, N-methyl-D-aspartate receptor blockade and anti-inflammatory treatment. Neuroscience 2005, 135, 723–735. [Google Scholar] [CrossRef]
- Liu, J.; Solway, K.; Messing, R.; Sharp, F.R. Increased neurogenesis in the dentate gyrus after transient global ischemia in gerbils. J. Neurosci. 1998, 18, 7768–7778. [Google Scholar] [CrossRef] [Green Version]
- Wurm, F.; Keiner, S.; Kunze, A.; Witte, O.W.; Redecker, C. Effects of skilled forelimb training on hippocampal neurogenesis and spatial learning after focal cortical infarcts in the adult rat brain. Stroke 2007, 38, 2833–2840. [Google Scholar] [CrossRef] [Green Version]
- Woitke, F.; Ceangă, M.; Rudolph, M.; Niv, F.; Witte, O.W.; Redecker, C.; Kunze, A.; Keiner, S. Adult hippocampal neurogenesis poststroke: More new granule cells but aberrant morphology and impaired spatial memory. PLoS ONE 2017, 12, e0183463. [Google Scholar] [CrossRef] [Green Version]
- Zhang, L.; Hu, X.; Luo, J.; Li, L.; Chen, X.; Huang, R.; Pei, Z. Physical exercise improves functional recovery through mitigation of autophagy, attenuation of apoptosis and enhancement of neurogenesis after MCAO in rats. BMC Neurosci. 2013, 14, 46. [Google Scholar] [CrossRef] [PubMed] [Green Version]
- Codd, L.N.; Blackmore, D.G.; Vukovic, J.; Bartlett, P.F. Exercise reverses learning deficits induced by hippocampal injury by promoting neurogenesis. Sci. Rep. 2020, 10, 19269. [Google Scholar] [CrossRef] [PubMed]
- Cuartero, M.; De La Parra, J.; Pérez-Ruiz, A.; Bravo-Ferrer, I.; Durán-Laforet, V.; Garcia-Culebras, A.; García-Segura, J.M.; Dhaliwal, J.; Frankland, P.W.; Lizasoain, I.; et al. Abolition of aberrant neurogenesis ameliorates cognitive impairment after stroke in mice. J. Clin. Investig. 2019, 129, 1536–1550. [Google Scholar] [CrossRef] [PubMed]
- Hong, M.; Kim, M.; Kim, T.-W.; Park, S.-S.; Kim, M.-K.; Park, Y.H.; Sung, Y.-H.; Shin, M.-S. Treadmill Exercise Improves Motor Function and Short-term Memory by Enhancing Synaptic Plasticity and Neurogenesis in Photothrombotic Stroke Mice. Int. Neurourol. J. 2020, 24 (Suppl. 1), S28–S38. [Google Scholar] [CrossRef]
- Niv, F.; Keiner, S.; Krishna, K.; Witte, O.W.; Lie, D.C.; Redecker, C. Aberrant neurogenesis after stroke: A retroviral cell labeling study. Stroke 2012, 43, 2468–2475. [Google Scholar] [CrossRef] [Green Version]
- Jessberger, S.; Zhao, C.; Toni, N.; Clemenson, G.D.; Li, Y.; Gage, F.H. Seizure-associated, aberrant neurogenesis in adult rats characterized with retrovirus-mediated cell labeling. J. Neurosci. 2007, 27, 9400–9407. [Google Scholar] [CrossRef] [Green Version]
- Lybrand, Z.R.; Goswami, S.; Zhu, J.; Jarzabek, V.; Merlock, N.; Aktar, M.; Smith, C.; Zhang, L.; Varma, P.; Cho, K.-O.; et al. A critical period of neuronal activity results in aberrant neurogenesis rewiring hippocampal circuitry in a mouse model of epilepsy. Nat. Commun. 2021, 12, 1423. [Google Scholar] [CrossRef]
- Cho, K.-O.; Lybrand, Z.R.; Ito, N.; Brulet, R.; Tafacory, F.; Zhang, L.; Good, L.; Ure, K.; Kernie, S.G.; Birnbaum, S.G.; et al. Aberrant hippocampal neurogenesis contributes to epilepsy and associated cognitive decline. Nat. Commun. 2015, 6, 6606. [Google Scholar] [CrossRef] [Green Version]
- Bieber, M.; Gronewold, J.; Scharf, A.-C.; Schuhmann, M.K.; Langhauser, F.; Hopp, S.; Mencl, S.; Geuss, E.; Leinweber, J.; Guthmann, J.; et al. Validity and Reliability of Neurological Scores in Mice Exposed to Middle Cerebral Artery Occlusion. Stroke 2019, 50, 2875–2882. [Google Scholar] [CrossRef]
- Bederson, J.B.; Pitts, L.H.; Tsuji, M.; Nishimura, M.C.; Davis, R.L.; Bartkowski, H. Rat middle cerebral artery occlusion: Evaluation of the model and development of a neurologic examination. Stroke 1986, 17, 472–476. [Google Scholar] [CrossRef] [Green Version]
- Kathner-Schaffert, C.; Karapetow, L.; Günther, M.; Rudolph, M.; Dahab, M.; Baum, E.; Lehmann, T.; Witte, O.W.; Redecker, C.; Schmeer, C.W.; et al. Early Stroke Induces Long-Term Impairment of Adult Neurogenesis Accompanied by Hippocampal-Mediated Cognitive Decline. Cells 2019, 8, 1654. [Google Scholar] [CrossRef] [PubMed] [Green Version]
- Vadodaria, K.C.; Gage, F.H. SnapShot: Adult hippocampal neurogenesis. Cell 2014, 156, 1114.e1. [Google Scholar] [CrossRef] [PubMed]
- Toda, T.; Gage, F.H. Review: Adult neurogenesis contributes to hippocampal plasticity. Cell Tissue Res. 2018, 373, 693–709. [Google Scholar] [CrossRef] [PubMed]
- Toda, T.; Parylak, S.L.; Linker, S.B.; Gage, F.H. The role of adult hippocampal neurogenesis in brain health and disease. Mol. Psychiatry 2019, 24, 67–87. [Google Scholar] [CrossRef] [PubMed]
- Denoth-Lippuner, A.; Jessberger, S. Formation and integration of new neurons in the adult hippocampus. Nat. Rev. Neurosci. 2021, 22, 223–236. [Google Scholar] [CrossRef] [PubMed]
- Rao, M.S.; Shetty, A.K. Efficacy of doublecortin as a marker to analyse the absolute number and dendritic growth of newly generated neurons in the adult dentate gyrus. Eur. J. Neurosci. 2004, 19, 234–246. [Google Scholar] [CrossRef]
- Austin, J.E.; Buckmaster, P.S. Recurrent excitation of granule cells with basal dendrites and low interneuron density and inhibitory postsynaptic current frequency in the dentate gyrus of macaque monkeys. J. Comp. Neurol. 2004, 476, 205–218. [Google Scholar] [CrossRef]
- Overstreet-Wadiche, L.S.; Westbrook, G.L. Functional maturation of adult-generated granule cells. Hippocampus 2006, 16, 208–215. [Google Scholar] [CrossRef]
- Shapiro, L.A.; Ribak, C.E. Integration of newly born dentate granule cells into adult brains: Hypotheses based on normal and epileptic rodents. Brain Res. Rev. 2005, 48, 43–56. [Google Scholar] [CrossRef]
- Lindvall, O.; Kokaia, Z. Neurogenesis following Stroke Affecting the Adult Brain. Cold Spring Harb. Perspect. Biol. 2015, 7, a019034. [Google Scholar] [CrossRef] [Green Version]
- Keiner, S.; Walter, J.; Oberland, J.; Redecker, C. Contribution of constitutively proliferating precursor cell subtypes to dentate neurogenesis after cortical infarcts. BMC Neurosci. 2010, 11, 146. [Google Scholar] [CrossRef] [PubMed] [Green Version]
- Walter, J.; Keiner, S.; Witte, O.; Redecker, C. Differential stroke-induced proliferative response of distinct precursor cell subpopulations in the young and aged dentate gyrus. Neuroscience 2010, 169, 1279–1286. [Google Scholar] [CrossRef] [PubMed]
- Ceanga, M.; Keiner, S.; Grünewald, B.; Haselmann, H.; Frahm, C.; Couillard-Després, S.; Witte, O.W.; Redecker, C.; Geis, C.; Kunze, A. Stroke Accelerates and Uncouples Intrinsic and Synaptic Excitability Maturation of Mouse Hippocampal DCX(+) Adult-Born Granule Cells. J. Neurosci. 2019, 39, 1755–1766. [Google Scholar] [CrossRef] [PubMed] [Green Version]
- Rudolph, M.; Schmeer, C.W.; Günther, M.; Woitke, F.; Kathner-Schaffert, C.; Karapetow, L.; Lindner, J.; Lehmann, T.; Jirikowski, G.; Witte, O.W.; et al. Microglia-mediated phagocytosis of apoptotic nuclei is impaired in the adult murine hippocampus after stroke. Glia 2021, 69, 2006–2022. [Google Scholar] [CrossRef] [PubMed]
- Bielefeld, P.; Durá, I.; Danielewicz, J.; Lucassen, P.J.; Baekelandt, V.; Abrous, D.; Encinas, J.; Fitzsimons, C. Insult-induced aberrant hippocampal neurogenesis: Functional consequences and possible therapeutic strategies. Behav. Brain Res. 2019, 372, 112032. [Google Scholar] [CrossRef] [PubMed]
- Parent, J.M.; Timothy, W.Y.; Leibowitz, R.T.; Geschwind, D.H.; Sloviter, R.S.; Lowenstein, D.H. Dentate granule cell neurogenesis is increased by seizures and contributes to aberrant network reorganization in the adult rat hippocampus. J. Neurosci. 1997, 17, 3727–3738. [Google Scholar] [CrossRef] [Green Version]
- Patel, L.S.; Wenzel, H.J.; Schwartzkroin, P.A. Schwartzkroin, Physiological and morphological characterization of dentate granule cells in the p35 knock-out mouse hippocampus: Evidence for an epileptic circuit. J. Neurosci. 2004, 24, 9005–9014. [Google Scholar] [CrossRef] [Green Version]
- Hester, M.S.; Danzer, S.C. Accumulation of abnormal adult-generated hippocampal granule cells predicts seizure frequency and severity. J. Neurosci. 2013, 33, 8926–8936. [Google Scholar] [CrossRef]
- Jessberger, S.; Römer, B.; Babu, H.; Kempermann, G. Seizures induce proliferation and dispersion of doublecortin-positive hippocampal progenitor cells. Exp. Neurol. 2005, 196, 342–351. [Google Scholar] [CrossRef] [PubMed]
- Pollock, A.; Baer, G.; Campbell, P.; Choo, P.L.; Forster, A.; Morris, J.; Pomeroy, V.M.; Langhorne, P. Physical rehabilitation approaches for the recovery of function and mobility following stroke. Cochrane Database Syst. Rev. 2014, 2014, CD001920. [Google Scholar] [CrossRef] [Green Version]
- Van Praag, H.; Kempermann, G.; Gage, F.H. Running increases cell proliferation and neurogenesis in the adult mouse dentate gyrus. Nat. Neurosci. 1999, 2, 266–270. [Google Scholar] [CrossRef] [PubMed]
- Kempermann, G.; Fabel, K.; Ehninger, D.; Babu, H.; Leal-Galicia, P.; Garthe, A.; Wolf, S.A. Why and how physical activity promotes experience-induced brain plasticity. Front. Neurosci. 2010, 4, 189. [Google Scholar] [CrossRef] [PubMed] [Green Version]
- Kempermann, G. Seven principles in the regulation of adult neurogenesis. Eur. J. Neurosci. 2011, 33, 1018–1024. [Google Scholar] [CrossRef] [PubMed]
- Kempermann, G.; Brandon, E.P.; Gage, F.H. Environmental stimulation of 129/SvJ mice causes increased cell proliferation and neurogenesis in the adult dentate gyrus. Curr. Biol. 1998, 8, 939–942. [Google Scholar] [CrossRef] [PubMed] [Green Version]
- Matsumori, Y.; Hong, S.M.; Fan, Y.; Kayama, T.; Hsu, C.Y.; Weinstein, P.R.; Liu, J. Enriched environment and spatial learning enhance hippocampal neurogenesis and salvages ischemic penumbra after focal cerebral ischemia. Neurobiol. Dis. 2006, 22, 187–198. [Google Scholar] [CrossRef]
- Jung, K.-H.; Chu, K.; Kim, M.; Jeong, S.-W.; Song, Y.-M.; Lee, S.-T.; Kim, J.-Y.; Lee, S.K.; Roh, J.-K. Continuous cytosine-b-D-arabinofuranoside infusion reduces ectopic granule cells in adult rat hippocampus with attenuation of spontaneous recurrent seizures following pilocarpine-induced status epilepticus. Eur. J. Neurosci. 2004, 19, 3219–3226. [Google Scholar] [CrossRef]
- Liu, T.; Li, Y.; Shu, Y.; Xiao, B.; Feng, L. Ephrinb3 modulates hippocampal neurogenesis and the reelin signaling pathway in a pilocarpineinduced model of epilepsy. Int. J. Mol. Med. 2018, 41, 3457–3467. [Google Scholar]
- Chen, L.; Wang, Y.; Chen, Z. Adult Neurogenesis in Epileptogenesis: An Update for Preclinical Finding and Potential Clinical Translation. Curr. Neuropharmacol. 2020, 18, 464–484. [Google Scholar] [CrossRef]
- Lugert, S.; Basak, O.; Knuckles, P.; Haussler, U.; Fabel, K.; Götz, M.; Haas, C.A.; Kempermann, G.; Taylor, V.; Giachino, C. Quiescent and active hippocampal neural stem cells with distinct morphologies respond selectively to physiological and pathological stimuli and aging. Cell Stem Cell 2010, 6, 445–456. [Google Scholar] [CrossRef] [Green Version]
- Faverjon, S.; Silveira, D.C.; Fu, D.D.; Cha, B.H.; Akman, C.; Hu, Y.; Holmes, G.L. Beneficial effects of enriched environment following status epilepticus in immature rats. Neurology 2002, 59, 1356–1364. [Google Scholar] [CrossRef]
- Rutten, A.; Van Albada, M.; Silveira, D.; Cha, B.H.; Liu, X.; Hu, Y.N.; Cilio, M.R.; Holmes, G.L. Memory impairment following status epilepticus in immature rats: Time-course and environmental effects. Eur. J. Neurosci. 2002, 16, 501–513. [Google Scholar] [CrossRef] [PubMed]
- Fares, R.P.; Belmeguenai, A.; Sanchez, P.E.; Kouchi, H.Y.; Bodennec, J.; Morales, A.; Georges, B.; Bonnet, C.; Bouvard, S.; Sloviter, R.S.; et al. Standardized environmental enrichment supports enhanced brain plasticity in healthy rats and prevents cognitive impairment in epileptic rats. PLoS ONE 2013, 8, e53888. [Google Scholar] [CrossRef] [PubMed] [Green Version]
- Zhang, X.; Liu, T.; Zhou, Z.; Mu, X.; Song, C.; Xiao, T.; Zhao, M.; Zhao, C. Enriched Environment Altered Aberrant Hippocampal Neurogenesis and Improved Long-Term Consequences After Temporal Lobe Epilepsy in Adult Rats. J. Mol. Neurosci. 2015, 56, 409–421. [Google Scholar] [CrossRef] [PubMed]
- Van Praag, H.; Shubert, T.; Zhao, C.; Gage, F.H. Exercise enhances learning and hippocampal neurogenesis in aged mice. J. Neurosci. 2005, 25, 8680–8685. [Google Scholar] [CrossRef] [PubMed] [Green Version]
- Johansson, B.B.; Ohlsson, A.-L. Environment, social interaction, and physical activity as determinants of functional outcome after cerebral infarction in the rat. Exp. Neurol. 1996, 139, 322–327. [Google Scholar] [CrossRef]
- Komitova, M.; Perfilieva, E.; Mattsson, B.; Eriksson, P.S.; Johansson, B.B. Effects of cortical ischemia and postischemic environmental enrichment on hippocampal cell genesis and differentiation in the adult rat. J. Cereb. Blood Flow Metab. 2002, 22, 852–860. [Google Scholar] [CrossRef] [Green Version]
- Nygren, J.; Wieloch, T. Enriched environment enhances recovery of motor function after focal ischemia in mice, and downregulates the transcription factor NGFI-A. J. Cereb. Blood Flow Metab. 2005, 25, 1625–1633. [Google Scholar] [CrossRef] [Green Version]
- Knieling, M.; Metz, G.; Antonow-Schlorke, I.; Witte, O. Enriched environment promotes efficiency of compensatory movements after cerebral ischemia in rats. Neuroscience 2009, 163, 759–769. [Google Scholar] [CrossRef]
- Amorós-Aguilar, L.; Rodríguez-Quiroga, E.; Sánchez-Santolaya, S.; Coll-Andreu, M. Effects of Combined Interventions with Aerobic Physical Exercise and Cognitive Training on Cognitive Function in Stroke Patients: A Systematic Review. Brain Sci. 2021, 11, 473. [Google Scholar] [CrossRef]


Disclaimer/Publisher’s Note: The statements, opinions and data contained in all publications are solely those of the individual author(s) and contributor(s) and not of MDPI and/or the editor(s). MDPI and/or the editor(s) disclaim responsibility for any injury to people or property resulting from any ideas, methods, instructions or products referred to in the content. |
© 2023 by the authors. Licensee MDPI, Basel, Switzerland. This article is an open access article distributed under the terms and conditions of the Creative Commons Attribution (CC BY) license (https://creativecommons.org/licenses/by/4.0/).
Share and Cite
Woitke, F.; Blank, A.; Fleischer, A.-L.; Zhang, S.; Lehmann, G.-M.; Broesske, J.; Haase, M.; Redecker, C.; Schmeer, C.W.; Keiner, S. Post-Stroke Environmental Enrichment Improves Neurogenesis and Cognitive Function and Reduces the Generation of Aberrant Neurons in the Mouse Hippocampus. Cells 2023, 12, 652. https://doi.org/10.3390/cells12040652
Woitke F, Blank A, Fleischer A-L, Zhang S, Lehmann G-M, Broesske J, Haase M, Redecker C, Schmeer CW, Keiner S. Post-Stroke Environmental Enrichment Improves Neurogenesis and Cognitive Function and Reduces the Generation of Aberrant Neurons in the Mouse Hippocampus. Cells. 2023; 12(4):652. https://doi.org/10.3390/cells12040652
Chicago/Turabian StyleWoitke, Florus, Antonia Blank, Anna-Lena Fleischer, Shanshan Zhang, Gina-Marie Lehmann, Julius Broesske, Madlen Haase, Christoph Redecker, Christian W. Schmeer, and Silke Keiner. 2023. "Post-Stroke Environmental Enrichment Improves Neurogenesis and Cognitive Function and Reduces the Generation of Aberrant Neurons in the Mouse Hippocampus" Cells 12, no. 4: 652. https://doi.org/10.3390/cells12040652