
The Absence of FAIM Leads to a Delay in Dark Adaptation and Hampers Arrestin-1 Translocation upon Light Reception in the Retina
 , , , and
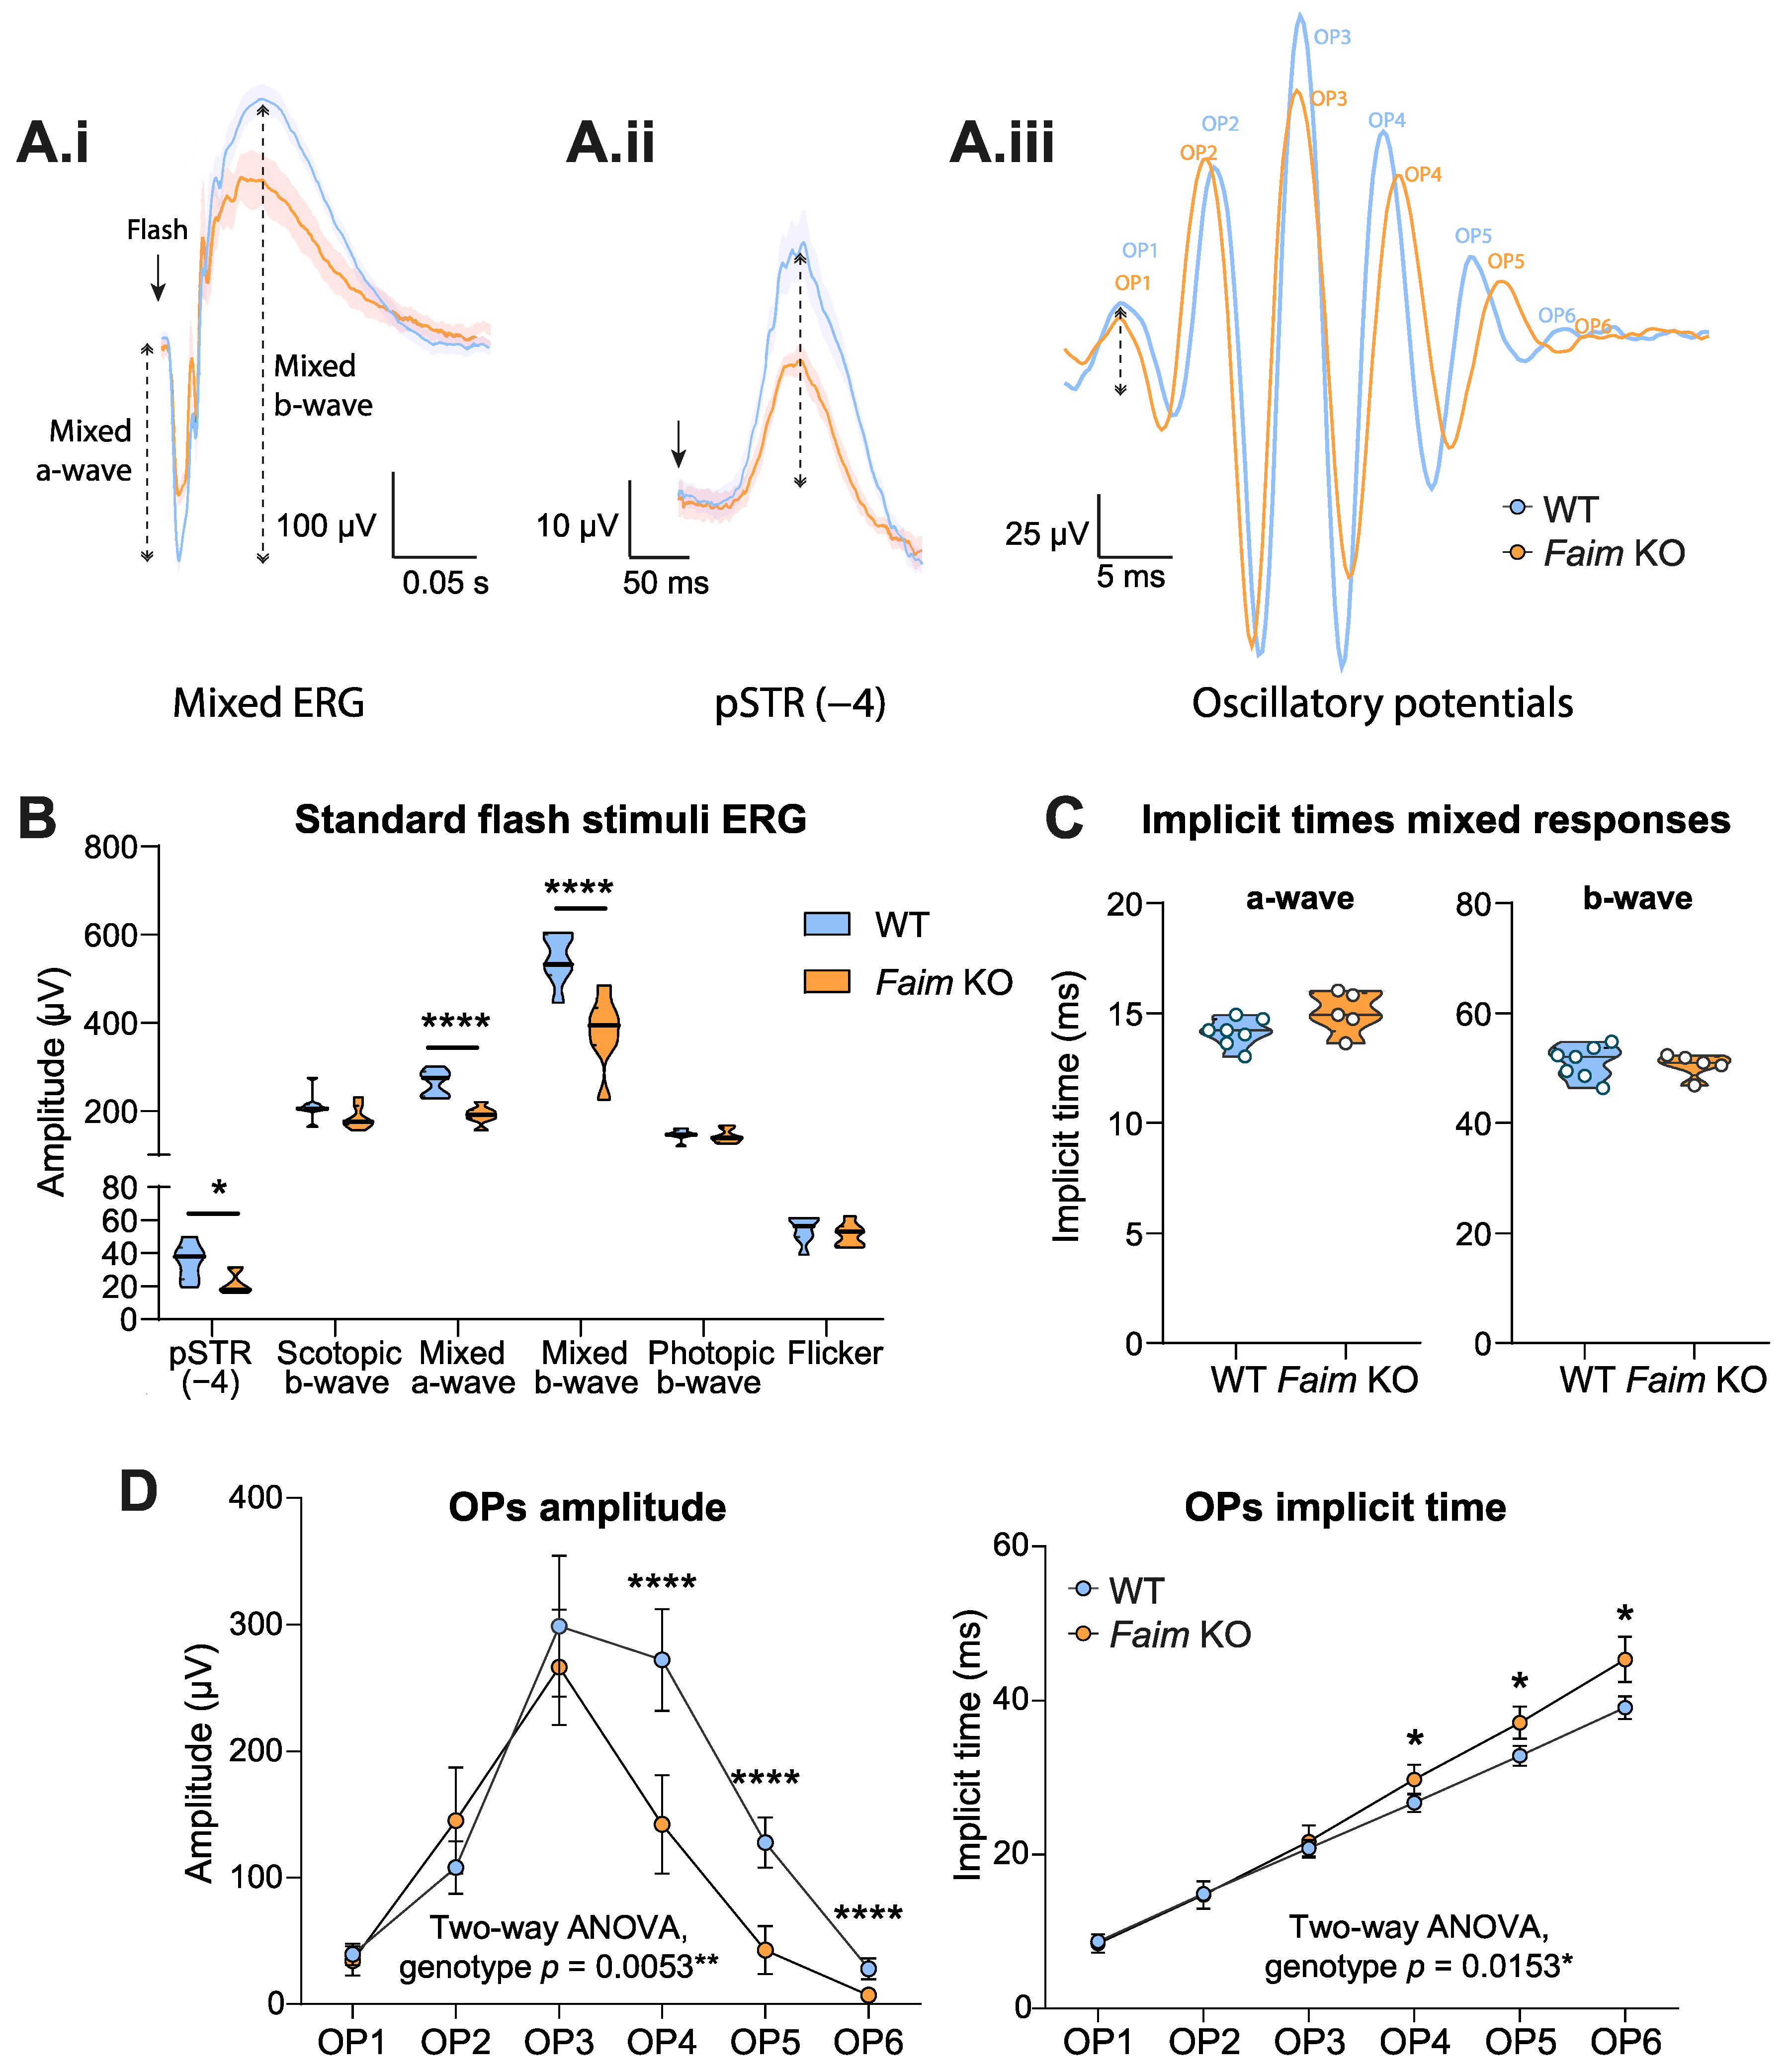
Abstract
:1. Introduction
2. Methods
2.1. Animal Care
2.2. Electroretinography
2.2.1. Standard Flash Stimuli Protocol
2.2.2. Double-Flash ERG for Dark Adaptation Assessment
2.3. Light Exposure Protocol
2.4. Light Damage Protocol
2.5. Tissue Collection and Processing
2.6. Immunofluorescence and Quantification
2.7. TUNEL Assay
2.8. Western Blotting
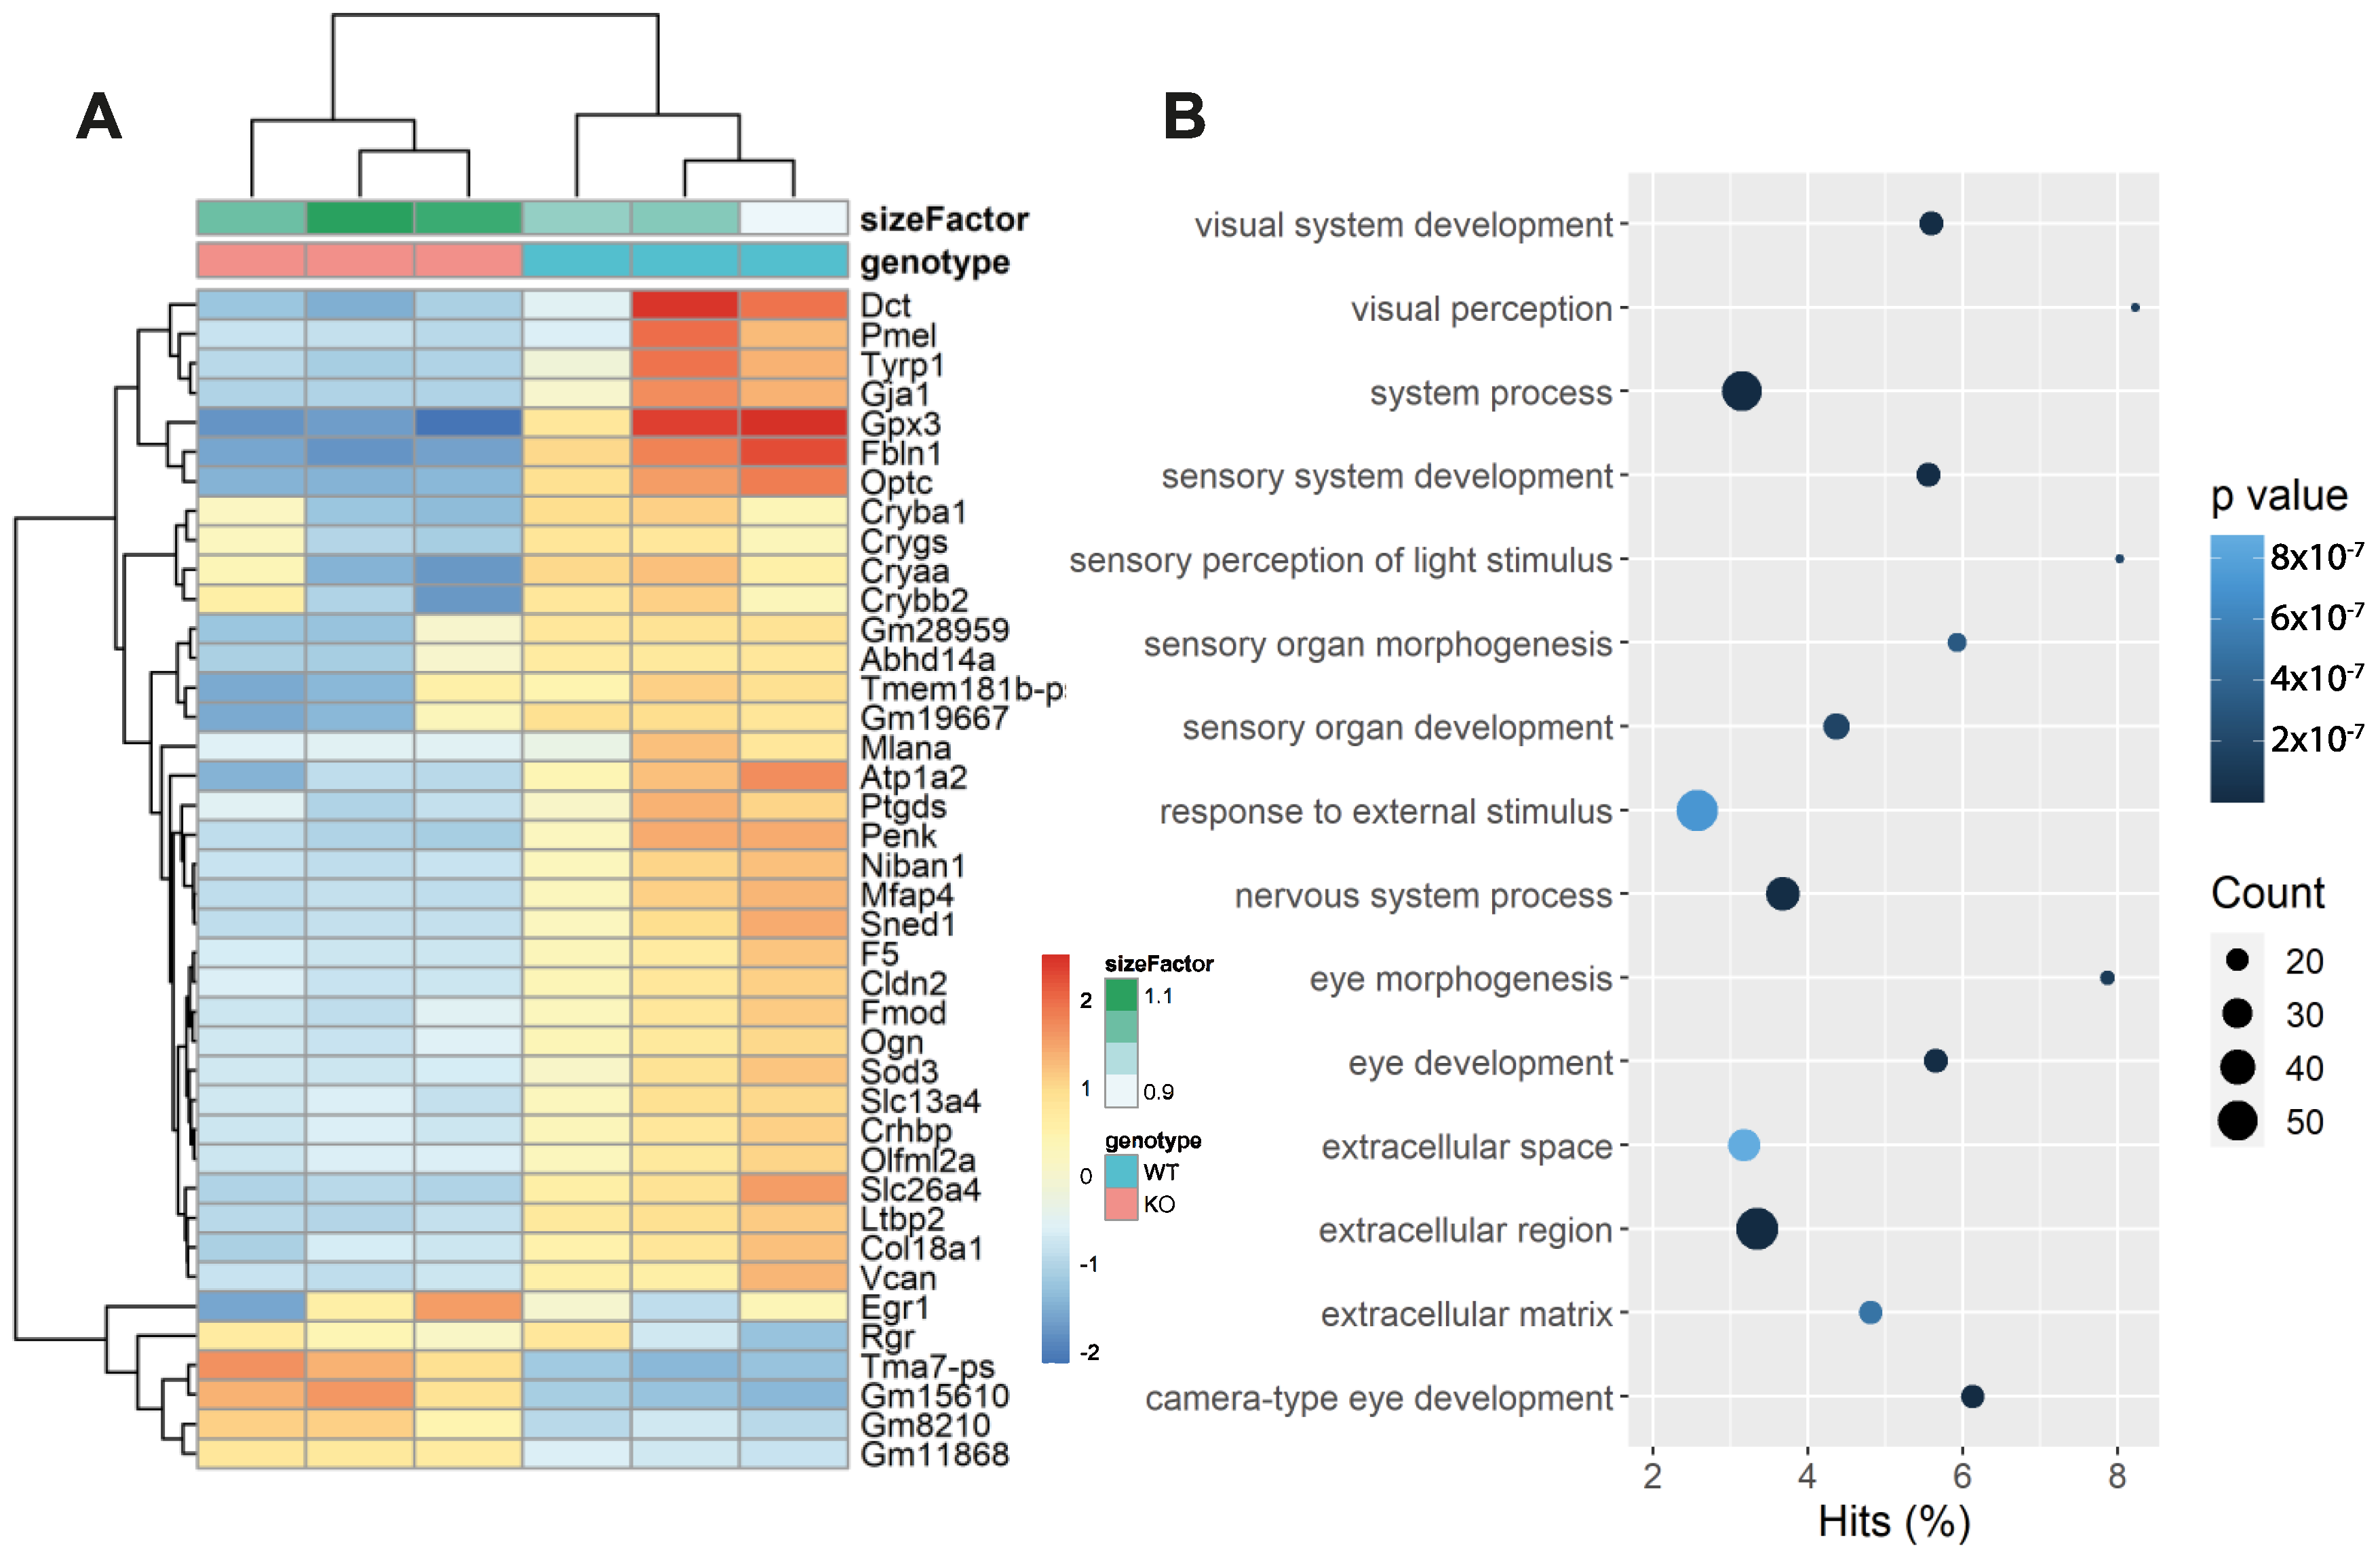
2.9. RNA-Sequencing and Analysis
2.10. Cell Culture Conditions
2.11. Cell Transfection and Ubiquitin Assay
2.12. Statistical Analyses
3. Results
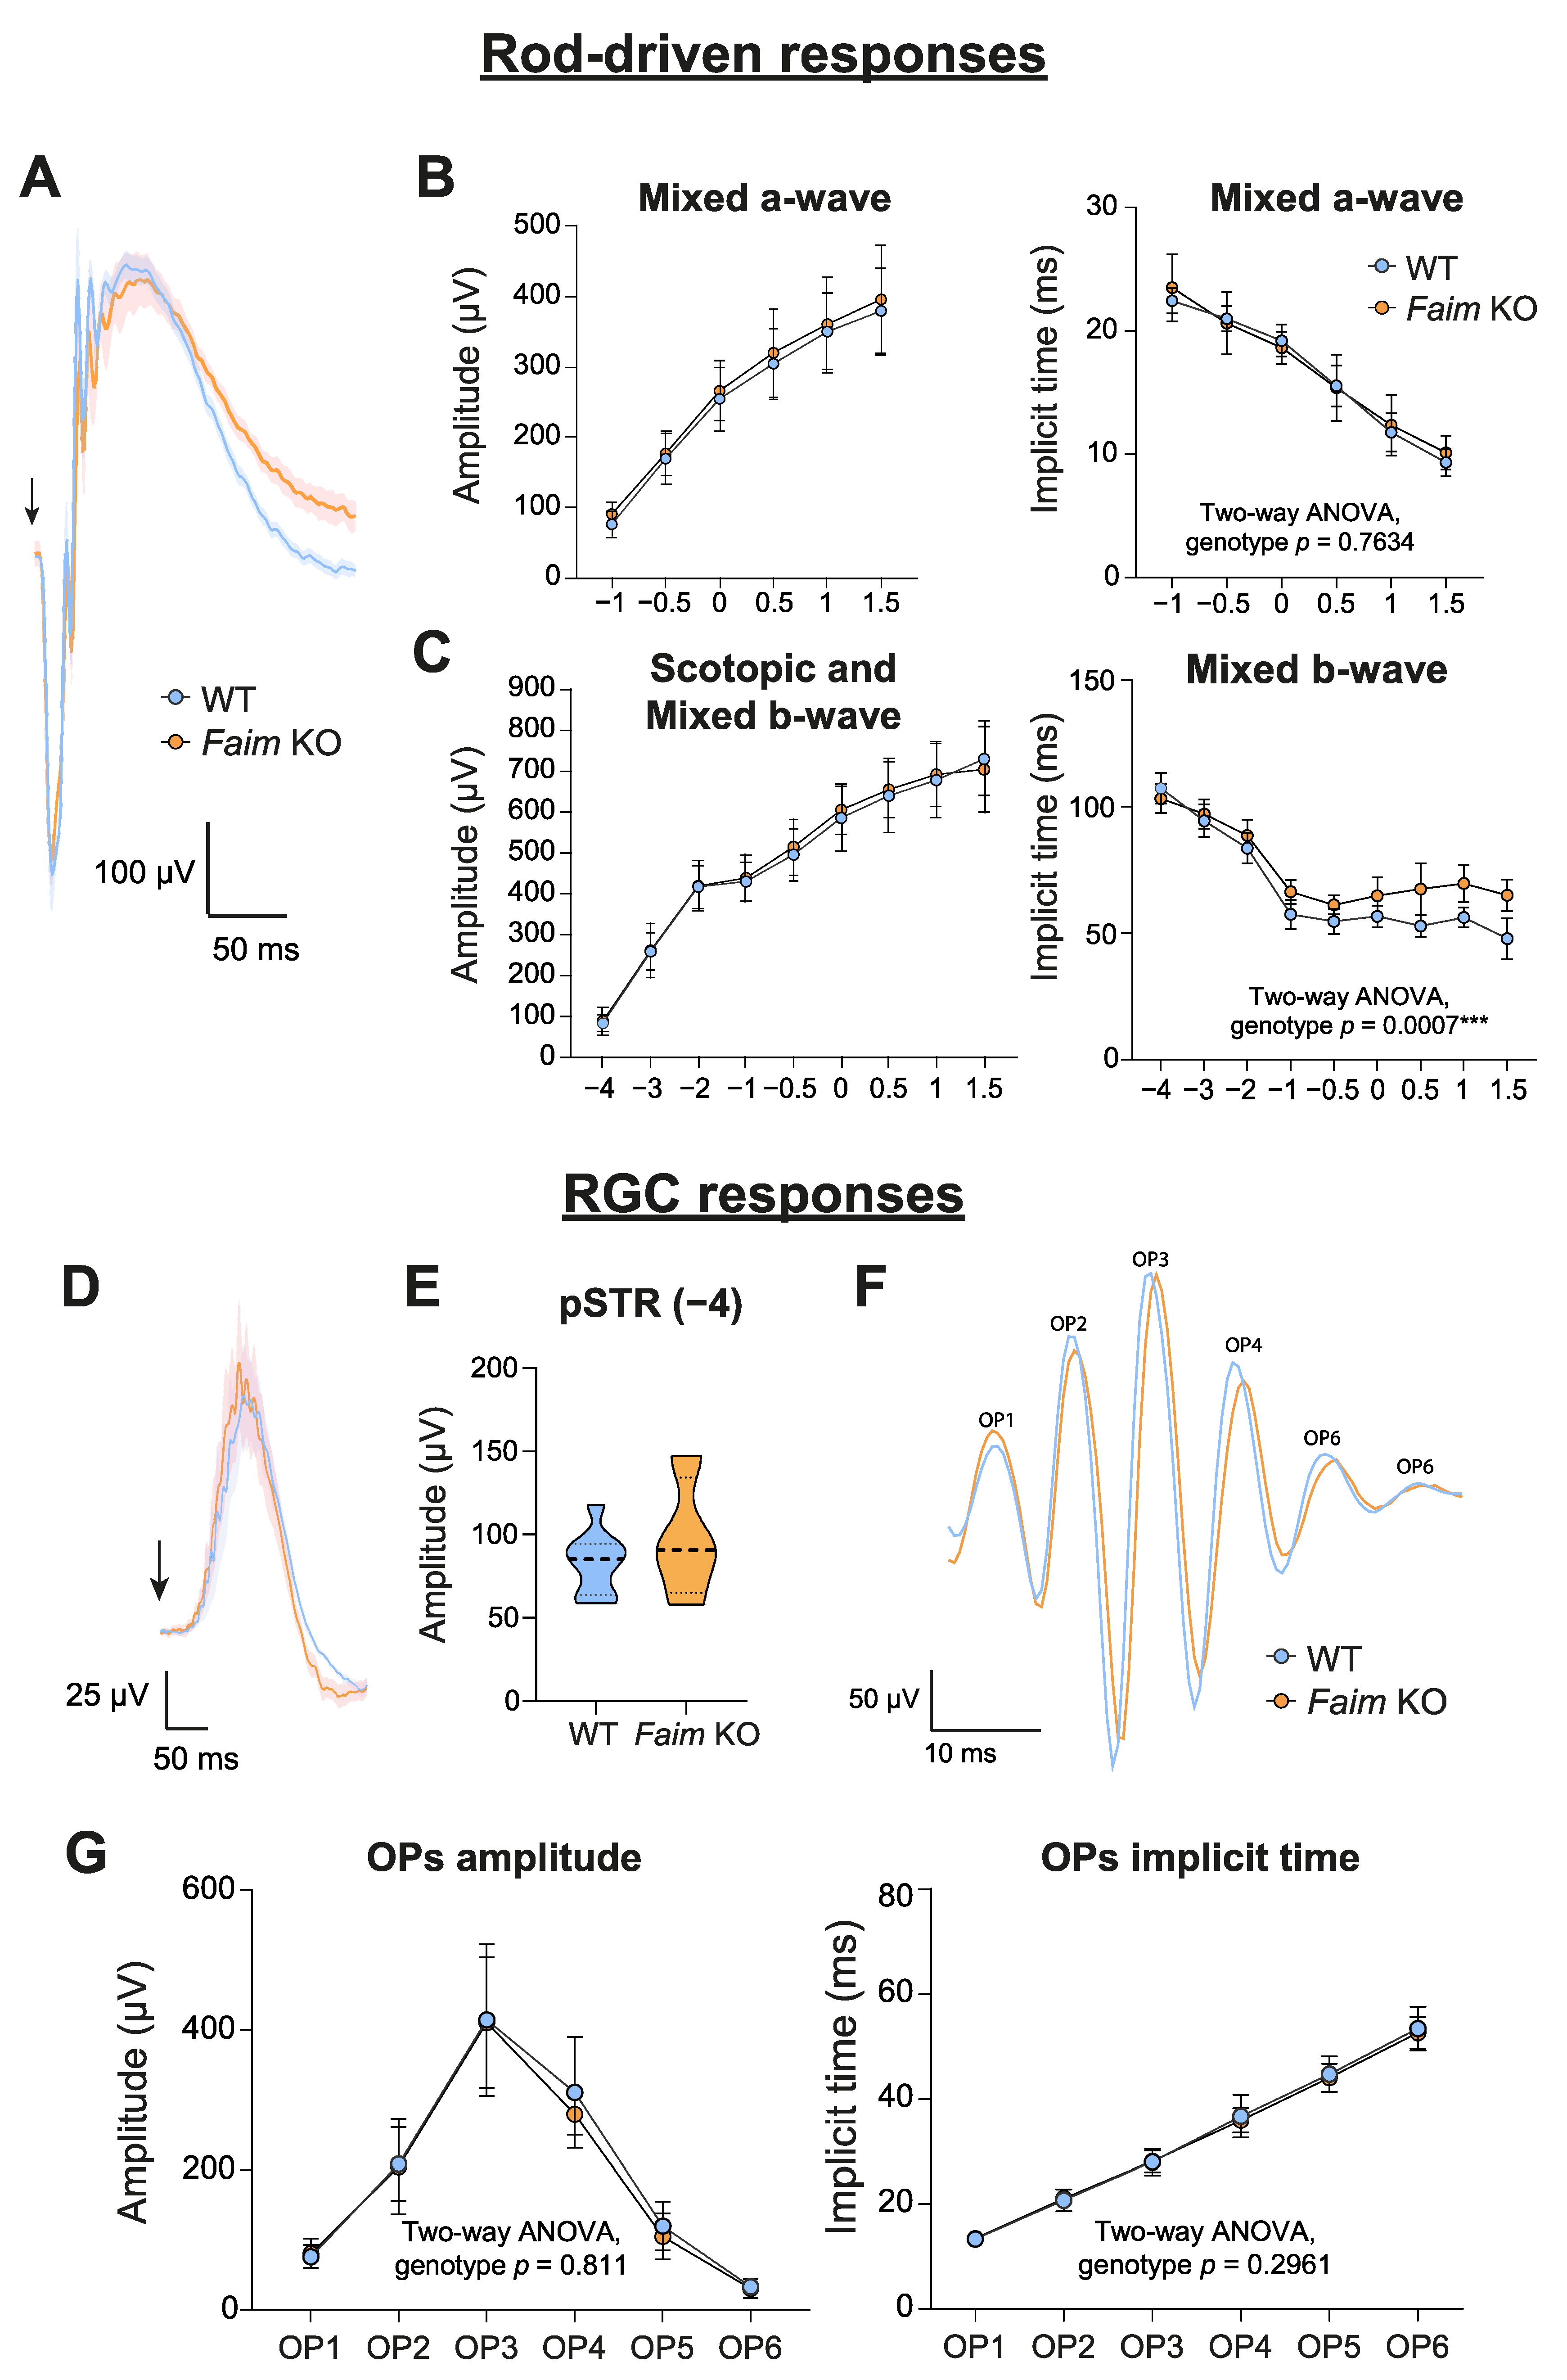
3.1. Loss of FAIM Leads to Age-Related Rod Photoreceptor and RGC Functional Defect
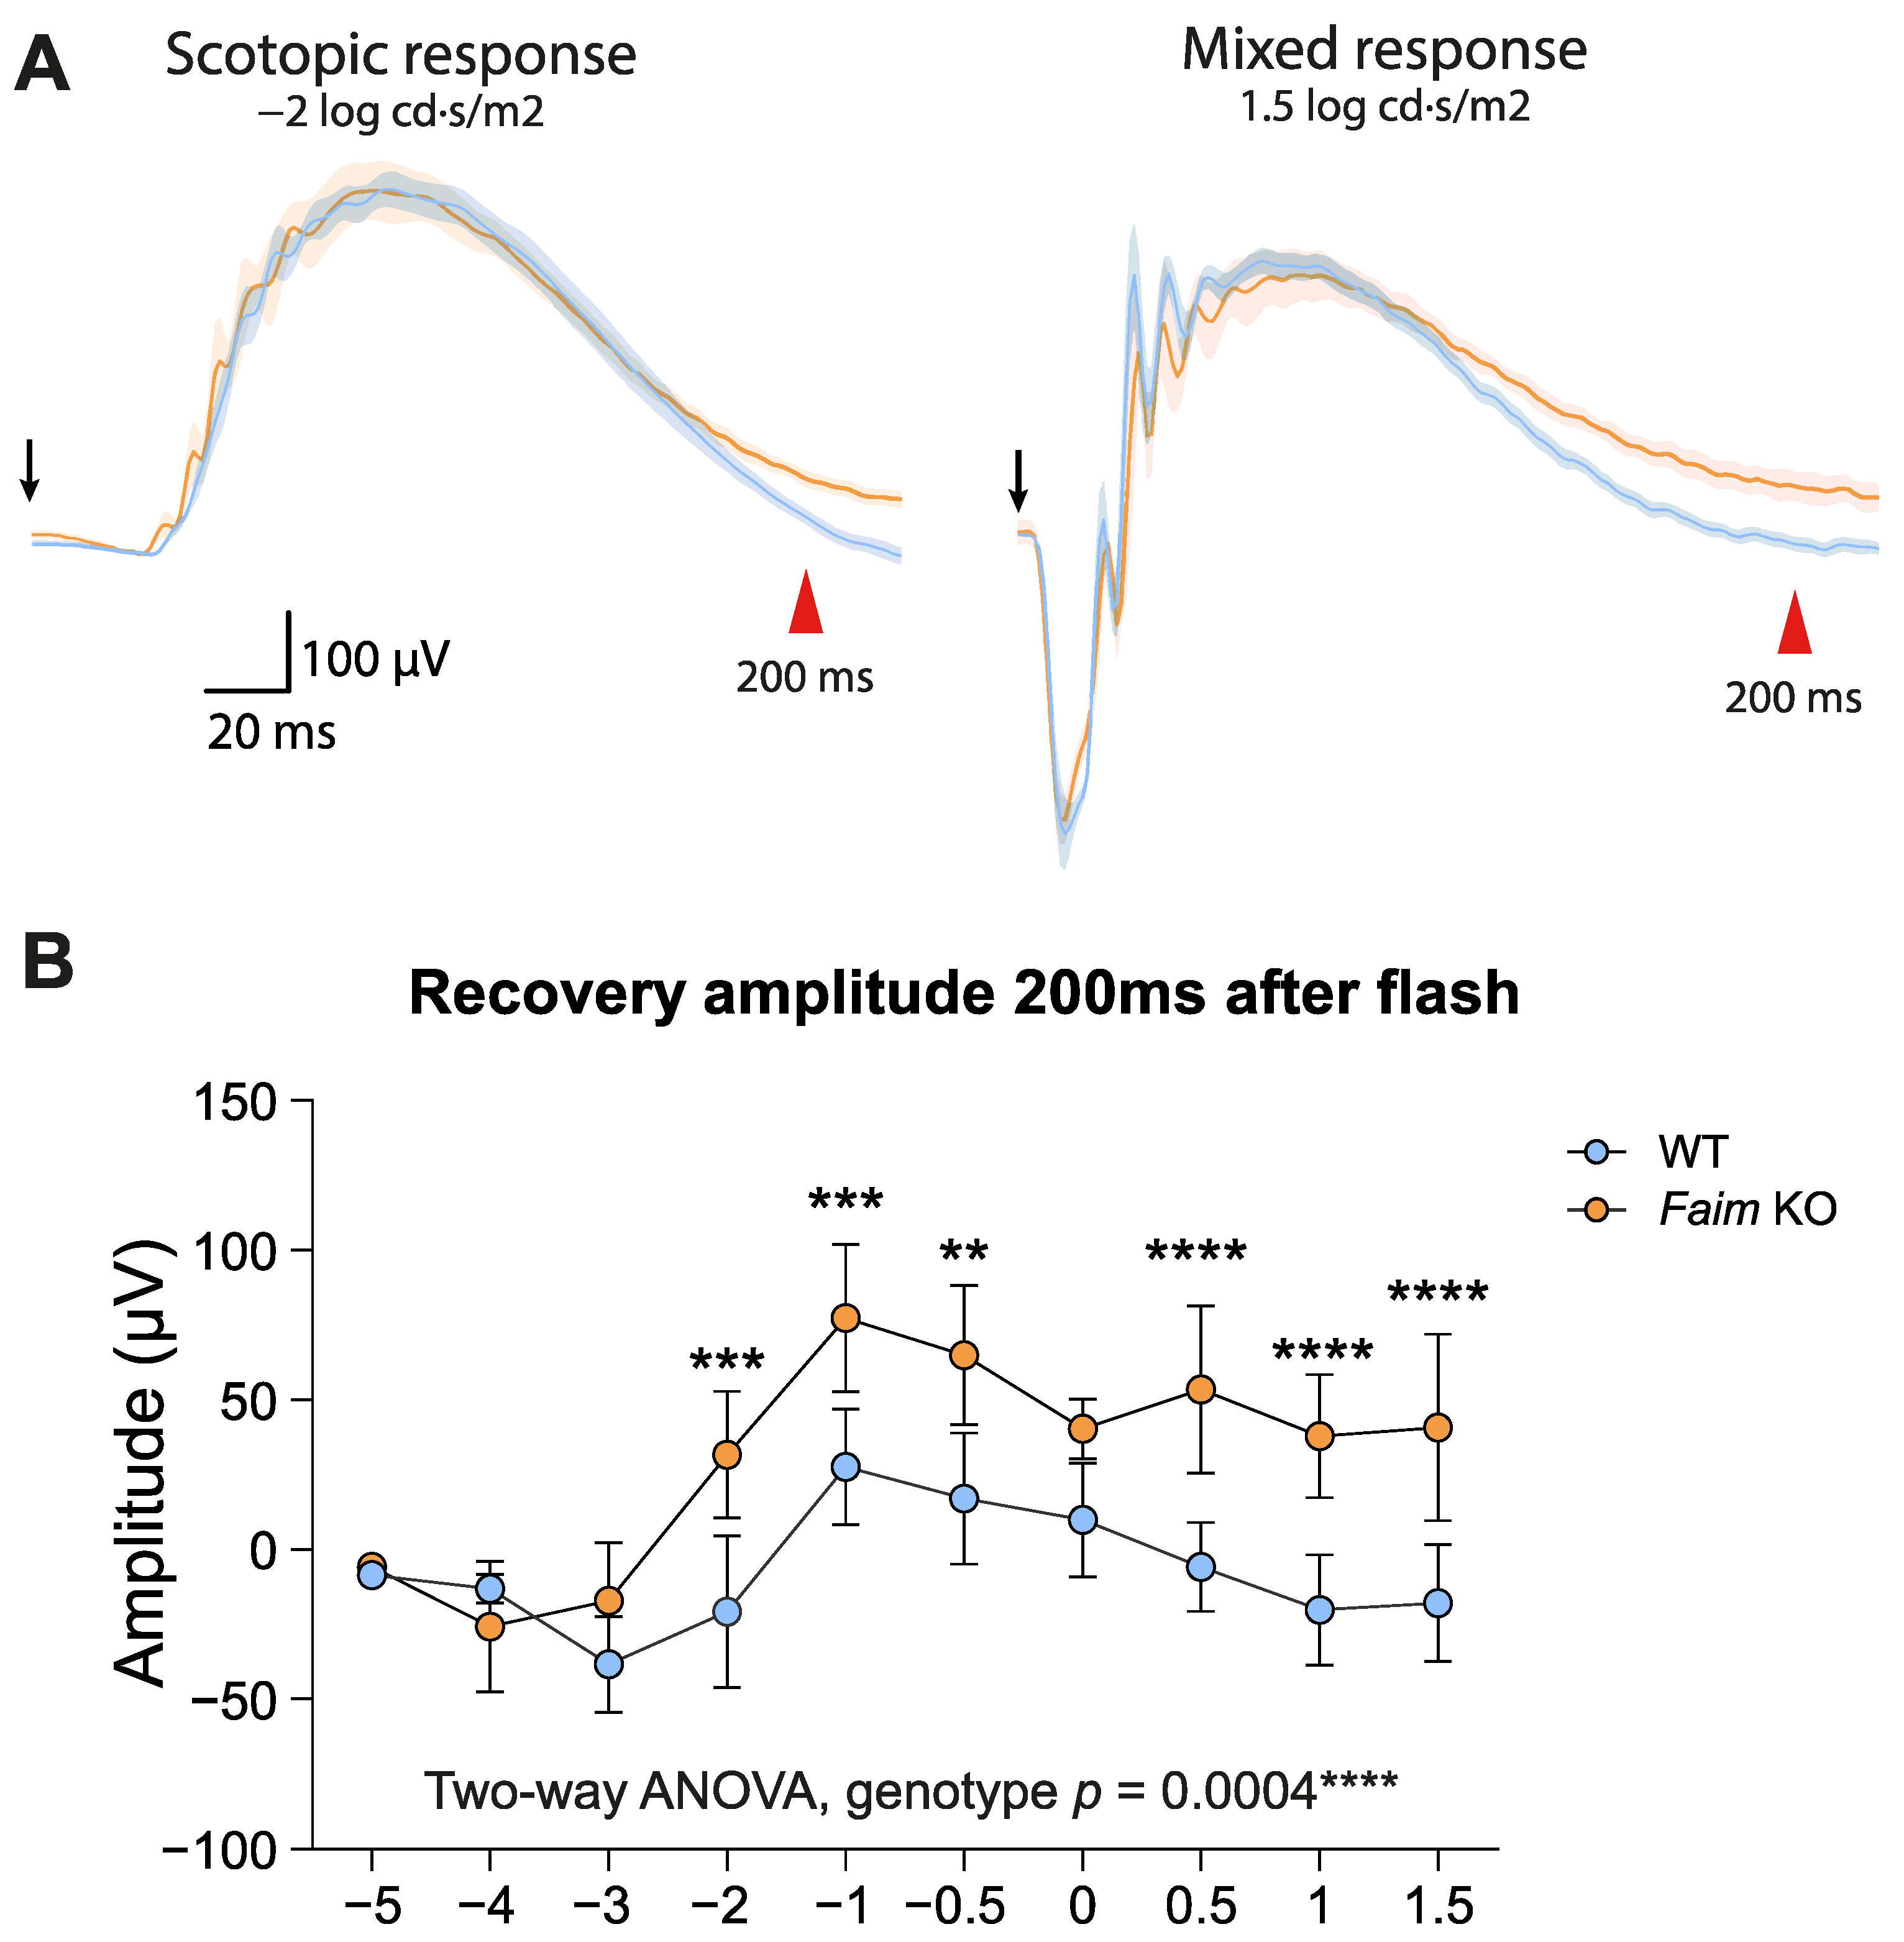
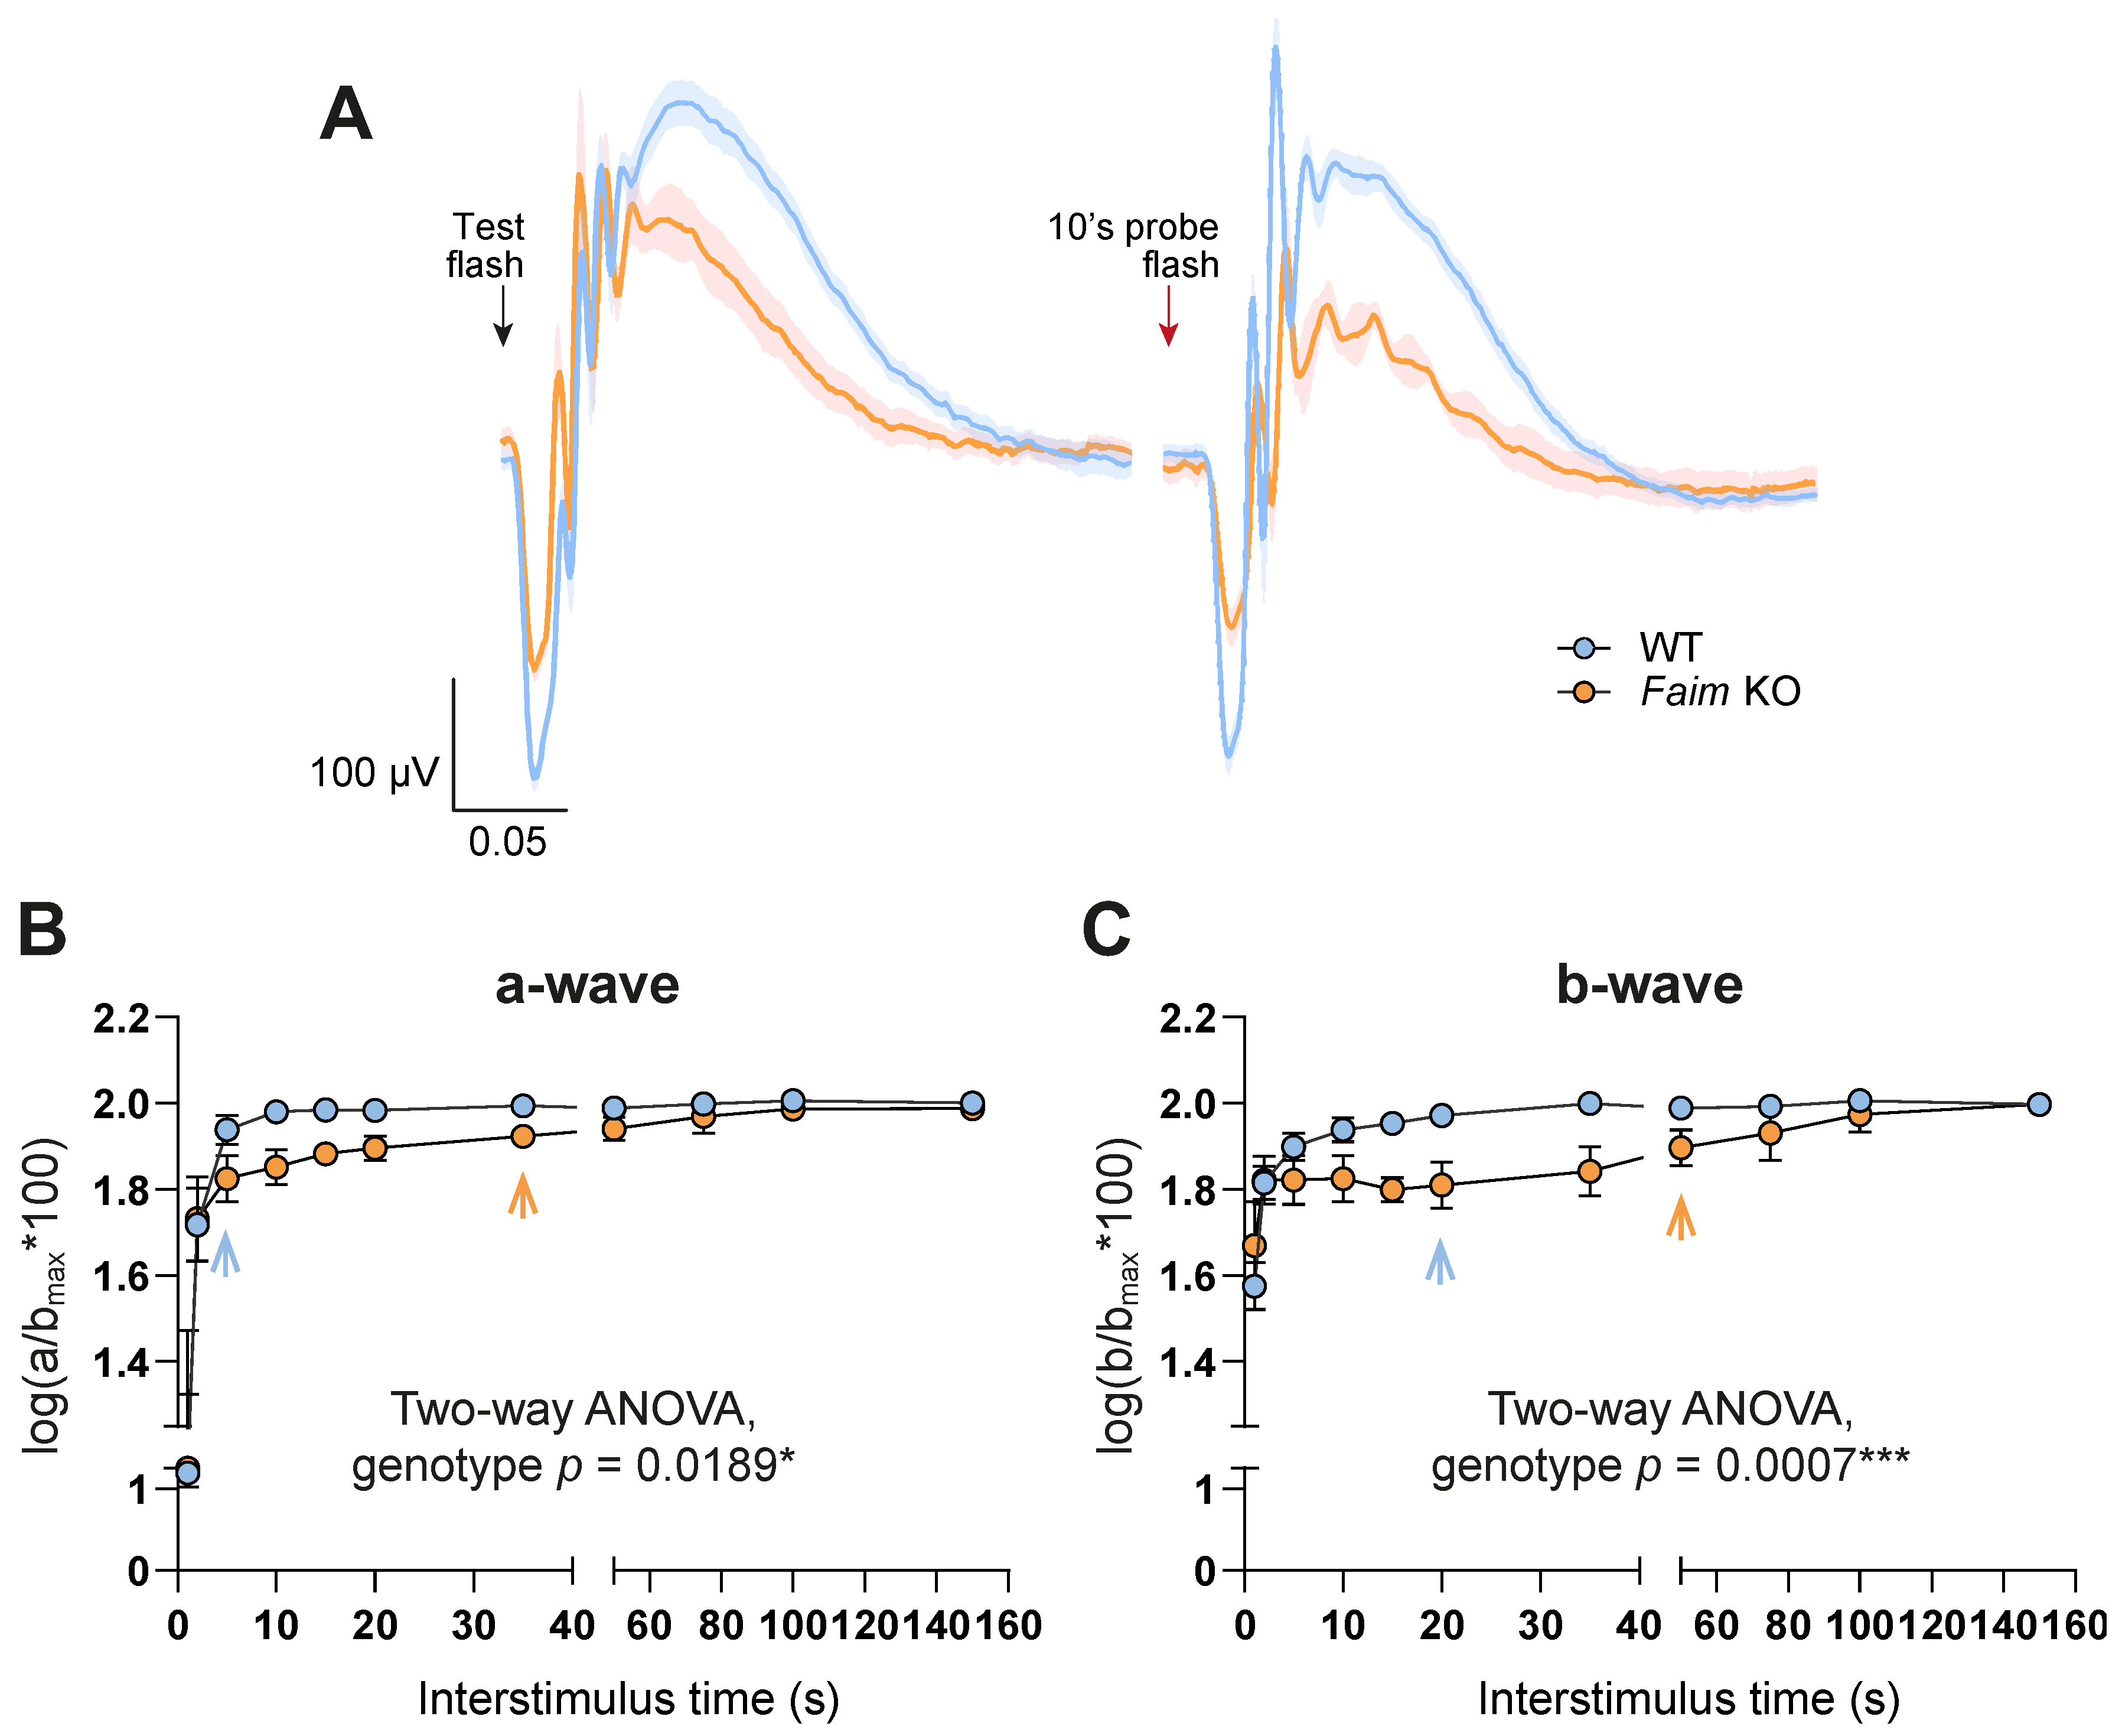
3.2. Faim Depletion Causes a Delayed Dark Adaptation
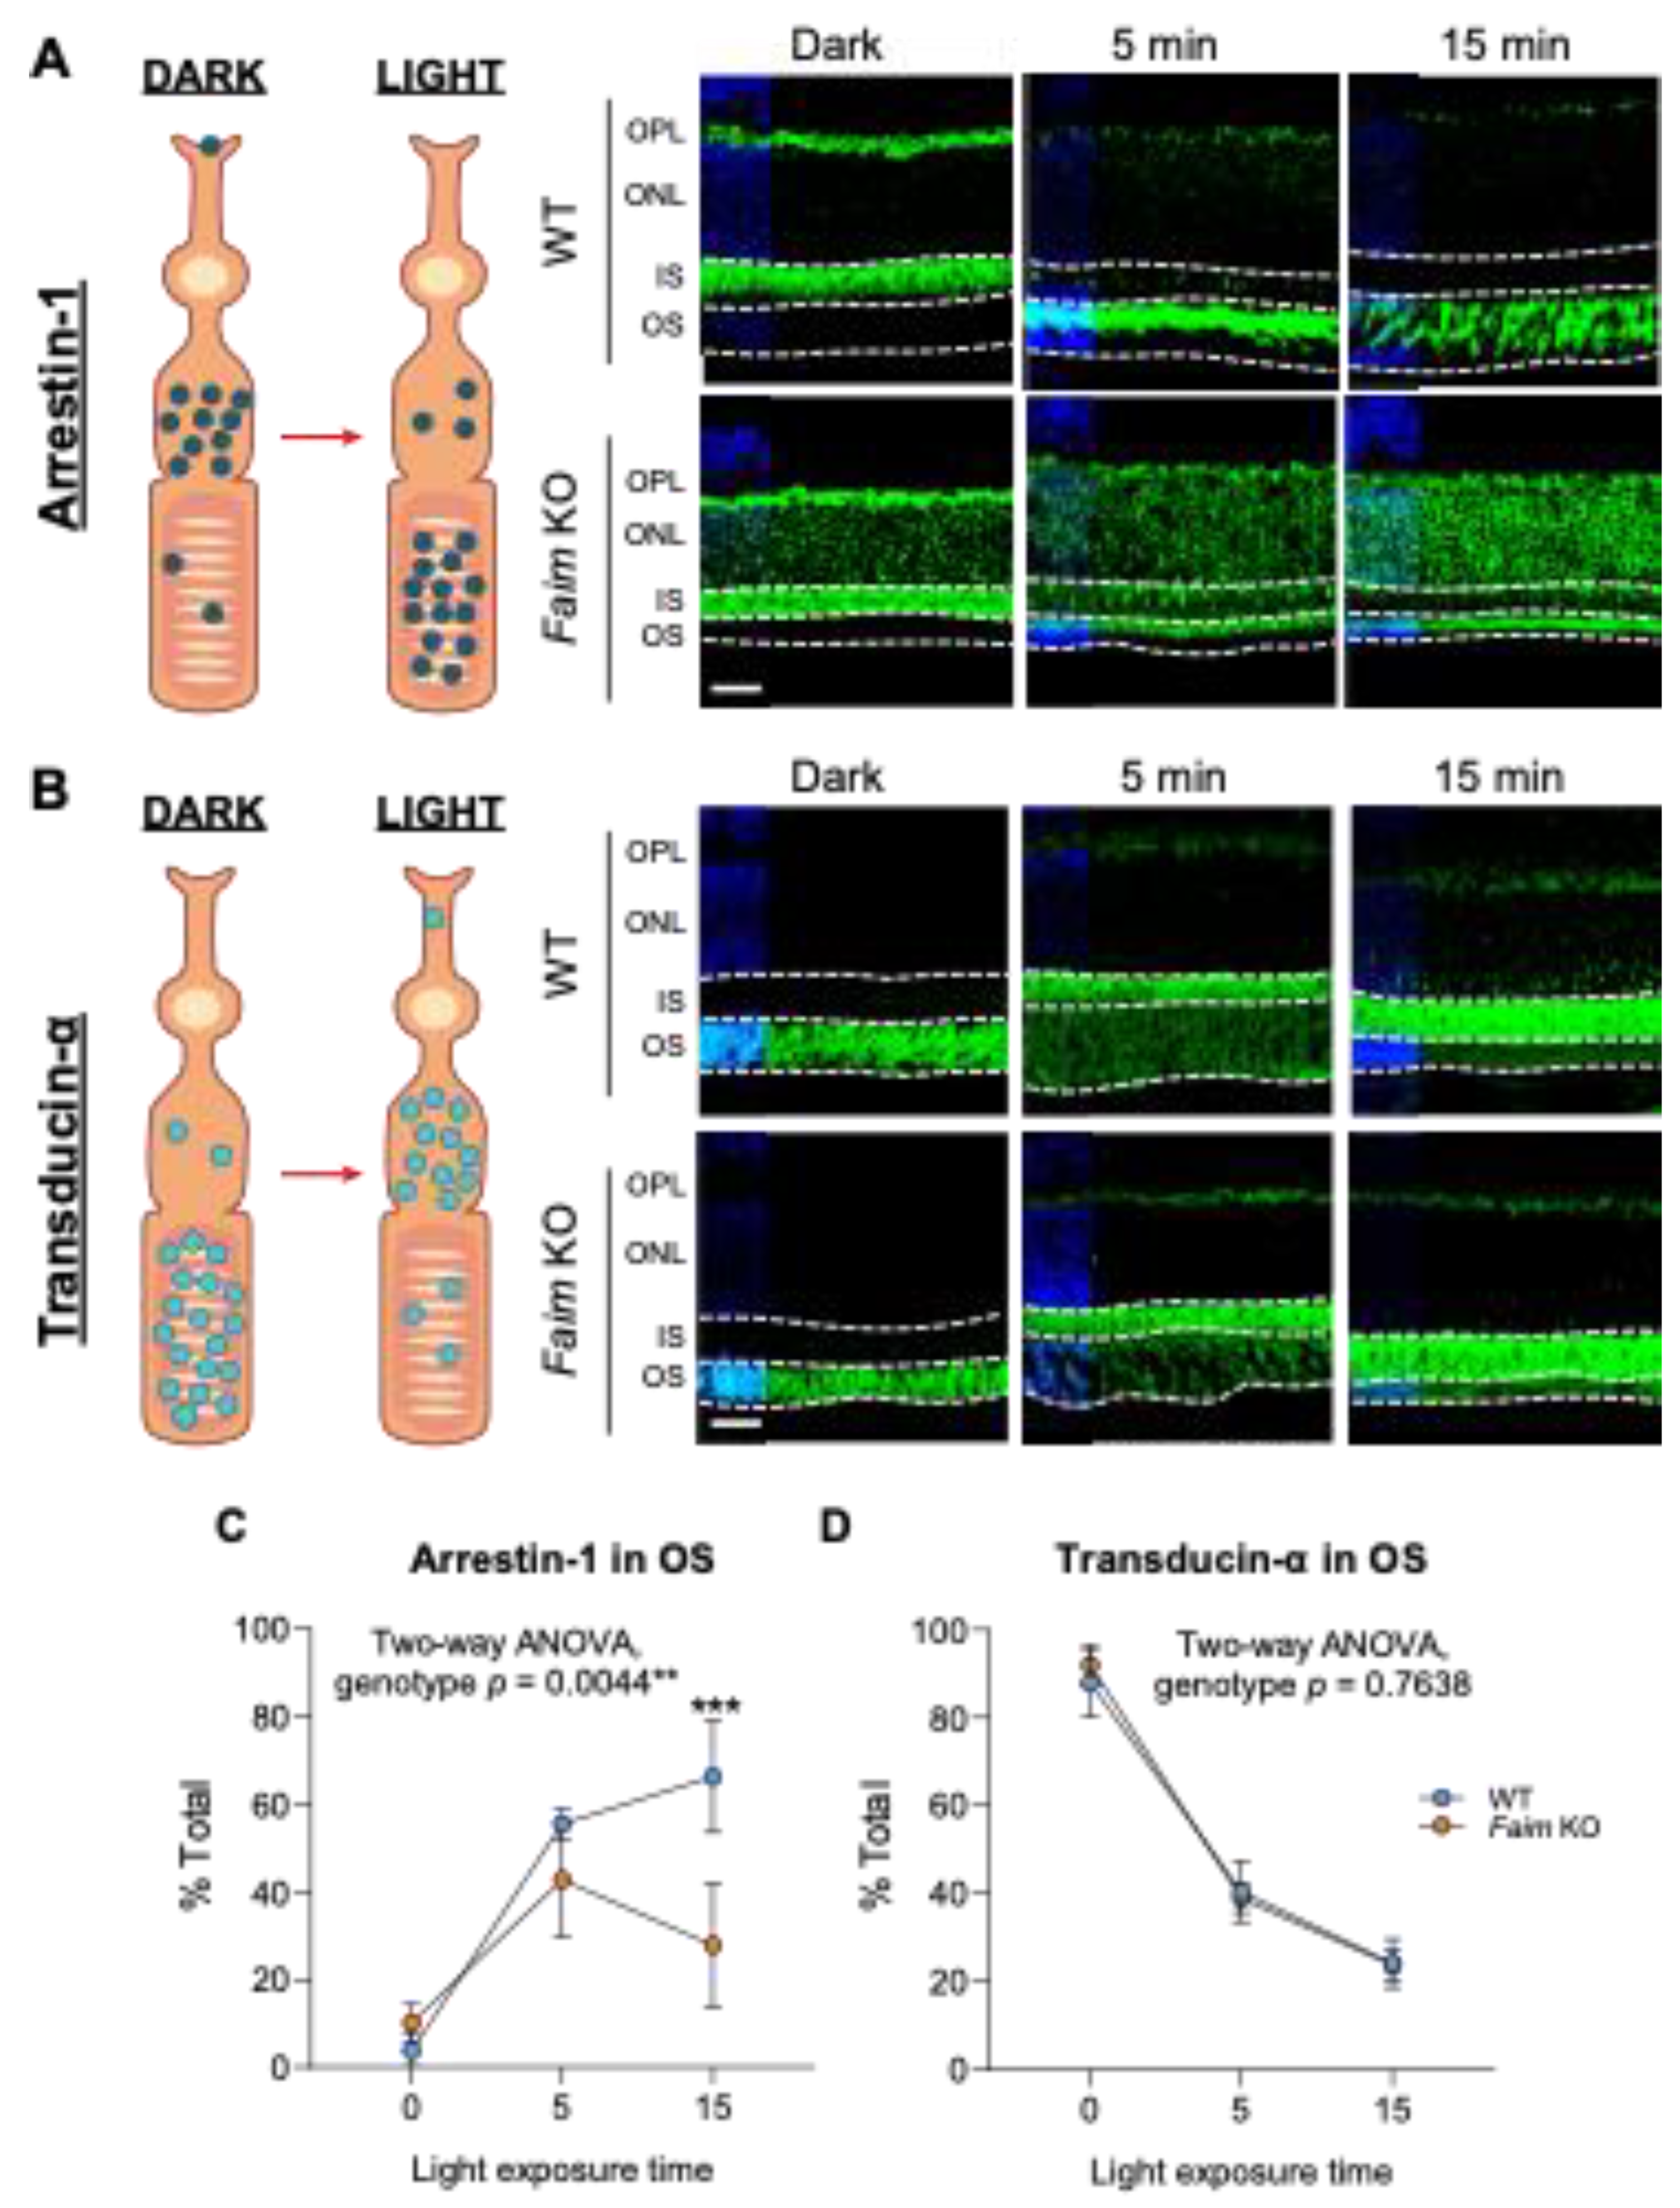
3.3. Light-Dependent Arrestin-1 Translocation Is Impaired in Faim KO Mice
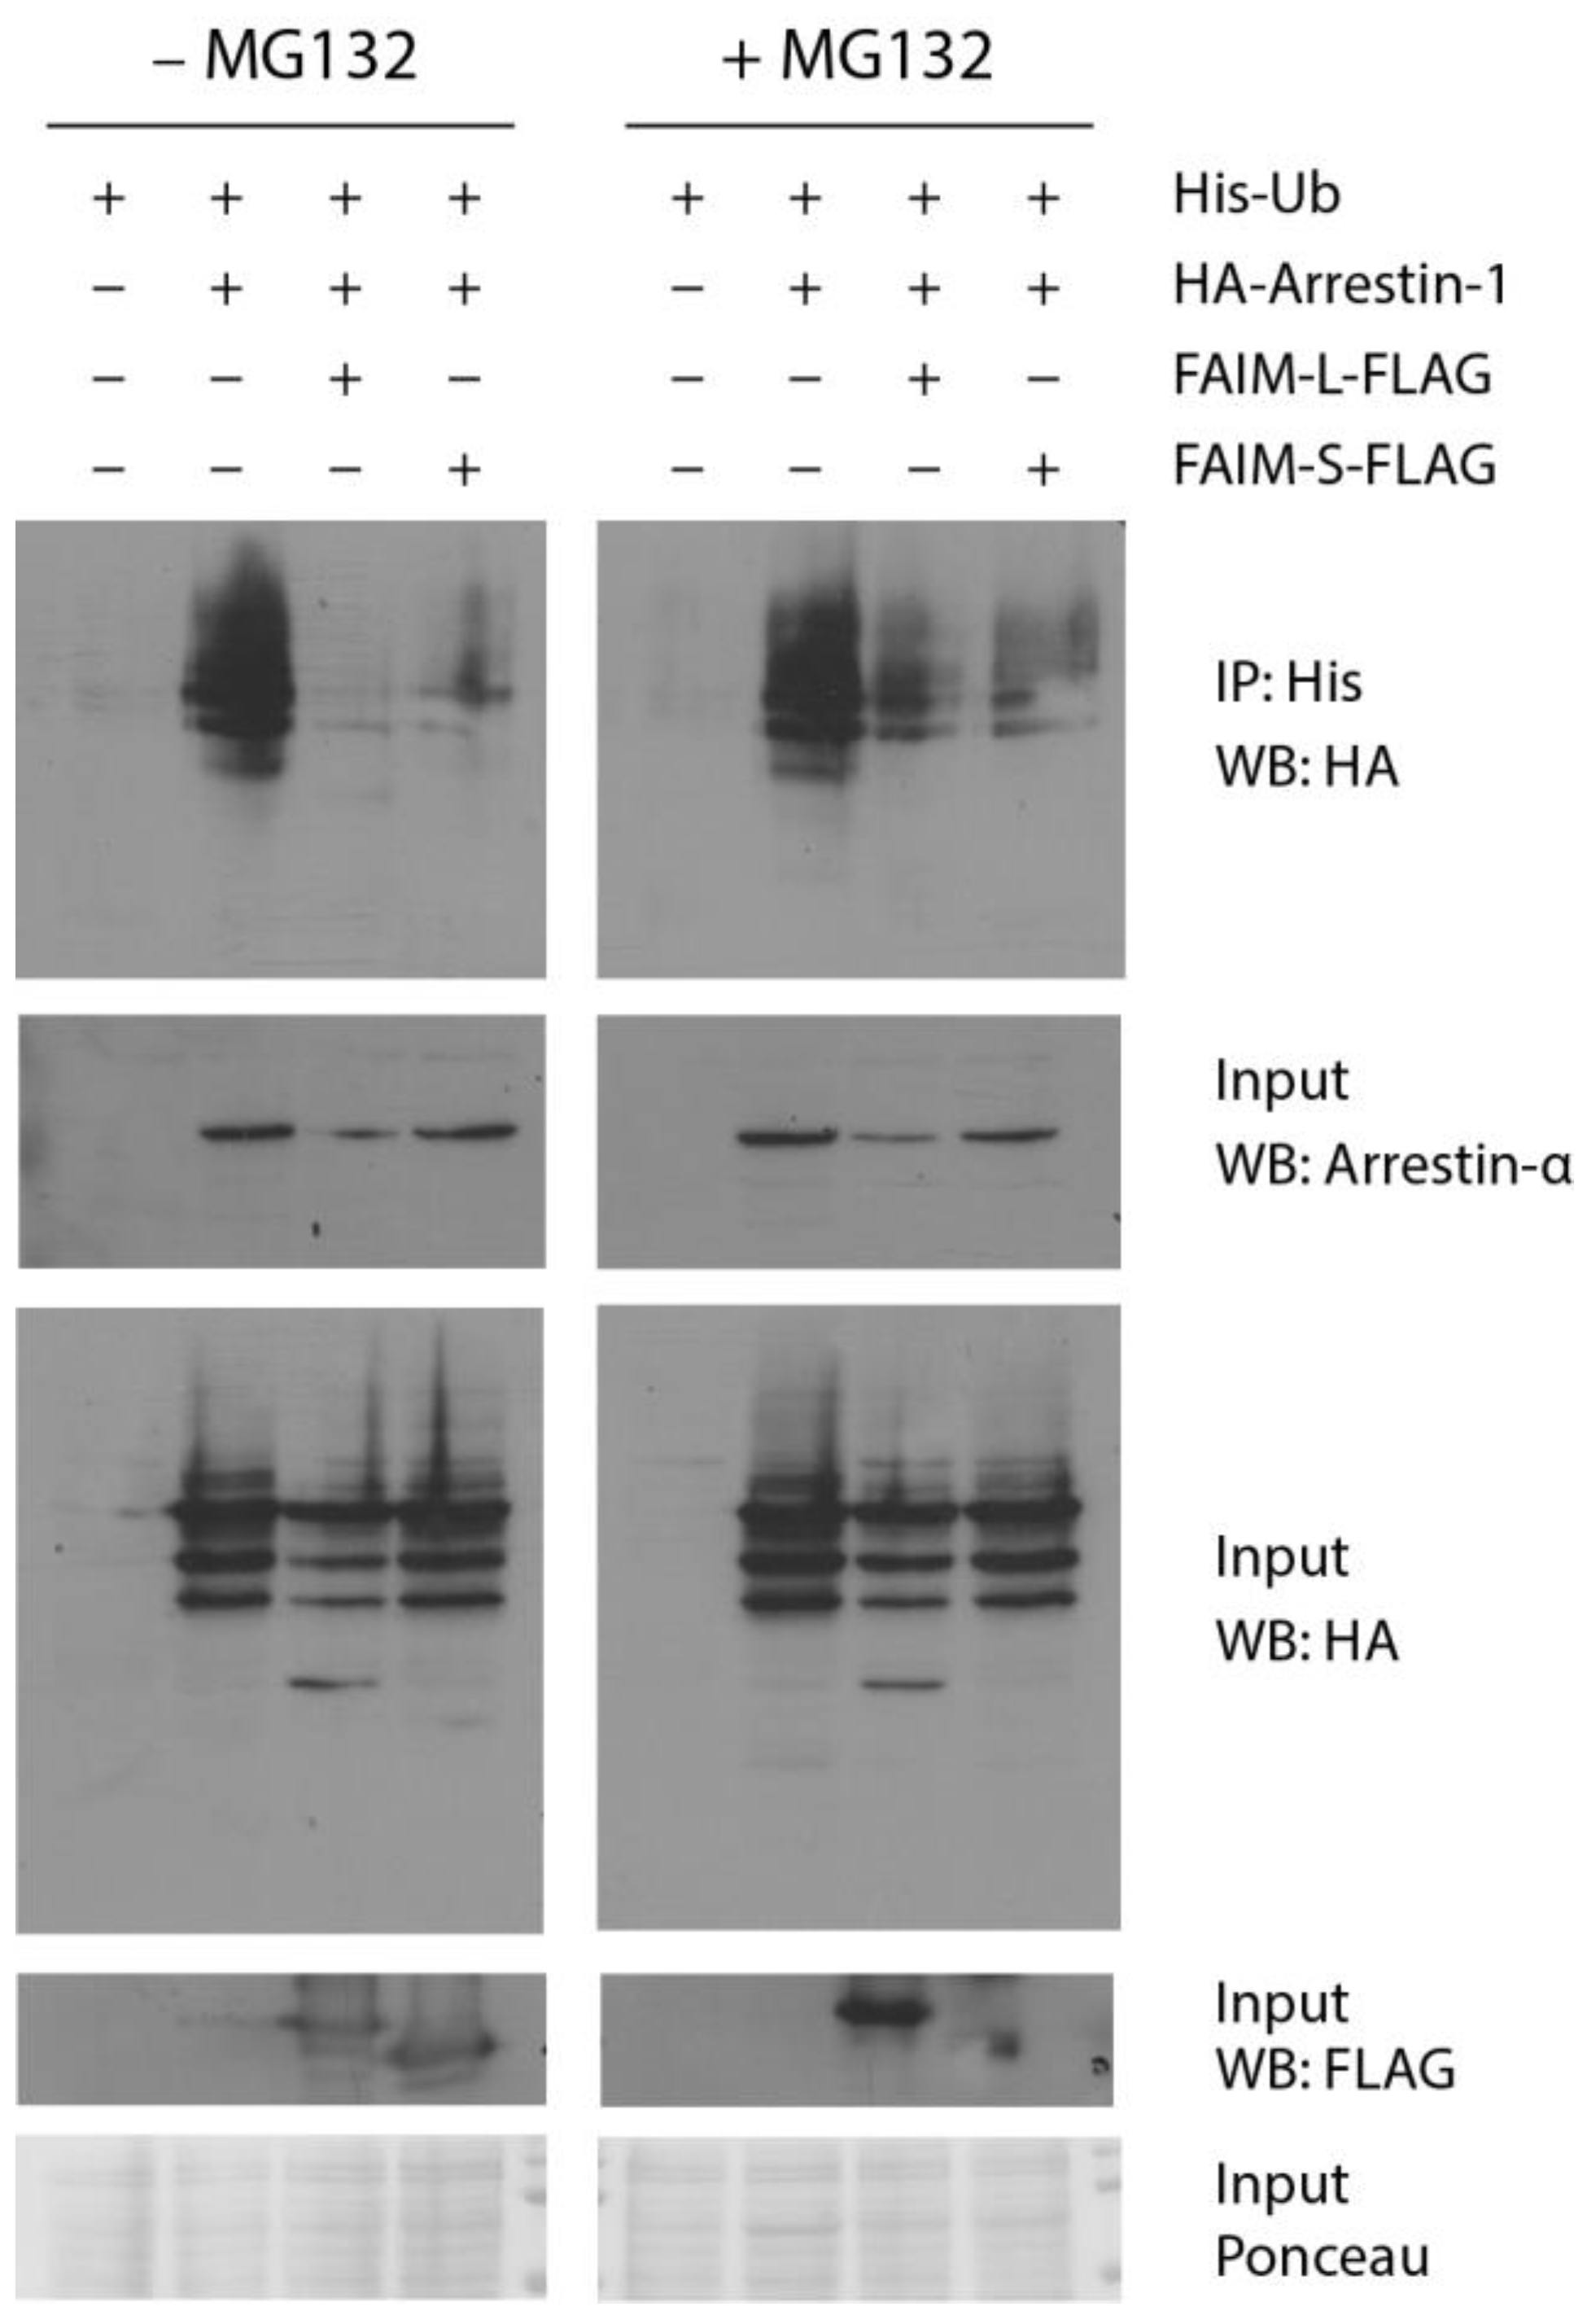
3.4. Both FAIM Isoforms Prevent Arrestin-1 Ubiquitination In Vitro
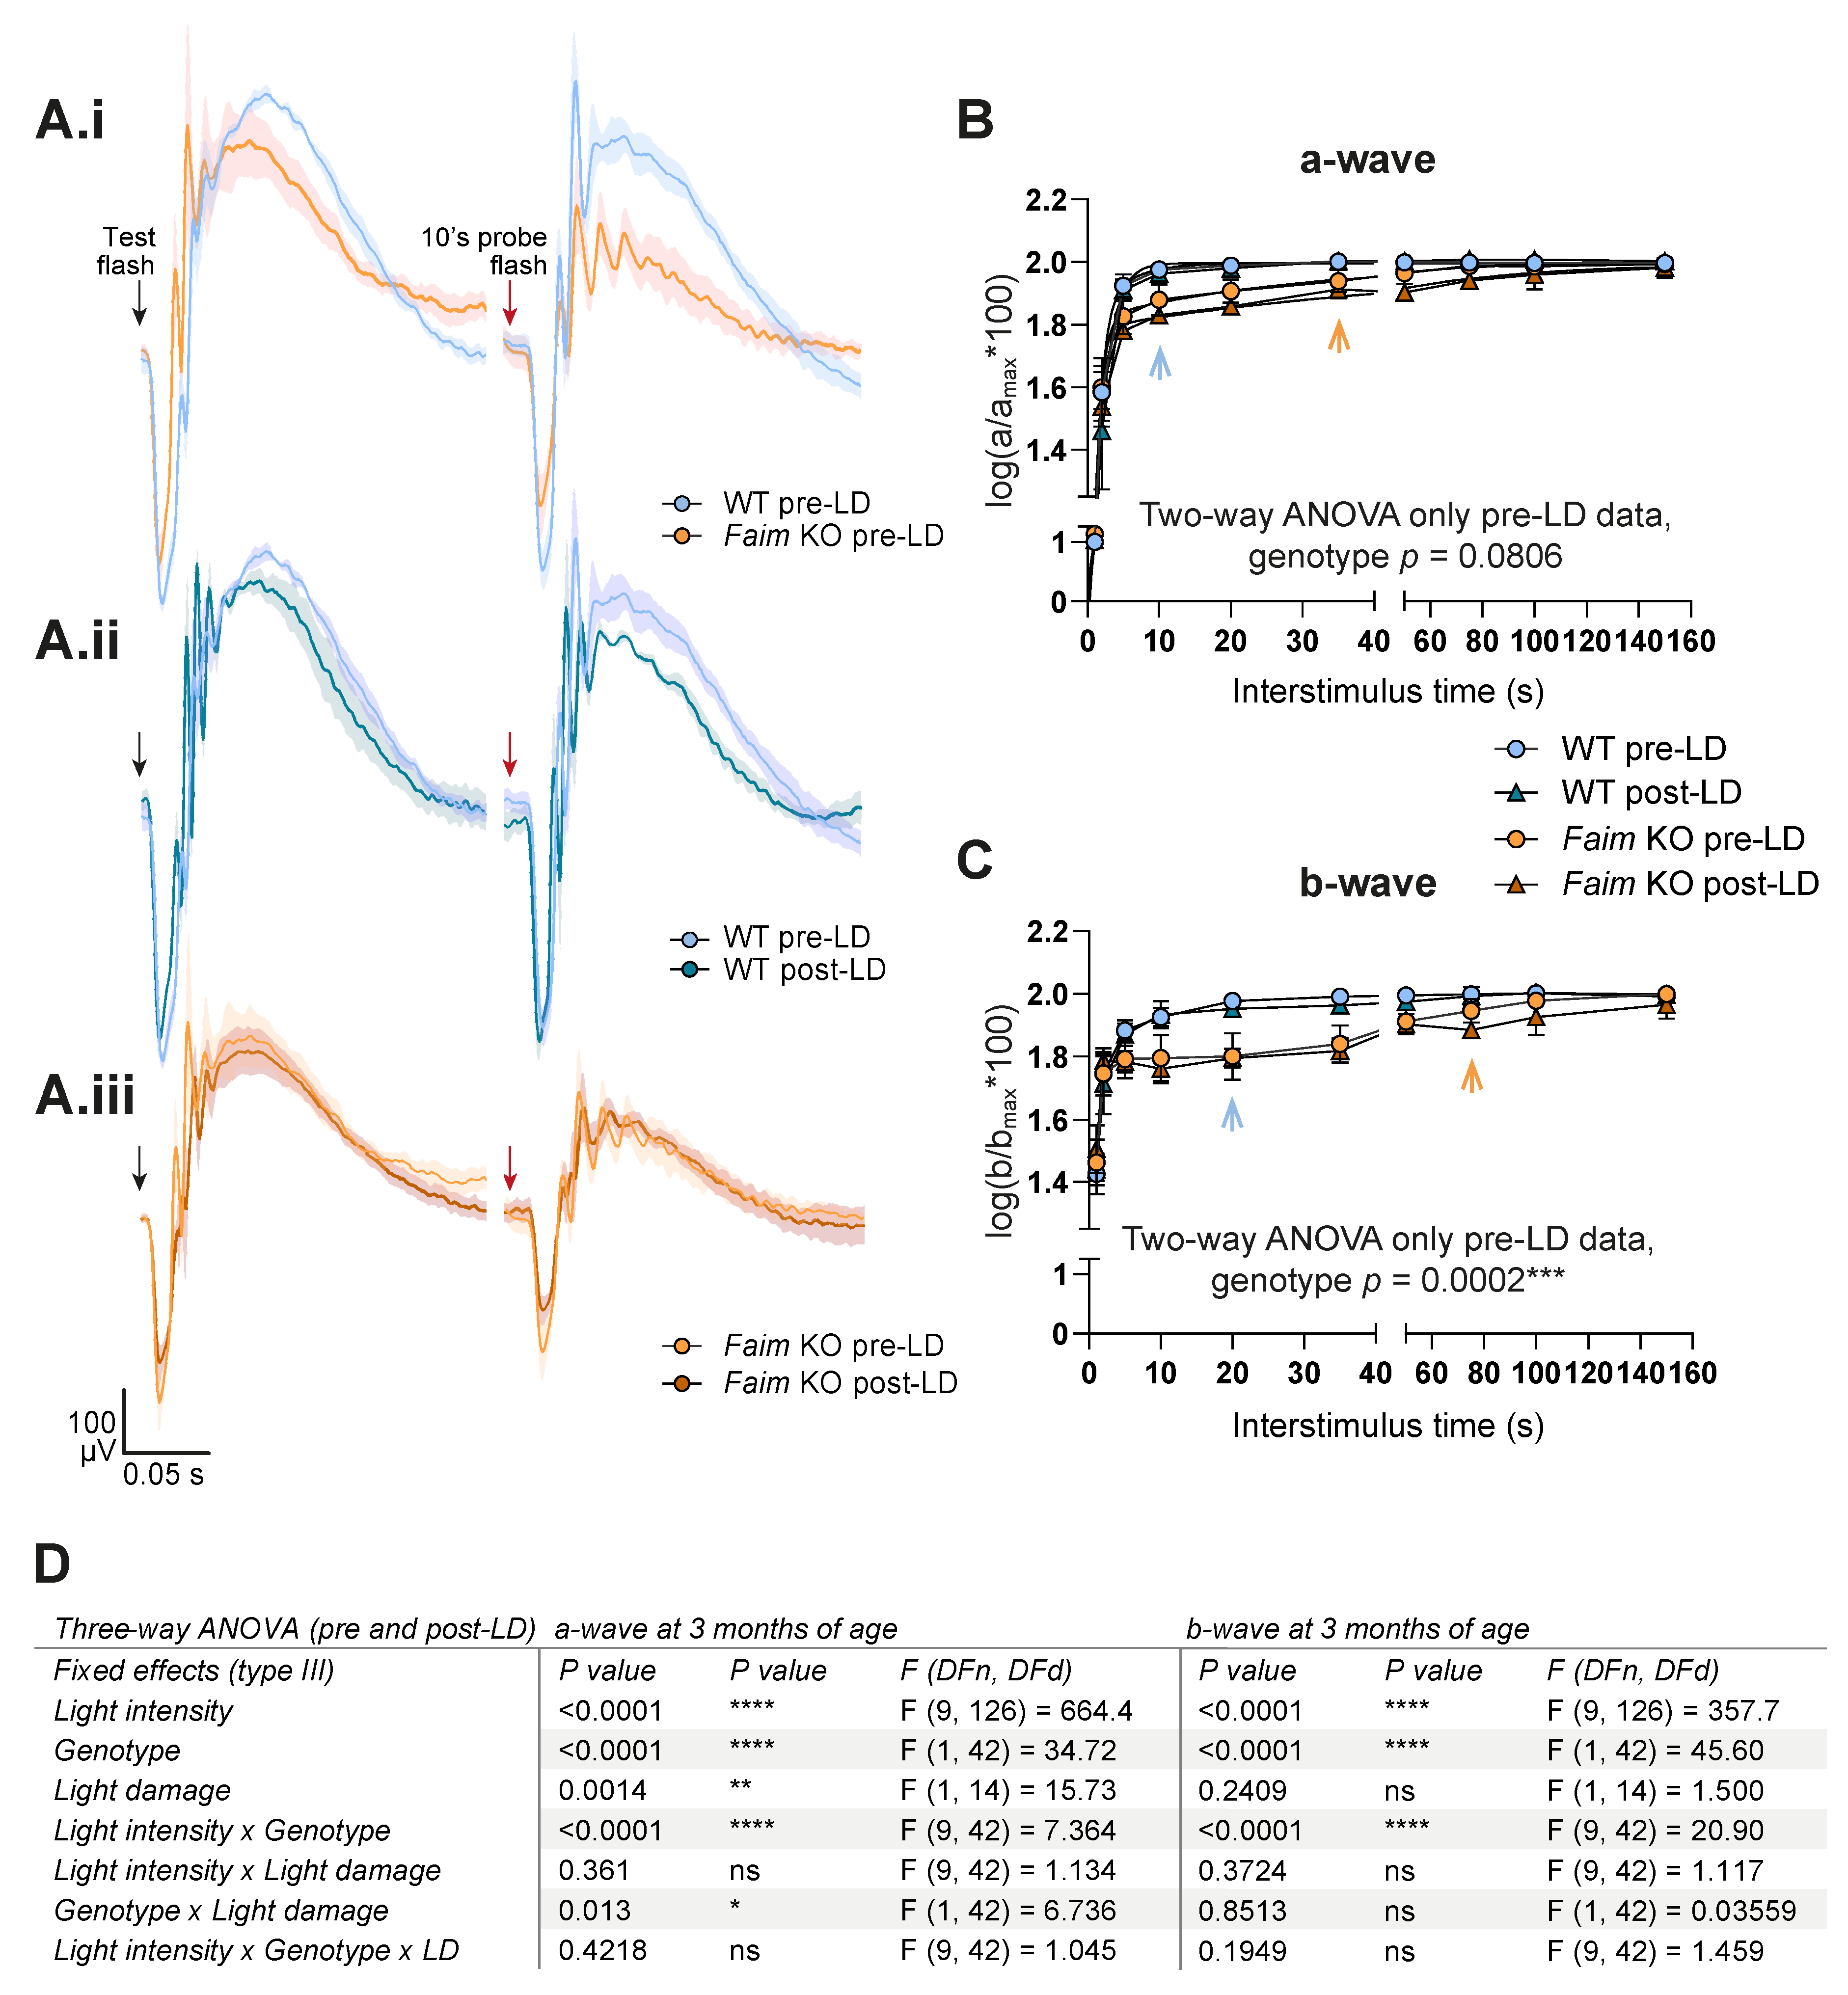
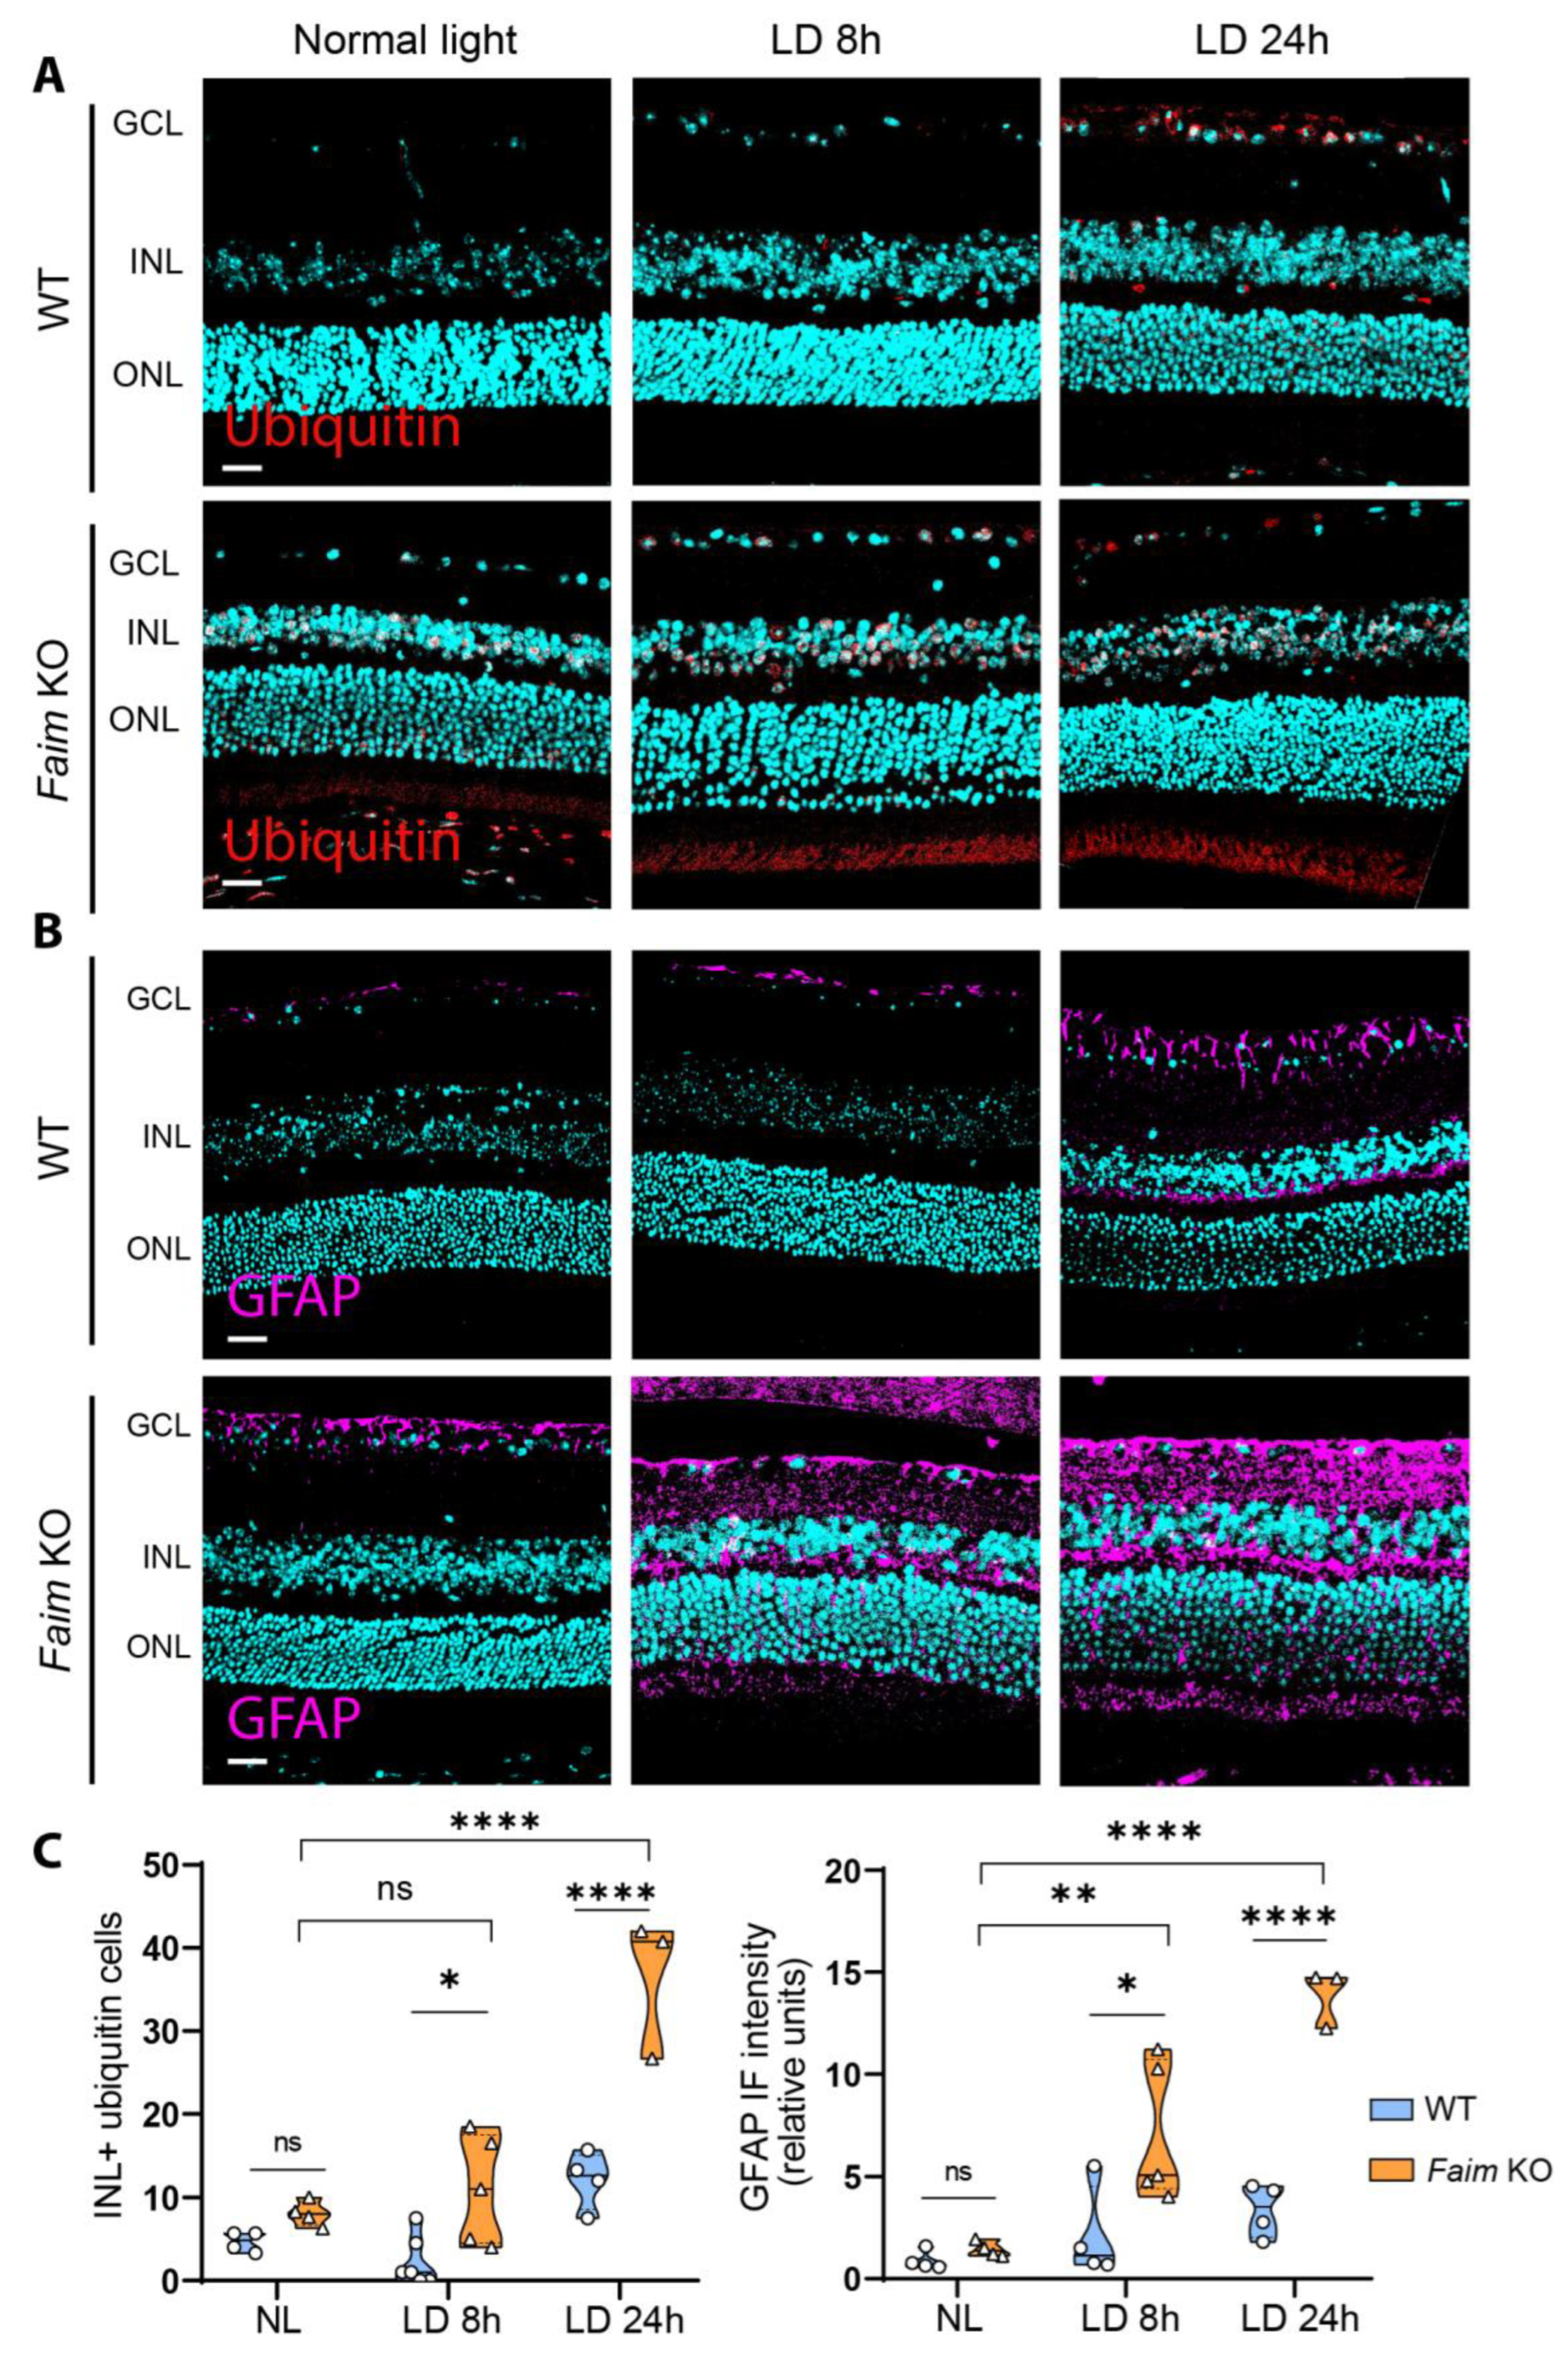
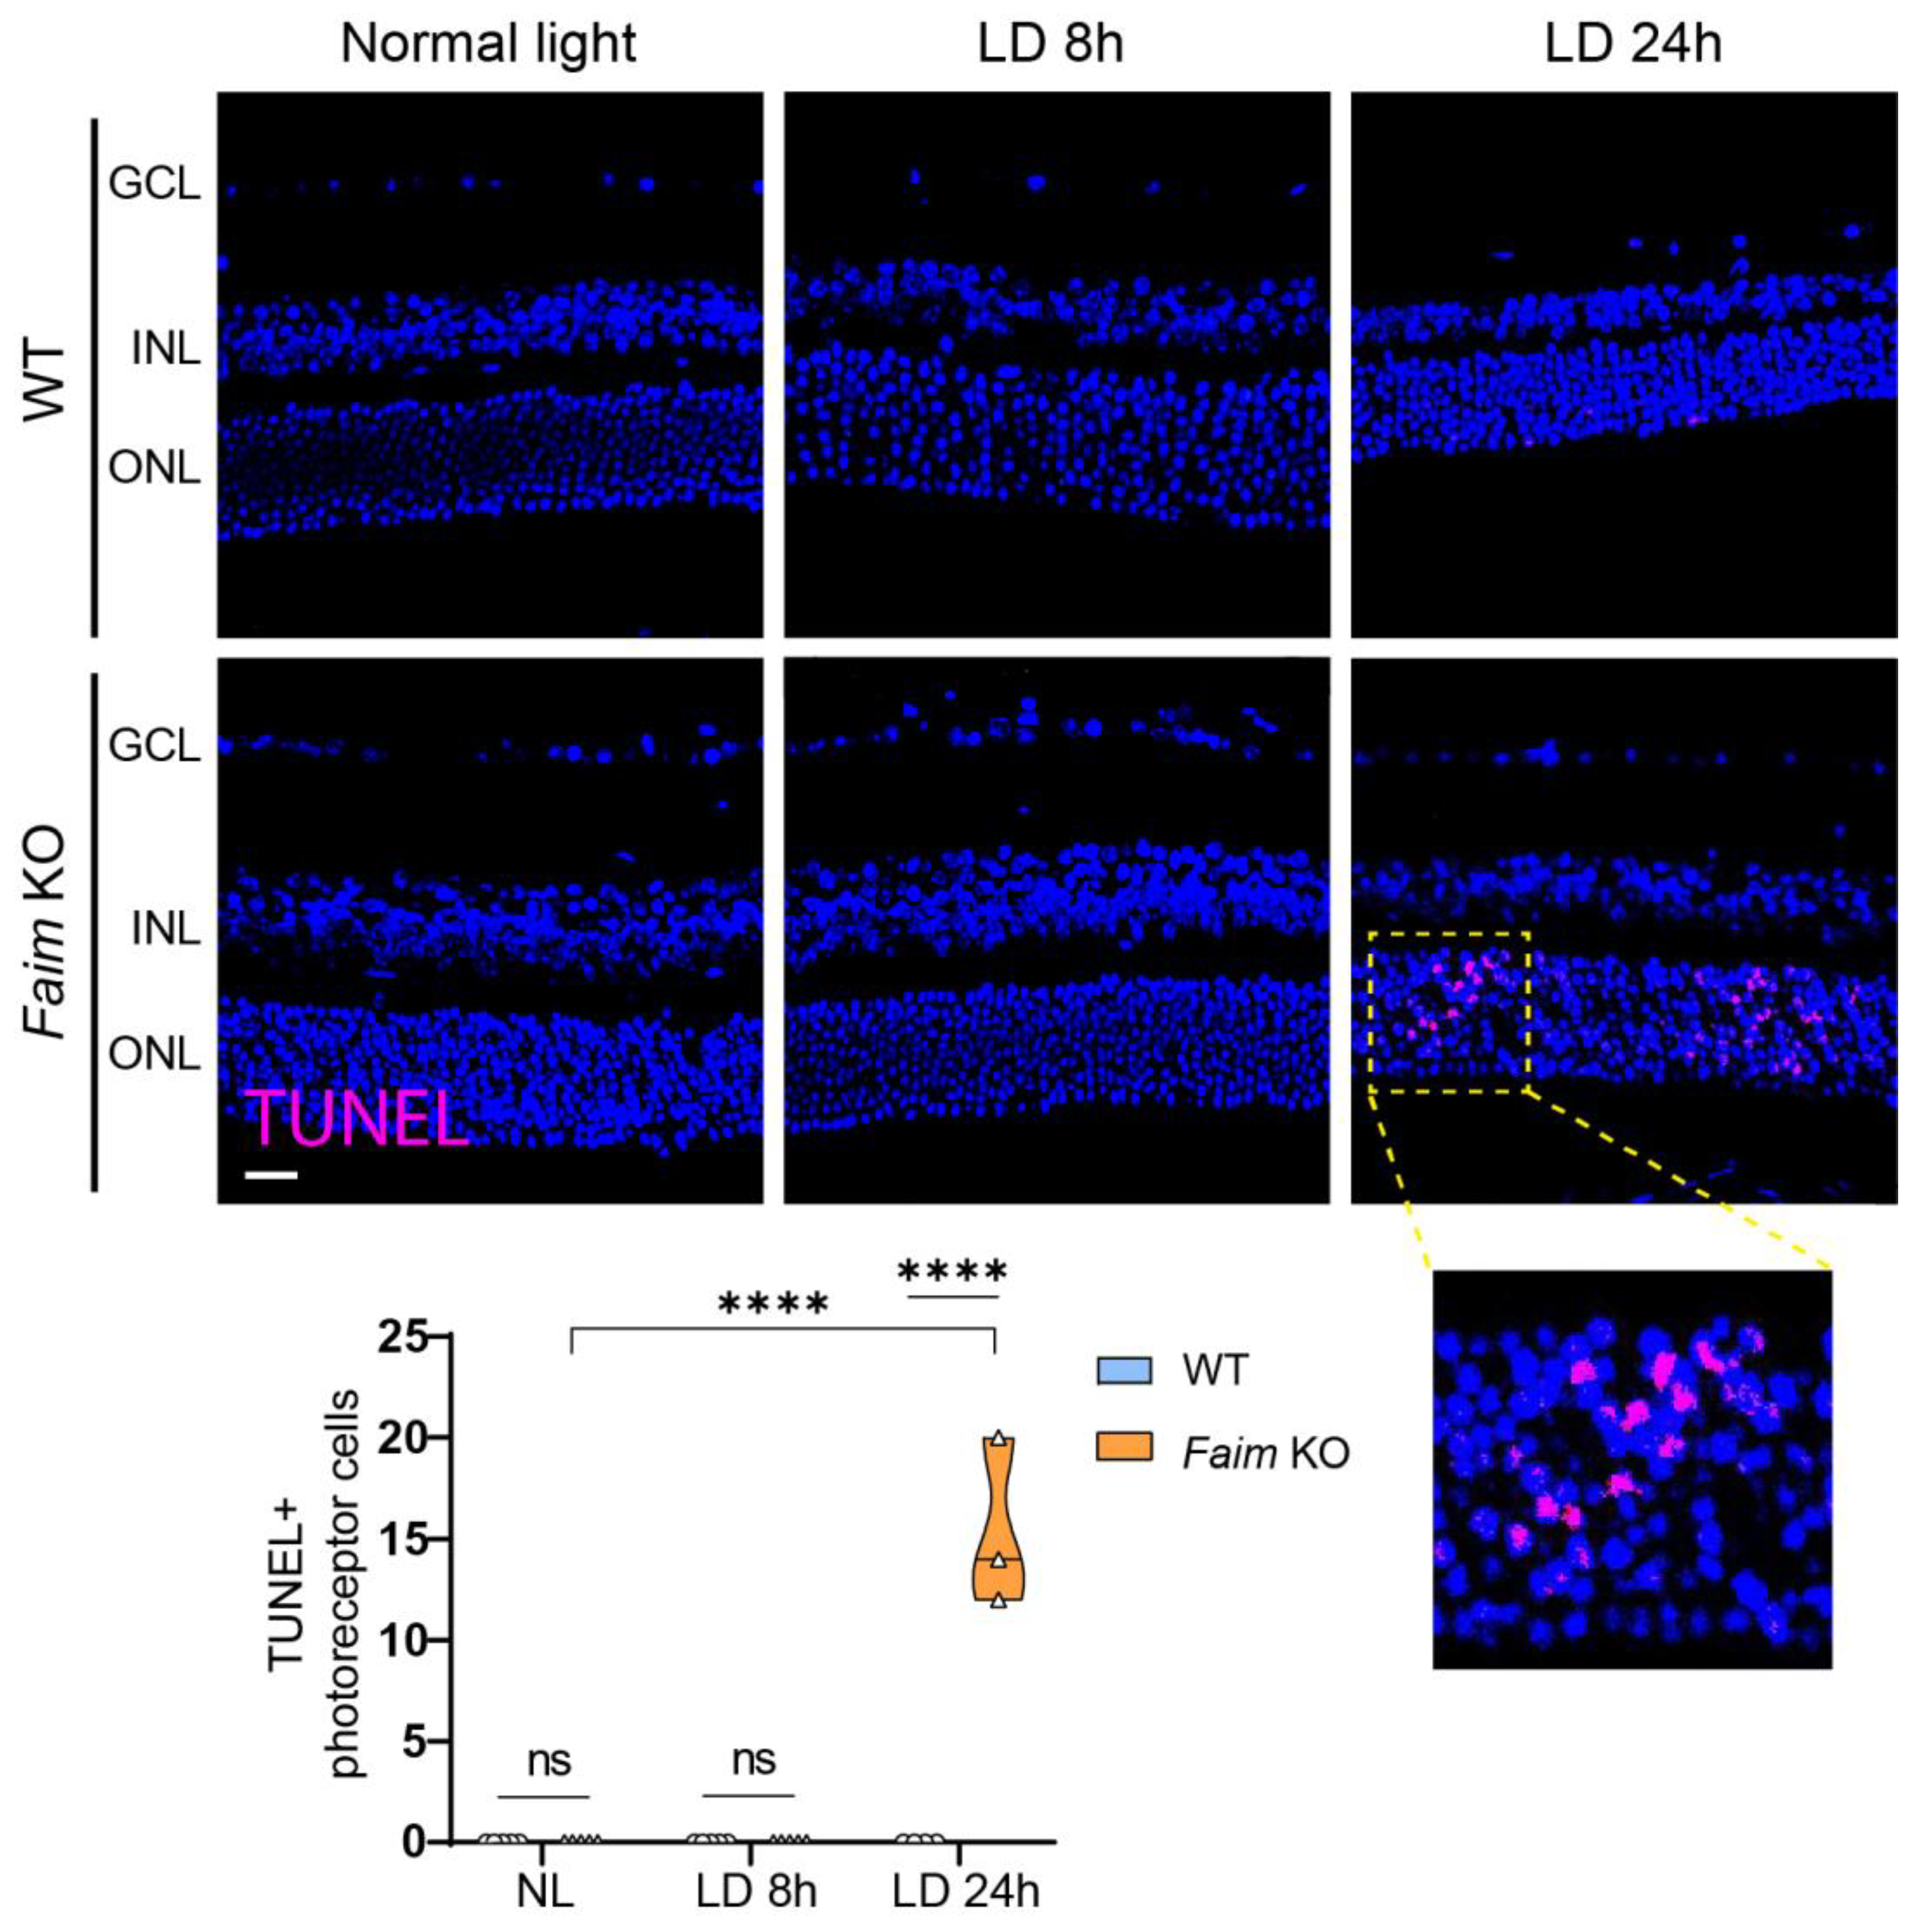
3.5. Photoreceptors in Faim KO Mice Are More Sensitive to LD
4. Discussion
5. Conclusions
Supplementary Materials
Author Contributions
Funding
Institutional Review Board Statement
Informed Consent Statement
Data Availability Statement
Acknowledgments
Conflicts of Interest
References
- London, A.; Benhar, I.; Schwartz, M. The retina as a window to the brain—From eye research to CNS disorders. Nat. Rev. Neurol. 2013, 9, 44–53. [Google Scholar] [CrossRef]
- De la Rosa, E.J.; Hernández-Sánchez, C. CNS targets for the treatment of retinal dystrophies: A Win-Win strategy. Chapter 4 in Therapies for retinal degeneration: Targetting common processes; de la Rosa, E.J., Cotter, T.G., Eds.; Royal Society of Chemistry: London, UK, 2019; Volume 2019, pp. 61–75. [Google Scholar] [CrossRef]
- Wang, G.-Q.Q.; Bai, Z.-X.X.; Shi, J.; Luo, S.; Chang, H.-F.F.; Sai, X.-Y.Y. Prevalence and risk factors for eye diseases, blindness, and low vision in Lhasa, Tibet. Int. J. Ophthalmol. 2013, 6, 237–241. [Google Scholar] [CrossRef] [PubMed]
- Bourne, R.R.A.; Steinmetz, J.D.; Flaxman, S.; Briant, P.S.; Taylor, H.R.; Resnikoff, S.; Casson, R.J.; Abdoli, A.; Abu-Gharbieh, E.; Afshin, A.; et al. Trends in prevalence of blindness and distance and near vision impairment over 30 years: An analysis for the Global Burden of Disease Study. Lancet Glob. Health 2021, 9, e130–e143. [Google Scholar] [CrossRef]
- Segura, M.F.; Sole, C.; Pascual, M.; Moubarak, R.S.; Jose Perez-Garcia, M.; Gozzelino, R.; Iglesias, V.; Badiola, N.; Bayascas, J.R.; Llecha, N.; et al. The Long Form of Fas Apoptotic Inhibitory Molecule Is Expressed Specifically in Neurons and Protects Them against Death Receptor-Triggered Apoptosis. J. Neurosci. 2007, 27, 11228–11241. [Google Scholar] [CrossRef] [PubMed]
- Sole, C.; Dolcet, X.; Segura, M.F.; Gutierrez, H.; Diaz-Meco, M.T.; Gozzelino, R.; Sanchis, D.; Bayascas, J.R.; Gallego, C.; Moscat, J.; et al. The death receptor antagonist FAIM promotes neurite outgrowth by a mechanism that depends on ERK and NF-κB signaling. J. Cell Biol. 2004, 167, 479–492. [Google Scholar] [CrossRef]
- Carriba, P.; Jimenez, S.; Navarro, V.; Moubarak, R.S. Amyloid-β reduces the expression of neuronal FAIM-L, thereby shifting the inflammatory response mediated by TNF α from neuronal protection to death. Cell Death Dis. 2015, 6, e1639-13. [Google Scholar] [CrossRef]
- Zhong, X.; Schneider, T.J.; Cabral, D.S.; Donohoe, T.J.; Rothstein, T.L. An alternatively spliced long form of Fas apoptosis inhibitory molecule (FAIM) with tissue-specific expression in the brain. Mol. Immunol. 2001, 38, 65–72. [Google Scholar] [CrossRef] [PubMed]
- Kaku, H.; Ludlow, A.V.; Gutknecht, M.F.; Rothstein, T.L. Fas Apoptosis Inhibitory Molecule Blocks and Dissolves Pathological Amyloid-β Species. Front. Mol. Neurosci. 2021, 14, 750578. [Google Scholar] [CrossRef]
- Moubarak, R.S.; Planells-Ferrer, L.; Urresti, J.; Reix, S.; Segura, M.F.; Carriba, P.; Marques-Fernandez, F.; Sole, C.; Llecha-Cano, N.; Lopez-Soriano, J.; et al. FAIM-L Is an IAP-Binding Protein That Inhibits XIAP Ubiquitinylation and Protects from Fas-Induced Apoptosis. J. Neurosci. 2013, 33, 19262–19275. [Google Scholar] [CrossRef] [Green Version]
- Sirés, A.; Turch-Anguera, M.; Bogdanov, P.; Sampedro, J.; Ramos, H.; Ruíz Lasa, A.; Huo, J.; Xu, S.; Lam, K.-P.; López-Soriano, J.; et al. Faim knockout leads to gliosis and late-onset neurodegeneration of photoreceptors. J. Neurosci. Res. 2021, 99, 3103–3120. [Google Scholar] [CrossRef]
- Kaku, H.; Rothstein, T.L. FAIM Is a Non-redundant Defender of Cellular Viability in the Face of Heat and Oxidative Stress and Interferes With Accumulation of Stress-Induced Protein Aggregates. Front. Mol. Biosci. 2020, 7, 32. [Google Scholar] [CrossRef] [PubMed]
- Flick, K.; Kaiser, P. Protein Degradation and the Stress Response. Semin. Cell Dev. Biol. 2012, 23, 515–522. [Google Scholar] [CrossRef] [PubMed]
- Schwartz, A.L.; Ciechanover, A. Targeting proteins for destruction by the ubiquitin system: Implications for human pathobiology. Annu. Rev. Pharmacol. Toxicol. 2009, 49, 73–96. [Google Scholar] [CrossRef]
- Mukhopadhyay, D.; Riezman, H. Proteasome-Independent Functions of Ubiquitin in Endocytosis and Signaling. Science 2007, 315, 201–205. [Google Scholar] [CrossRef] [PubMed]
- Campello, L.; Esteve-Rudd, J.; Cuenca, N.; Martín-Nieto, J. The ubiquitin-proteasome system in retinal health and disease. Mol. Neurobiol. 2013, 47, 790–810. [Google Scholar] [CrossRef]
- Obin, M.S.; Jahngen-Hodge, J.; Nowell, T.; Taylor, A. Ubiquitinylation and Ubiquitin-dependent Proteolysis in Vertebrate Photoreceptors (Rod Outer Segments): Evidence for ubiquitinylation of gt and rhodopsin. J. Biol. Chem. 1996, 271, 14473–14484. [Google Scholar] [CrossRef]
- Shang, F.; Taylor, A. Function of the ubiquitin proteolytic pathway in the eye. Exp. Eye Res. 2004, 78, 1–14. [Google Scholar] [CrossRef]
- Obin, M.; Nowell, T.; Taylor, A. The Photoreceptor G-Protein Transducin (Gt) Is a Substrate for Ubiquitin-Dependent Proteolysis. Biochem. Biophys. Res. Commun. 1994, 200, 1169–1176. [Google Scholar] [CrossRef]
- Majumder, A.; Pahlberg, J.; Boyd, K.K.; Kerov, V.; Kolandaivelu, S.; Ramamurthy, V.; Sampath, A.P.; Artemyev, N.O. Transducin translocation contributes to rod survival and enhances synaptic transmission from rods to rod bipolar cells. Proc. Natl. Acad. Sci. USA 2013, 110, 12468–12473. [Google Scholar] [CrossRef] [PubMed] [Green Version]
- Chaya, T.; Tsutsumi, R.; Varner, L.R.; Maeda, Y.; Yoshida, S.; Furukawa, T. Cul3-Klhl18 ubiquitin ligase modulates rod transducin translocation during light-dark adaptation. EMBO J. 2019, 38, e101409. [Google Scholar] [CrossRef]
- Huo, J.; Xu, S.; Guo, K.; Zeng, Q.; Lam, K. Genetic deletion of faim reveals its role in modulating c-FLIP expression during CD95-mediated apoptosis of lymphocytes and hepatocytes. Cell Death Differ. 2009, 16, 1062–1070. [Google Scholar] [CrossRef] [PubMed]
- Sánchez-Cruz, A.; Hernández-Pinto, A.; Lillo, C.; Isiegas, C.; Marchena, M.; Lizasoain, I.; Bosch, F.; de la Villa, P.; Hernández-Sánchez, C.; de la Rosa, E.J. Insulin receptor activation by proinsulin preserves synapses and vision in retinitis pigmentosa. Cell Death Dis. 2022, 13, 383. [Google Scholar] [CrossRef] [PubMed]
- Milla-Navarro, S.; Pazo-González, M.; Germain, F.; de la Villa, P. Phenotype Characterization of a Mice Genetic Model of Absolute Blindness. Int. J. Mol. Sci. 2022, 23, 8152. [Google Scholar] [CrossRef]
- Robson, A.G.; Frishman, L.J.; Grigg, J.; Hamilton, R.; Jeffrey, B.G.; Kondo, M.; Li, S.; McCulloch, D.L. ISCEV Standard for full-field clinical electroretinography (2022 update). Doc. Ophthalmol. 2022, 144, 165–177. [Google Scholar] [CrossRef]
- Samaranayake, S.; Vishnivetskiy, S.A.; Shores, C.R.; Thibeault, K.C.; Kook, S.; Chen, J.; Burns, M.E.; Gurevich, E.V.; Gurevich, V.V. Biological role of arrestin-1 oligomerization. J. Neurosci. 2020, 40, 8055–8069. [Google Scholar] [CrossRef]
- Lyubarsky, A.; Nikonov, S.; Pugh, E.N. The kinetics of inactivation of the rod phototransduction cascade with constant Ca2+i. J. Gen. Physiol. 1996, 107, 19–34. [Google Scholar] [CrossRef] [PubMed]
- Schneider, C.A.; Rasband, W.S.; Eliceiri, K.W. NIH Image to ImageJ: 25 years of image analysis. Nat. Methods 2012, 9, 671–675. [Google Scholar] [CrossRef]
- Dobin, A.; Davis, C.A.; Schlesinger, F.; Drenkow, J.; Zaleski, C.; Jha, S.; Batut, P.; Chaisson, M.; Gingeras, T.R. STAR: Ultrafast universal RNA-seq aligner. Bioinformatics 2013, 29, 15–21. [Google Scholar] [CrossRef]
- Love, M.I.; Huber, W.; Anders, S. Moderated estimation of fold change and dispersion for RNA-seq data with DESeq2. Genome Biol. 2014, 15, 550. [Google Scholar] [CrossRef] [Green Version]
- RStudio Team. RStudio: Integrated Development Environment for R; RStudio Team: Boston, MA, USA, 2015. [Google Scholar]
- Hao, W.; Wenzel, A.; Obin, M.S.; Chen, C.K.; Brill, E.; Krasnoperova, N.V.; Eversole-Cire, P.; Kleyner, Y.; Taylor, A.; Simon, M.I.; et al. Evidence for two apoptotic pathways in light-induced retinal degeneration. Nat. Genet. 2002, 32, 254–260. [Google Scholar] [CrossRef]
- Grimm, C.; Remé, C.E. Light Damage as a Model of Retinal Degeneration. Methods Mol. Biol. 2013, 935, 87–97. [Google Scholar] [CrossRef]
- Pearson, R.A.; Ali, R.R. Unlocking the Potential for Endogenous Repair to Restore Sight. Neuron 2018, 100, 524–526. [Google Scholar] [CrossRef] [PubMed]
- Liu, C.; Peng, M.; Laties, A.M.; Wen, R. Preconditioning with Bright Light Evokes a Protective Response against Light Damage in the Rat Retina. J. Neurosci. 1998, 18, 1337–1344. [Google Scholar] [CrossRef] [PubMed]
- Ueki, Y.; Le, Y.Z.; Chollangi, S.; Muller, W.; Ash, J.D. Preconditioning-induced protection of photoreceptors requires activation of the signal-transducing receptor gp130 in photoreceptors. Proc. Natl. Acad. Sci. USA 2009, 106, 21389–21394. [Google Scholar] [CrossRef] [PubMed]
- Joly, S.; Lange, C.; Thiersch, M.; Samardzija, M.; Grimm, C. Leukemia Inhibitory Factor Extends the Lifespan of Injured Photoreceptors In Vivo. J. Neurosci. 2008, 28, 13765–13774. [Google Scholar] [CrossRef]
- Scott, K.; Zuker, C. Lights out: Deactivation of the phototransduction cascade. Trends Biochem. Sci. 1997, 22, 350–354. [Google Scholar] [CrossRef]
- Lyubarsky, A.L.; Pugh, E.N. Recovery phase of the murine rod photoresponse reconstructed from electroretinographic recordings. J. Neurosci. 1996, 16, 563–571. [Google Scholar] [CrossRef]
- Hu, W.; Wan, D.; Yu, X.; Cao, J.; Guo, P.; Li, H.S.; Han, J. Protein Gq Modulates Termination of Phototransduction and Prevents Retinal Degeneration. J. Biol. Chem. 2012, 287, 13911–13918. [Google Scholar] [CrossRef]
- Mendez, A.; Lem, J.; Simon, M.; Chen, J. Light-dependent translocation of arrestin in the absence of rhodopsin phosphorylation and transducin signaling. J. Neurosci. 2003, 23, 3124–3129. [Google Scholar] [CrossRef] [PubMed]
- Nair, K.S.; Hanson, S.M.; Mendez, A.; Gurevich, E.V.; Kennedy, M.J.; Shestopalov, V.I.; Vishnivetskiy, S.A.; Chen, J.; Hurley, J.B.; Gurevich, V.V.; et al. Light-dependent redistribution of arrestin in vertebrate rods is an energy-independent process governed by protein-protein interactions. Neuron 2005, 46, 555–567. [Google Scholar] [CrossRef]
- Weissman, A.M.; Shabek, N.; Ciechanover, A. The predator becomes the prey: Regulating the ubiquitin system by ubiquitylation and degradation. Nat. Rev. Mol. Cell Biol. 2011, 12, 605–620. [Google Scholar] [CrossRef]
- Martínez-Mármol, R.; Barneda-Zahonero, B.; Soto, D.; Andrés, R.M.; Coccia, E.; Gasull, X.; Planells-Ferrer, L.; Moubarak, R.S.; Soriano, E.; Comella, J.X. FAIM-L regulation of XIAP degradation modulates Synaptic Long-Term Depression and Axon Degeneration. Sci. Rep. 2016, 6, 35775. [Google Scholar] [CrossRef] [PubMed]
- Shenoy, S.K.; McDonald, P.H.; Kohout, T.A.; Lefkowitz, R.J. Regulation of receptor fate by ubiquitination of activated β2-adrenergic receptor and β-arrestin. Science. 2001, 294, 1307–1313. [Google Scholar] [CrossRef]
- Ahmed, M.R.; Zhan, X.; Song, X.; Kook, S.; Gurevich, V.V.; Gurevich, E.V. Ubiquitin ligase parkin promotes Mdm2-arrestin interaction but inhibits arrestin ubiquitination. Biochemistry 2011, 50, 3749–3763. [Google Scholar] [CrossRef] [PubMed]
- Grimm, C.; Remé, C.E. Light Damage Models of Retinal Degeneration. Methods Mol. Biol. 2019, 1834, 167–178. [Google Scholar] [CrossRef]
- Krigel, A.; Berdugo, M.; Picard, E.; Levy-Boukris, R.; Jaadane, I.; Jonet, L.; Dernigoghossian, M.; Andrieu-Soler, C.; Torriglia, A.; Behar-Cohen, F. Light-induced retinal damage using different light sources, protocols and rat strains reveals LED phototoxicity. Neuroscience 2016, 339, 296–307. [Google Scholar] [CrossRef] [PubMed]
- Yang, J.; Song, Y.; Law, A.D.; Rogan, C.J.; Shimoda, K.; Djukovic, D.; Anderson, J.C.; Kretzschmar, D.; Hendrix, D.A.; Giebultowicz, J.M. Chronic blue light leads to accelerated aging in Drosophila by impairing energy metabolism and neurotransmitter levels. Front. Aging 2022, 3, 94. [Google Scholar] [CrossRef]
- Ikelle, L.; Naash, M.I.; Al-Ubaidi, M.R. Modulation of SOD3 levels is detrimental to retinal homeostasis. Antioxidants 2021, 10, 1595. [Google Scholar] [CrossRef]
- Wert, K.J.; Velez, G.; Cross, M.R.; Wagner, B.A.; Teoh-Fitzgerald, M.L.; Buettner, G.R.; McAnany, J.J.; Olivier, A.; Tsang, S.H.; Harper, M.M.; et al. Extracellular superoxide dismutase (SOD3) regulates oxidative stress at the vitreoretinal interface. Free Radic. Biol. Med. 2018, 124, 408–419. [Google Scholar] [CrossRef] [Green Version]
- Carbon, S.; Ireland, A.; Mungall, C.J.; Shu, S.; Marshall, B.; Lewis, S.; Lomax, J.; Mungall, C.; Hitz, B.; Balakrishnan, R.; et al. AmiGO: Online access to ontology and annotation data. Bioinformatics 2009, 25, 288–289. [Google Scholar] [CrossRef]
- Carbon, S.; Douglass, E.; Good, B.M.; Unni, D.R.; Harris, N.L.; Mungall, C.J.; Basu, S.; Chisholm, R.L.; Dodson, R.J.; Hartline, E.; et al. The Gene Ontology resource: Enriching a GOld mine. Nucleic Acids Res. 2021, 49, D325–D334. [Google Scholar] [CrossRef]
- Uhlén, M.; Fagerberg, L.; Hallström, B.M.; Lindskog, C.; Oksvold, P.; Mardinoglu, A.; Sivertsson, Å.; Kampf, C.; Sjöstedt, E.; Asplund, A.; et al. Tissue-based map of the human proteome. Science 2015, 347, 1260419. [Google Scholar] [CrossRef]
- Cuenca, N.; Pinilla, I.; Sauvé, Y.; Lu, B.; Wang, S.; Lund, R.D. Regressive and reactive changes in the connectivity patterns of rod and cone pathways of P23H transgenic rat retina. Neuroscience 2004, 127, 301–317. [Google Scholar] [CrossRef]
- Yoshiyama, Y.; Higuchi, M.; Zhang, B.; Huang, S.M.; Iwata, N.; Saido, T.C.C.; Maeda, J.; Suhara, T.; Trojanowski, J.Q.; Lee, V.M.Y. Synapse Loss and Microglial Activation Precede Tangles in a P301S Tauopathy Mouse Model. Neuron 2007, 53, 337–351. [Google Scholar] [CrossRef]
- Xia, F.; Ha, Y.; Shi, S.; Li, Y.; Li, S.; Luisi, J.; Kayed, R.; Motamedi, M.; Liu, H.; Zhang, W. Early alterations of neurovascular unit in the retina in mouse models of tauopathy. Acta Neuropathol. Commun. 2021, 9, 51. [Google Scholar] [CrossRef] [PubMed]
- Munemasa, Y.; Kitaoka, Y. Molecular mechanisms of retinal ganglion cell degeneration in glaucoma and future prospects for cell body and axonal protection. Front. Cell. Neurosci. 2012, 6, 60. [Google Scholar] [CrossRef]
- Fernández-Albarral, J.A.; Salazar, J.J.; de Hoz, R.; Marco, E.M.; Martín-Sánchez, B.; Flores-Salguero, E.; Salobrar-García, E.; López-Cuenca, I.; Barrios-Sabador, V.; Avilés-Trigueros, M.; et al. Retinal Molecular Changes Are Associated with Neuroinflammation and Loss of RGCs in an Experimental Model of Glaucoma. Int. J. Mol. Sci. 2021, 22, 2066. [Google Scholar] [CrossRef]
- Li, Q.; Cheng, Y.; Zhang, S.; Sun, X.; Wu, J. TRPV4-induced Müller cell gliosis and TNF-α elevation-mediated retinal ganglion cell apoptosis in glaucomatous rats via JAK2/STAT3/NF-κB pathway. J. Neuroinflamm. 2021, 18, 271. [Google Scholar] [CrossRef] [PubMed]
- Kakiuchi, D.; Uehara, T.; Shiotani, M.; Nakano-Ito, K.; Suganuma, A.; Aoki, T.; Tsukidate, K.; Sawada, K. Oscillatory potentials in electroretinogram as an early marker of visual abnormalities in vitamin A deficiency. Mol. Med. Rep. 2015, 11, 995–1003. [Google Scholar] [CrossRef] [Green Version]
- Miyake, Y. Electrodiagnosis of Retinal Diseases; Springer: Berlin/Heidelberg, Germany, 2006; pp. 1–234. [Google Scholar] [CrossRef]
- Yonemura, D.; Aoki, T.; Tsuzuki, K. Electroretinogram in Diabetic Retinopathy. Arch. Ophthalmol. 1962, 68, 19–24. [Google Scholar] [CrossRef] [PubMed]
- Akula, J.D.; Mocko, J.A.; Moskowitz, A.; Hansen, R.M.; Fulton, A.B. The Oscillatory Potentials of the Dark-Adapted Electroretinogram in Retinopathy of Prematurity. Investig. Ophthalmol. Vis. Sci. 2007, 48, 5788–5797. [Google Scholar] [CrossRef]
- Binz, N.; Rakoczy, E.P.; Ali Rahman, I.S.; Vagaja, N.N.; Lai, C.-M.M. Biomarkers for Diabetic Retinopathy—Could Endothelin 2 Be Part of the Answer? PLoS ONE 2016, 11, e0160442. [Google Scholar] [CrossRef] [PubMed]
- Bramall, A.N.; Szego, M.J.; Pacione, L.R.; Chang, I.; Diez, E.; D’Orleans-Juste, P.; Stewart, D.J.; Hauswirth, W.W.; Yanagisawa, M.; McInnes, R.R. Endothelin-2-Mediated Protection of Mutant Photoreceptors in Inherited Photoreceptor Degeneration. PLoS ONE 2013, 8, e58023. [Google Scholar] [CrossRef]
- Braunger, B.M.; Ohlmann, A.; Koch, M.; Tanimoto, N.; Volz, C.; Yang, Y.; Bösl, M.R.; Cvekl, A.; Jägle, H.; Seeliger, M.W.; et al. Constitutive overexpression of Norrin activates Wnt/β-catenin and endothelin-2 signaling to protect photoreceptors from light damage. Neurobiol. Dis. 2013, 50, 1–12. [Google Scholar] [CrossRef]
- Remé, C.E.; Grimm, C.; Hafezi, F.; Marti, A.; Wenzel, A. Apoptotic cell death in retinal degenerations. Prog. Retin. Eye Res. 1998, 17, 443–464. [Google Scholar] [CrossRef]
- Wenzel, A.; Grimm, C.; Samardzija, M.; Remé, C.E. Molecular mechanisms of light-induced photoreceptor apoptosis and neuroprotection for retinal degeneration. Prog. Retin. Eye Res. 2005, 24, 275–306. [Google Scholar] [CrossRef] [PubMed]
- Grimm, C.; Wenzel, A.; Hafezi, F.; Yu, S.; Redmond, T.M.; Remé, C.E. Protection of Rpe65-deficient mice identifies rhodopsin as a mediator of light-induced retinal degeneration. Nat. Genet. 2000, 25, 63–66. [Google Scholar] [CrossRef] [PubMed]
- Saari, J.C.; Garwin, G.G.; Van Hooser, J.P.; Palczewski, K. Reduction of all-trans-retinal limits regeneration of visual pigment in mice. Vision Res. 1998, 38, 1325–1333. [Google Scholar] [CrossRef] [PubMed] [Green Version]
- Mustafi, D.; Kevany, B.M.; Bai, X.; Golczak, M.; Adams, M.D.; Wynshaw-Boris, A.; Palczewski, K. Transcriptome analysis reveals rod/cone photoreceptor specific signatures across mammalian retinas. Hum. Mol. Genet. 2016, 25, 4376–4388. [Google Scholar] [CrossRef]
- Mustafi, D.; Maeda, T.; Kohno, H.; Nadeau, J.H.; Palczewski, K. Inflammatory priming predisposes mice to age-related retinal degeneration. J. Clin. Investig. 2012, 122, 2989–3001. [Google Scholar] [CrossRef]
- Weiss, E. Shedding light on dark adaptation. Biochemist 2020, 42, 44–50. [Google Scholar] [CrossRef] [PubMed]
- Chen, J.; Simon, M.I.; Matthes, M.T.; Yasumura, D.; LaVail, M.M. Increased susceptibility to light damage in an arrestin knockout mouse model of Oguchi disease (Stationary night blindness). Investig. Ophthalmol. Vis. Sci. 1999, 40, 2978–2982. [Google Scholar]
- Coleman, J.E.; Semple-Rowland, S.L. GC1 deletion prevents light-dependent arrestin translocation in mouse cone photoreceptor cells. Investig. Ophthalmol. Vis. Sci. 2005, 46, 12–16. [Google Scholar] [CrossRef] [PubMed]
- Frederiksen, R.; Nymark, S.; Kolesnikov, A.V.; Berry, J.D.; Adler, L.; Koutalos, Y.; Kefalov, V.J.; Carter Cornwall, M. Rhodopsin kinase and arrestin binding control the decay of photoactivated rhodopsin and dark adaptation of mouse rods. J. Gen. Physiol. 2016, 148, 1–11. [Google Scholar] [CrossRef] [PubMed]
- Aryan, H.; Bahadori, A.; Farhud, D.D.; Zarif Yeganeh, M.; Pourkalhor, H. A Homozygote Mutation in S-Antigen Visual Arrestin SAG Gene in an Iranian Patient with Oguchi Type One: A Case Report. Iran. J. Public Health 2020, 49, 995. [Google Scholar] [CrossRef]
- Gurevich, V.V.; Gurevich, E.V. Arrestin mutations: Some cause diseases, others promise cure. Prog. Mol. Biol. Transl. Sci. 2019, 161, 29–45. [Google Scholar] [CrossRef]
- Kalloniatis, M.; Luu, C. Light and Dark Adaptation. Australas. J. Optom. 2007, 18, 384–385. [Google Scholar] [CrossRef]
- Chen, J.; Makino, C.L.; Peachey, N.S.; Baylor, D.A.; Simon, M.I. Mechanisms of rhodopsin inactivation in vivo as revealed by a COOH-terminal truncation mutant. Science 1995, 267, 374–377. [Google Scholar] [CrossRef] [PubMed]
- Xu, J.; Dodd, R.L.; Makino, C.L.; Simon, M.I.; Baylor, D.A.; Chen, J. Prolonged photoresponses in transgenic mouse rods lacking arrestin. Nature 1997, 389, 505–509. [Google Scholar] [CrossRef]
- Chen, C.K.; Burns, M.E.; Spencer, M.; Niemi, G.A.; Chen, J.; Hurley, J.B.; Baylor, D.A.; Simon, M.I. Abnormal photoresponses and light-induced apoptosis in rods lacking rhodopsin kinase. Proc. Natl. Acad. Sci. USA 1999, 96, 3718–3722. [Google Scholar] [CrossRef]
- Clifford, L.J.; Turnbull, A.M.J.; Denning, A.M. Reversible night blindness—A reminder of the increasing importance of vitamin A deficiency in the developed world. J. Optom. 2013, 6, 173. [Google Scholar] [CrossRef]
- Singhal, A.; Ostermaier, M.K.; Vishnivetskiy, S.A.; Panneels, V.; Homan, K.T.; Tesmer, J.J.G.; Veprintsev, D.; Deupi, X.; Gurevich, V.V.; Schertler, G.F.X.; et al. Insights into congenital stationary night blindness based on the structure of G90D rhodopsin. EMBO Rep. 2013, 14, 520–526. [Google Scholar] [CrossRef]
- Fuchs, S.; Nakazawa, M.; Maw, M.; Tamai, M.; Oguchi, Y.; Gal, A. A homozygous 1-base pair deletion in the arrestin gene is a frequent cause of Oguchi disease in Japanese. Nat Gen. 1995, 10, 360–362. [Google Scholar] [CrossRef] [PubMed]
- Yamamoto, S.; Hayashi, M.; Takeuchi, S.; Shirao, Y.; Kita, K.; Kawasaki, K. Normal S cone electroretinogram b-wave in Oguchi’s disease. Br. J. Ophthalmol. 1997, 81, 1043–1045. [Google Scholar] [CrossRef]
- Dai, Y.; Sun, T. Oguchi’s disease: Two cases and literature review. J. Int. Med. Res. 2021, 49, 03000605211019921. [Google Scholar] [CrossRef] [PubMed]
- Zeitz, C.; Robson, A.G.; Audo, I. Congenital stationary night blindness: An analysis and update of genotype-phenotype correlations and pathogenic mechanisms. Prog. Retin. Eye Res. 2015, 45, 58–110. [Google Scholar] [CrossRef]
- Lee, A.R.; Congenital Stationary Night Blindness (CSNB). American Academy of Ophtalmology. Available online: https://eyewiki.aao.org/Congenital_Stationary_Night_Blindness_ (accessed on 27 August 2022).
- Das, R.G.; Becker, D.; Jagannathan, V.; Goldstein, O.; Santana, E.; Carlin, K.; Sudharsan, R.; Leeb, T.; Nishizawa, Y.; Kondo, M.; et al. Genome-wide association study and whole-genome sequencing identify a deletion in LRIT3 associated with canine congenital stationary night blindness. Sci. Rep. 2019, 9, 14166. [Google Scholar] [CrossRef] [PubMed]
- Sokolov, M.; Lyubarsky, A.L.; Strissel, K.J.; Savchenko, A.B.; Govardovskii, V.I.; Pugh, E.N.; Arshavsky, V.Y. Massive Light-Driven Translocation of Transducin between the Two Major Compartments of Rod Cells: A Novel Mechanism of Light Adaptation. Neuron 2002, 33, 95–106. [Google Scholar] [CrossRef]
- Slepak, V.Z.; Hurley, J.B. Mechanism of light-induced translocation of arrestin and transducin in photoreceptors: Interaction-restricted diffusion. IUBMB Life 2008, 60, 2–9. [Google Scholar] [CrossRef] [Green Version]
- Strissel, K.J.; Sokolov, M.; Trieu, L.H.; Arshavsky, V.Y. Arrestin translocation is induced at a critical threshold of visual signaling and is superstoichiometric to bleached rhodopsin. J. Neurosci. 2006, 26, 1146–1153. [Google Scholar] [CrossRef]
- Haglund, K.; Dikic, I. Ubiquitylation and cell signaling. EMBO J. 2005, 24, 3353–3359. [Google Scholar] [CrossRef]
- Thrower, J.S.; Hoffman, L.; Rechsteiner, M.; Pickart, C.M. Recognition of the polyubiquitin proteolytic signal. EMBO J. 2000, 19, 94–102. [Google Scholar] [CrossRef] [PubMed]
- Illing, M.E.; Rajan, R.S.; Bence, N.F.; Kopito, R.R. A rhodopsin mutant linked to autosomal dominant retinitis pigmentosa is prone to aggregate and interacts with the ubiquitin proteasome system. J. Biol. Chem. 2002, 277, 34150–34160. [Google Scholar] [CrossRef] [PubMed]
- Schmidt, M.F.; Gan, Z.Y.; Komander, D.; Dewson, G. Ubiquitin signalling in neurodegeneration: Mechanisms and therapeutic opportunities. Cell Death Differ. 2021, 28, 570–590. [Google Scholar] [CrossRef] [PubMed]
- Shang, F.; Taylor, A. Ubiquitin-proteasome pathway and cellular responses to oxidative stress. Free Radic. Biol. Med. 2011, 51, 5. [Google Scholar] [CrossRef] [PubMed] [Green Version]


Disclaimer/Publisher’s Note: The statements, opinions and data contained in all publications are solely those of the individual author(s) and contributor(s) and not of MDPI and/or the editor(s). MDPI and/or the editor(s) disclaim responsibility for any injury to people or property resulting from any ideas, methods, instructions or products referred to in the content. |
© 2023 by the authors. Licensee MDPI, Basel, Switzerland. This article is an open access article distributed under the terms and conditions of the Creative Commons Attribution (CC BY) license (https://creativecommons.org/licenses/by/4.0/).
Share and Cite
Sirés, A.; Pazo-González, M.; López-Soriano, J.; Méndez, A.; de la Rosa, E.J.; de la Villa, P.; Comella, J.X.; Hernández-Sánchez, C.; Solé, M. The Absence of FAIM Leads to a Delay in Dark Adaptation and Hampers Arrestin-1 Translocation upon Light Reception in the Retina. Cells 2023, 12, 487. https://doi.org/10.3390/cells12030487
Sirés A, Pazo-González M, López-Soriano J, Méndez A, de la Rosa EJ, de la Villa P, Comella JX, Hernández-Sánchez C, Solé M. The Absence of FAIM Leads to a Delay in Dark Adaptation and Hampers Arrestin-1 Translocation upon Light Reception in the Retina. Cells. 2023; 12(3):487. https://doi.org/10.3390/cells12030487
Chicago/Turabian StyleSirés, Anna, Mateo Pazo-González, Joaquín López-Soriano, Ana Méndez, Enrique J. de la Rosa, Pedro de la Villa, Joan X. Comella, Catalina Hernández-Sánchez, and Montse Solé. 2023. "The Absence of FAIM Leads to a Delay in Dark Adaptation and Hampers Arrestin-1 Translocation upon Light Reception in the Retina" Cells 12, no. 3: 487. https://doi.org/10.3390/cells12030487