
Effect of the Ketone Body, D-β-Hydroxybutyrate, on Sirtuin2-Mediated Regulation of Mitochondrial Quality Control and the Autophagy–Lysosomal Pathway
 , and
, and 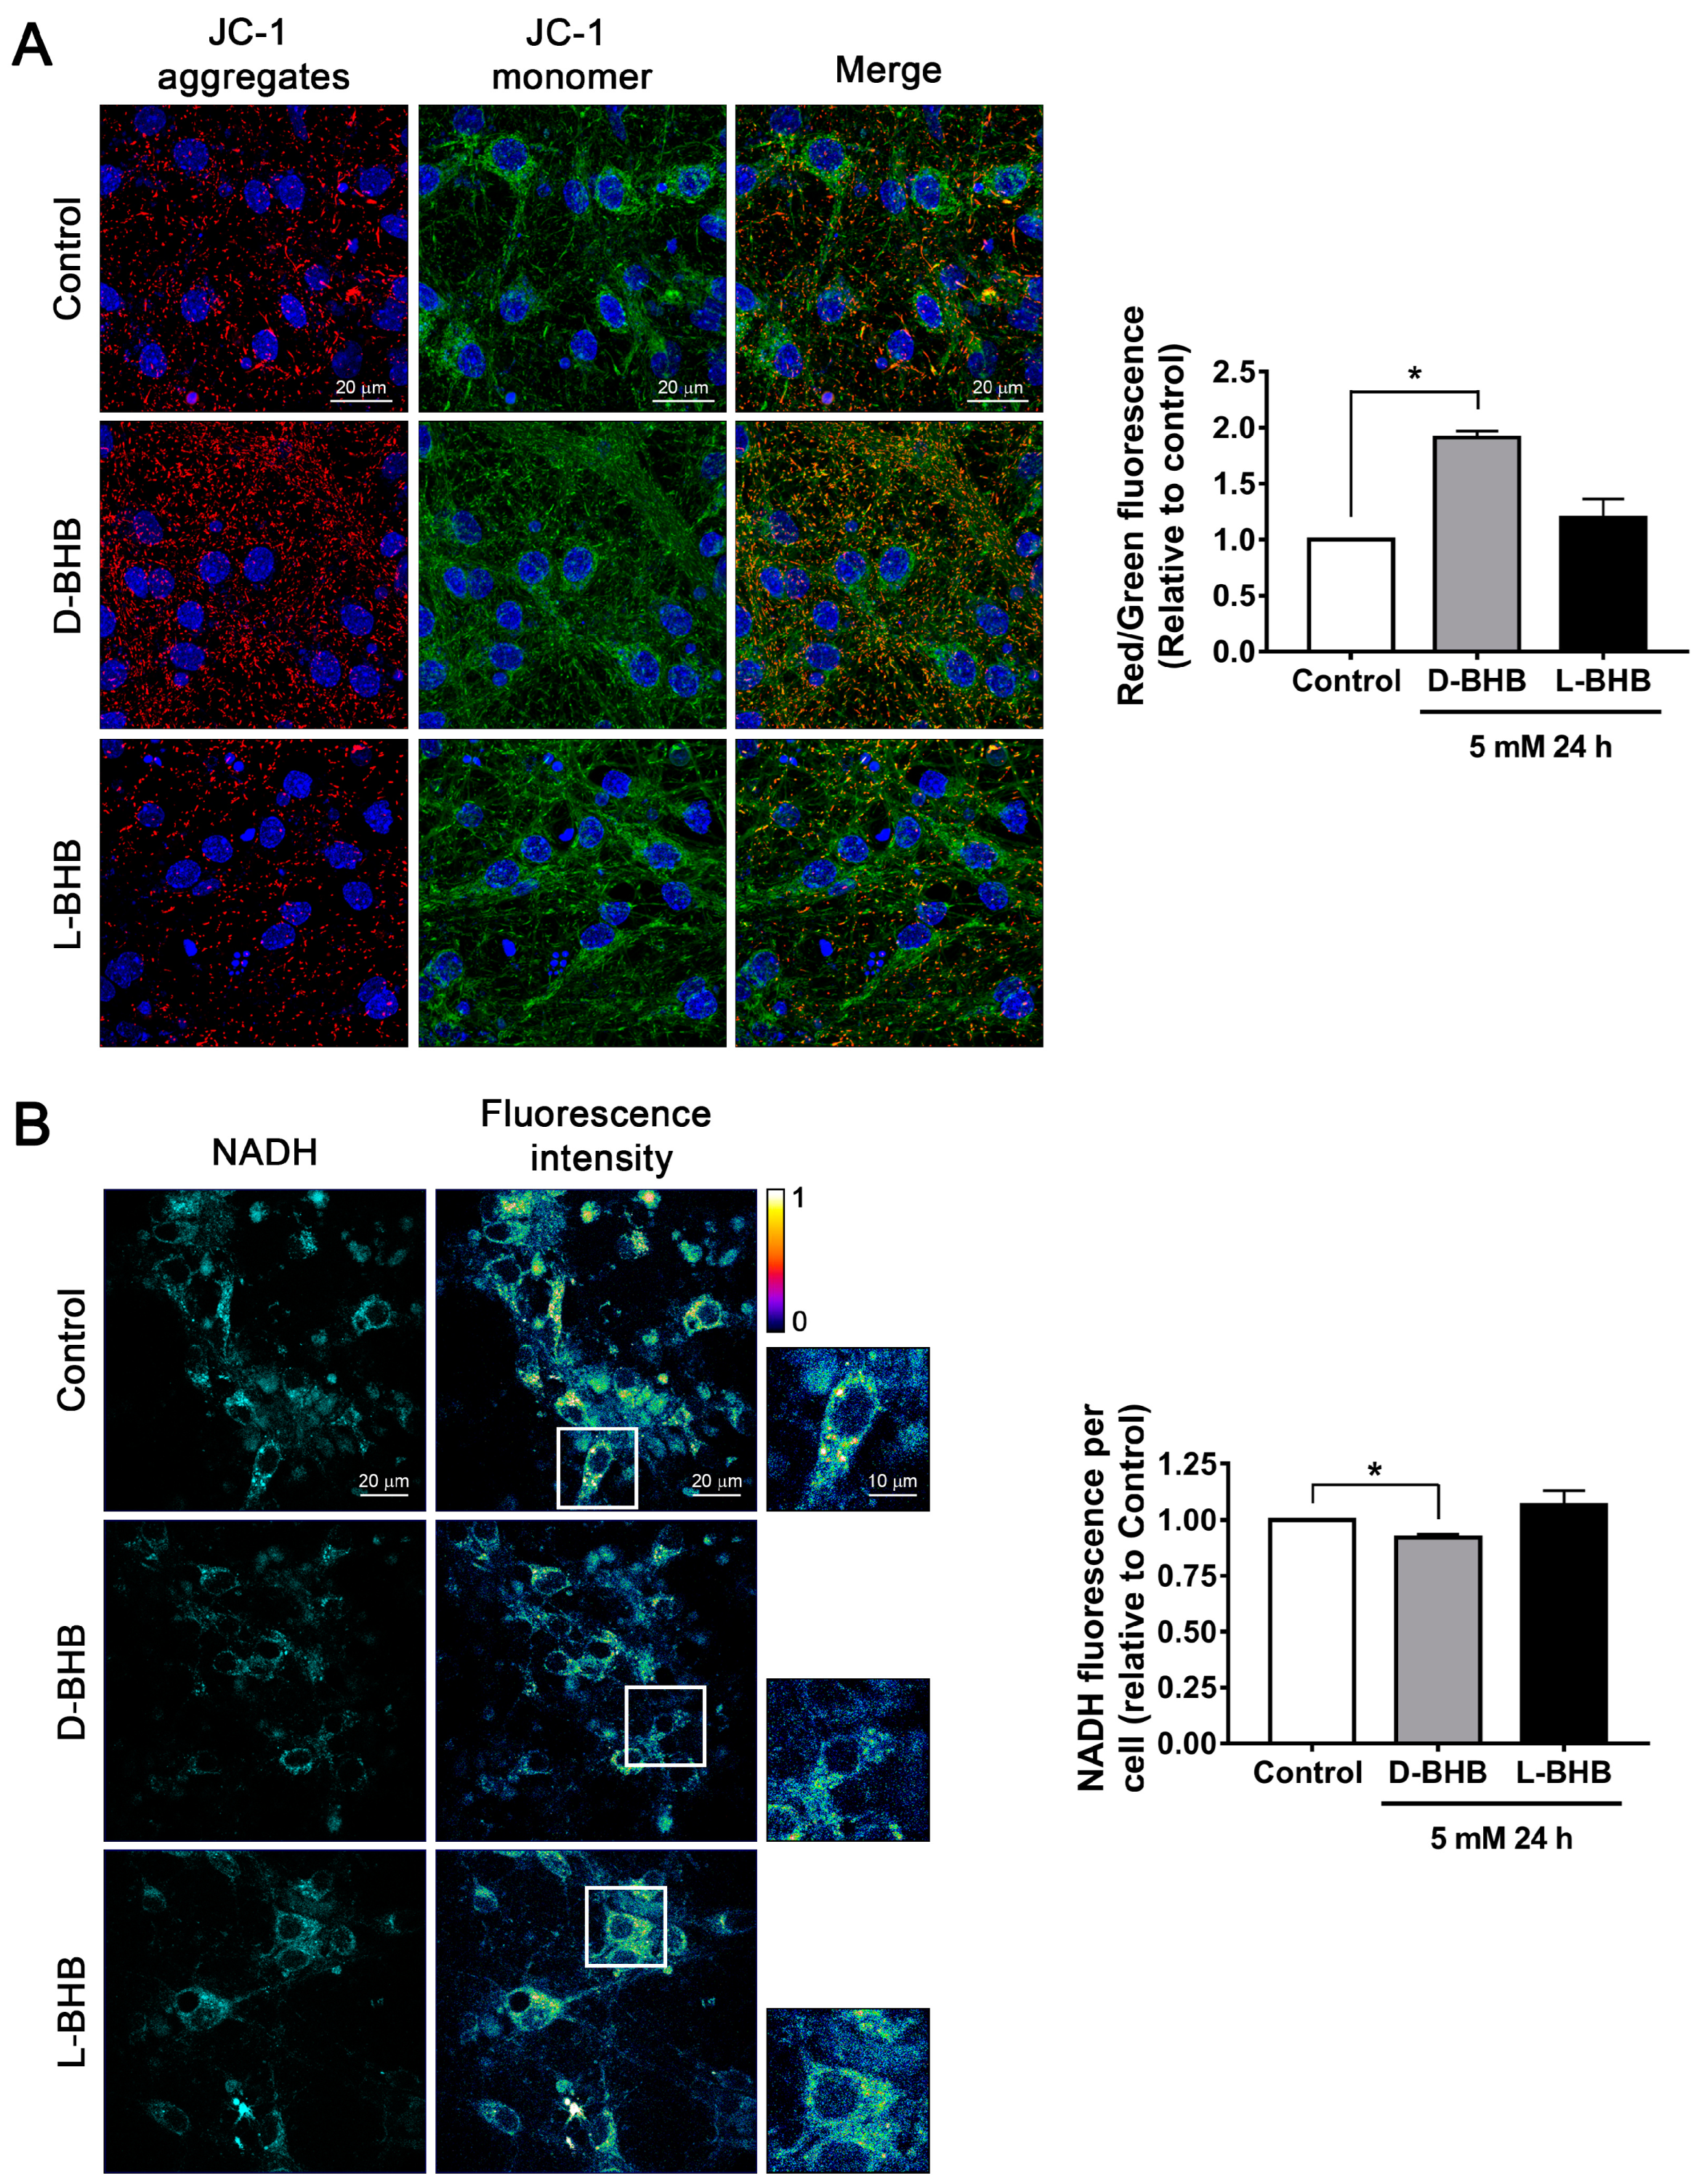
Abstract
:1. Introduction
2. Materials and Methods
2.1. Cell Culturing
2.2. Cell Treatments
2.3. qRT-PCR
2.4. MTT Cell Viability Assay
2.5. Lactate Dehydrogenase (LDH) Activity
2.6. Subcellular Fractionation
2.7. Immunoblotting
2.8. Transfection of Neurons
2.9. Immunofluorescence
2.10. Mitophagy Analysis
2.11. Mitochondrial Membrane Potential Analysis
2.12. ATP Determination
2.13. Mitochondrial Morphology Analysis
2.14. Autofluorescence of NADH
2.15. Detection of Lysosomes
2.16. Animals and Ketogenic Diet
2.17. Determination of β-Hydroxybutyrate and Glucose Levels in Blood
2.18. Immunofluorescence in Brain Sections
2.19. Statistical Analysis
3. Results
3.1. D-BHB Stimulates Mitochondrial Function and Biogenesis
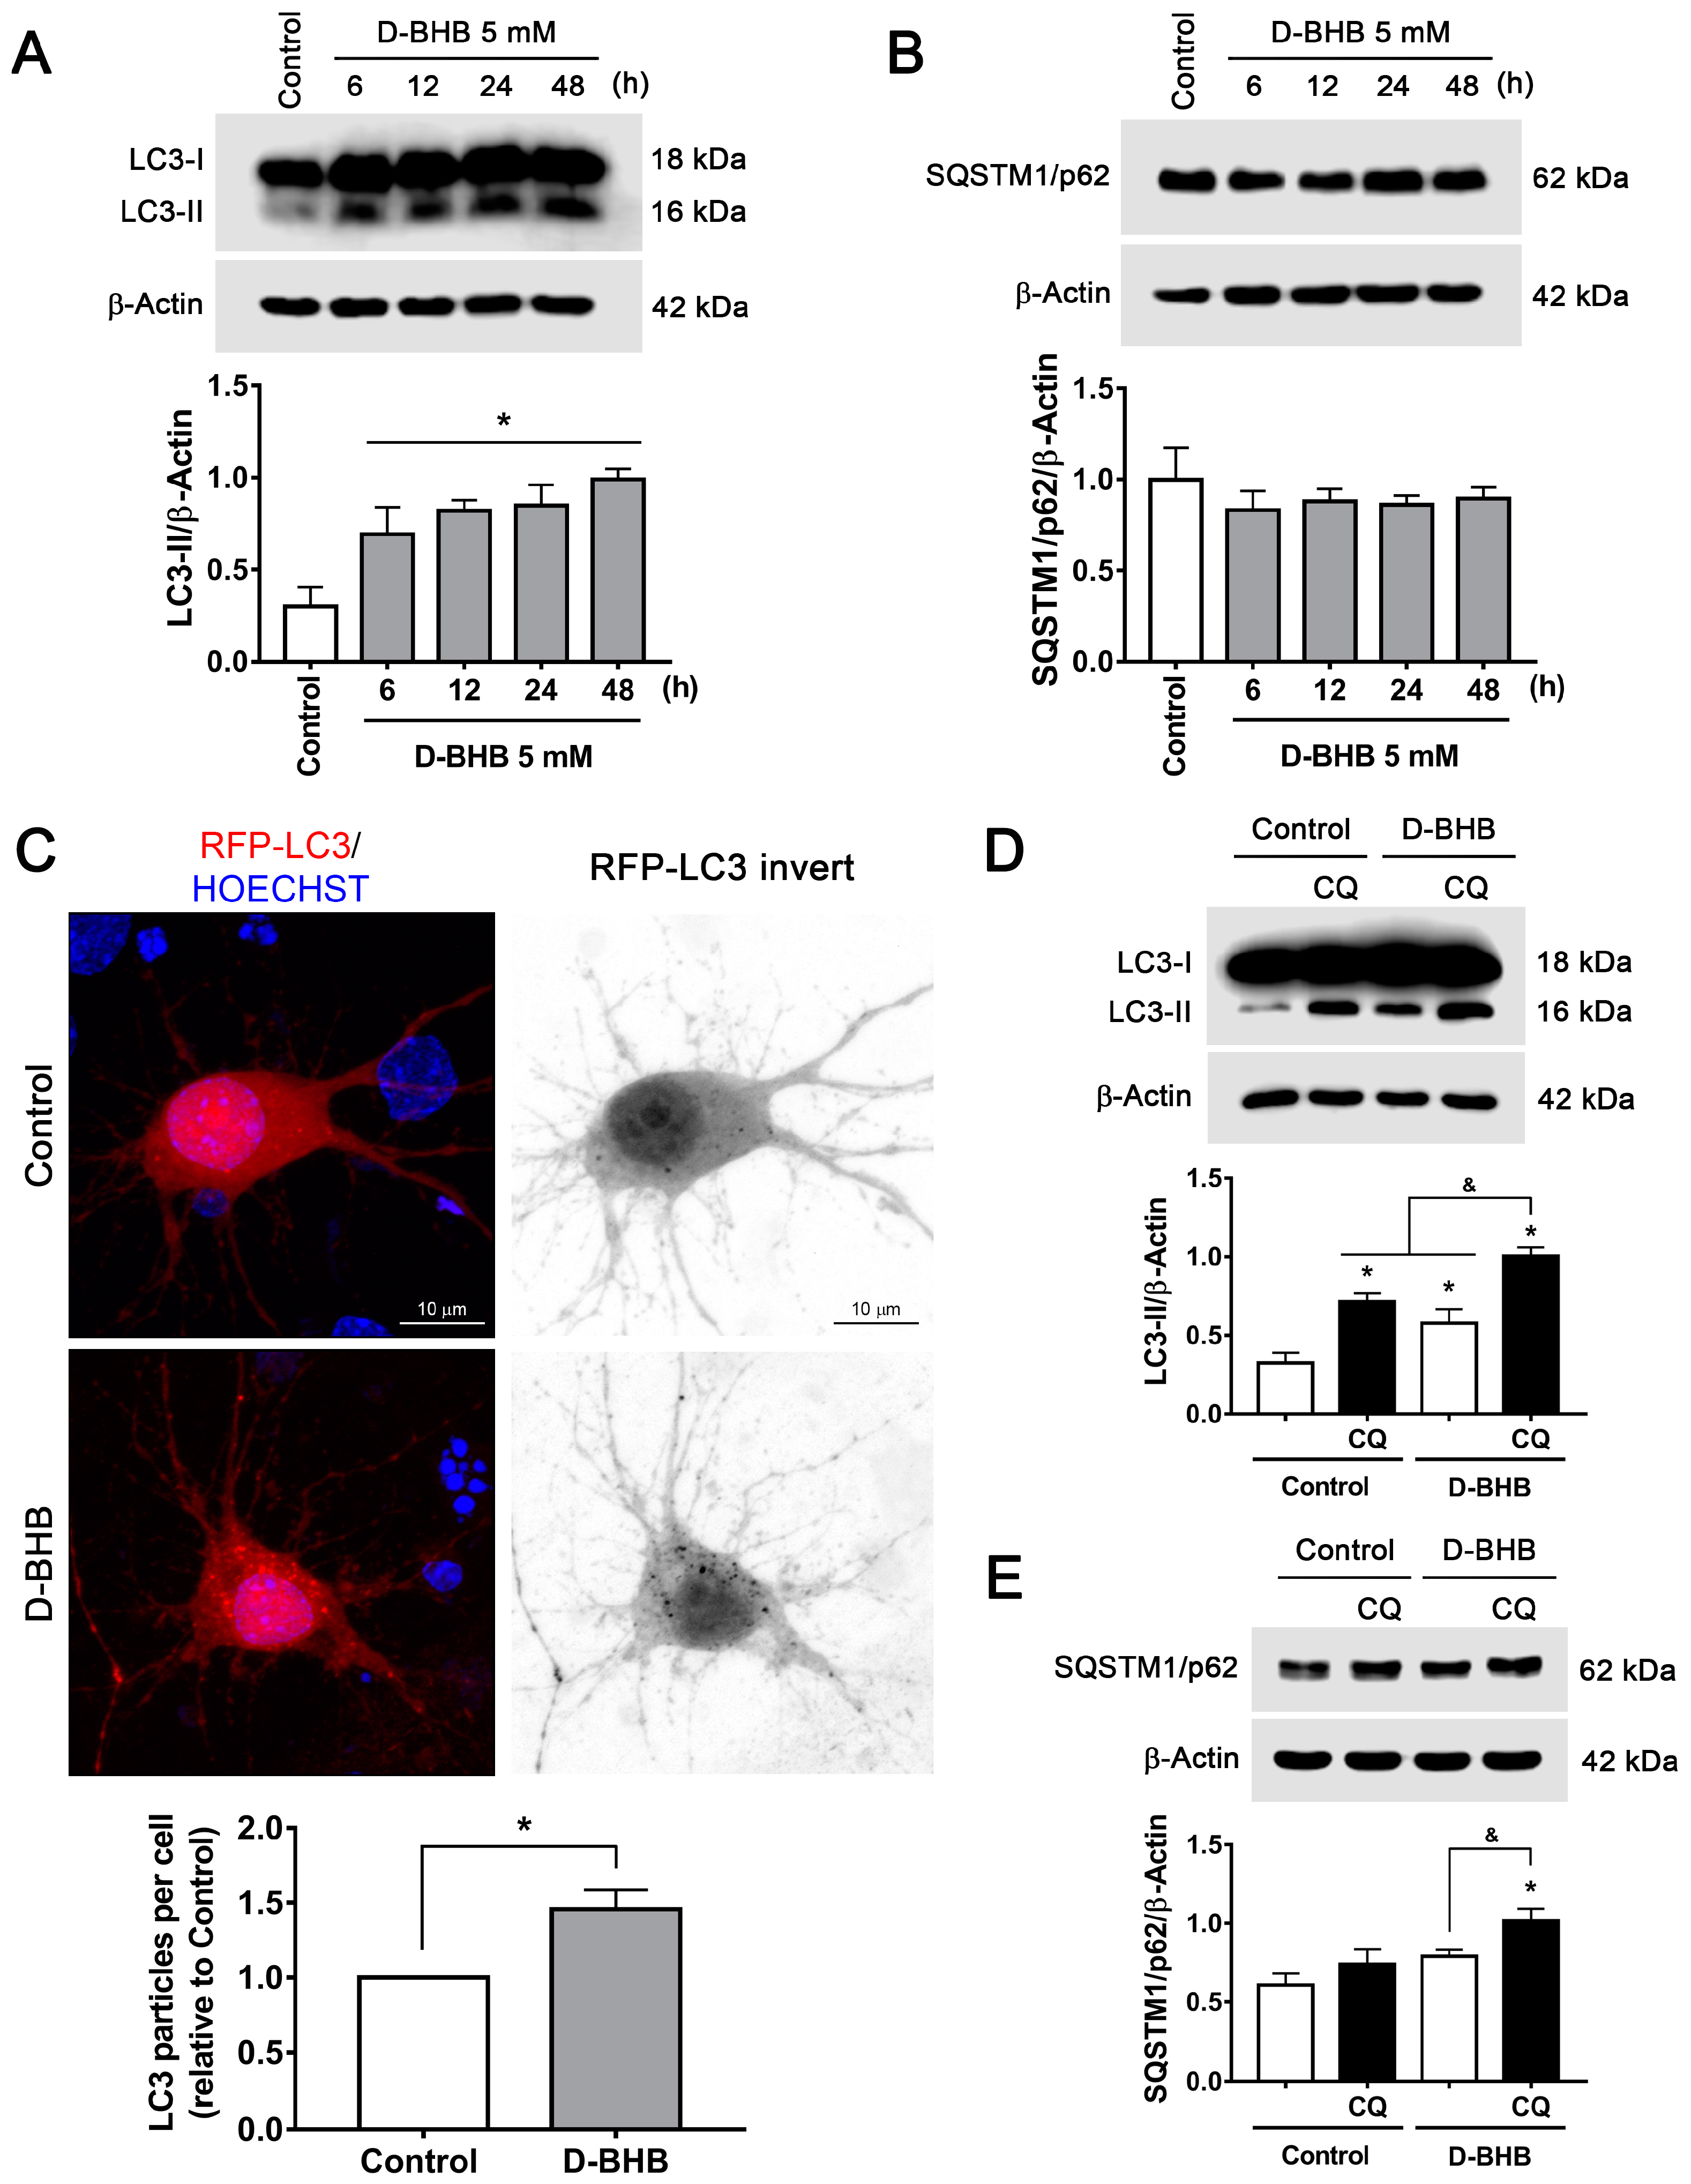
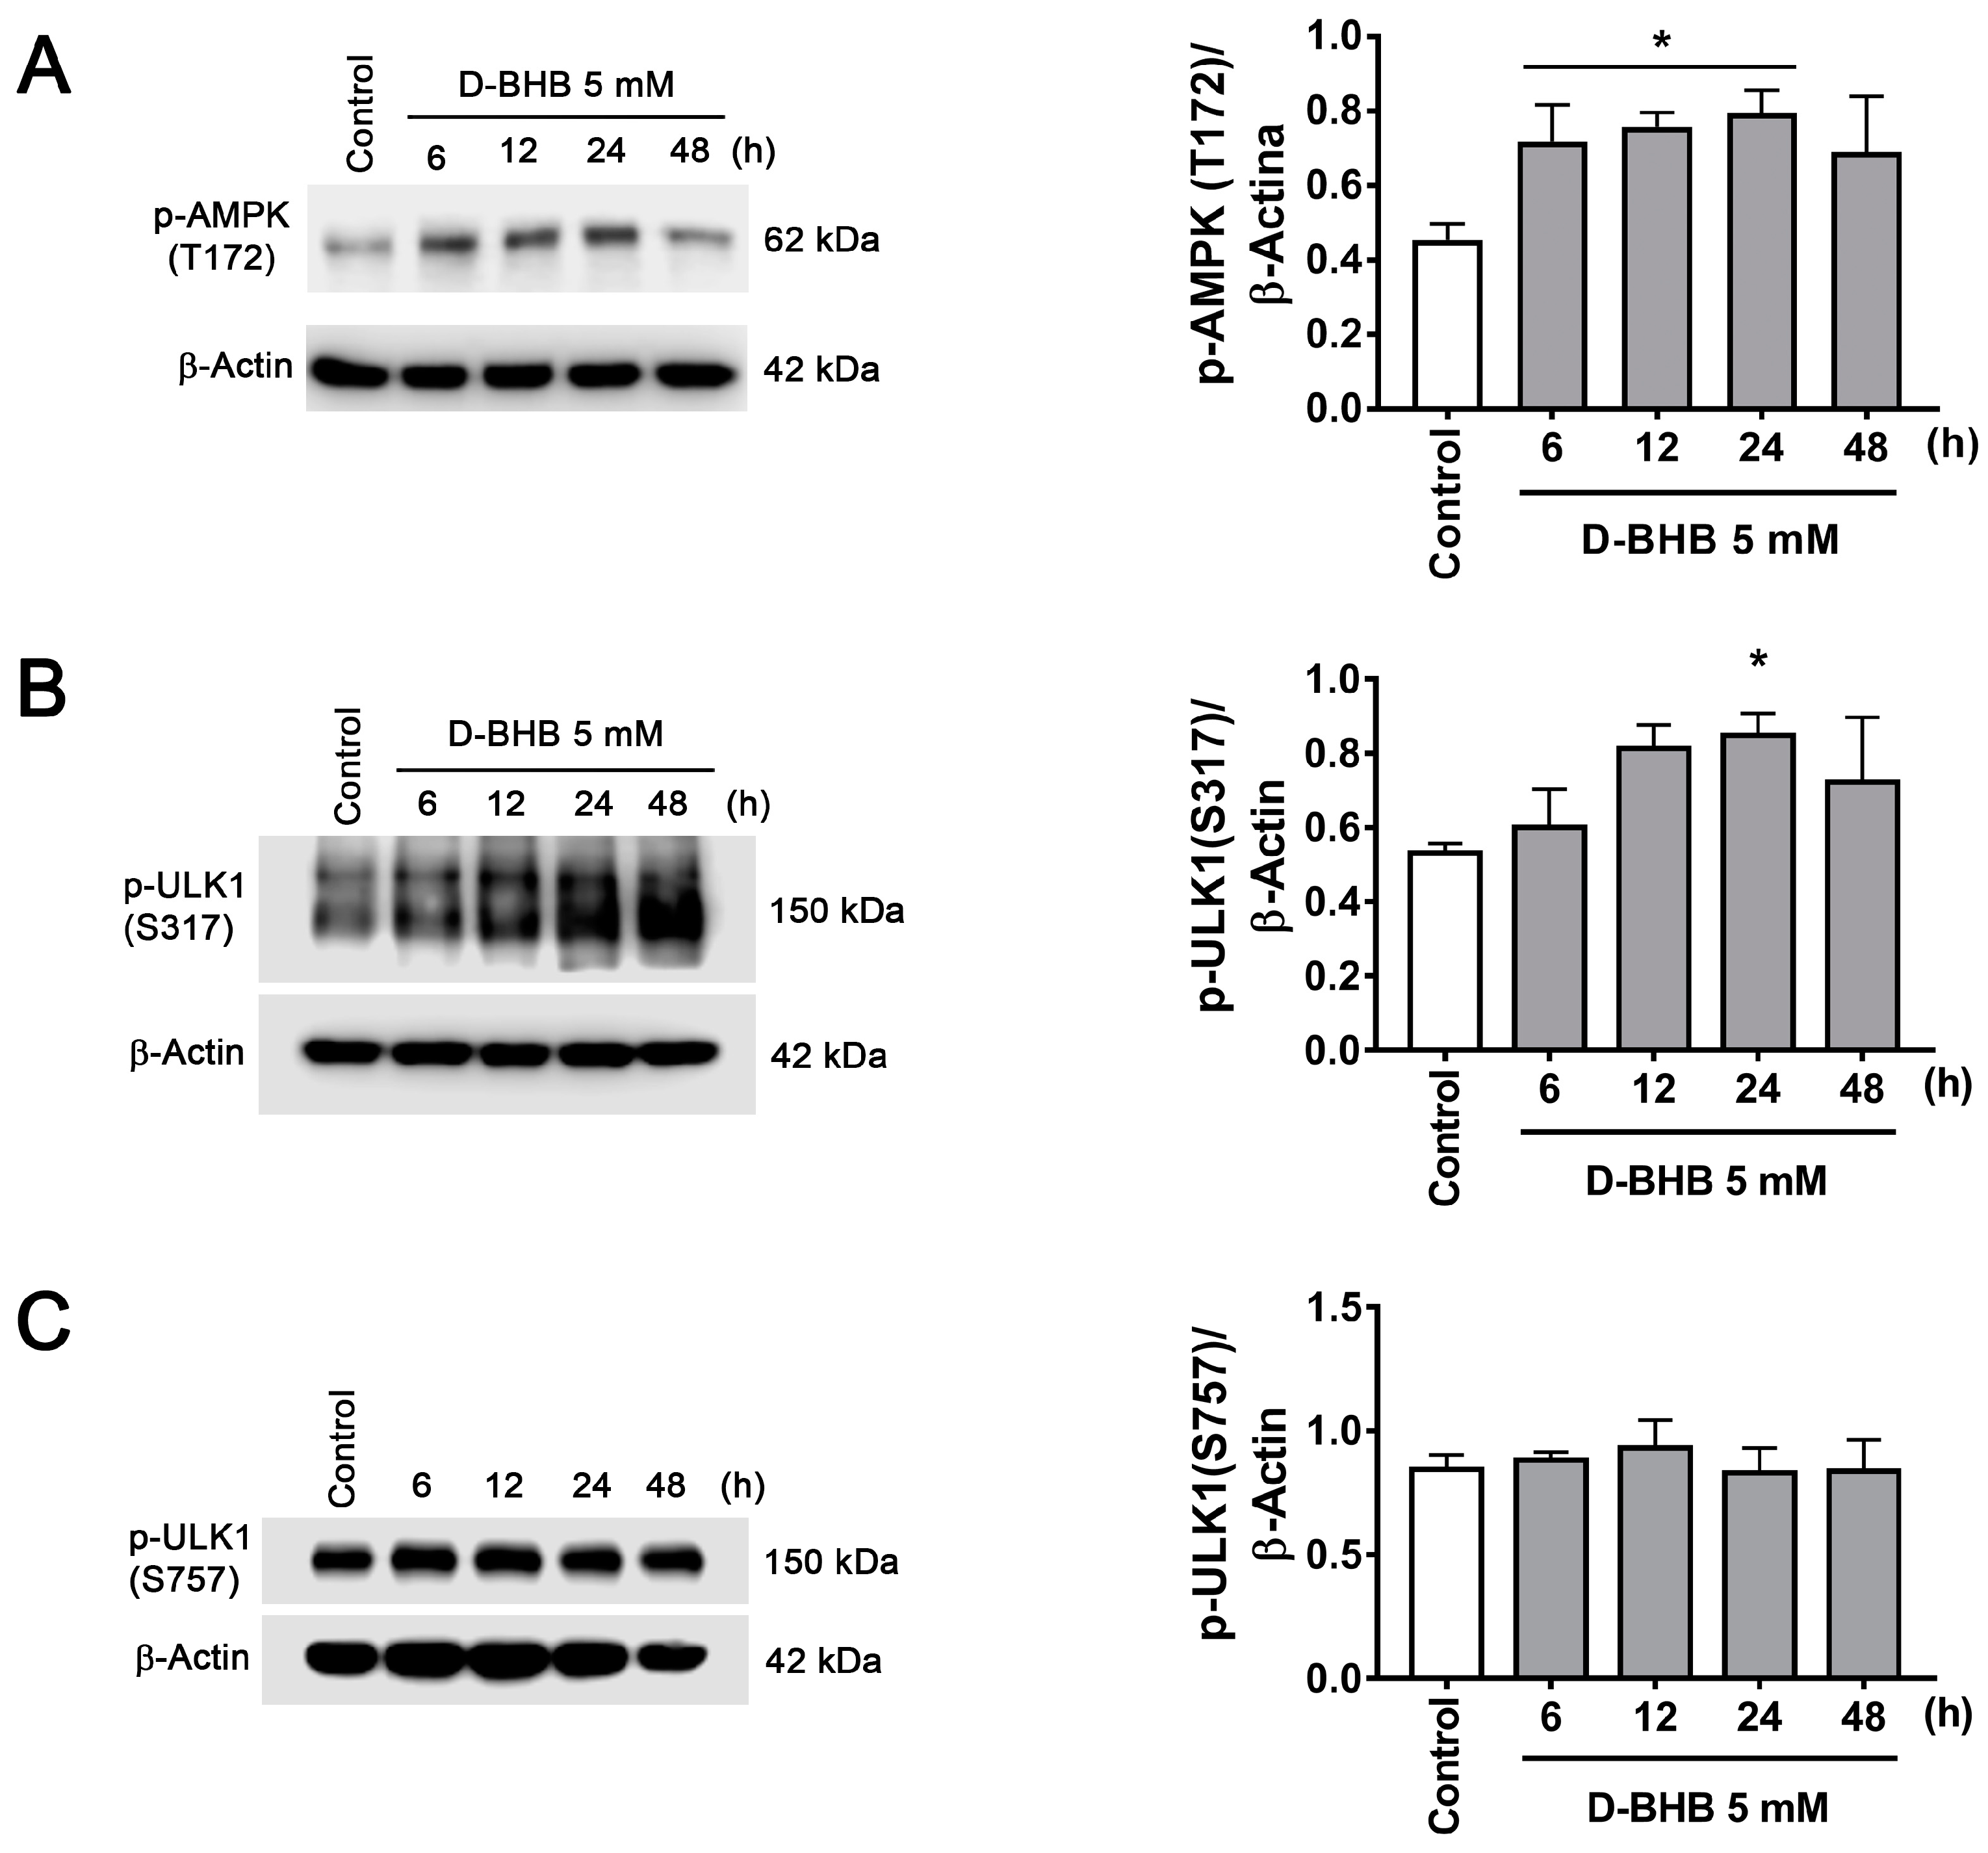
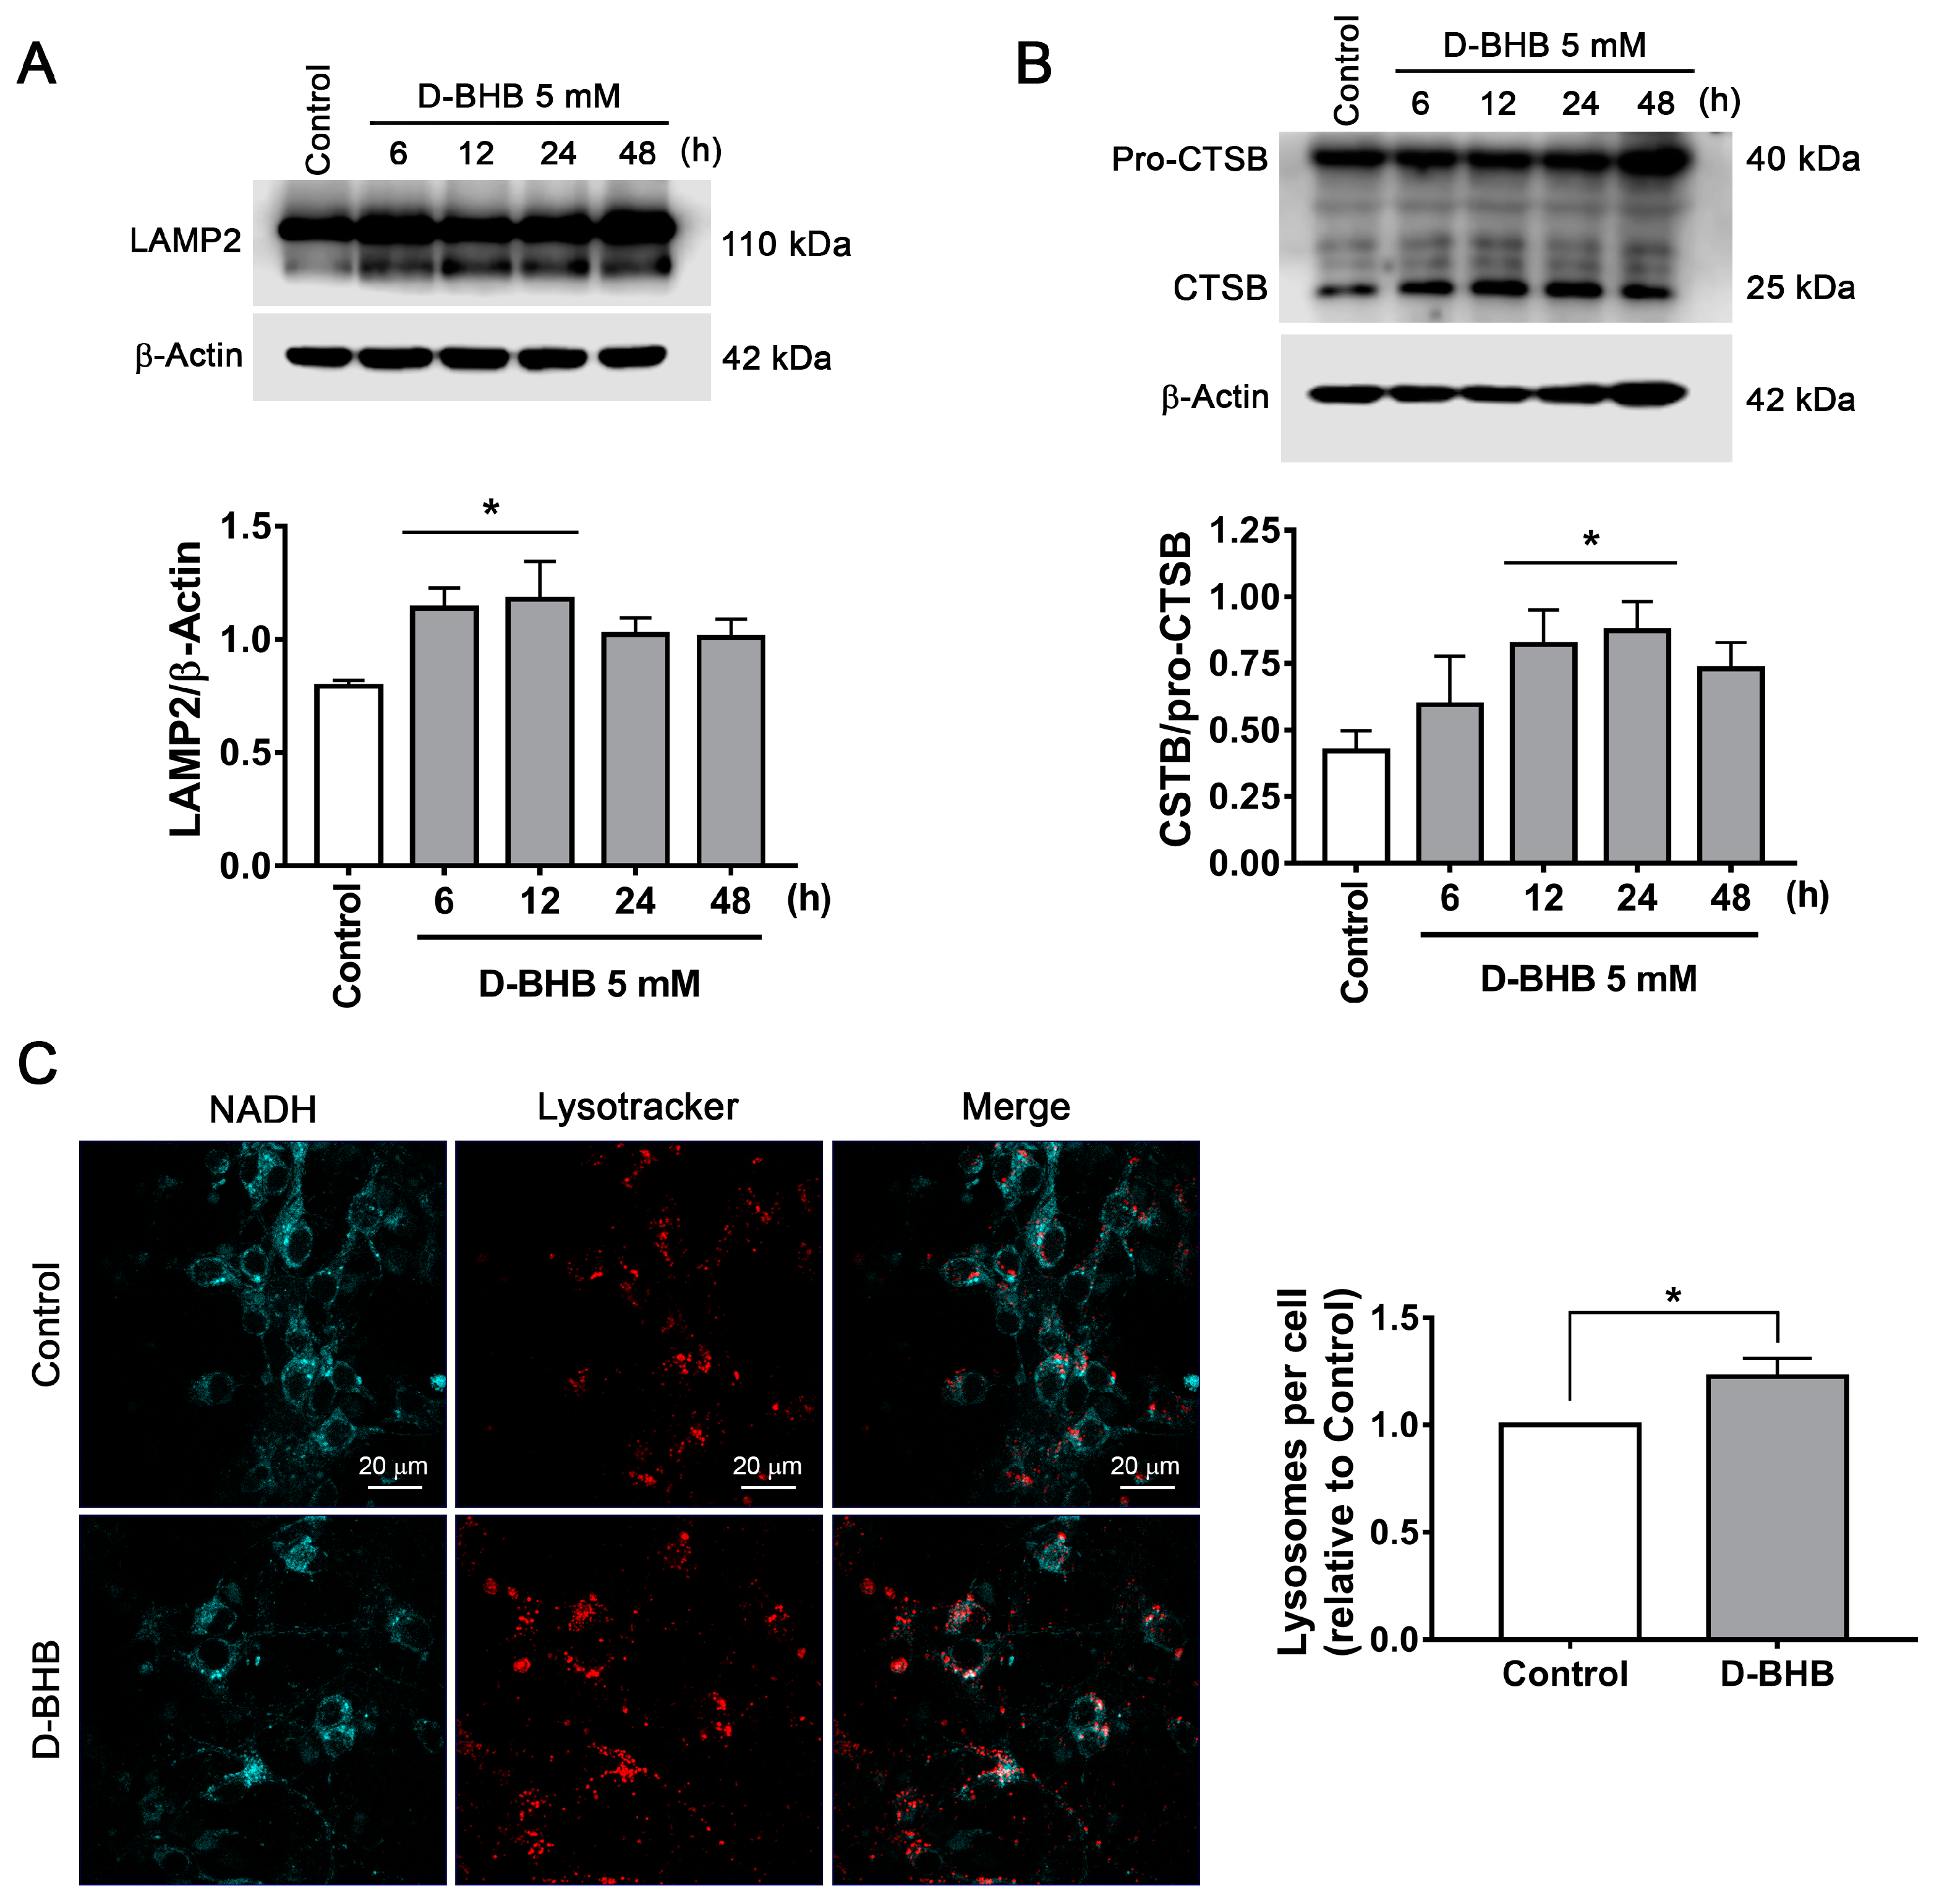
3.2. D-BHB Treatment Promotes Autophagy in Cortical Neurons
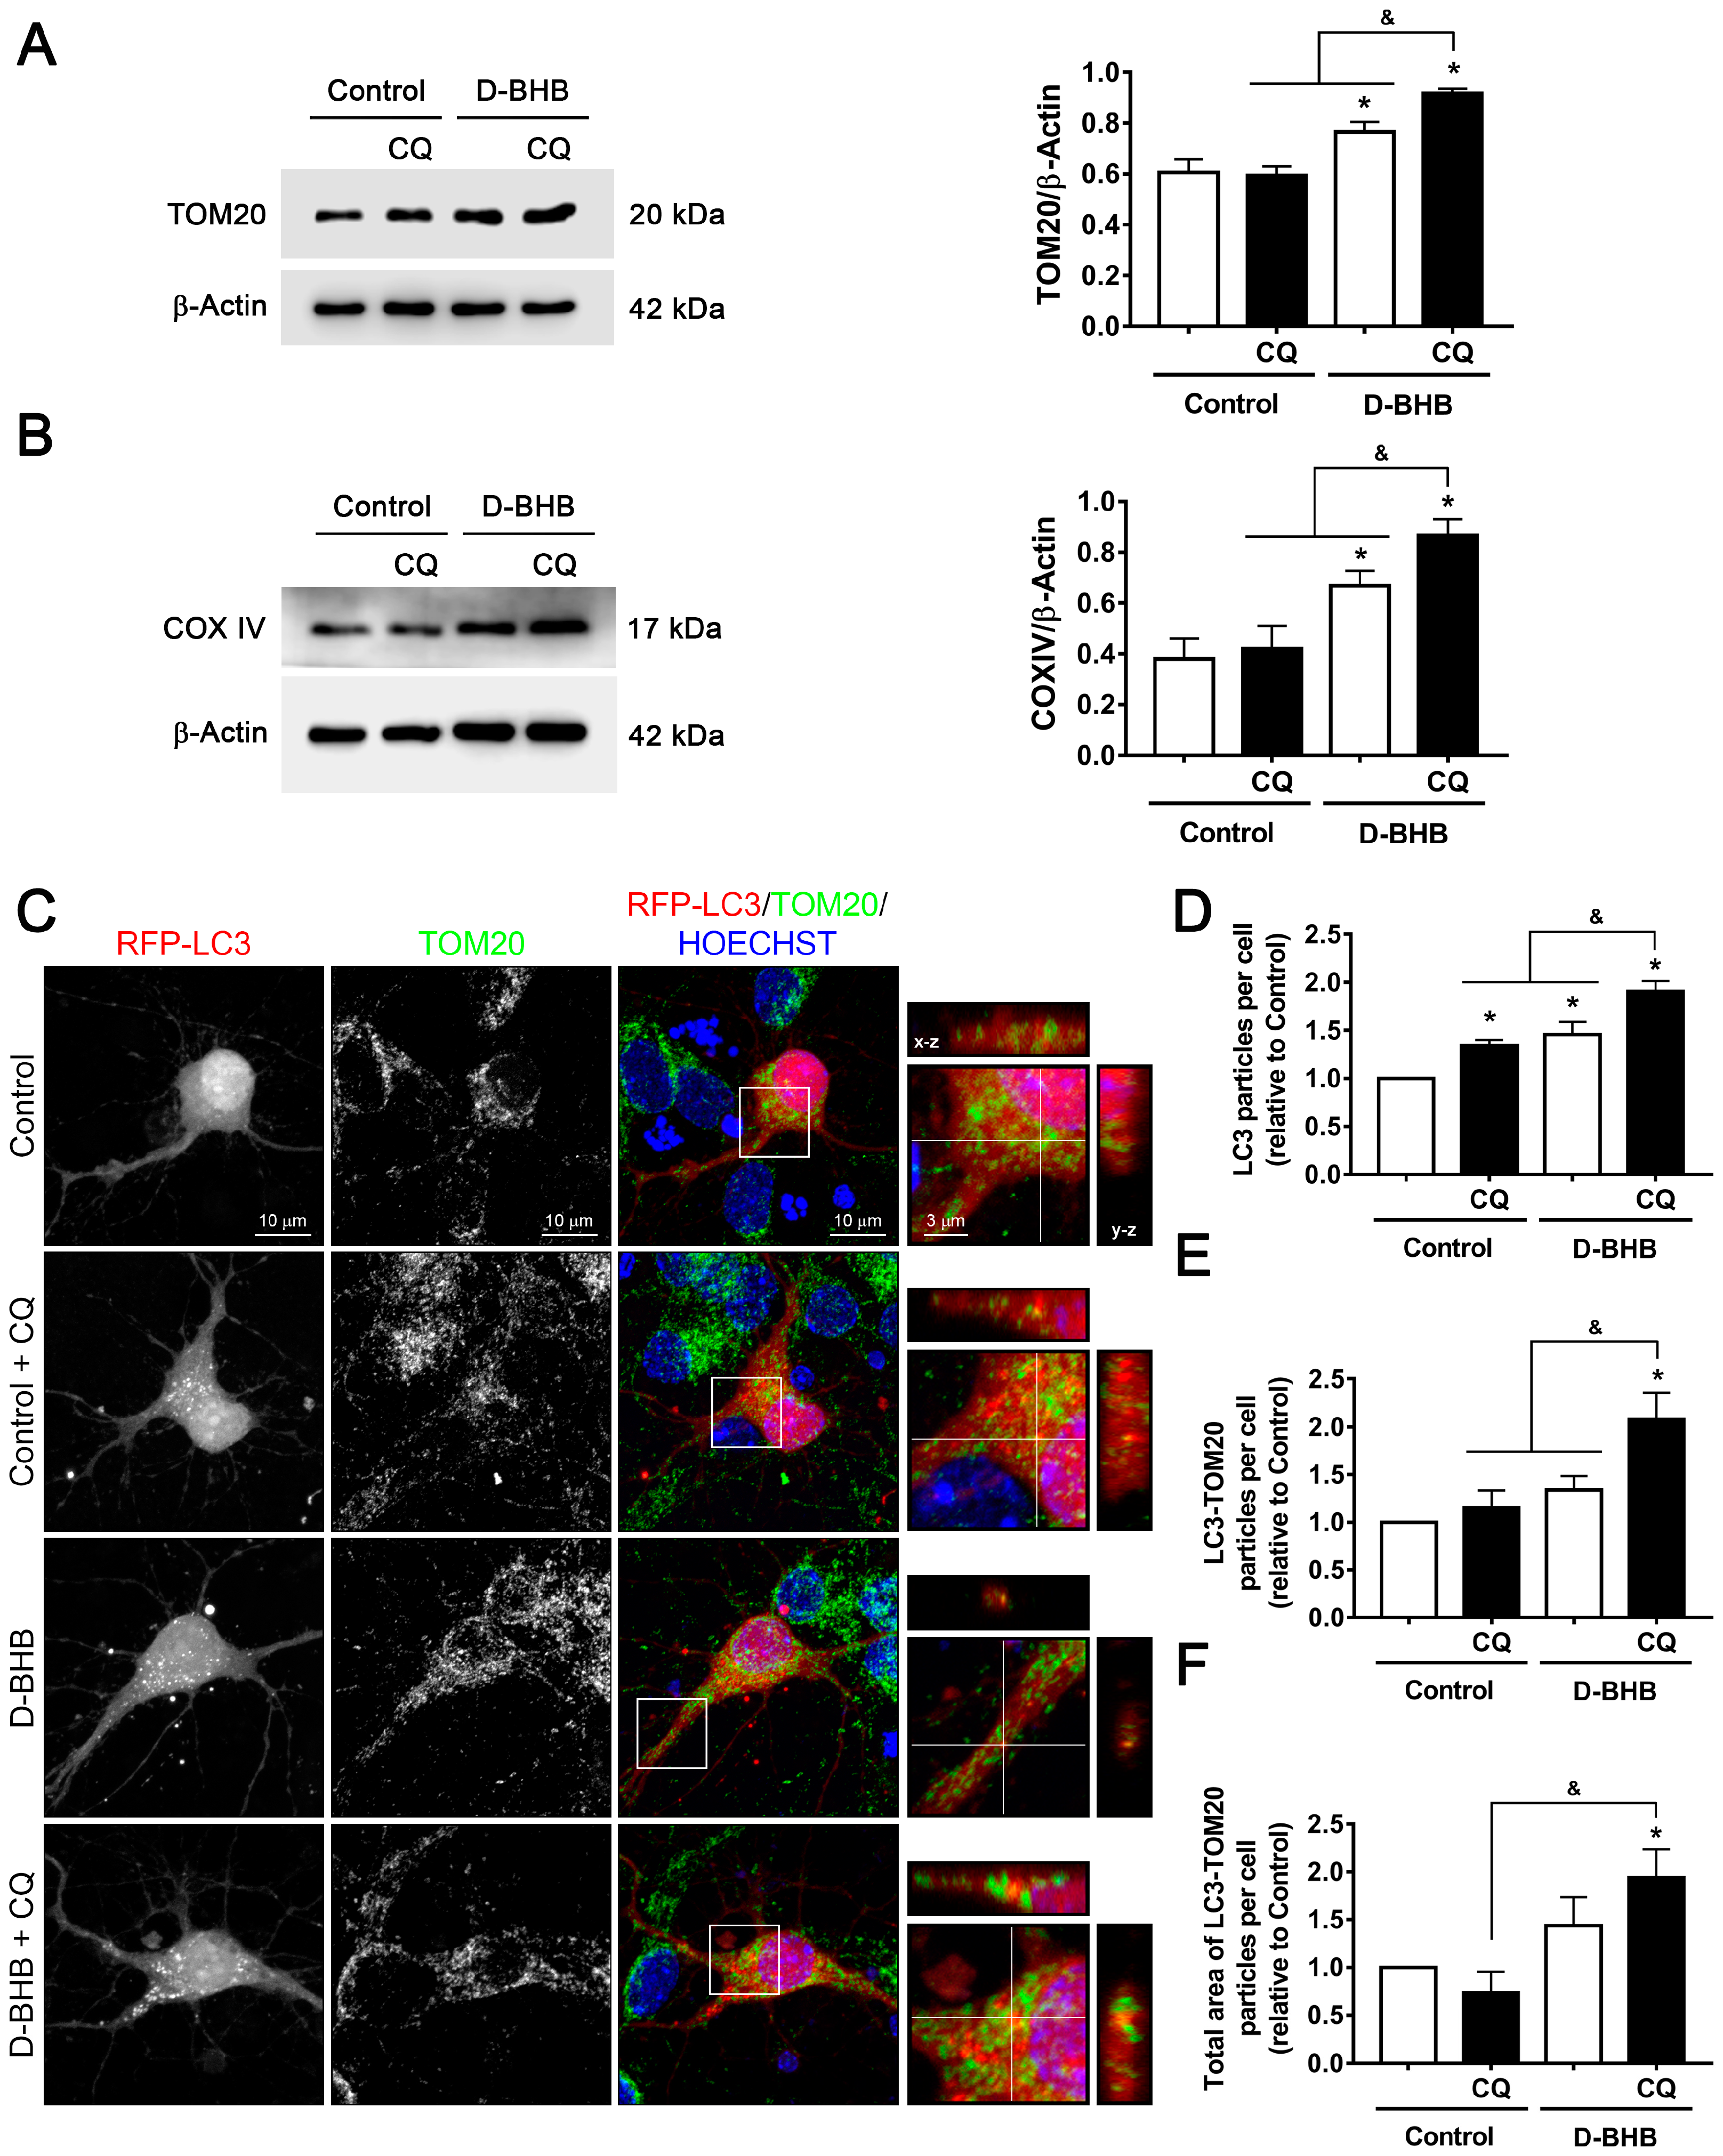
3.3. D-BHB Treatment Promotes Mitophagy in Cortical Neurons
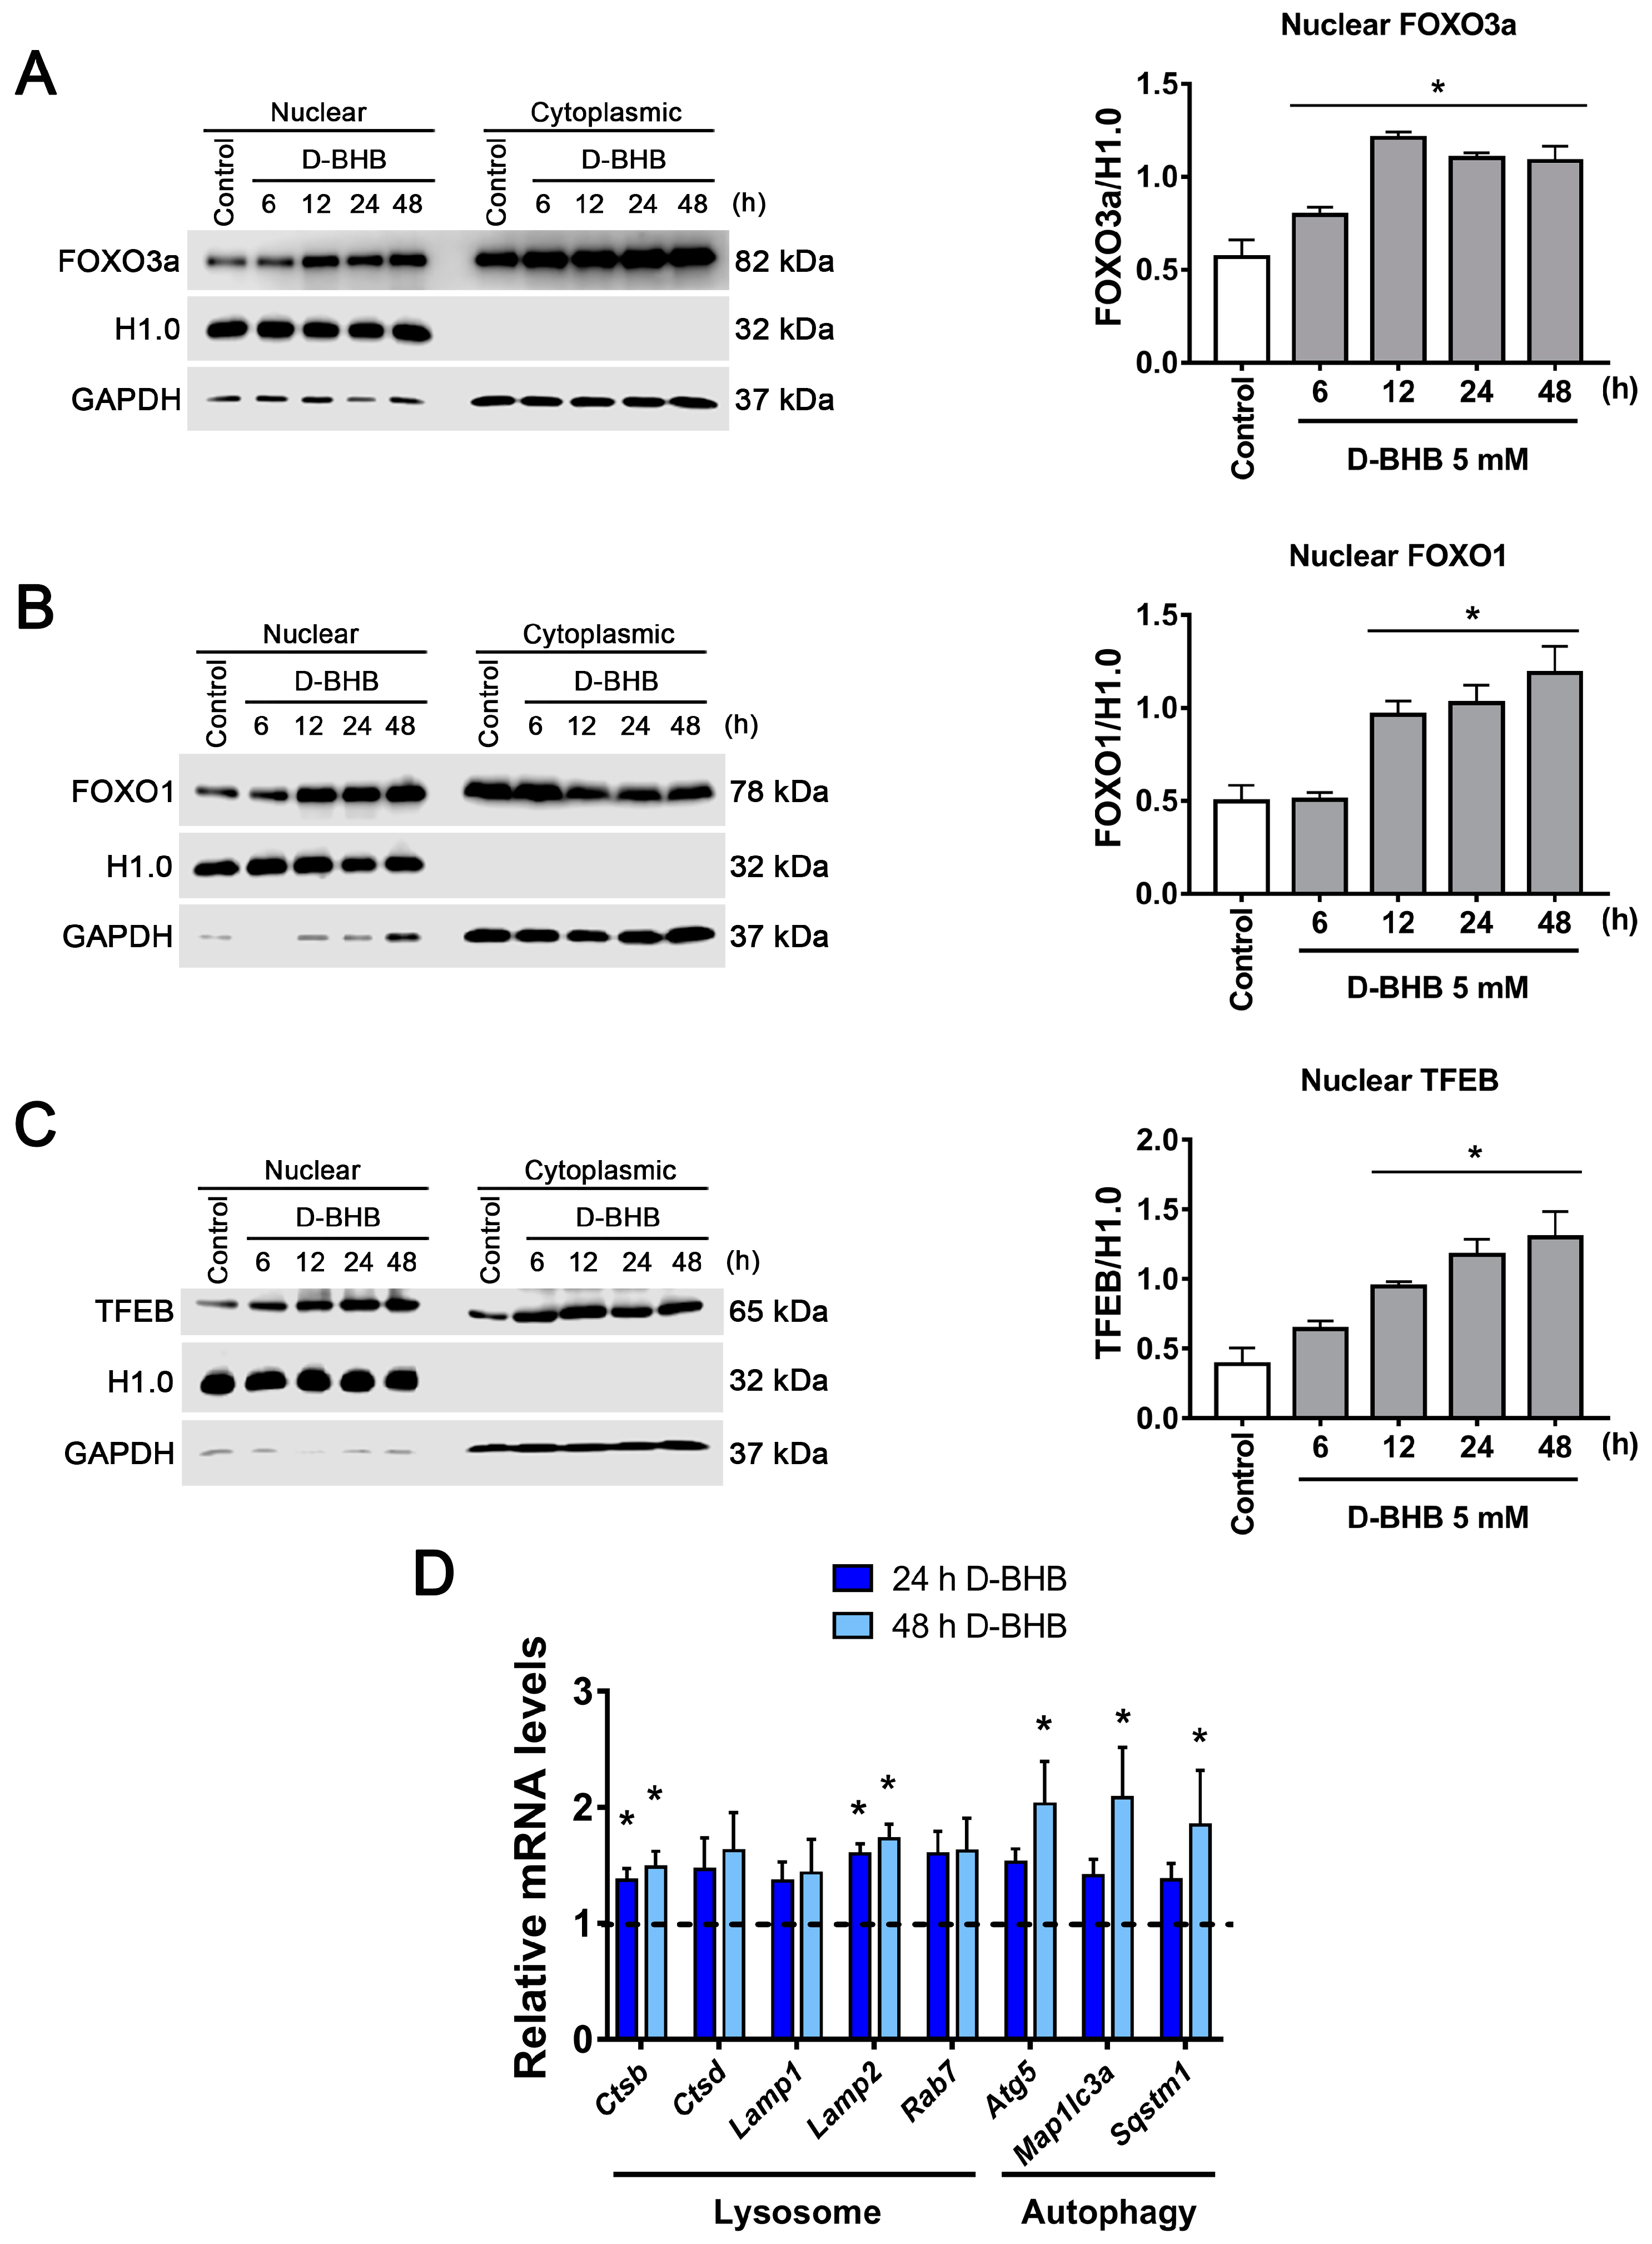
3.4. D-BHB Promotes Nuclear Translocation of Transcription Factors Essential for Autophagy and Lysosomal Biogenesis
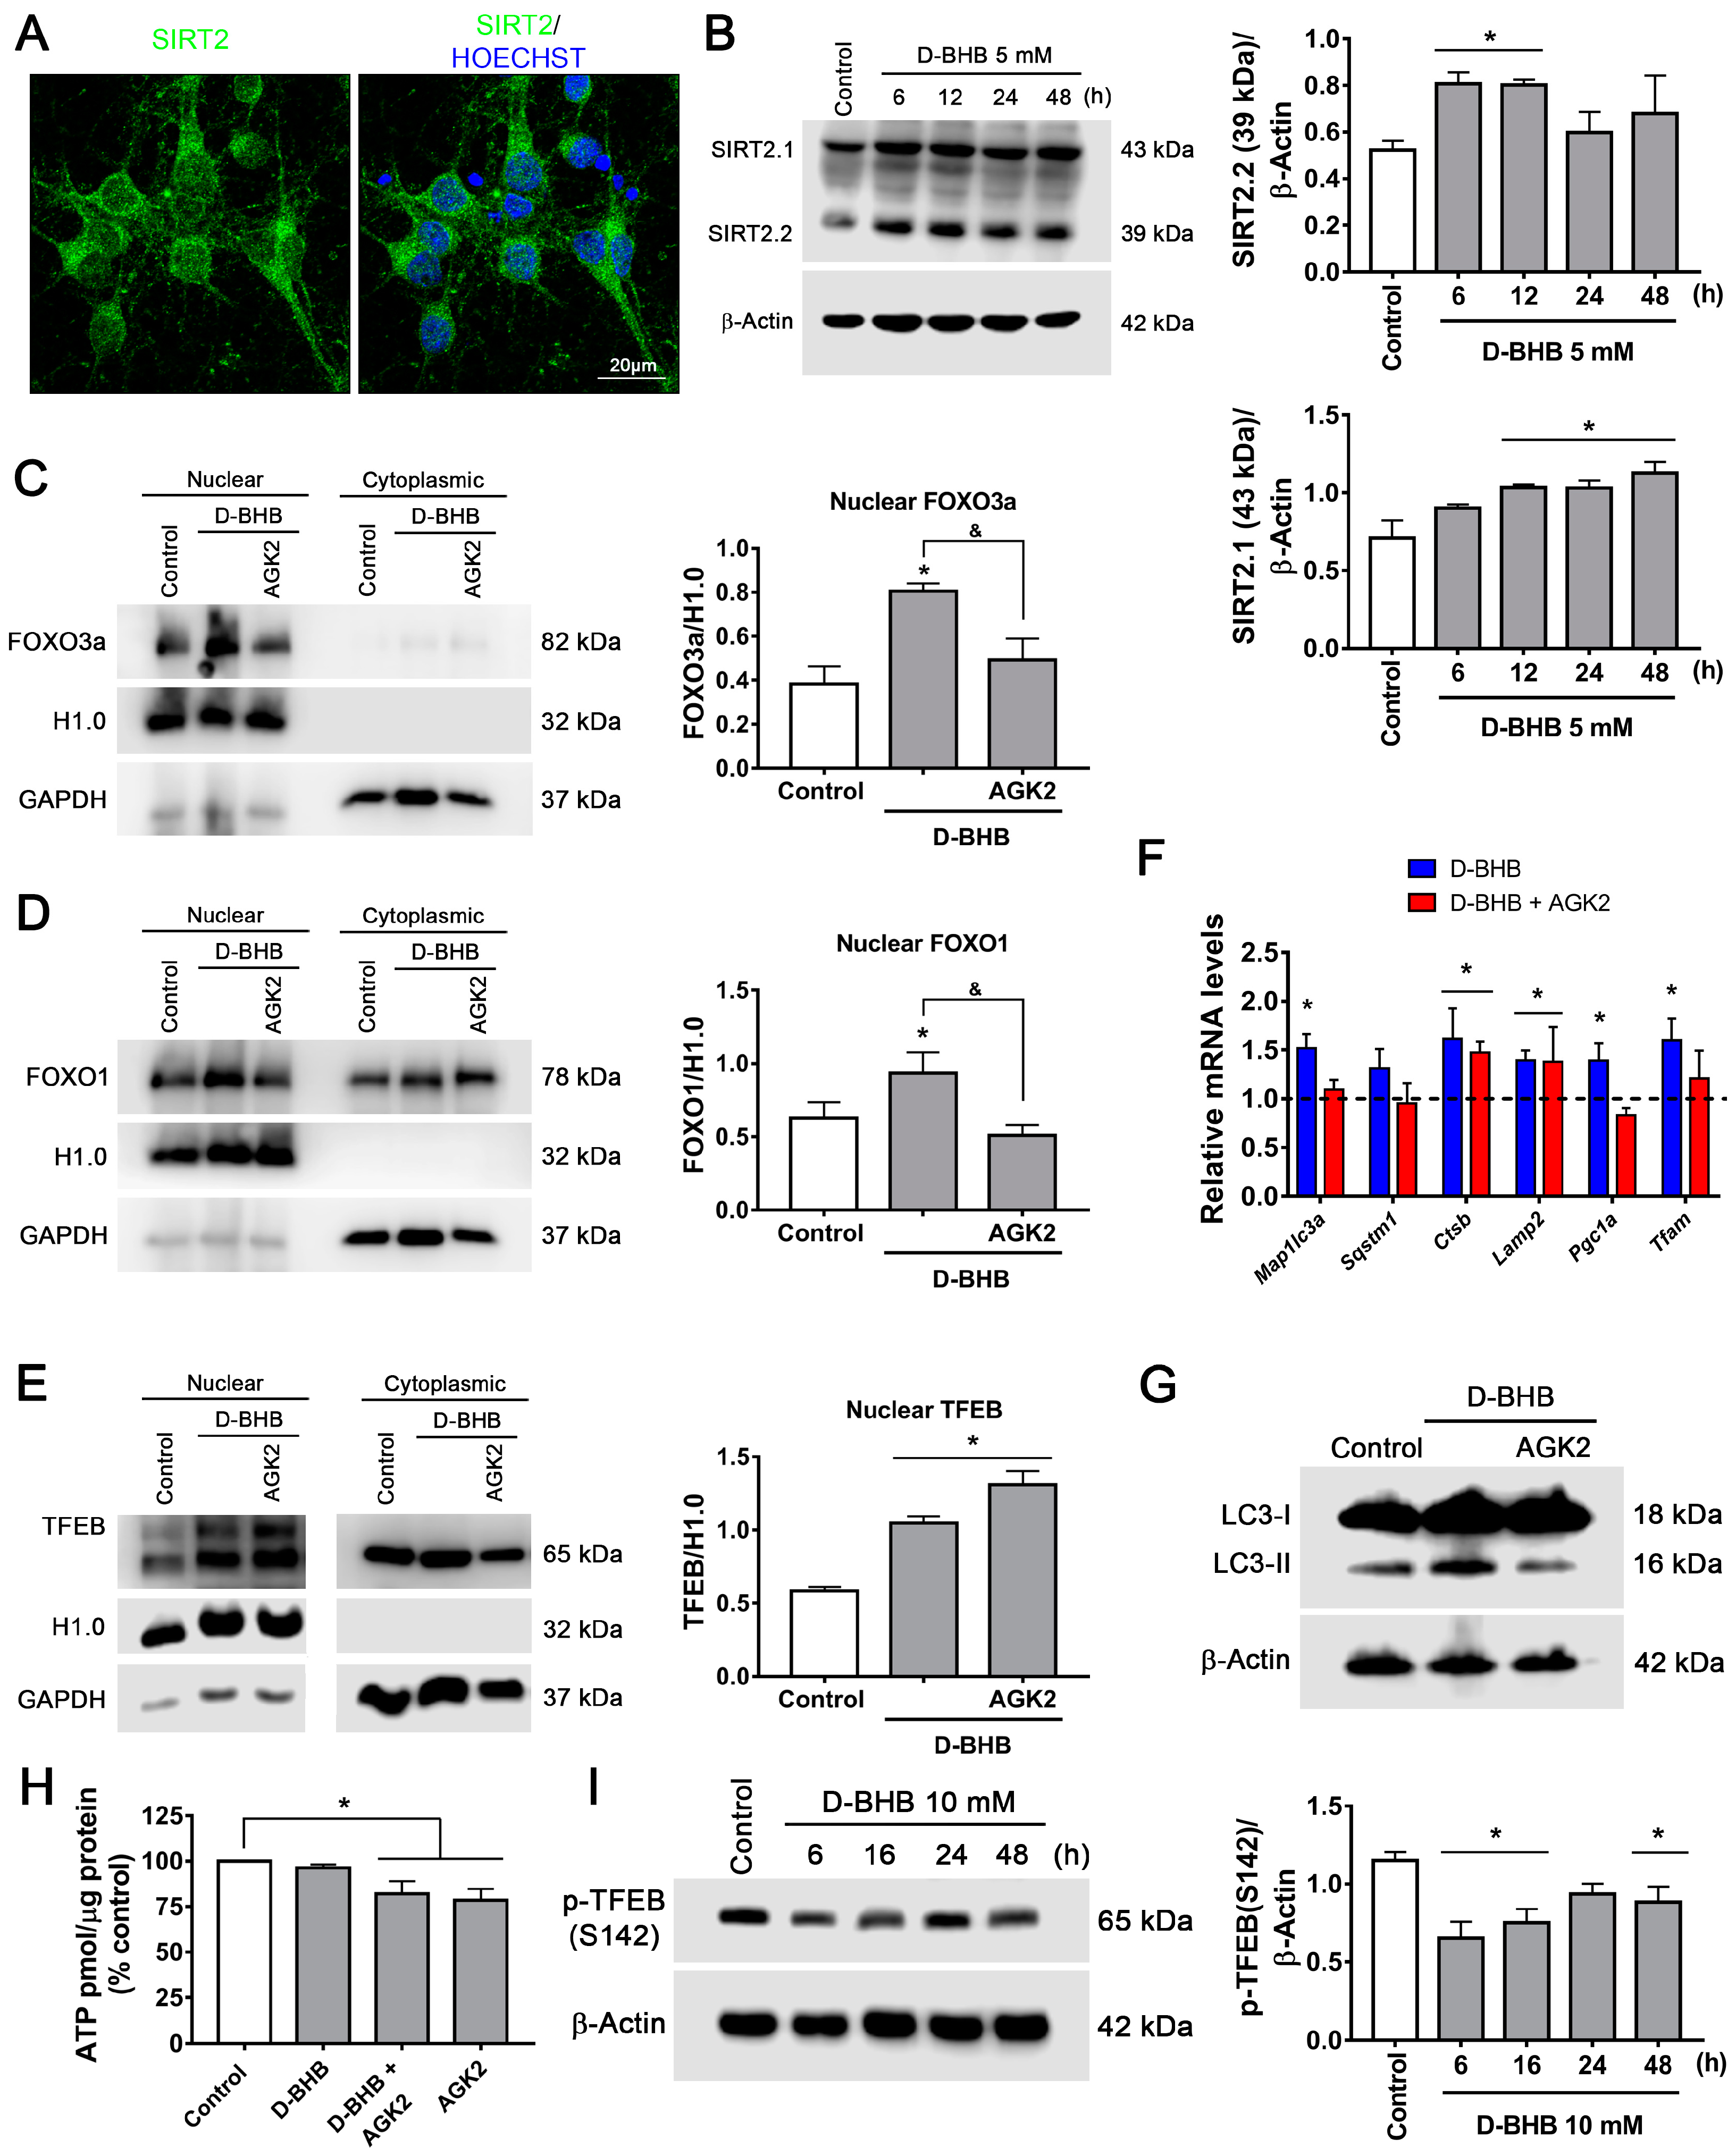
3.5. SIRT2 Upregulation by D-BHB Mediates the Translocation of Transcription Factors Essential for Autophagy and Lysosomal Biogenesis
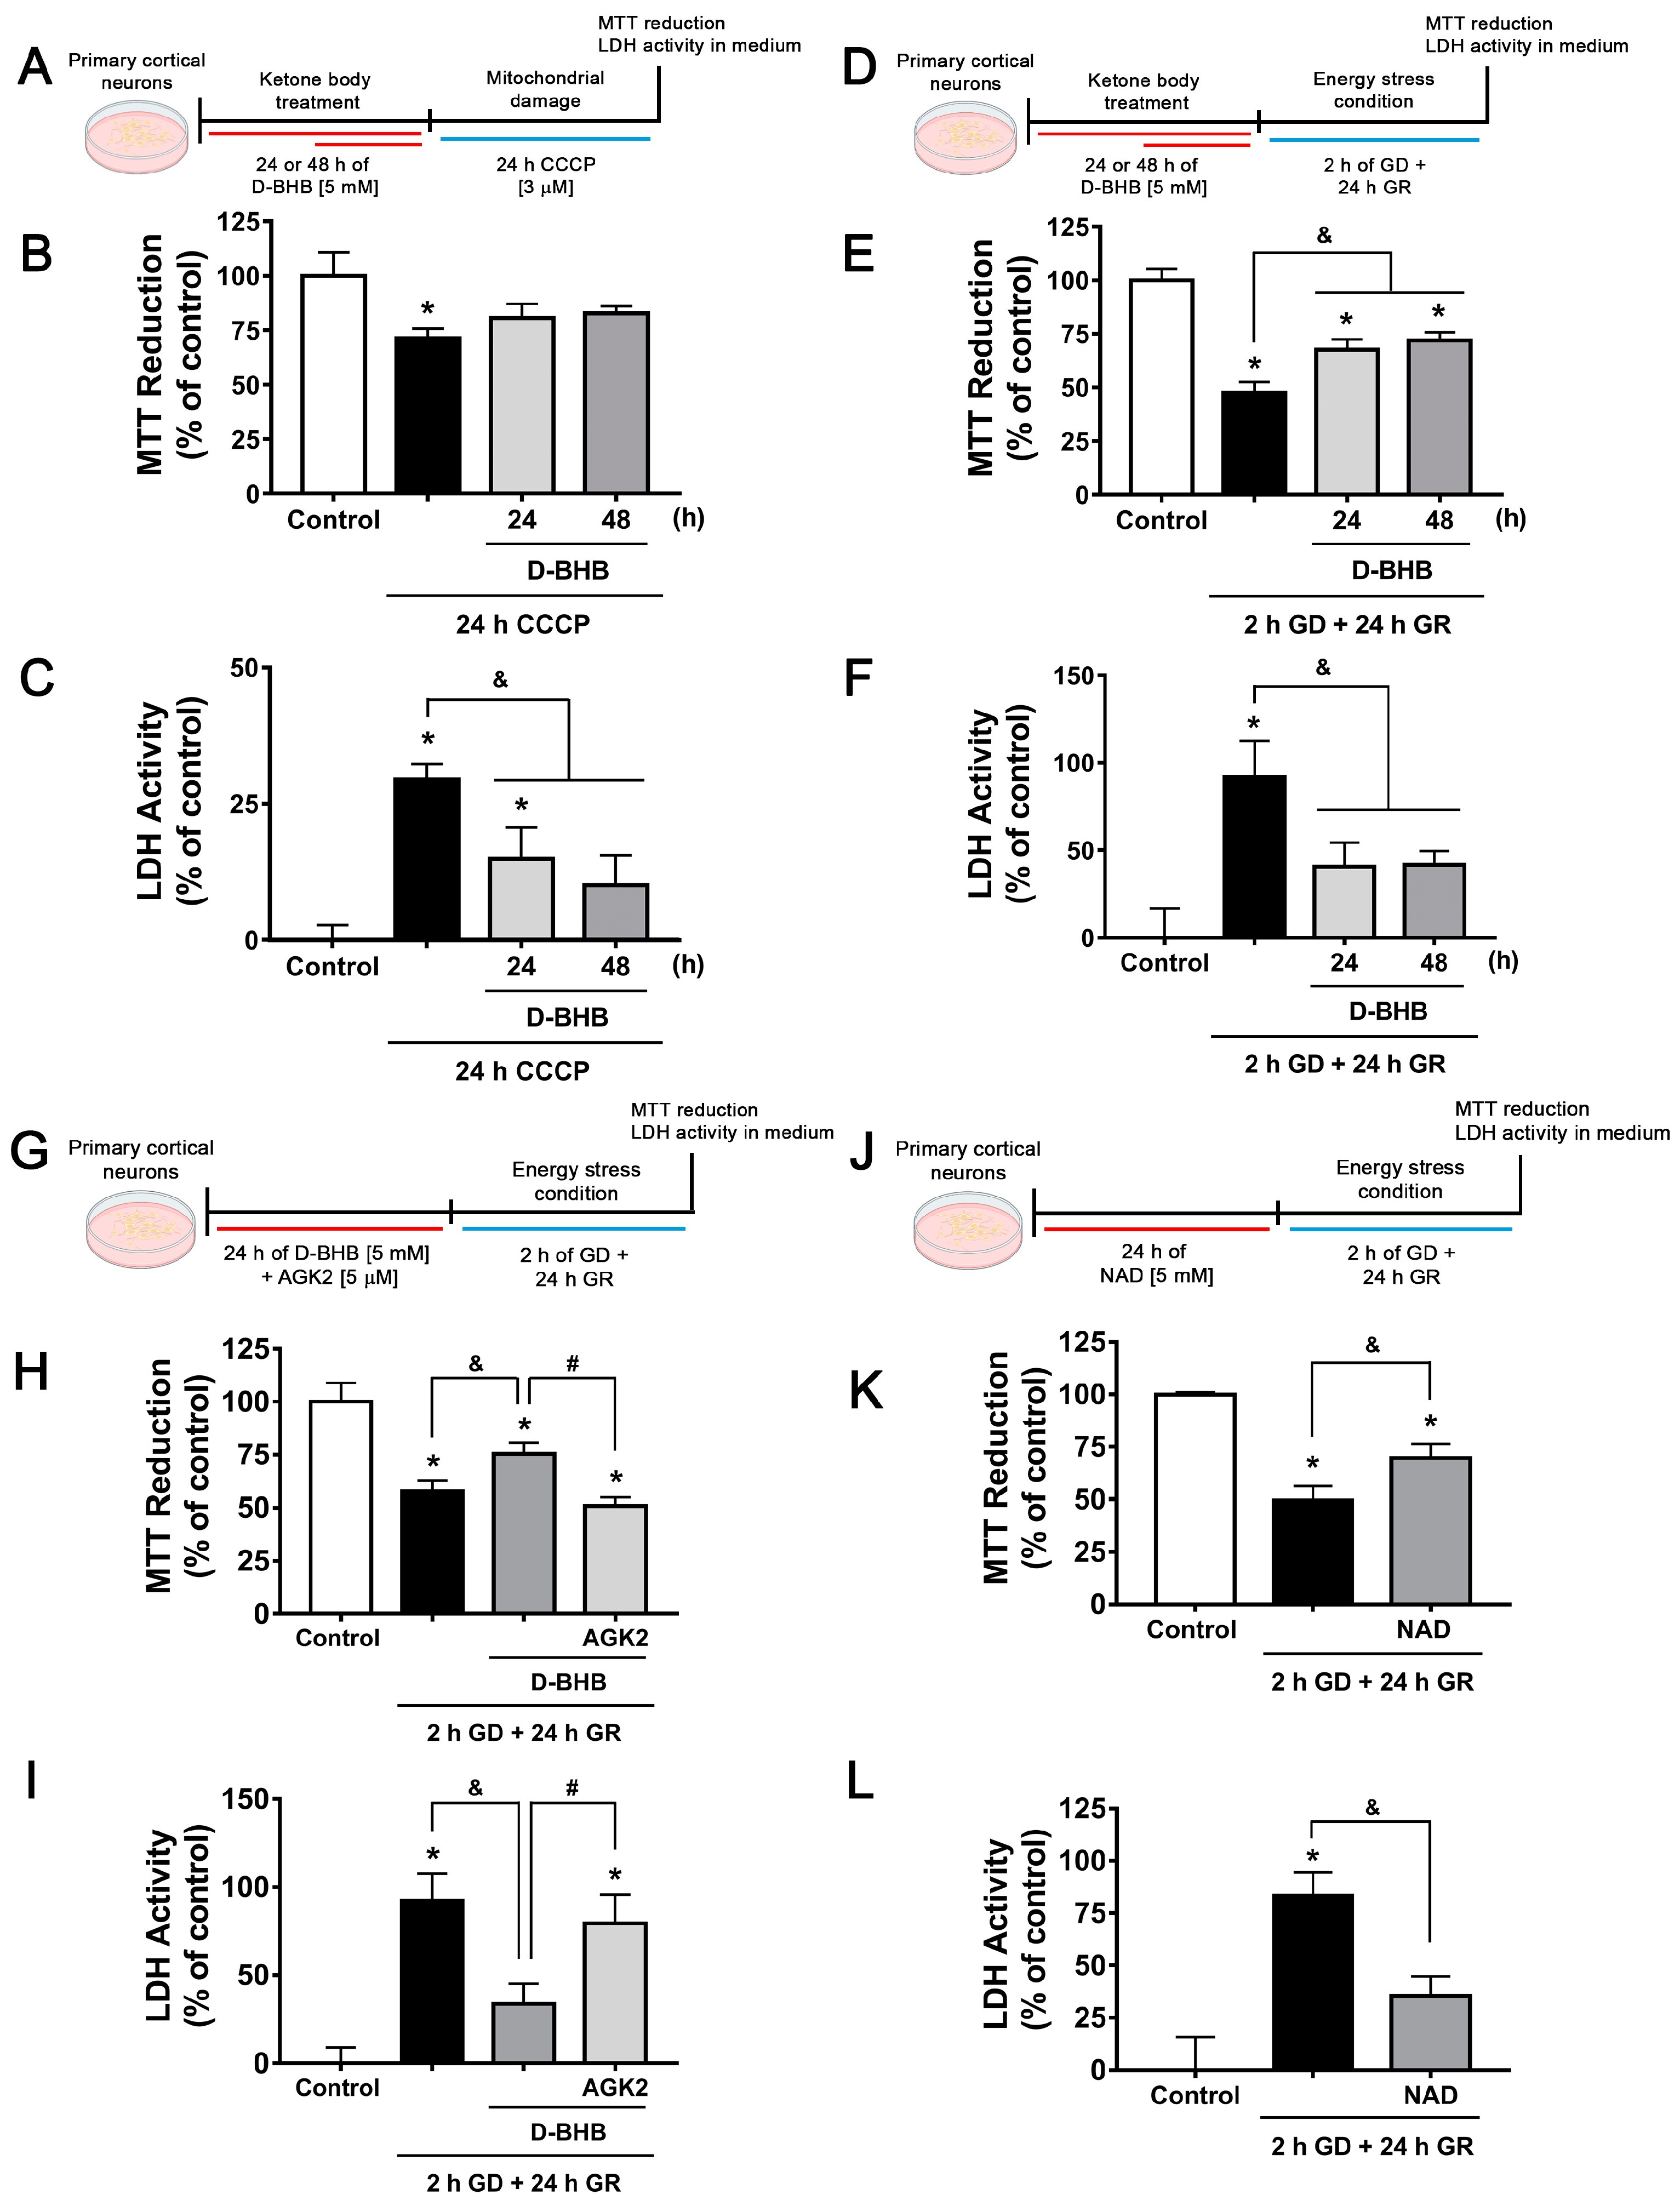
3.6. Continuous Exposure to D-BHB Protects against Energy Stress-Induced Neuronal Death in a SIRT2-Dependent Manner
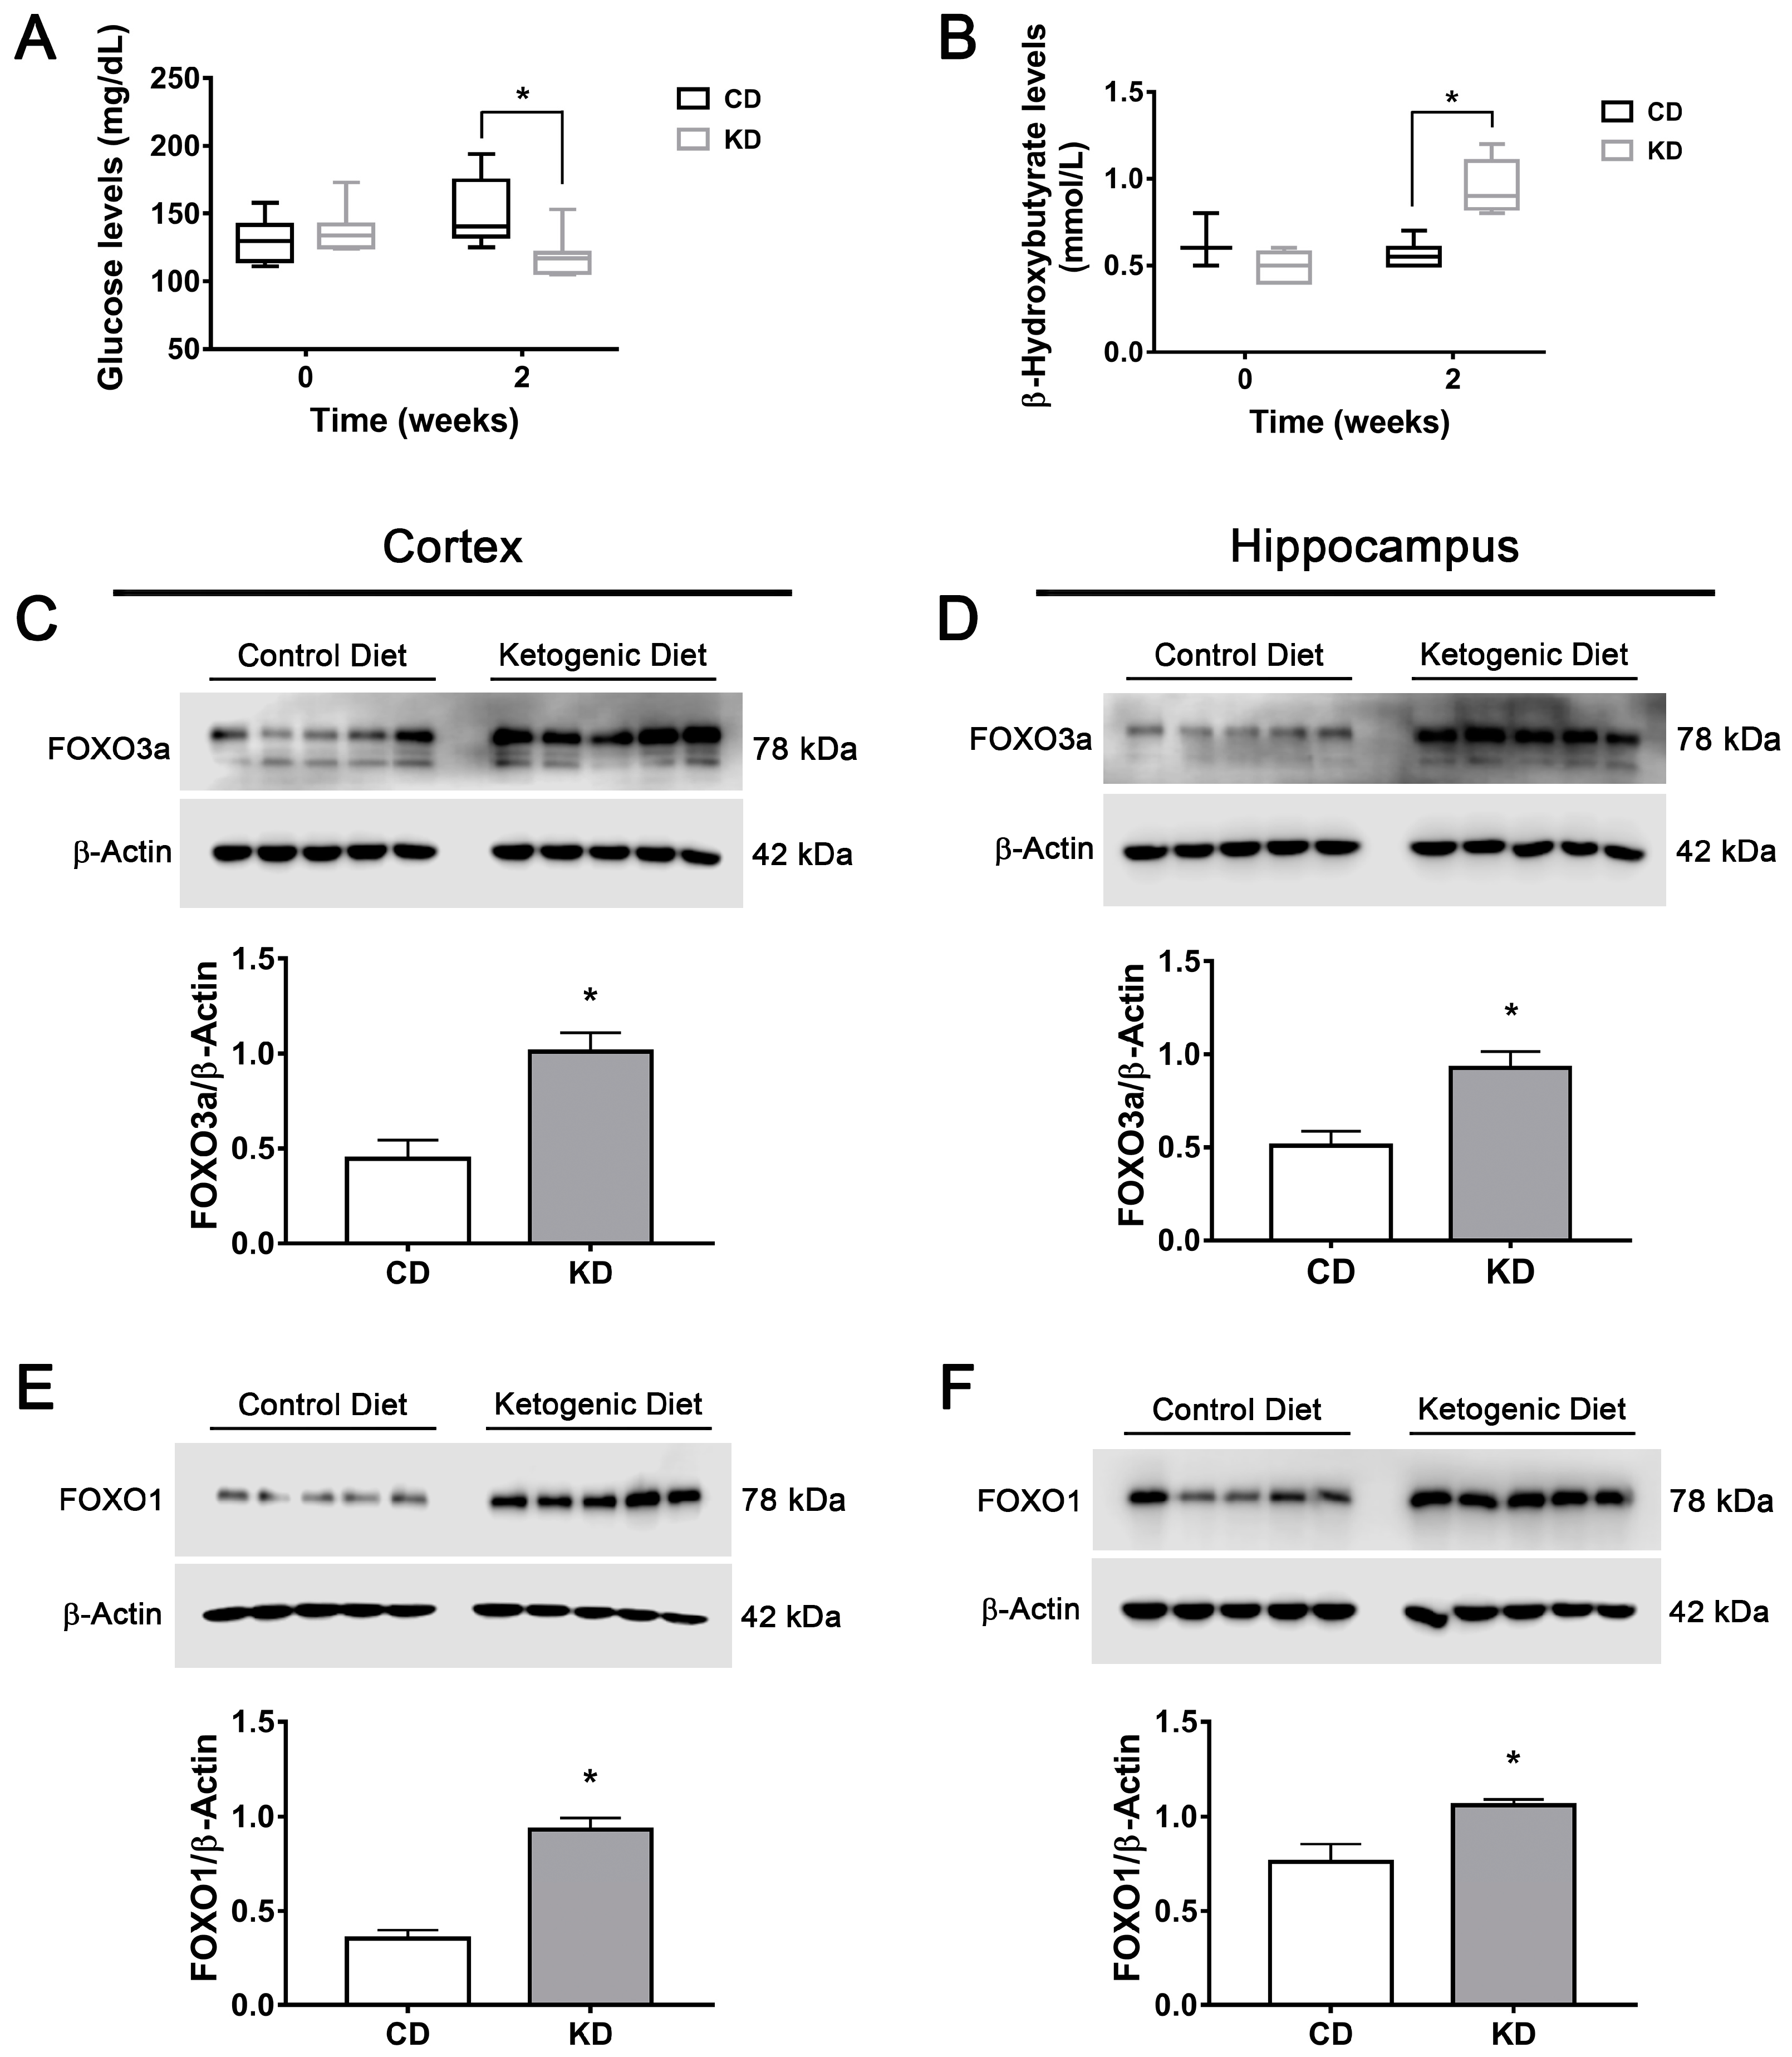
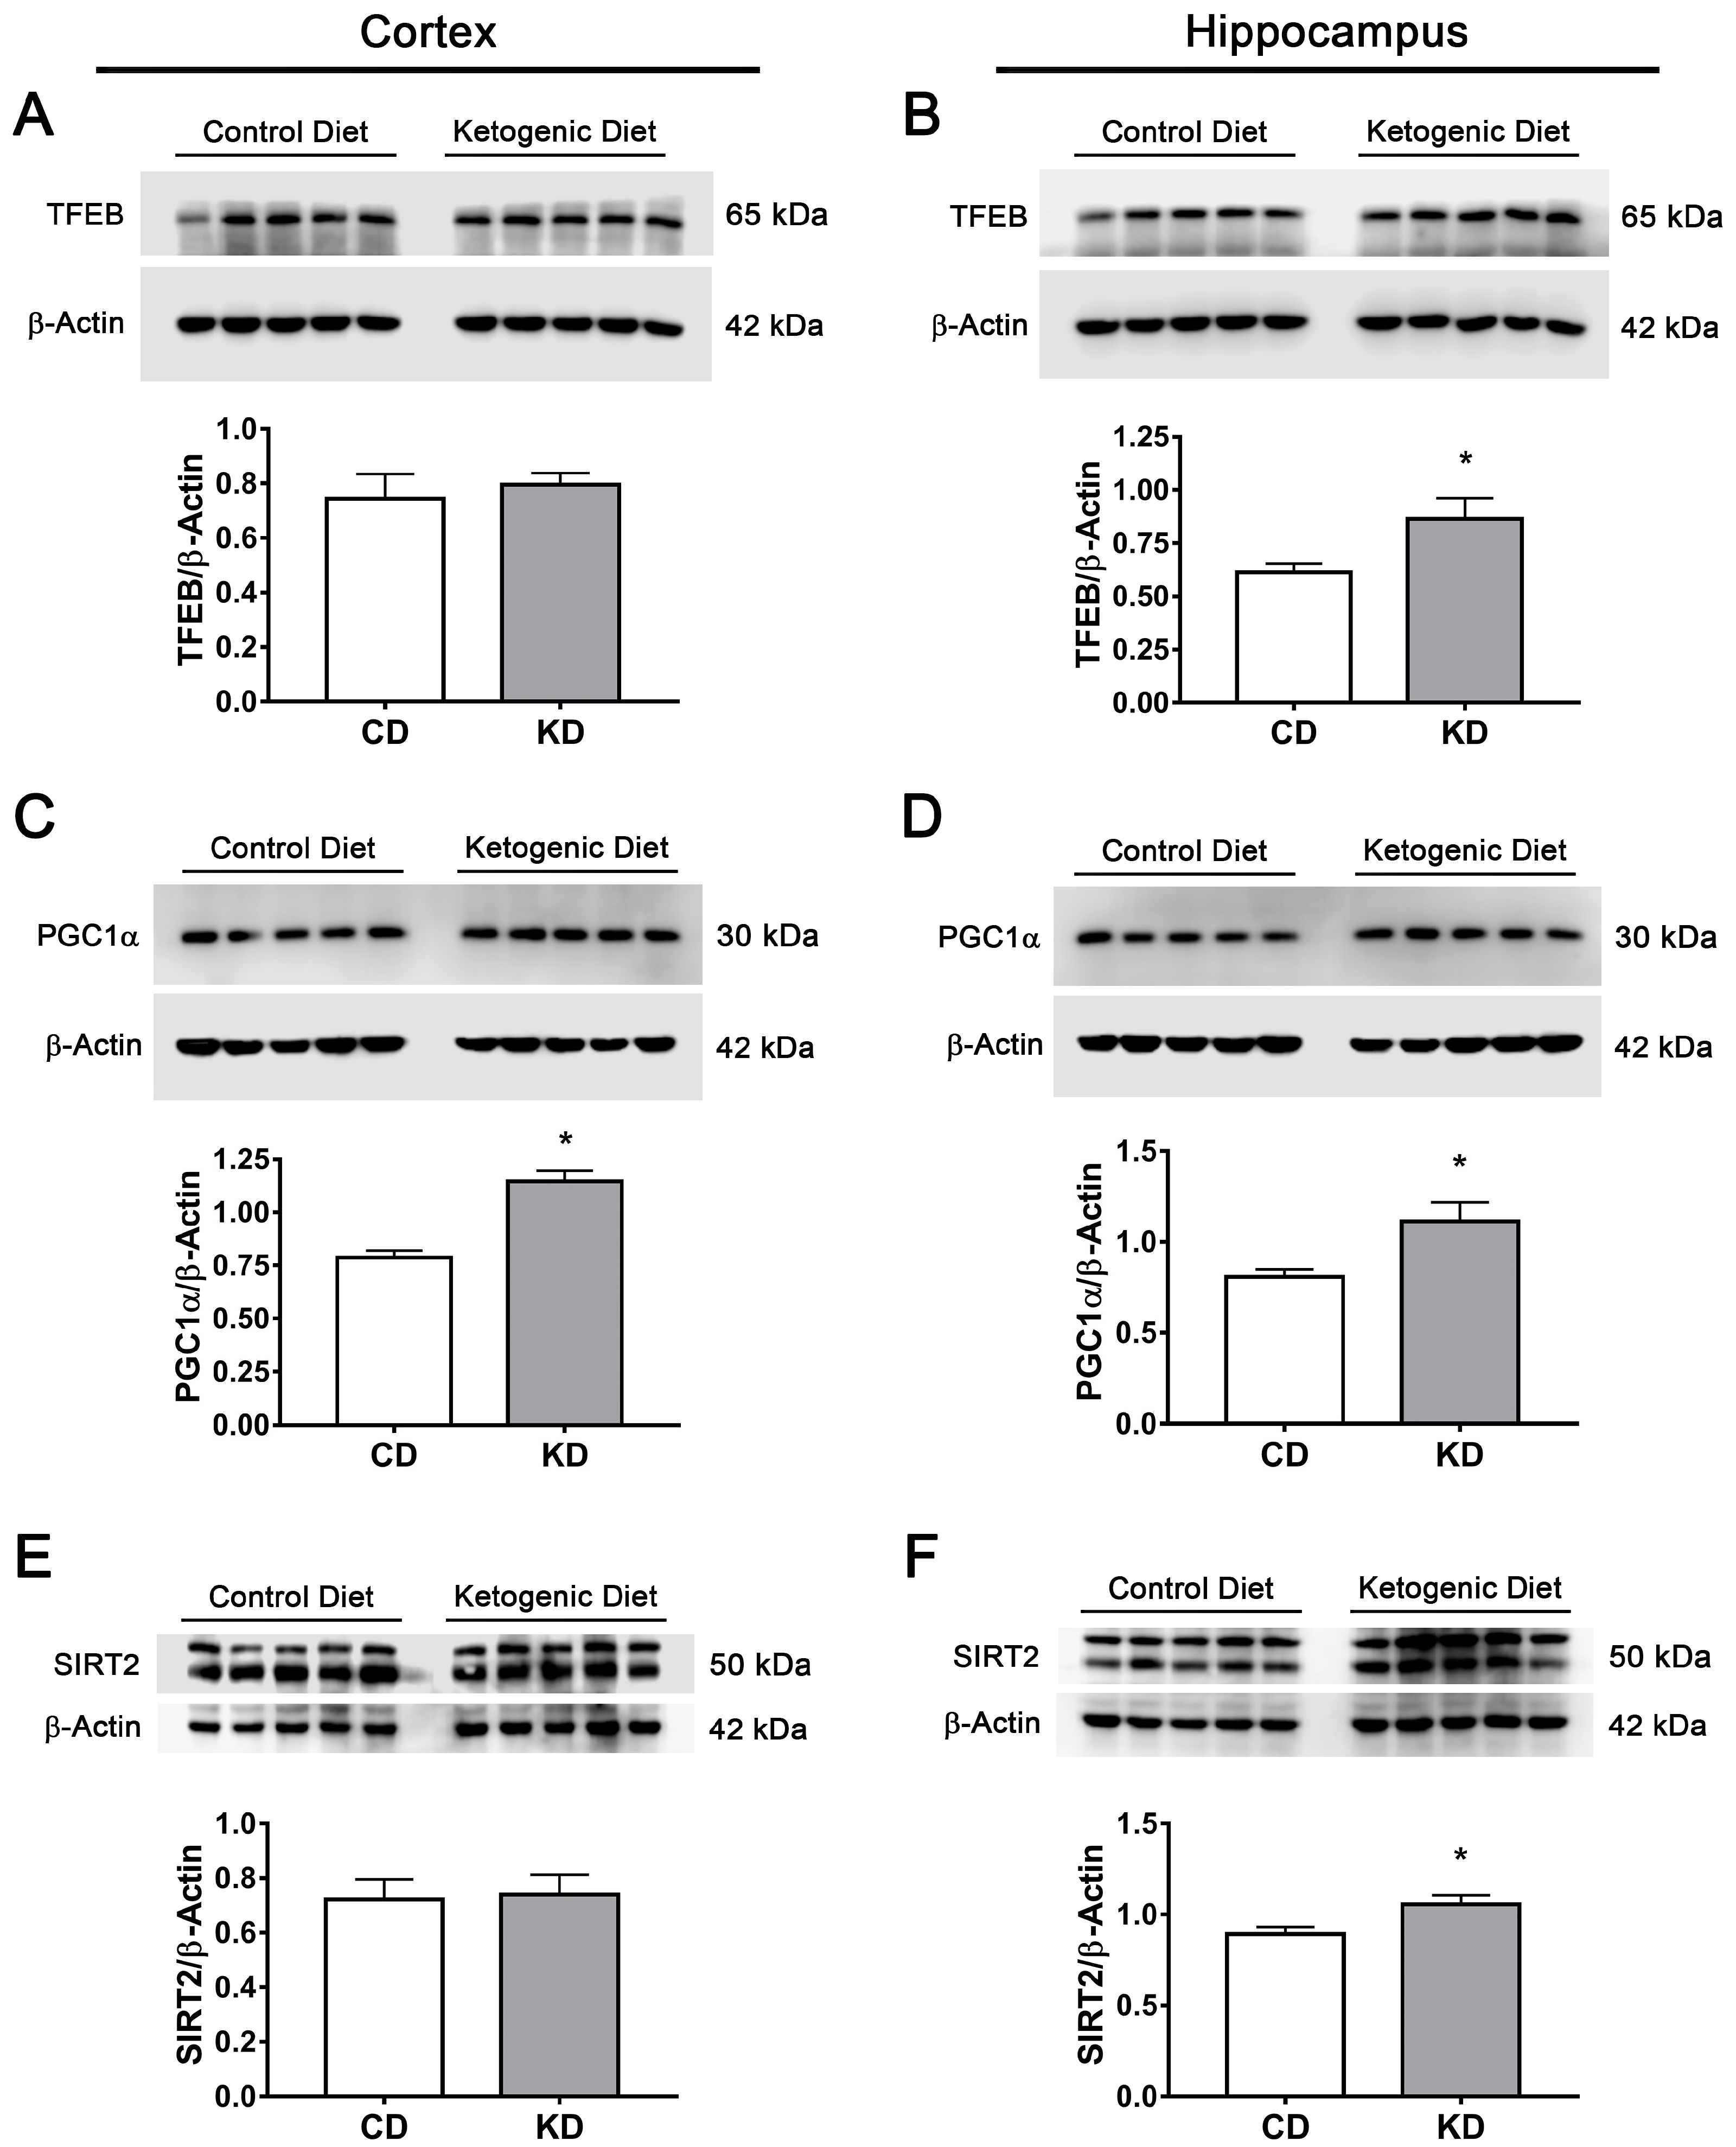
3.7. The Ketogenic Diet Upregulates FOXO1, FOXO3a, TFEB and PGC1α in the Mouse Brain
3.8. The Ketogenic Diet Stimulates Autophagy and Mitophagy in the Mouse Brain
4. Discussion
4.1. D-BHB Stimulate Mitochondrial Turnover
4.2. D-BHB Promotes the Autophagy–Lysosomal Pathway through the Regulation of Master Transcription Factors
4.3. SIRT2 Mediates Mitochondrial Turnover and Autophagy Regulation by D-BHB
5. Conclusions
Supplementary Materials
Author Contributions
Funding
Institutional Review Board Statement
Informed Consent Statement
Data Availability Statement
Acknowledgments
Conflicts of Interest
References
- Belanger, M.; Allaman, I.; Magistretti, P.J. Brain energy metabolism: Focus on astrocyte-neuron metabolic cooperation. Cell Metab. 2011, 14, 724–738. [Google Scholar] [CrossRef]
- Dienel, G.A. Brain Glucose Metabolism: Integration of Energetics with Function. Physiol. Rev. 2019, 99, 949–1045. [Google Scholar] [CrossRef] [PubMed]
- Markaki, M.; Tsagkari, D.; Tavernarakis, N. Mitophagy mechanisms in neuronal physiology and pathology during ageing. Biophys. Rev. 2021, 13, 955–965. [Google Scholar] [CrossRef]
- Wang, Y.; Liu, N.; Lu, B. Mechanisms and roles of mitophagy in neurodegenerative diseases. CNS Neurosci. Ther. 2019, 25, 859–875. [Google Scholar] [CrossRef]
- Egan, D.; Kim, J.; Shaw, R.J.; Guan, K.L. The autophagy initiating kinase ULK1 is regulated via opposing phosphorylation by AMPK and mTOR. Autophagy 2011, 7, 643–644. [Google Scholar] [CrossRef] [PubMed]
- Kim, J.; Kundu, M.; Viollet, B.; Guan, K.L. AMPK and mTOR regulate autophagy through direct phosphorylation of Ulk1. Nat. Cell Biol. 2011, 13, 132–141. [Google Scholar] [CrossRef] [PubMed]
- Haces, M.L.; Hernandez-Fonseca, K.; Medina-Campos, O.N.; Montiel, T.; Pedraza-Chaverri, J.; Massieu, L. Antioxidant capacity contributes to protection of ketone bodies against oxidative damage induced during hypoglycemic conditions. Exp. Neurol. 2008, 211, 85–96. [Google Scholar] [CrossRef]
- Julio-Amilpas, A.; Montiel, T.; Soto-Tinoco, E.; Geronimo-Olvera, C.; Massieu, L. Protection of hypoglycemia-induced neuronal death by beta-hydroxybutyrate involves the preservation of energy levels and decreased production of reactive oxygen species. J. Cereb. Blood Flow Metab. 2015, 35, 851–860. [Google Scholar] [CrossRef] [PubMed]
- Torres-Esquivel, C.; Montiel, T.; Flores-Mendez, M.; Massieu, L. Effect of beta-Hydroxybutyrate on Autophagy Dynamics During Severe Hypoglycemia and the Hypoglycemic Coma. Front. Cell. Neurosci. 2020, 14, 547215. [Google Scholar] [CrossRef]
- Camberos-Luna, L.; Geronimo-Olvera, C.; Montiel, T.; Rincon-Heredia, R.; Massieu, L. The Ketone Body, beta-Hydroxybutyrate Stimulates the Autophagic Flux and Prevents Neuronal Death Induced by Glucose Deprivation in Cortical Cultured Neurons. Neurochem. Res. 2016, 41, 600–609. [Google Scholar] [CrossRef]
- Camberos-Luna, L.; Massieu, L. Therapeutic strategies for ketosis induction and their potential efficacy for the treatment of acute brain injury and neurodegenerative diseases. Neurochem. Int. 2020, 133, 104614. [Google Scholar] [CrossRef]
- Sokoloff, L. Metabolism of ketone bodies by the brain. Annu. Rev. Med. 1973, 24, 271–280. [Google Scholar] [CrossRef]
- Shimazu, T.; Hirschey, M.D.; Newman, J.; He, W.; Shirakawa, K.; Le Moan, N.; Grueter, C.A.; Lim, H.; Saunders, L.R.; Stevens, R.D.; et al. Suppression of oxidative stress by beta-hydroxybutyrate, an endogenous histone deacetylase inhibitor. Science 2013, 339, 211–214. [Google Scholar] [CrossRef] [PubMed]
- Xie, Z.; Zhang, D.; Chung, D.; Tang, Z.; Huang, H.; Dai, L.; Qi, S.; Li, J.; Colak, G.; Chen, Y.; et al. Metabolic Regulation of Gene Expression by Histone Lysine beta-Hydroxybutyrylation. Mol. Cell 2016, 62, 194–206. [Google Scholar] [CrossRef]
- Youm, Y.H.; Nguyen, K.Y.; Grant, R.W.; Goldberg, E.L.; Bodogai, M.; Kim, D.; D’Agostino, D.; Planavsky, N.; Lupfer, C.; Kanneganti, T.D.; et al. The ketone metabolite beta-hydroxybutyrate blocks NLRP3 inflammasome-mediated inflammatory disease. Nat. Med. 2015, 21, 263–269. [Google Scholar] [CrossRef]
- Kimura, I.; Inoue, D.; Maeda, T.; Hara, T.; Ichimura, A.; Miyauchi, S.; Kobayashi, M.; Hirasawa, A.; Tsujimoto, G. Short-chain fatty acids and ketones directly regulate sympathetic nervous system via G protein-coupled receptor 41 (GPR41). Proc. Natl. Acad. Sci. USA 2011, 108, 8030–8035. [Google Scholar] [CrossRef] [PubMed]
- Rahman, M.; Muhammad, S.; Khan, M.A.; Chen, H.; Ridder, D.A.; Muller-Fielitz, H.; Pokorna, B.; Vollbrandt, T.; Stolting, I.; Nadrowitz, R.; et al. The beta-hydroxybutyrate receptor HCA2 activates a neuroprotective subset of macrophages. Nat. Commun. 2014, 5, 3944. [Google Scholar] [CrossRef] [PubMed]
- Marosi, K.; Kim, S.W.; Moehl, K.; Scheibye-Knudsen, M.; Cheng, A.; Cutler, R.; Camandola, S.; Mattson, M.P. 3-Hydroxybutyrate regulates energy metabolism and induces BDNF expression in cerebral cortical neurons. J. Neurochem. 2016, 139, 769–781. [Google Scholar] [CrossRef] [PubMed]
- Xin, L.; Ipek, O.; Beaumont, M.; Shevlyakova, M.; Christinat, N.; Masoodi, M.; Greenberg, N.; Gruetter, R.; Cuenoud, B. Nutritional Ketosis Increases NAD(+)/NADH Ratio in Healthy Human Brain: An in Vivo Study by (31)P-MRS. Front. Nutr. 2018, 5, 62. [Google Scholar] [CrossRef]
- Nakagawa, T.; Guarente, L. Sirtuins at a glance. J. Cell Sci. 2011, 124, 833–838. [Google Scholar] [CrossRef] [Green Version]
- Mammucari, C.; Milan, G.; Romanello, V.; Masiero, E.; Rudolf, R.; Del Piccolo, P.; Burden, S.J.; Di Lisi, R.; Sandri, C.; Zhao, J.; et al. FoxO3 controls autophagy in skeletal muscle in vivo. Cell Metab. 2007, 6, 458–471. [Google Scholar] [CrossRef] [PubMed]
- Mei, Y.; Zhang, Y.; Yamamoto, K.; Xie, W.; Mak, T.W.; You, H. FOXO3a-dependent regulation of Pink1 (Park6) mediates survival signaling in response to cytokine deprivation. Proc. Natl. Acad. Sci. USA 2009, 106, 5153–5158. [Google Scholar] [CrossRef] [PubMed]
- Hariharan, N.; Maejima, Y.; Nakae, J.; Paik, J.; Depinho, R.A.; Sadoshima, J. Deacetylation of FoxO by Sirt1 Plays an Essential Role in Mediating Starvation-Induced Autophagy in Cardiac Myocytes. Circ. Res. 2010, 107, 1470–1482. [Google Scholar] [CrossRef]
- Bao, J.; Zheng, L.; Zhang, Q.; Li, X.; Zhang, X.; Li, Z.; Bai, X.; Zhang, Z.; Huo, W.; Zhao, X.; et al. Deacetylation of TFEB promotes fibrillar Abeta degradation by upregulating lysosomal biogenesis in microglia. Protein Cell 2016, 7, 417–433. [Google Scholar] [CrossRef]
- Wan, W.; Hua, F.; Fang, P.; Li, C.; Deng, F.; Chen, S.; Ying, J.; Wang, X. Regulation of Mitophagy by Sirtuin Family Proteins: A Vital Role in Aging and Age-Related Diseases. Front. Aging Neurosci. 2022, 14, 845330. [Google Scholar] [CrossRef]
- Bestvater, F.; Spiess, E.; Stobrawa, G.; Hacker, M.; Feurer, T.; Porwol, T.; Berchner-Pfannschmidt, U.; Wotzlaw, C.; Acker, H. Two-photon fluorescence absorption and emission spectra of dyes relevant for cell imaging. J. Microsc. 2002, 208, 108–115. [Google Scholar] [CrossRef]
- Heikal, A.A. Intracellular coenzymes as natural biomarkers for metabolic activities and mitochondrial anomalies. Biomark. Med. 2010, 4, 241–263. [Google Scholar] [CrossRef]
- Huang, S.; Heikal, A.A.; Webb, W.W. Two-photon fluorescence spectroscopy and microscopy of NAD(P)H and flavoprotein. Biophys. J. 2002, 82, 2811–2825. [Google Scholar] [CrossRef]
- Hasan-Olive, M.M.; Lauritzen, K.H.; Ali, M.; Rasmussen, L.J.; Storm-Mathisen, J.; Bergersen, L.H. A Ketogenic Diet Improves Mitochondrial Biogenesis and Bioenergetics via the PGC1alpha-SIRT3-UCP2 Axis. Neurochem. Res. 2019, 44, 22–37. [Google Scholar] [CrossRef]
- Bough, K.J.; Wetherington, J.; Hassel, B.; Pare, J.F.; Gawryluk, J.W.; Greene, J.G.; Shaw, R.; Smith, Y.; Geiger, J.D.; Dingledine, R.J. Mitochondrial biogenesis in the anticonvulsant mechanism of the ketogenic diet. Ann. Neurol. 2006, 60, 223–235. [Google Scholar] [CrossRef] [PubMed]
- Redmann, M.; Benavides, G.A.; Berryhill, T.F.; Wani, W.Y.; Ouyang, X.; Johnson, M.S.; Ravi, S.; Barnes, S.; Darley-Usmar, V.M.; Zhang, J. Inhibition of autophagy with bafilomycin and chloroquine decreases mitochondrial quality and bioenergetic function in primary neurons. Redox Biol. 2017, 11, 73–81. [Google Scholar] [CrossRef]
- Evans, C.S.; Holzbaur, E.L.F. Lysosomal degradation of depolarized mitochondria is rate-limiting in OPTN-dependent neuronal mitophagy. Autophagy 2020, 16, 962–964. [Google Scholar] [CrossRef]
- Kim, D.H.; Park, M.H.; Ha, S.; Bang, E.J.; Lee, Y.; Lee, A.K.; Lee, J.; Yu, B.P.; Chung, H.Y. Anti-inflammatory action of beta-hydroxybutyrate via modulation of PGC-1alpha and FoxO1, mimicking calorie restriction. Aging 2019, 11, 1283–1304. [Google Scholar] [CrossRef]
- Palmieri, M.; Impey, S.; Kang, H.; di Ronza, A.; Pelz, C.; Sardiello, M.; Ballabio, A. Characterization of the CLEAR network reveals an integrated control of cellular clearance pathways. Hum. Mol. Genet. 2011, 20, 3852–3866. [Google Scholar] [CrossRef]
- Settembre, C.; Di Malta, C.; Polito, V.A.; Garcia Arencibia, M.; Vetrini, F.; Erdin, S.; Erdin, S.U.; Huynh, T.; Medina, D.; Colella, P.; et al. TFEB links autophagy to lysosomal biogenesis. Science 2011, 332, 1429–1433. [Google Scholar] [CrossRef]
- Xu, P.; Das, M.; Reilly, J.; Davis, R.J. JNK regulates FoxO-dependent autophagy in neurons. Genes Dev. 2011, 25, 310–322. [Google Scholar] [CrossRef]
- Zhao, J.; Brault, J.J.; Schild, A.; Cao, P.; Sandri, M.; Schiaffino, S.; Lecker, S.H.; Goldberg, A.L. FoxO3 coordinately activates protein degradation by the autophagic/lysosomal and proteasomal pathways in atrophying muscle cells. Cell Metab. 2007, 6, 472–483. [Google Scholar] [CrossRef]
- Maxwell, M.M.; Tomkinson, E.M.; Nobles, J.; Wizeman, J.W.; Amore, A.M.; Quinti, L.; Chopra, V.; Hersch, S.M.; Kazantsev, A.G. The Sirtuin 2 microtubule deacetylase is an abundant neuronal protein that accumulates in the aging CNS. Hum. Mol. Genet. 2011, 20, 3986–3996. [Google Scholar] [CrossRef] [PubMed]
- Wang, L.; Xu, P.; Xie, X.; Hu, F.; Jiang, L.; Hu, R.; Ding, F.; Xiao, H.; Zhang, H. Down Regulation of SIRT2 Reduced ASS Induced NSCLC Apoptosis Through the Release of Autophagy Components via Exosomes. Front. Cell Dev. Biol. 2020, 8, 601953. [Google Scholar] [CrossRef] [PubMed]
- Jing, E.; Gesta, S.; Kahn, C.R. SIRT2 regulates adipocyte differentiation through FoxO1 acetylation/deacetylation. Cell Metab. 2007, 6, 105–114. [Google Scholar] [CrossRef] [PubMed] [Green Version]
- Wang, F.; Nguyen, M.; Qin, F.X.; Tong, Q. SIRT2 deacetylates FOXO3a in response to oxidative stress and caloric restriction. Aging Cell 2007, 6, 505–514. [Google Scholar] [CrossRef] [PubMed]
- Liu, G.; Park, S.H.; Imbesi, M.; Nathan, W.J.; Zou, X.; Zhu, Y.; Jiang, H.; Parisiadou, L.; Gius, D. Loss of NAD-Dependent Protein Deacetylase Sirtuin-2 Alters Mitochondrial Protein Acetylation and Dysregulates Mitophagy. Antioxid. Redox Signal. 2017, 26, 849–863. [Google Scholar] [CrossRef]
- Krishnan, J.; Danzer, C.; Simka, T.; Ukropec, J.; Walter, K.M.; Kumpf, S.; Mirtschink, P.; Ukropcova, B.; Gasperikova, D.; Pedrazzini, T.; et al. Dietary obesity-associated Hif1alpha activation in adipocytes restricts fatty acid oxidation and energy expenditure via suppression of the Sirt2-NAD+ system. Genes Dev. 2012, 26, 259–270. [Google Scholar] [CrossRef]
- Singh, P.; Hanson, P.S.; Morris, C.M. Sirtuin-2 Protects Neural Cells from Oxidative Stress and Is Elevated in Neurodegeneration. Park. Dis. 2017, 2017, 2643587. [Google Scholar] [CrossRef] [PubMed]
- Liskiewicz, D.; Liskiewicz, A.; Nowacka-Chmielewska, M.M.; Grabowski, M.; Pondel, N.; Grabowska, K.; Student, S.; Barski, J.J.; Malecki, A. Differential Response of Hippocampal and Cerebrocortical Autophagy and Ketone Body Metabolism to the Ketogenic Diet. Front. Cell. Neurosci. 2021, 15, 733607. [Google Scholar] [CrossRef]
- Sun, T.; Han, Y.; Li, J.L.; Jiao, X.Y.; Zuo, L.; Wang, J.; Wang, H.X.; Yang, J.L.; Cao, J.M.; Wang, J.X. FOXO3a-dependent PARKIN negatively regulates cardiac hypertrophy by restoring mitophagy. Cell Biosci. 2022, 12, 204. [Google Scholar] [CrossRef]
- Lin, A.; Yao, J.; Zhuang, L.; Wang, D.; Han, J.; Lam, E.W.; Network, T.R.; Gan, B. The FoxO-BNIP3 axis exerts a unique regulation of mTORC1 and cell survival under energy stress. Oncogene 2014, 33, 3183–3194. [Google Scholar] [CrossRef]
- Quinn, P.M.J.; Moreira, P.I.; Ambrosio, A.F.; Alves, C.H. PINK1/PARKIN signalling in neurodegeneration and neuroinflammation. Acta Neuropathol. Commun. 2020, 8, 189. [Google Scholar] [CrossRef]
- Marinkovic, M.; Sprung, M.; Novak, I. Dimerization of mitophagy receptor BNIP3L/NIX is essential for recruitment of autophagic machinery. Autophagy 2021, 17, 1232–1243. [Google Scholar] [CrossRef]
- Hanna, R.A.; Quinsay, M.N.; Orogo, A.M.; Giang, K.; Rikka, S.; Gustafsson, A.B. Microtubule-associated protein 1 light chain 3 (LC3) interacts with Bnip3 protein to selectively remove endoplasmic reticulum and mitochondria via autophagy. J. Biol. Chem. 2012, 287, 19094–19104. [Google Scholar] [CrossRef] [PubMed] [Green Version]
- Wang, S.; Chen, Y.; Li, X.; Zhang, W.; Liu, Z.; Wu, M.; Pan, Q.; Liu, H. Emerging role of transcription factor EB in mitochondrial quality control. Biomed. Pharmacother. 2020, 128, 110272. [Google Scholar] [CrossRef] [PubMed]
- Maalouf, M.; Sullivan, P.G.; Davis, L.; Kim, D.Y.; Rho, J.M. Ketones inhibit mitochondrial production of reactive oxygen species production following glutamate excitotoxicity by increasing NADH oxidation. Neuroscience 2007, 145, 256–264. [Google Scholar] [CrossRef]
- Tieu, K.; Perier, C.; Caspersen, C.; Teismann, P.; Wu, D.C.; Yan, S.D.; Naini, A.; Vila, M.; Jackson-Lewis, V.; Ramasamy, R.; et al. D-beta-hydroxybutyrate rescues mitochondrial respiration and mitigates features of Parkinson disease. J. Clin. Investig. 2003, 112, 892–901. [Google Scholar] [CrossRef]
- Koppel, S.J.; Wilkins, H.M.; Weidling, I.W.; Wang, X.; Menta, B.W.; Swerdlow, R.H. beta-Hydroxybutyrate preferentially enhances neuron over astrocyte respiration while signaling cellular quiescence. Mitochondrion 2023, 68, 125–137. [Google Scholar] [CrossRef] [PubMed]
- Zhu, S.Y.; Yao, R.Q.; Li, Y.X.; Zhao, P.Y.; Ren, C.; Du, X.H.; Yao, Y.M. The Role and Regulatory Mechanism of Transcription Factor EB in Health and Diseases. Front. Cell Dev. Biol. 2021, 9, 667750. [Google Scholar] [CrossRef]
- Frescas, D.; Valenti, L.; Accili, D. Nuclear trapping of the forkhead transcription factor FoxO1 via Sirt-dependent deacetylation promotes expression of glucogenetic genes. J. Biol. Chem. 2005, 280, 20589–20595. [Google Scholar] [CrossRef]
- Yin, J.; Han, P.; Tang, Z.; Liu, Q.; Shi, J. Sirtuin 3 mediates neuroprotection of ketones against ischemic stroke. J. Cereb. Blood Flow Metab. 2015, 35, 1783–1789. [Google Scholar] [CrossRef]
- Hernandez-Jimenez, M.; Hurtado, O.; Cuartero, M.I.; Ballesteros, I.; Moraga, A.; Pradillo, J.M.; McBurney, M.W.; Lizasoain, I.; Moro, M.A. Silent information regulator 1 protects the brain against cerebral ischemic damage. Stroke 2013, 44, 2333–2337. [Google Scholar] [CrossRef]
- Singh, P.; Hanson, P.S.; Morris, C.M. SIRT1 ameliorates oxidative stress induced neural cell death and is down-regulated in Parkinson’s disease. BMC Neurosci. 2017, 18, 46. [Google Scholar] [CrossRef] [PubMed]
- Elamin, M.; Ruskin, D.N.; Masino, S.A.; Sacchetti, P. Ketogenic Diet Modulates NAD(+)-Dependent Enzymes and Reduces DNA Damage in Hippocampus. Front. Cell. Neurosci. 2018, 12, 263. [Google Scholar] [CrossRef] [Green Version]
- Dabke, P.; Das, A.M. Mechanism of Action of Ketogenic Diet Treatment: Impact of Decanoic Acid and Beta-Hydroxybutyrate on Sirtuins and Energy Metabolism in Hippocampal Murine Neurons. Nutrients 2020, 12, 2379. [Google Scholar] [CrossRef]
- Chamberlain, K.A.; Huang, N.; Xie, Y.; LiCausi, F.; Li, S.; Li, Y.; Sheng, Z.H. Oligodendrocytes enhance axonal energy metabolism by deacetylation of mitochondrial proteins through transcellular delivery of SIRT2. Neuron 2021, 109, 3456–3472. [Google Scholar] [CrossRef] [PubMed]
- She, D.T.; Wong, L.J.; Baik, S.H.; Arumugam, T.V. SIRT2 Inhibition Confers Neuroprotection by Downregulation of FOXO3a and MAPK Signaling Pathways in Ischemic Stroke. Mol. Neurobiol. 2018, 55, 9188–9203. [Google Scholar] [CrossRef] [PubMed]
- de Oliveira, R.M.; Vicente Miranda, H.; Francelle, L.; Pinho, R.; Szego, E.M.; Martinho, R.; Munari, F.; Lazaro, D.F.; Moniot, S.; Guerreiro, P.; et al. The mechanism of sirtuin 2-mediated exacerbation of alpha-synuclein toxicity in models of Parkinson disease. PLoS Biol. 2017, 15, e2000374. [Google Scholar] [CrossRef] [PubMed]
- Outeiro, T.F.; Kontopoulos, E.; Altmann, S.M.; Kufareva, I.; Strathearn, K.E.; Amore, A.M.; Volk, C.B.; Maxwell, M.M.; Rochet, J.C.; McLean, P.J.; et al. Sirtuin 2 inhibitors rescue alpha-synuclein-mediated toxicity in models of Parkinson’s disease. Science 2007, 317, 516–519. [Google Scholar] [CrossRef] [PubMed]
- Nie, H.; Hong, Y.; Lu, X.; Zhang, J.; Chen, H.; Li, Y.; Ma, Y.; Ying, W. SIRT2 mediates oxidative stress-induced apoptosis of differentiated PC12 cells. Neuroreport 2014, 25, 838–842. [Google Scholar] [CrossRef] [PubMed]
- Chen, X.; Wales, P.; Quinti, L.; Zuo, F.; Moniot, S.; Herisson, F.; Rauf, N.A.; Wang, H.; Silverman, R.B.; Ayata, C.; et al. The sirtuin-2 inhibitor AK7 is neuroprotective in models of Parkinson’s disease but not amyotrophic lateral sclerosis and cerebral ischemia. PLoS ONE 2015, 10, e0116919. [Google Scholar] [CrossRef] [Green Version]


Disclaimer/Publisher’s Note: The statements, opinions and data contained in all publications are solely those of the individual author(s) and contributor(s) and not of MDPI and/or the editor(s). MDPI and/or the editor(s) disclaim responsibility for any injury to people or property resulting from any ideas, methods, instructions or products referred to in the content. |
© 2023 by the authors. Licensee MDPI, Basel, Switzerland. This article is an open access article distributed under the terms and conditions of the Creative Commons Attribution (CC BY) license (https://creativecommons.org/licenses/by/4.0/).
Share and Cite
Gómora-García, J.C.; Montiel, T.; Hüttenrauch, M.; Salcido-Gómez, A.; García-Velázquez, L.; Ramiro-Cortés, Y.; Gomora, J.C.; Castro-Obregón, S.; Massieu, L. Effect of the Ketone Body, D-β-Hydroxybutyrate, on Sirtuin2-Mediated Regulation of Mitochondrial Quality Control and the Autophagy–Lysosomal Pathway. Cells 2023, 12, 486. https://doi.org/10.3390/cells12030486
Gómora-García JC, Montiel T, Hüttenrauch M, Salcido-Gómez A, García-Velázquez L, Ramiro-Cortés Y, Gomora JC, Castro-Obregón S, Massieu L. Effect of the Ketone Body, D-β-Hydroxybutyrate, on Sirtuin2-Mediated Regulation of Mitochondrial Quality Control and the Autophagy–Lysosomal Pathway. Cells. 2023; 12(3):486. https://doi.org/10.3390/cells12030486
Chicago/Turabian StyleGómora-García, Juan Carlos, Teresa Montiel, Melanie Hüttenrauch, Ashley Salcido-Gómez, Lizbeth García-Velázquez, Yazmin Ramiro-Cortés, Juan Carlos Gomora, Susana Castro-Obregón, and Lourdes Massieu. 2023. "Effect of the Ketone Body, D-β-Hydroxybutyrate, on Sirtuin2-Mediated Regulation of Mitochondrial Quality Control and the Autophagy–Lysosomal Pathway" Cells 12, no. 3: 486. https://doi.org/10.3390/cells12030486