
Doxorubicin-Induced Cardiac Senescence Is Alleviated Following Treatment with Combined Polyphenols and Micronutrients through Enhancement in Mitophagy

 ,
, 
 , , , , , and
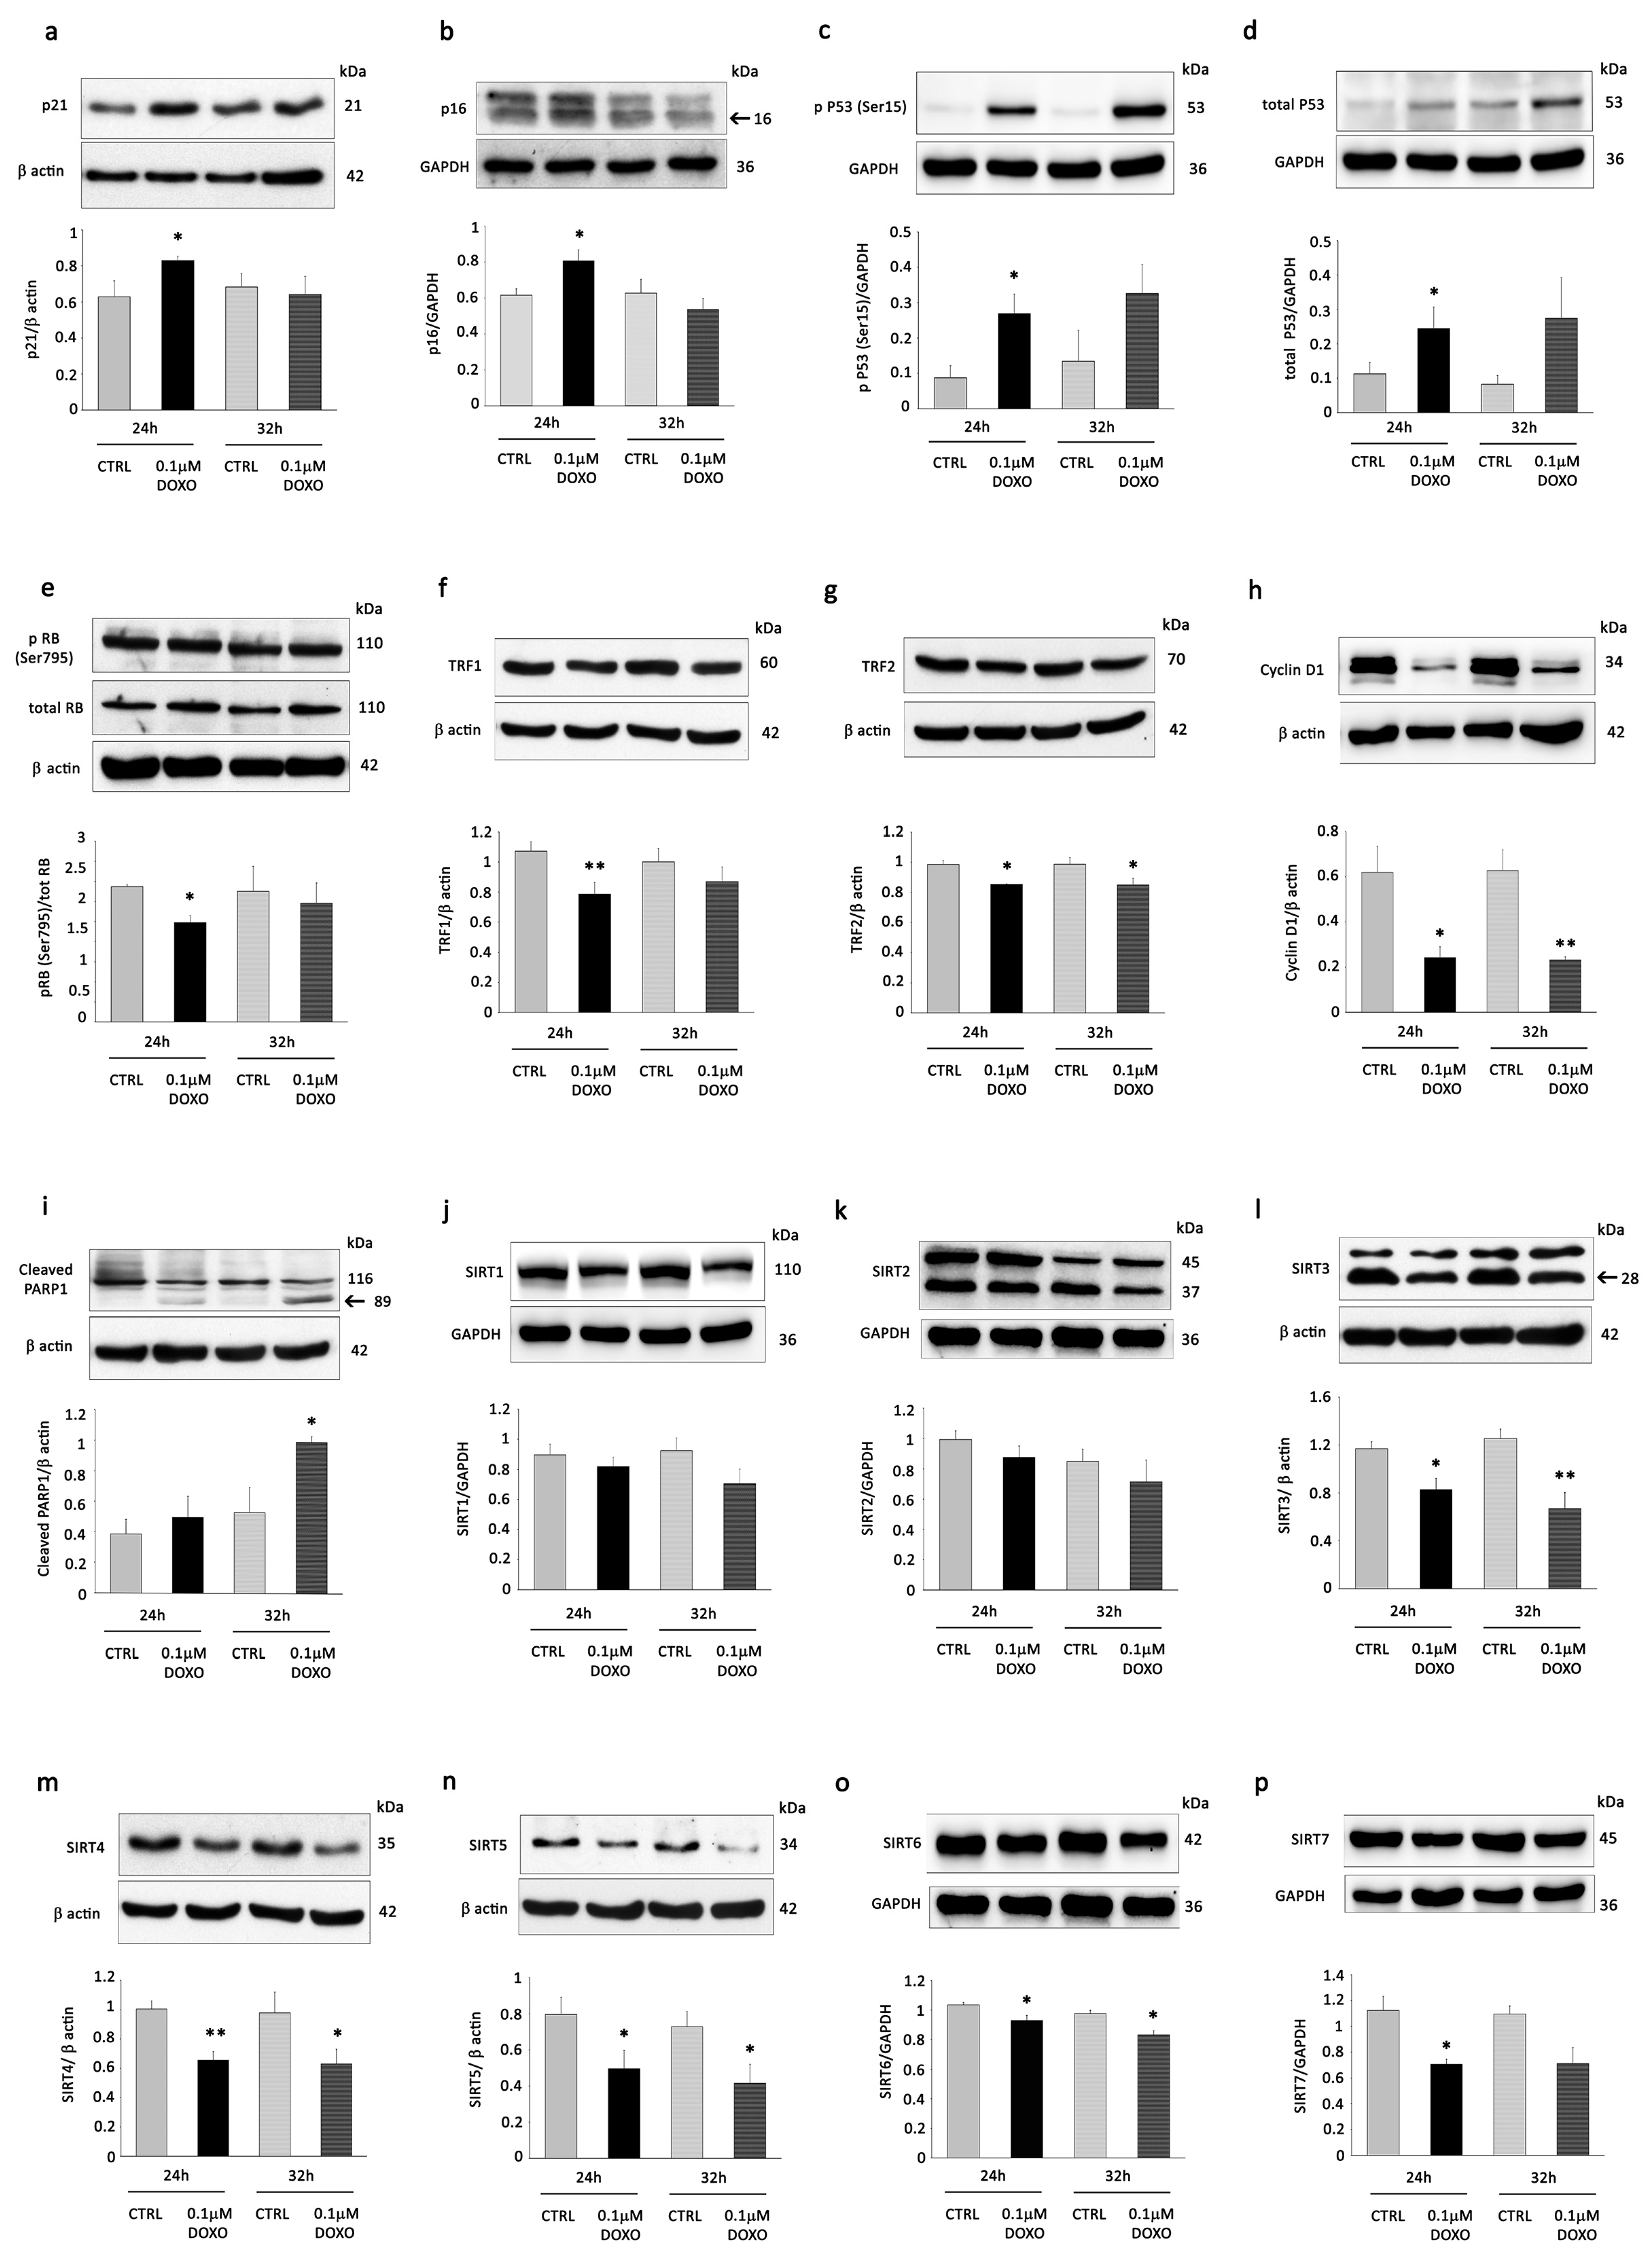
Abstract
:1. Introduction
2. Materials and Methods
2.1. Cell Culture and Treatment Protocols
2.1.1. Generation of SIRT4-H9C2 Silenced Cells
2.1.2. A5+ and Doxorubicin Treatments
2.2. Western Blot Analysis
2.3. Cell Viability Assay
2.4. Cell Cycle Analysis
2.5. Glutamate Dehydrogenase Assay
2.6. Confocal Microscopy Monitoring of Mitochondrial Membrane Potential (Δψm)
2.7. Measurement of Mitochondrial Oxygen Consumption Rate (OCR)
2.8. SA-β-Gal Staining for the Assessment of Senescence
2.9. Transmission Electron Microscopy
2.10. Reactive Oxygen Species Detection
2.11. MnSOD Activity on Mitochondrial Fractions
2.12. Data Collection and Statistics
3. Results
3.1. DOXO Treatment Induces Senescence Changes and Reduces the Expression of Mitochondrial Sirtuins in H9C2 Cells
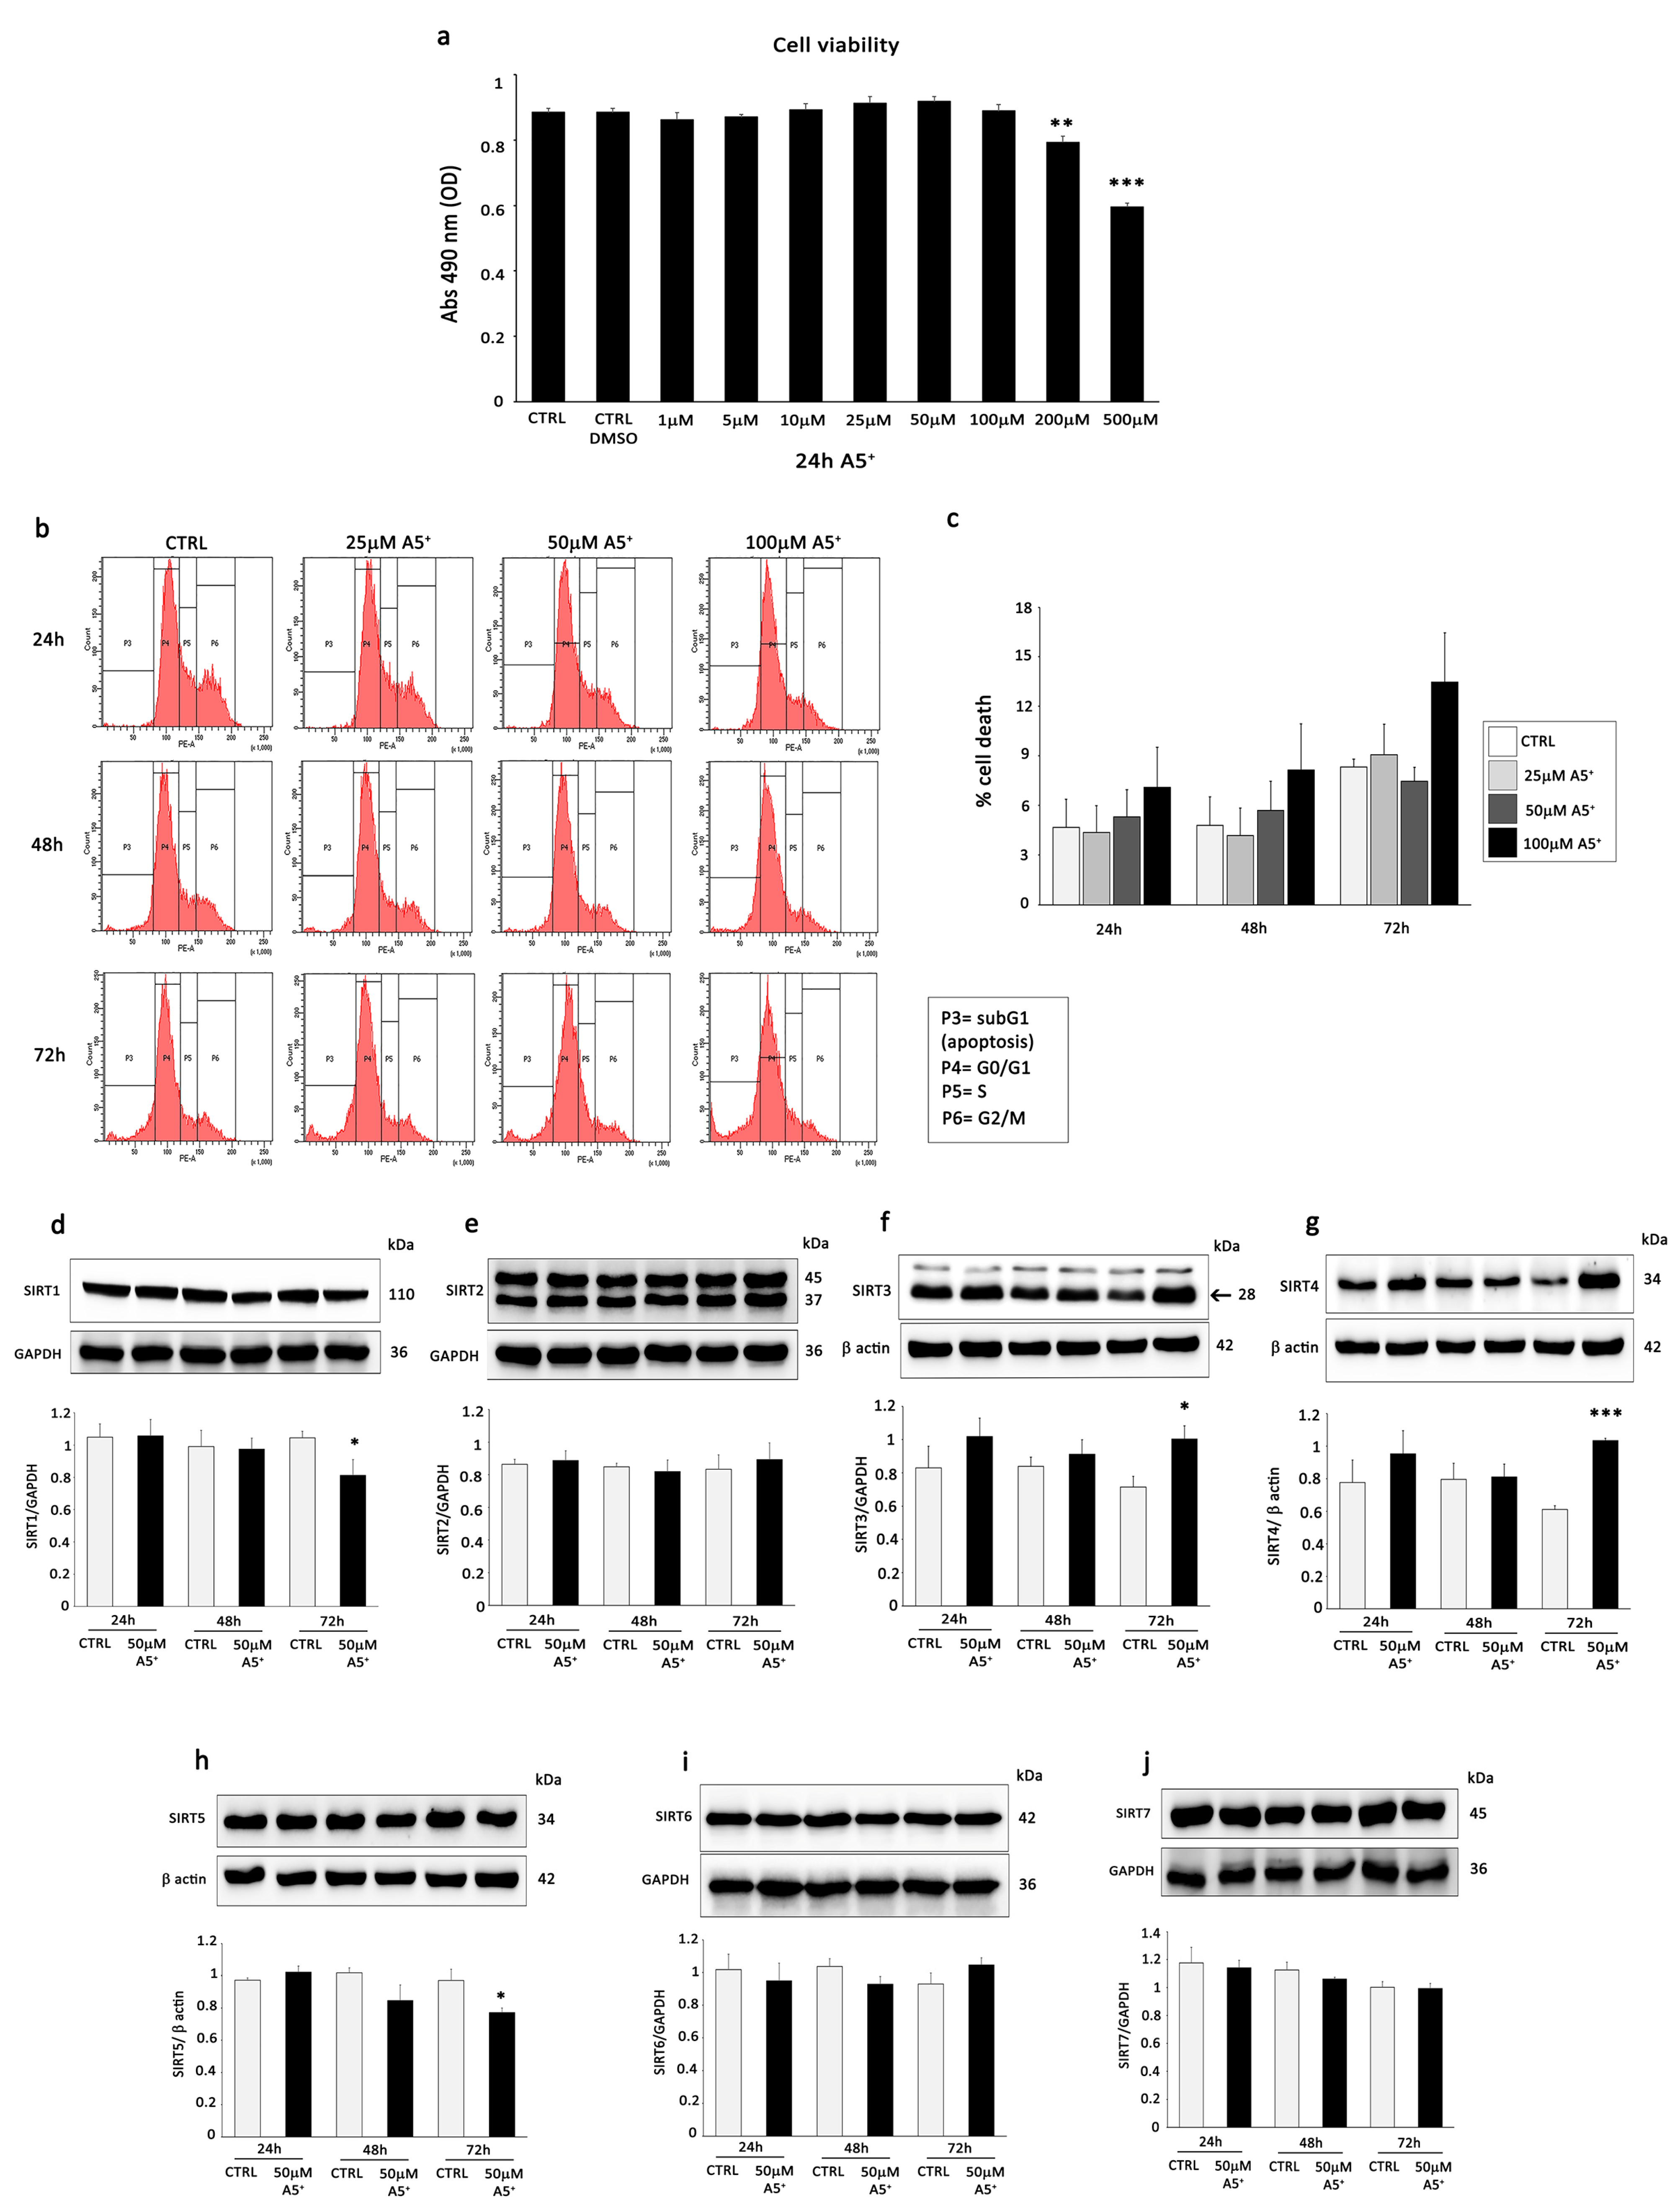
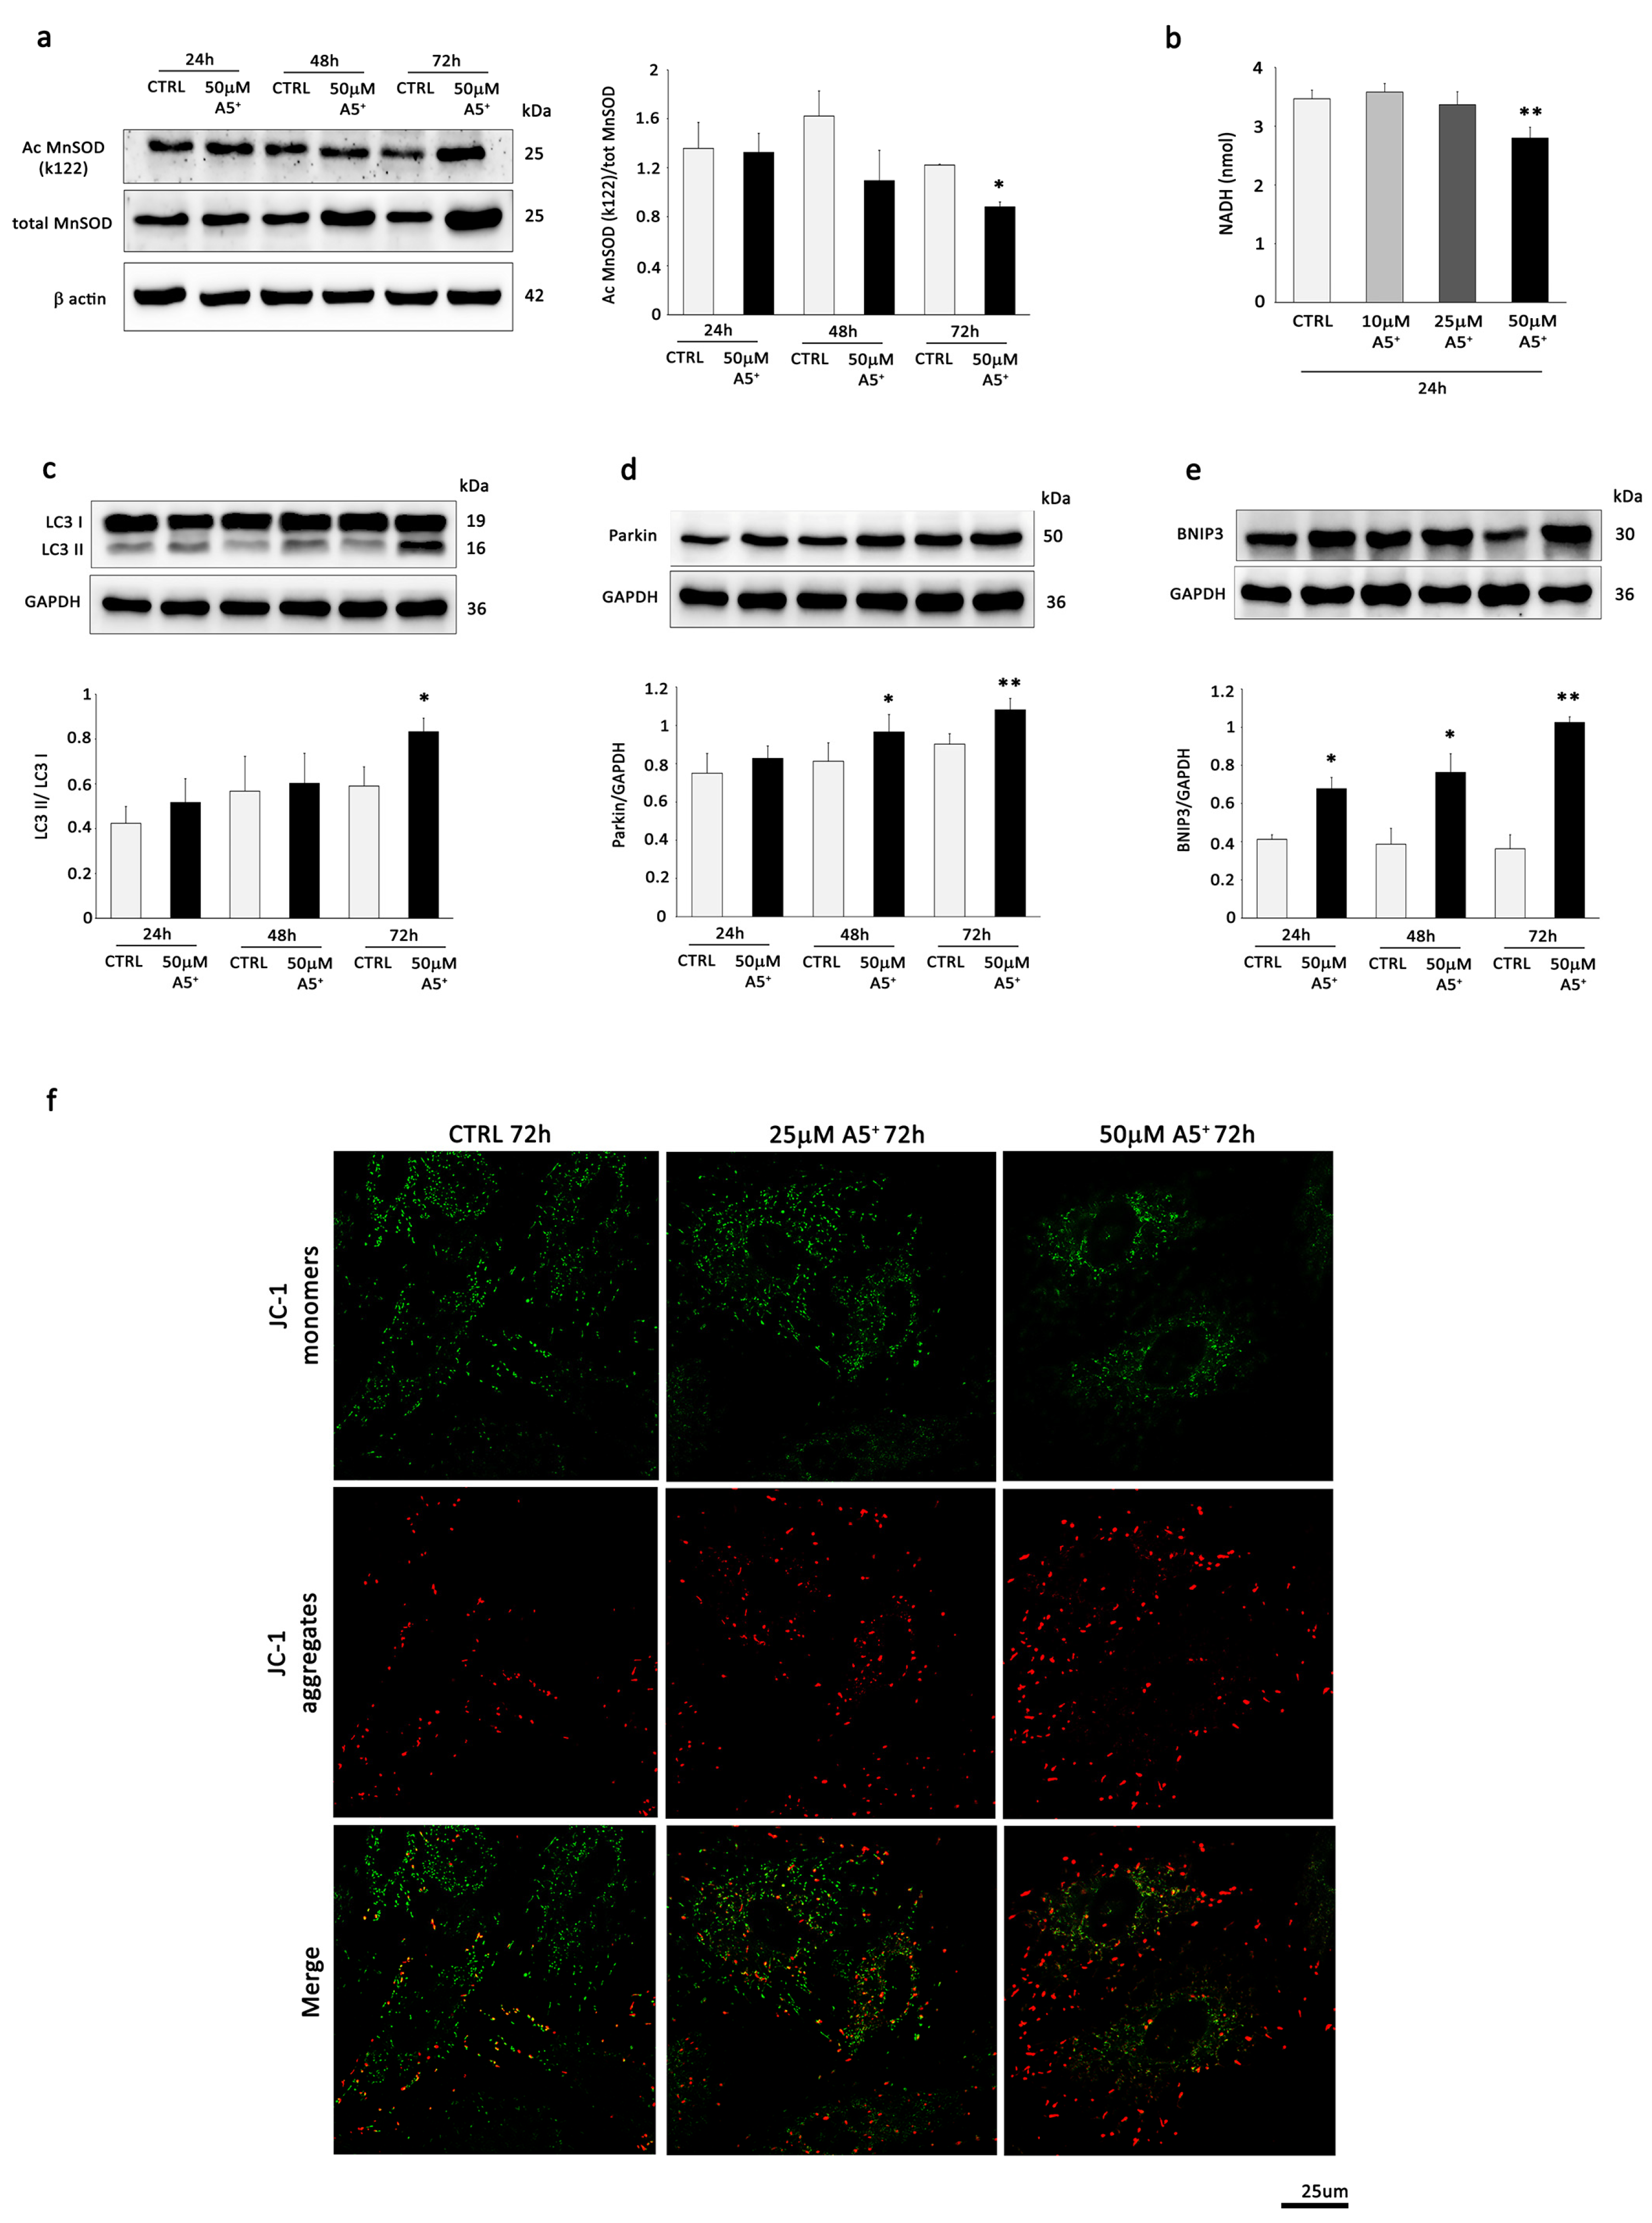
3.2. A5+ Stimulates Mitochondrial SIRT3 and SIRT4, Influences Mitochondrial Activity, and Promotes Mitophagy in H9C2 Cells
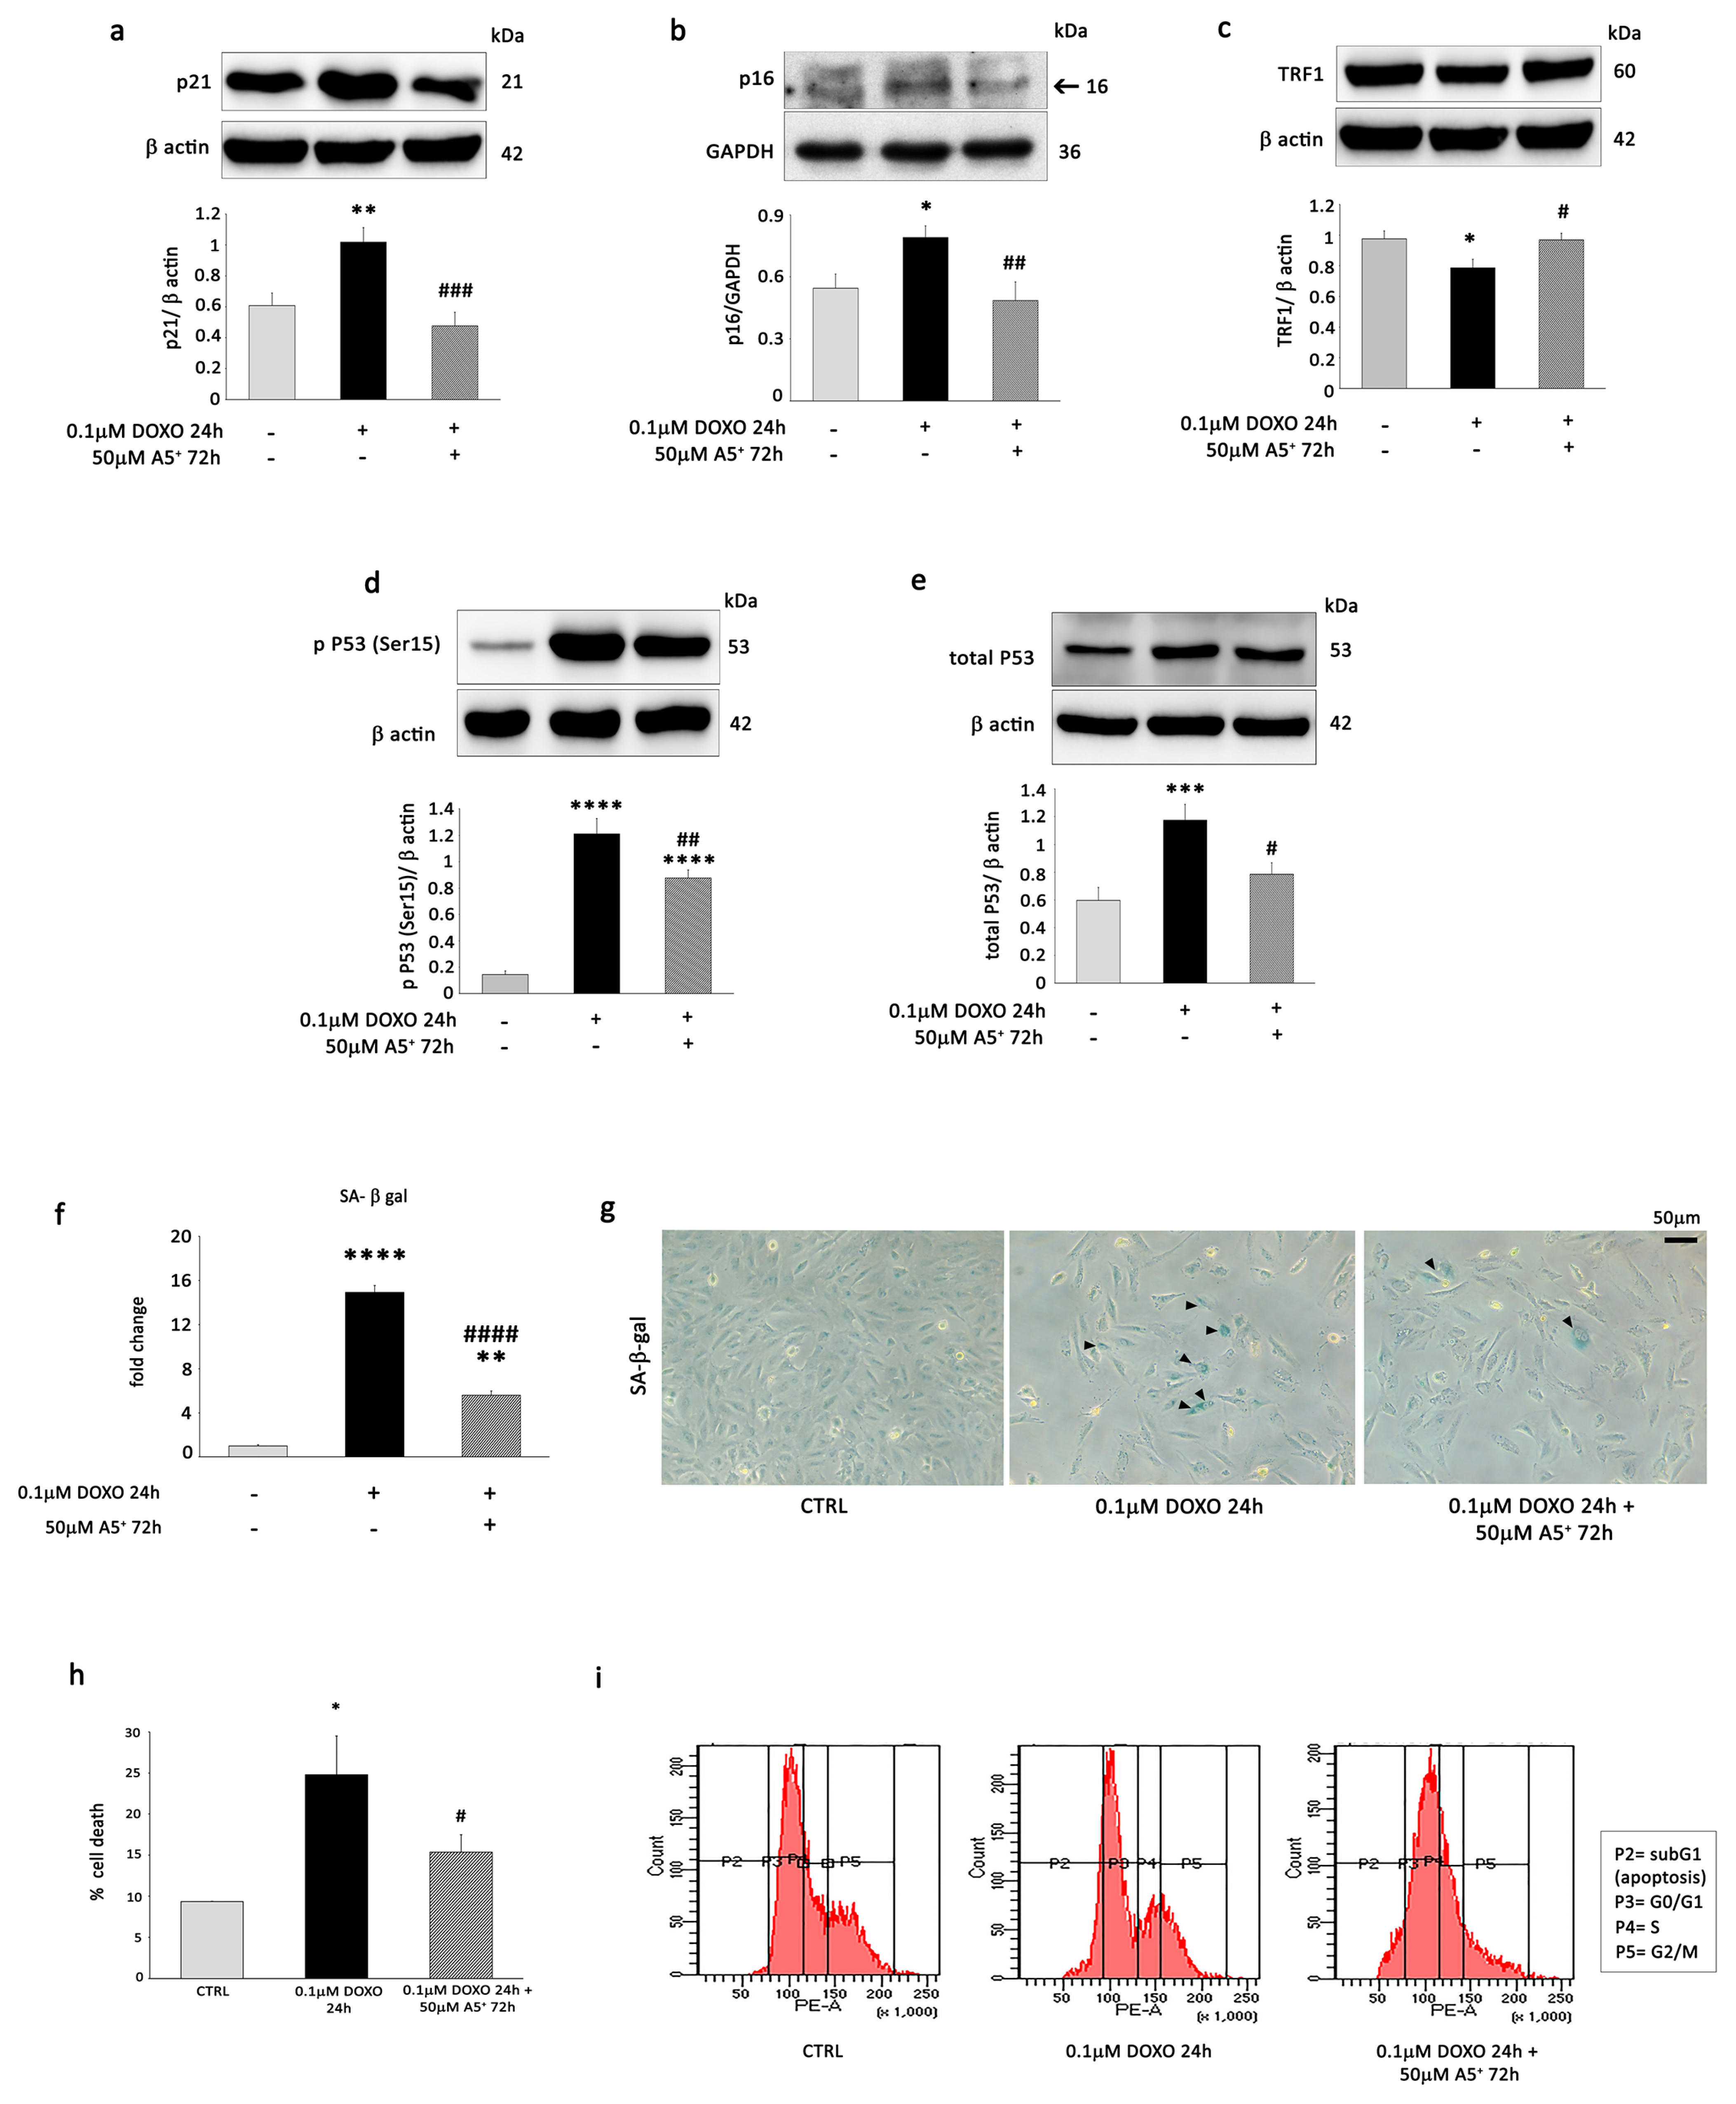
3.3. A5+ Alleviates Senescent-like Cell Phenotypes in Response to DOXO Treatment
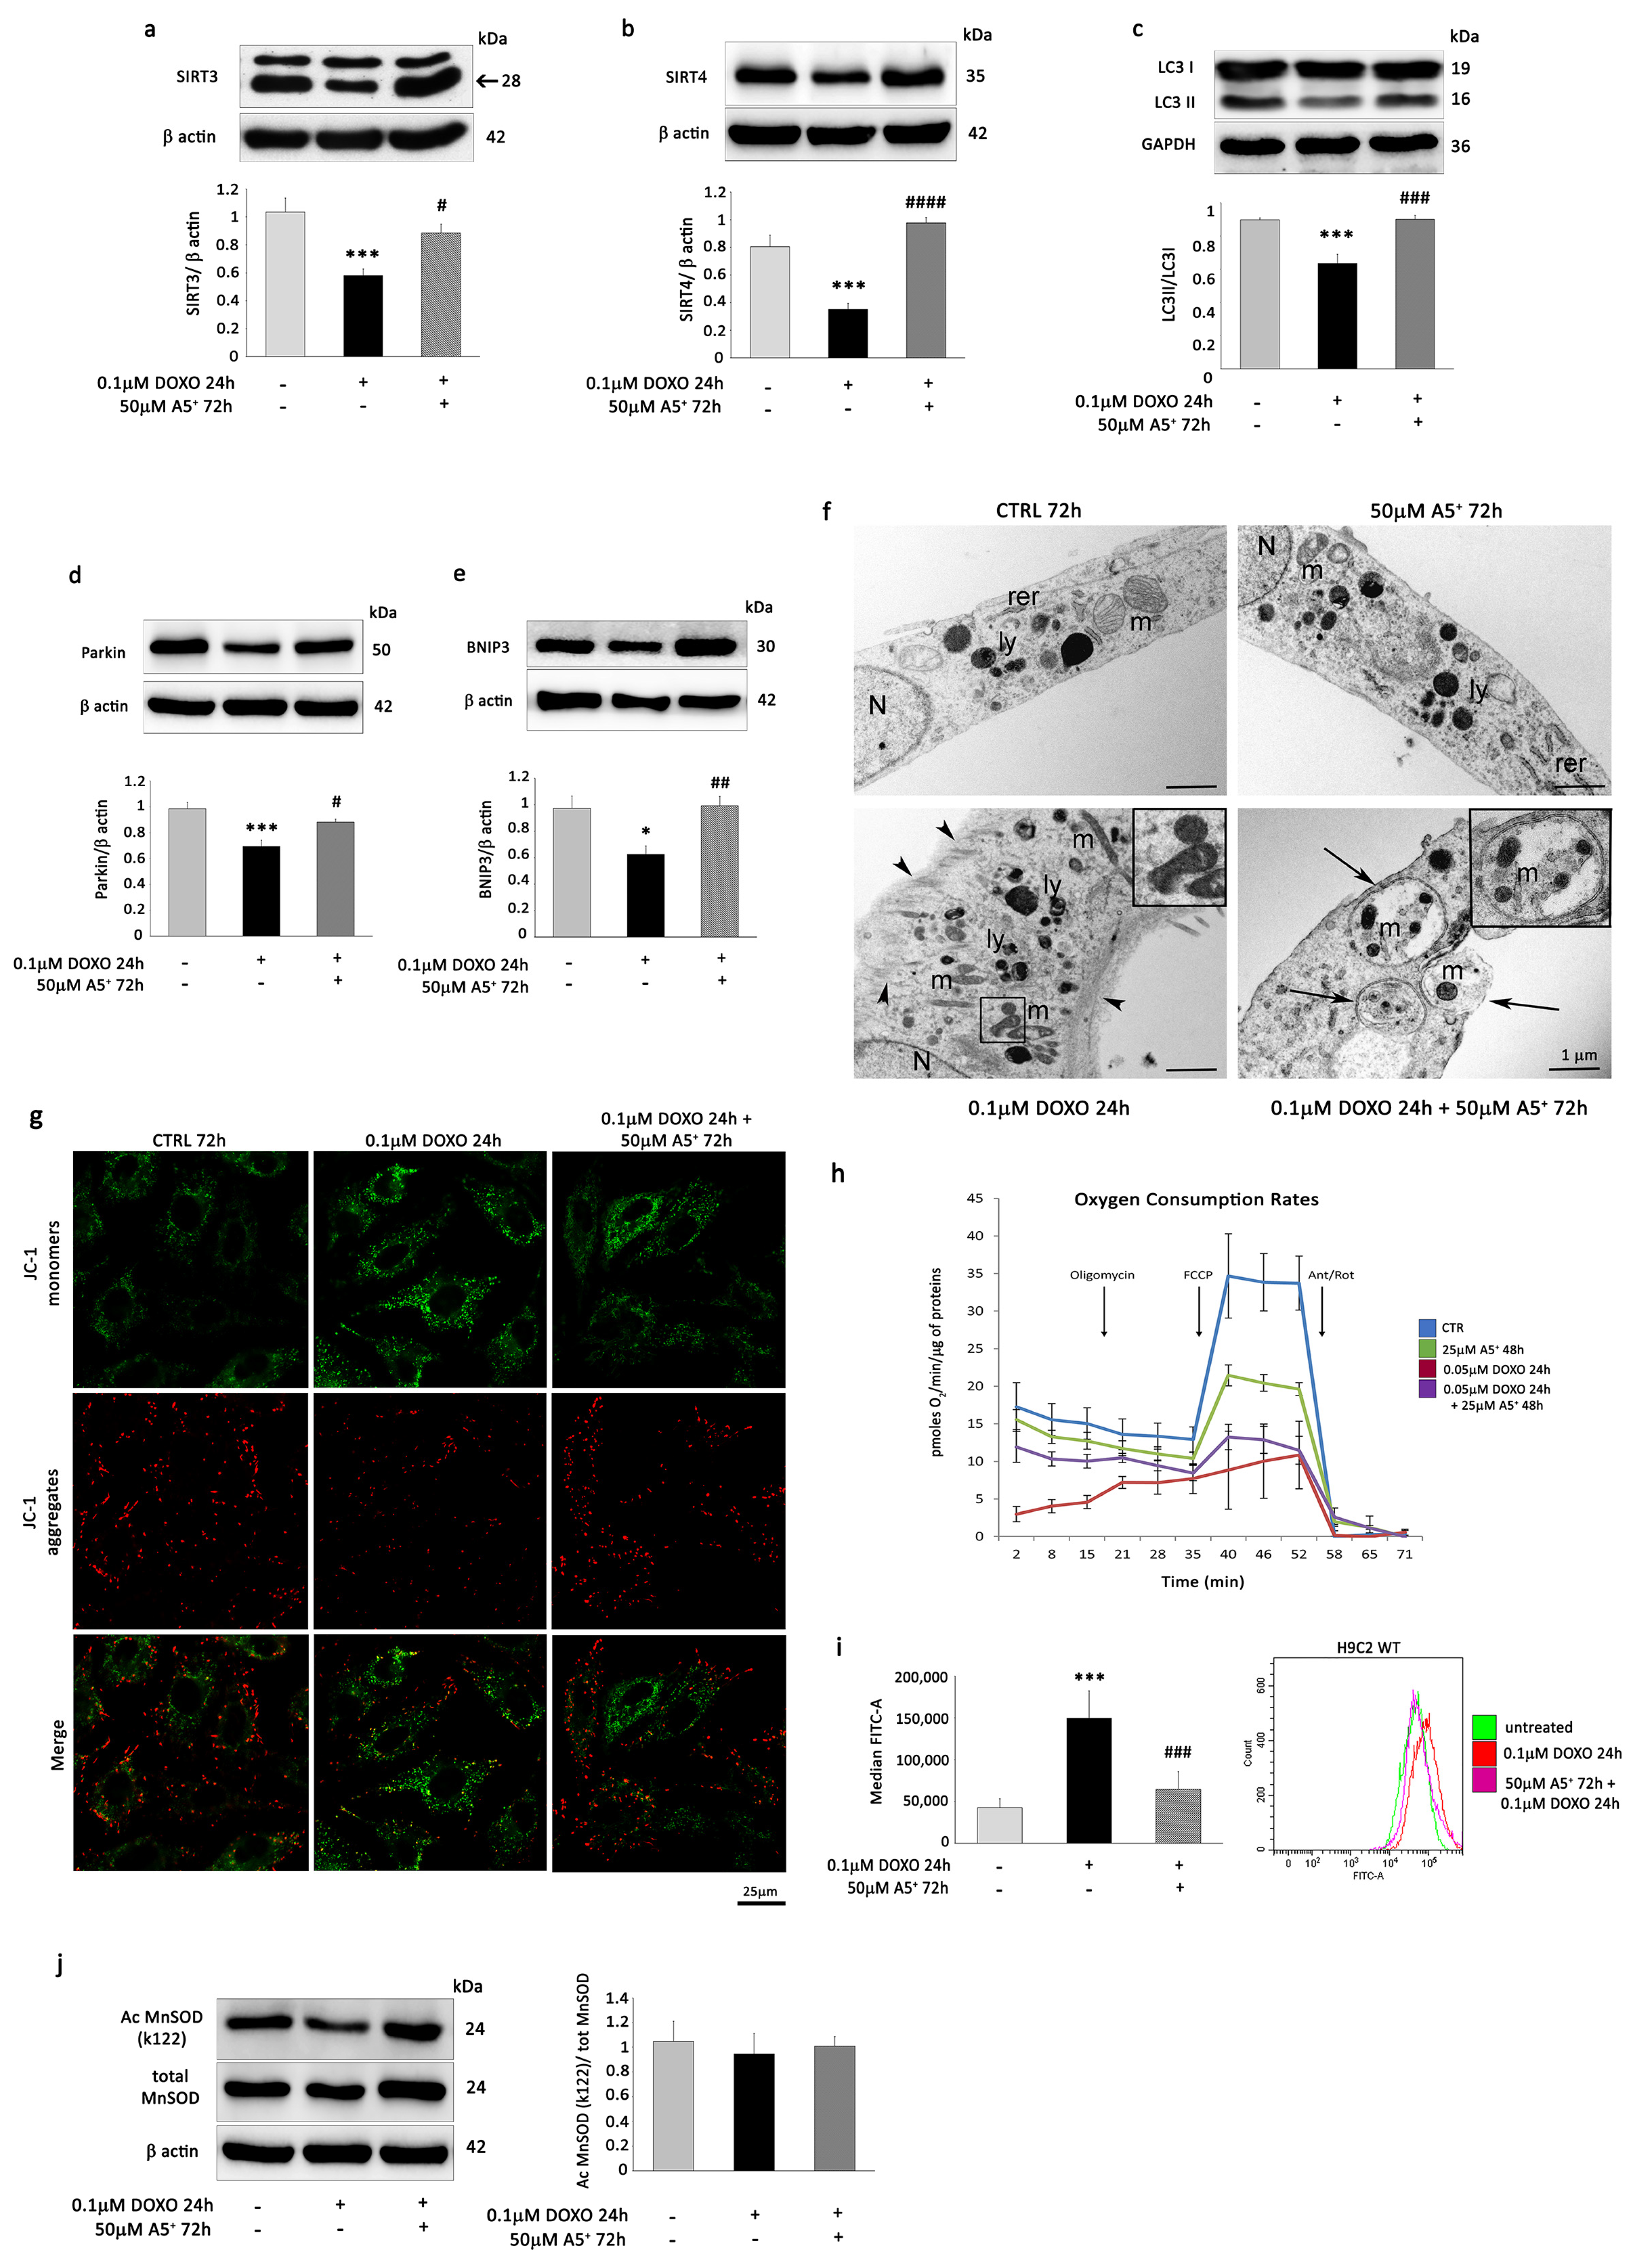
3.4. A5+ Rescues SIRT3 and SIRT4 Expression, Reverses the Decrease in Mitophagy, and Prevents ROS Production in DOXO-Induced Senescent H9C2 Cells
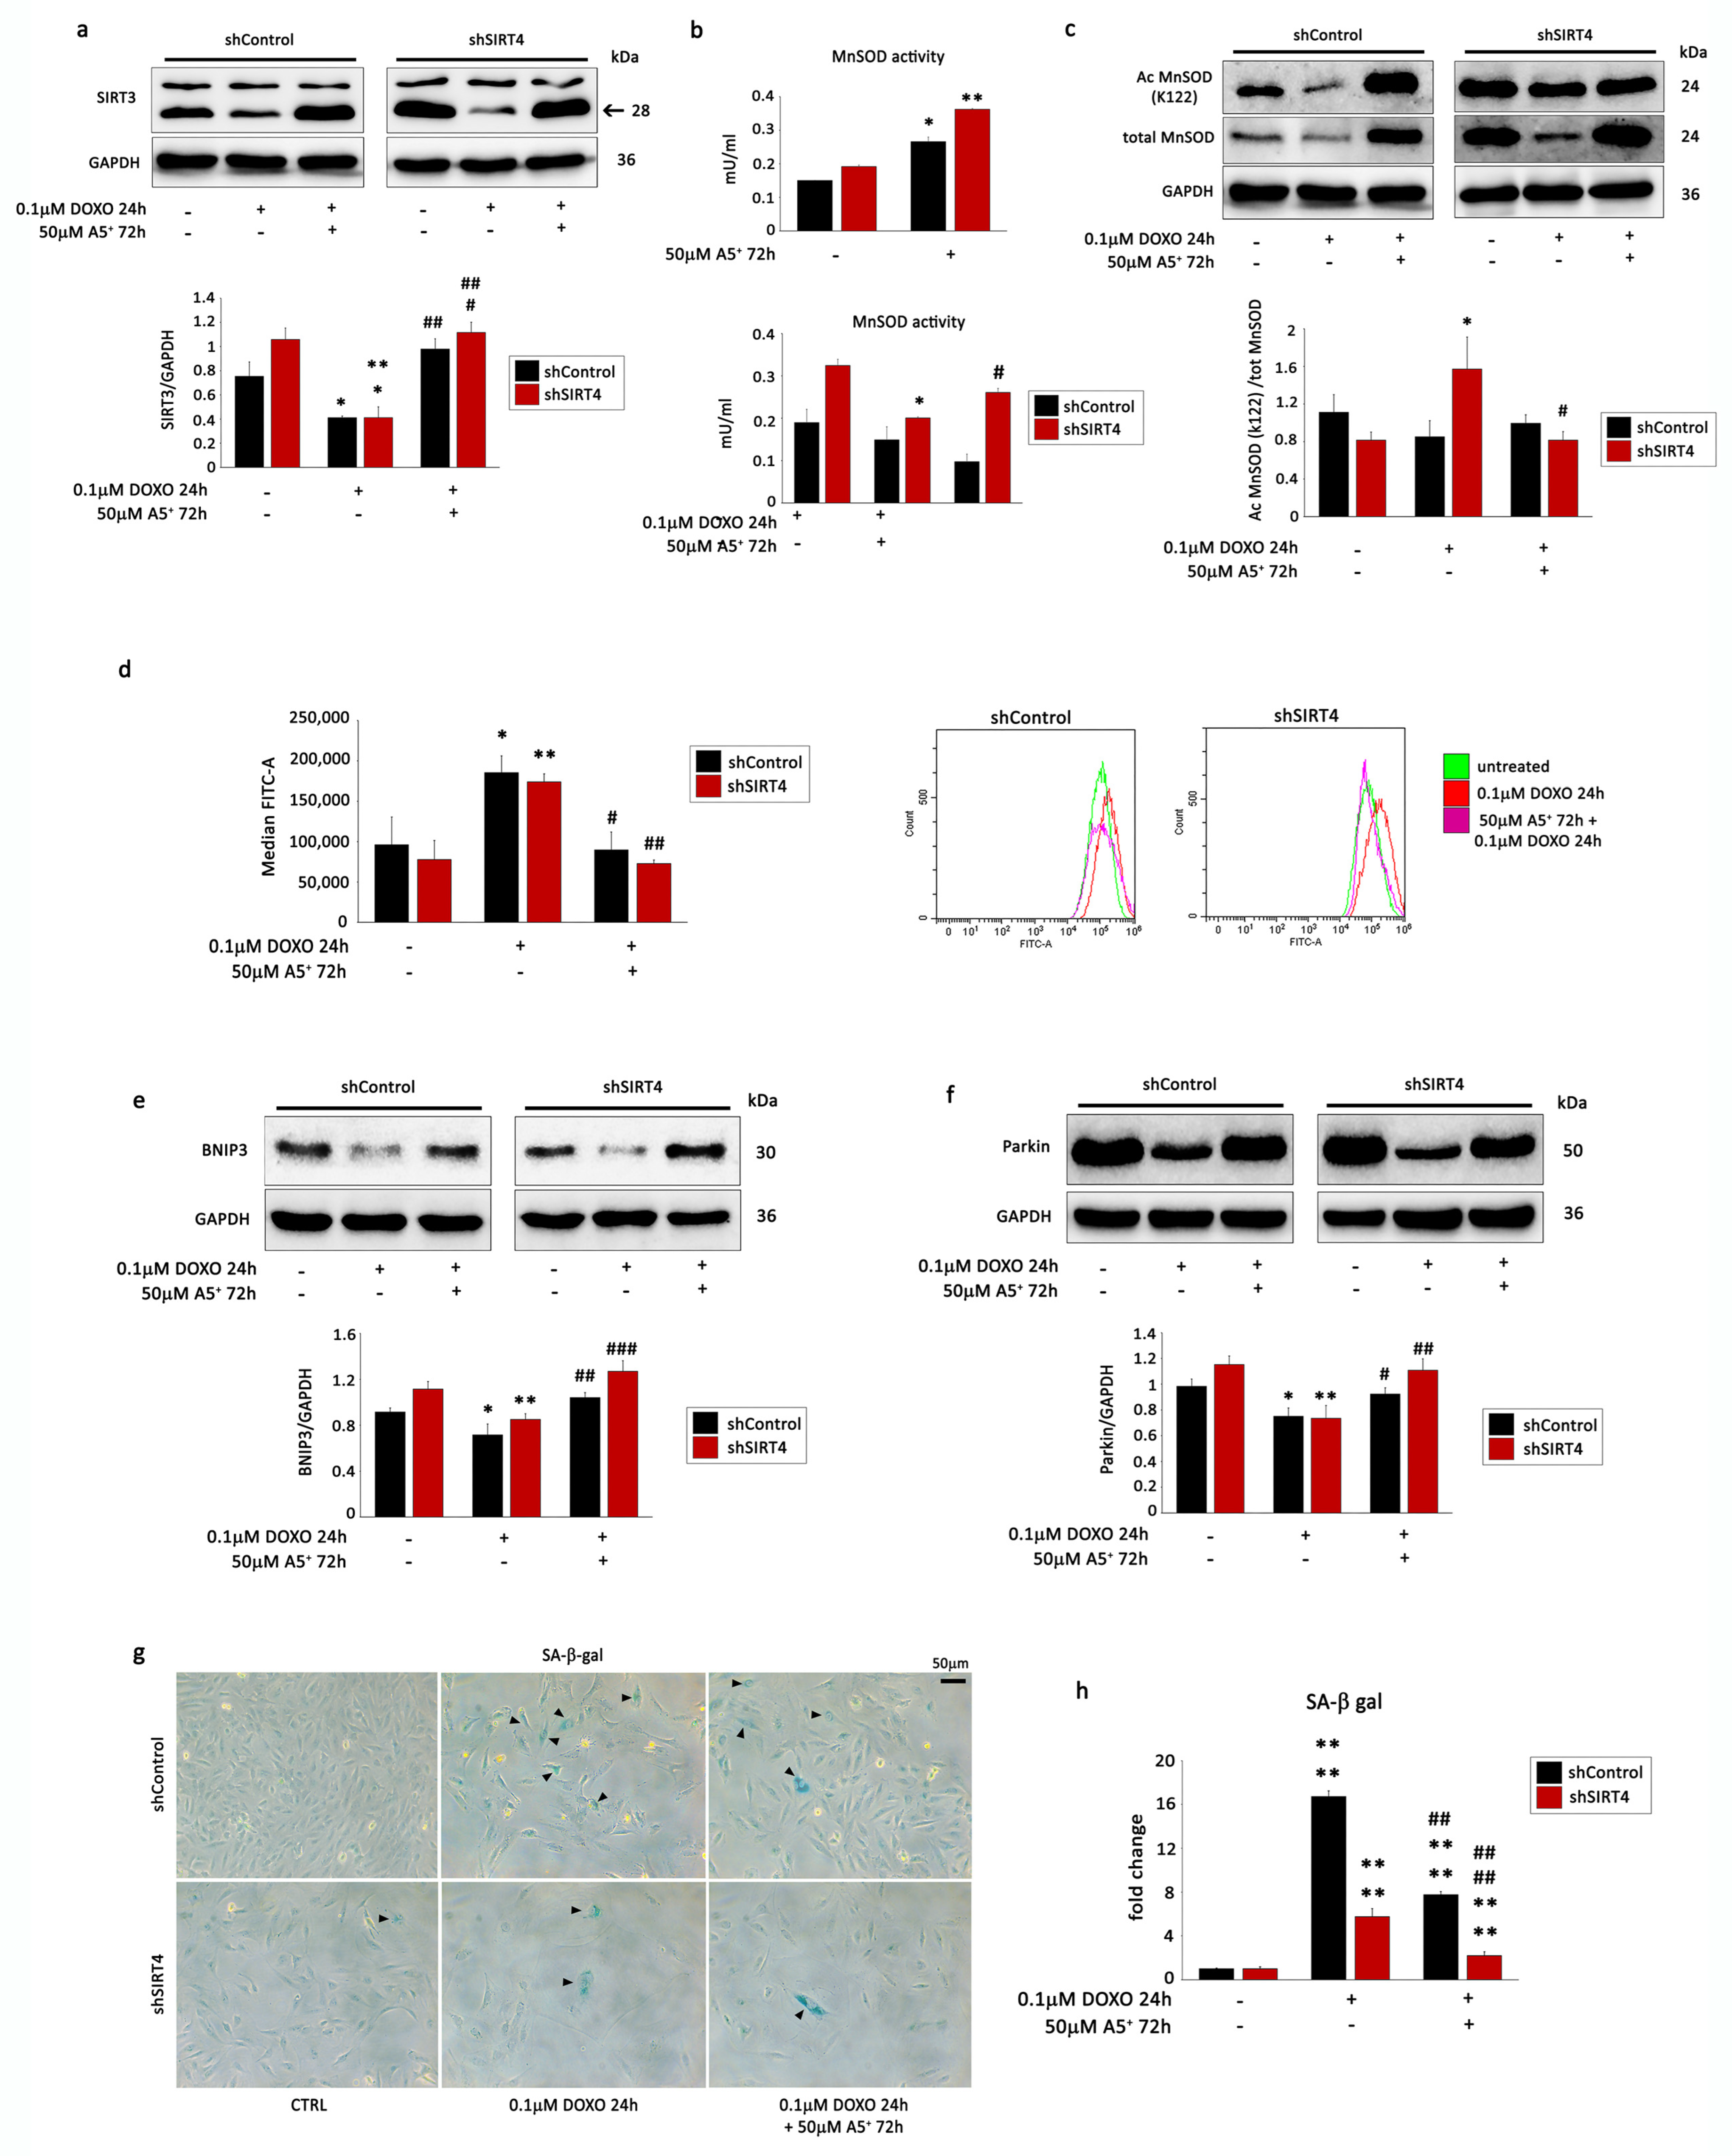
3.5. SIRT4 Silencing Enhances A5+ Protection against DOXO-Induced Senescence by Modulating Mitophagy and ROS Production
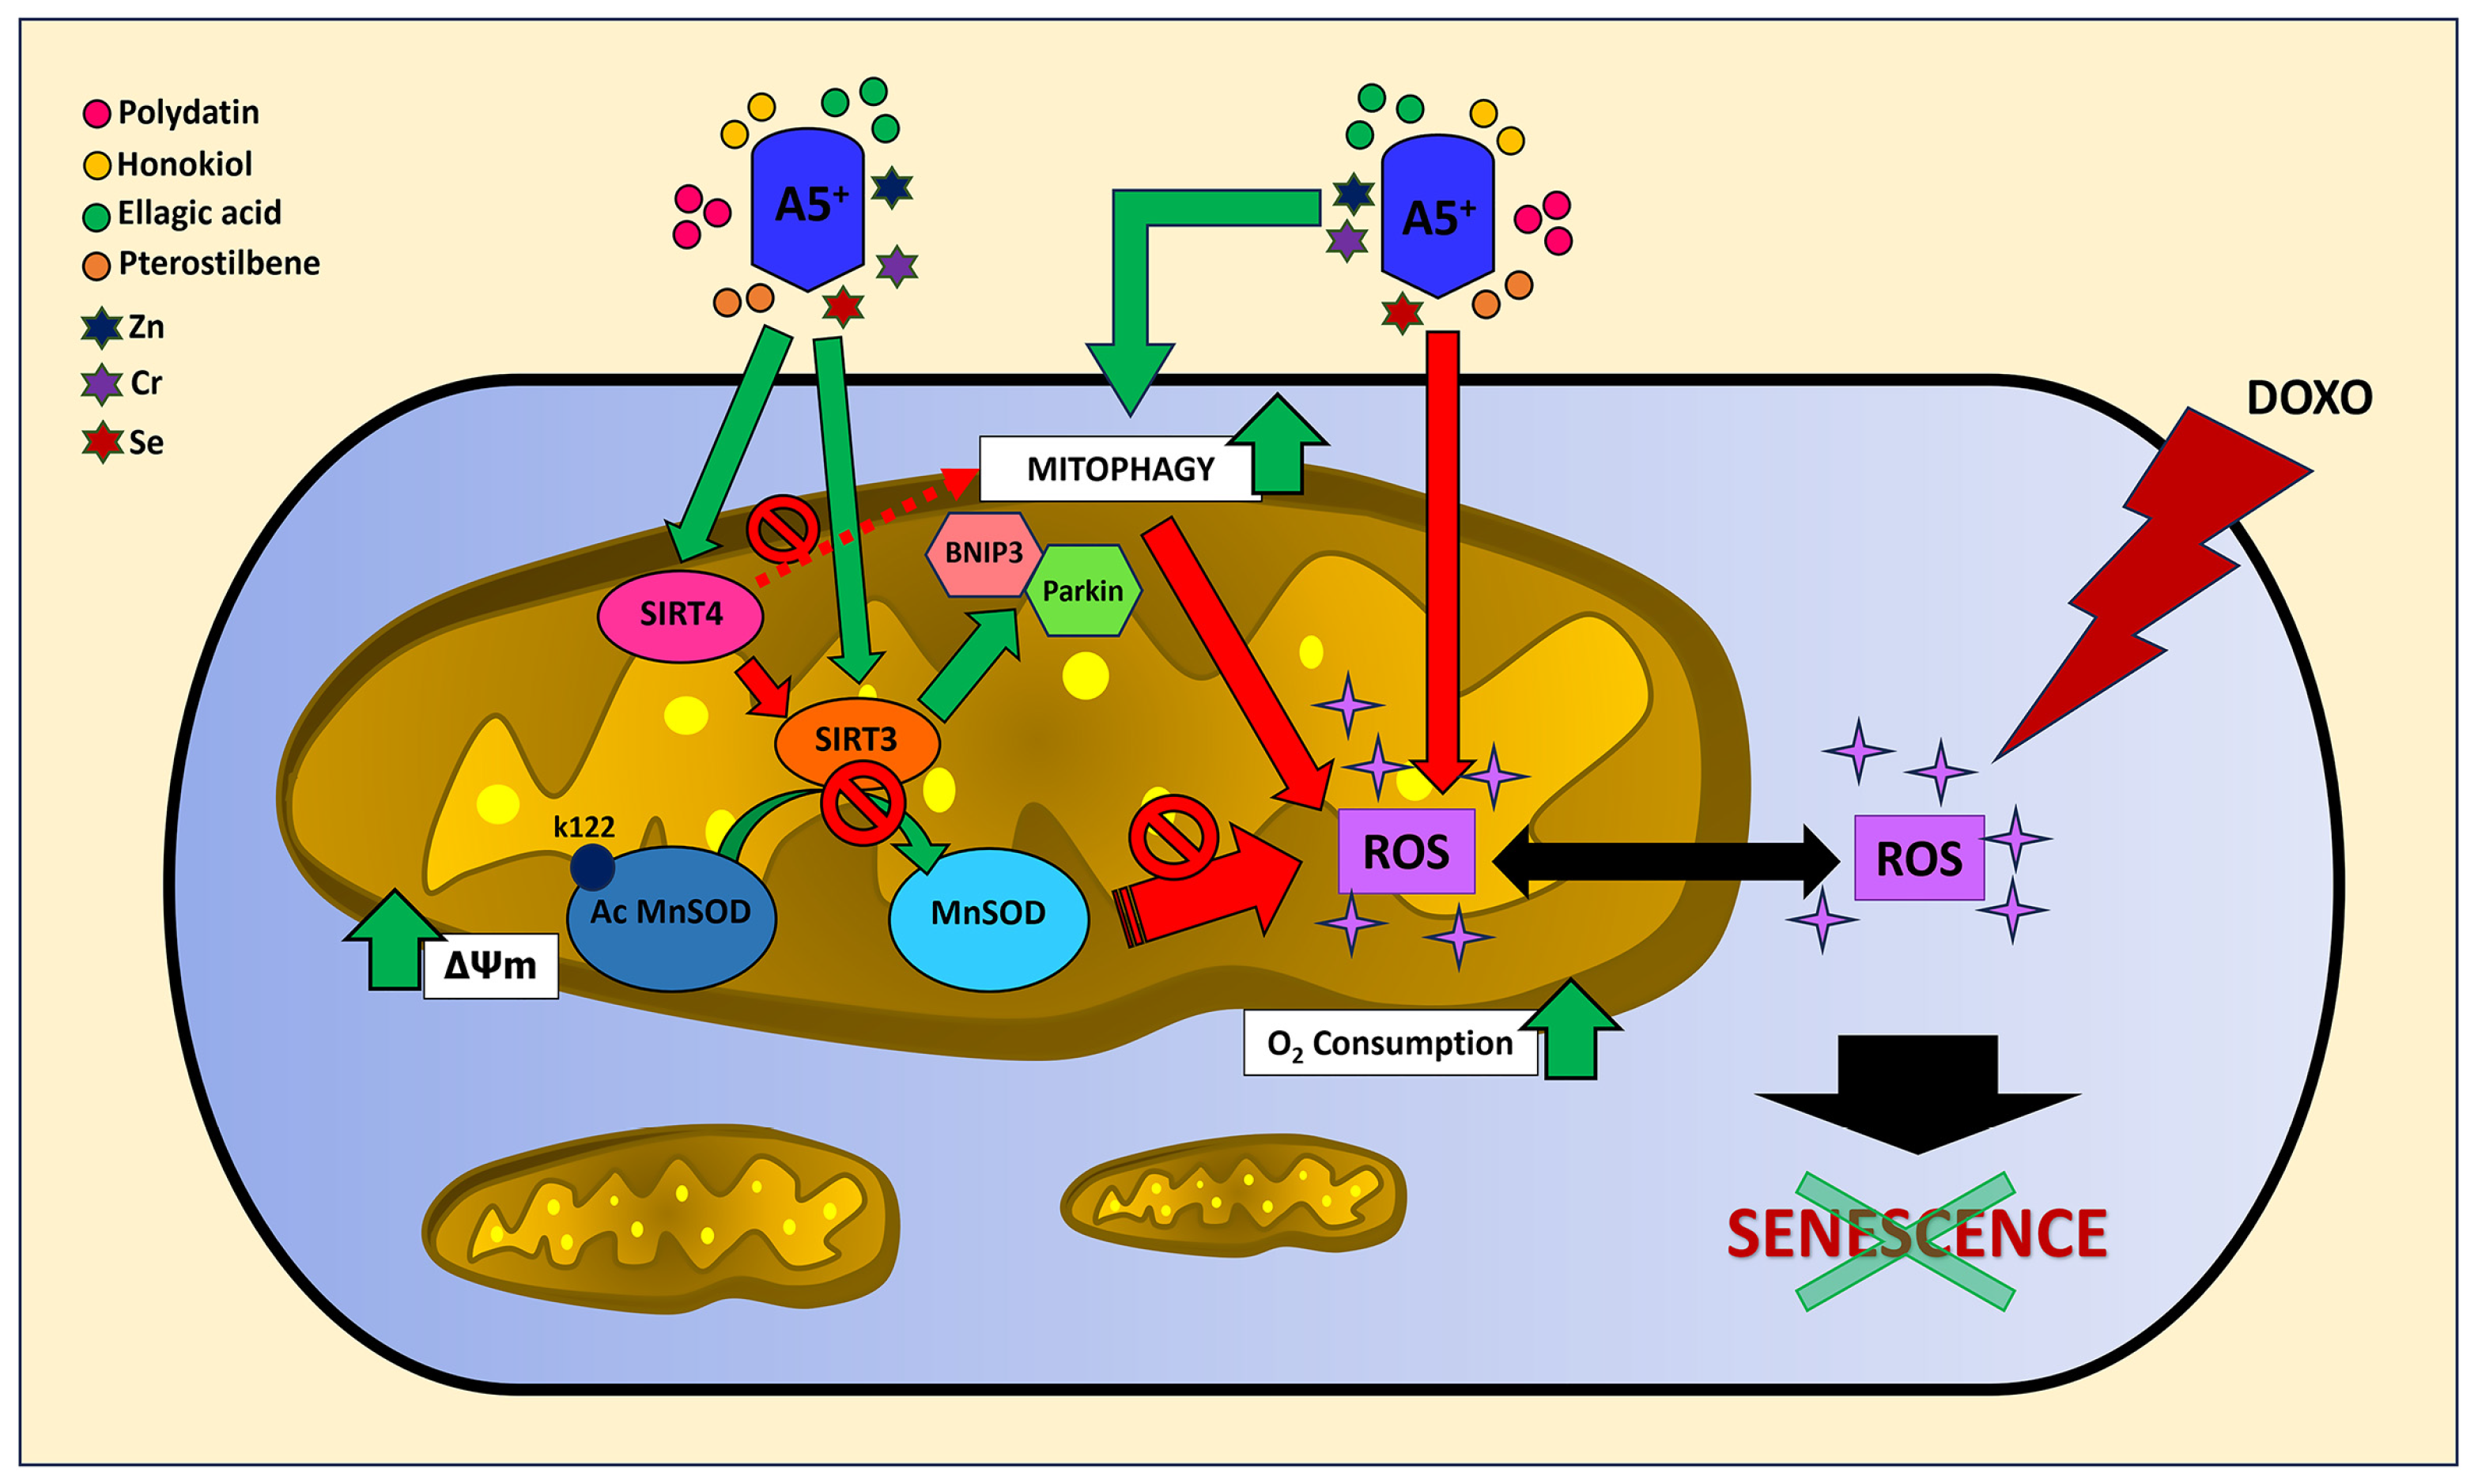
4. Discussion
Supplementary Materials
Author Contributions
Funding
Institutional Review Board Statement
Informed Consent Statement
Data Availability Statement
Conflicts of Interest
References
- Chiao, Y.A.; Rabinovitch, P.S. The Aging Heart. Cold Spring Harb. Perspect. Med. 2015, 5, a025148. [Google Scholar] [CrossRef]
- Chen, M.S.; Lee, R.T.; Garbern, J.C. Senescence Mechanisms and Targets in the Heart. Cardiovasc. Res. 2022, 118, 1173–1187. [Google Scholar] [CrossRef] [PubMed]
- Dai, D.-F.; Chen, T.; Johnson, S.C.; Szeto, H.; Rabinovitch, P.S. Cardiac Aging: From Molecular Mechanisms to Significance in Human Health and Disease. Antioxid. Redox Signal. 2012, 16, 1492–1526. [Google Scholar] [CrossRef] [PubMed]
- Kubli, D.A.; Quinsay, M.N.; Gustafsson, A.B. Parkin Deficiency Results in Accumulation of Abnormal Mitochondria in Aging Myocytes. Commun. Integr. Biol. 2013, 6, e24511. [Google Scholar] [CrossRef] [PubMed]
- Andriantsitohaina, R.; Auger, C.; Chataigneau, T.; Étienne-Selloum, N.; Li, H.; Martínez, M.C.; Schini-Kerth, V.B.; Laher, I. Molecular Mechanisms of the Cardiovascular Protective Effects of Polyphenols. Br. J. Nutr. 2012, 108, 1532–1549. [Google Scholar] [CrossRef]
- Rysz, J.; Franczyk, B.; Rysz-Górzyńska, M.; Gluba-Brzózka, A. Ageing, Age-Related Cardiovascular Risk and the Beneficial Role of Natural Components Intake. Int. J. Mol. Sci. 2021, 23, 183. [Google Scholar] [CrossRef]
- Pyo, I.S.; Yun, S.; Yoon, Y.E.; Choi, J.-W.; Lee, S.-J. Mechanisms of Aging and the Preventive Effects of Resveratrol on Age-Related Diseases. Molecules 2020, 25, 4649. [Google Scholar] [CrossRef] [PubMed]
- De Angelis, M.; Della-Morte, D.; Buttinelli, G.; Di Martino, A.; Pacifici, F.; Checconi, P.; Ambrosio, L.; Stefanelli, P.; Palamara, A.T.; Garaci, E.; et al. Protective Role of Combined Polyphenols and Micronutrients against Influenza A Virus and SARS-CoV-2 Infection In Vitro. Biomedicines 2021, 9, 1721. [Google Scholar] [CrossRef]
- Pacifici, F.; Salimei, C.; Pastore, D.; Malatesta, G.; Ricordi, C.; Donadel, G.; Bellia, A.; Rovella, V.; Tafani, M.; Garaci, E.; et al. The Protective Effect of a Unique Mix of Polyphenols and Micronutrients against Neurodegeneration Induced by an In Vitro Model of Parkinson’s Disease. Int. J. Mol. Sci. 2022, 23, 3110. [Google Scholar] [CrossRef] [PubMed]
- Pacifici, F.; Malatesta, G.; Mammi, C.; Pastore, D.; Marzolla, V.; Ricordi, C.; Chiereghin, F.; Infante, M.; Donadel, G.; Curcio, F.; et al. A Novel Mix of Polyphenols and Micronutrients Reduces Adipogenesis and Promotes White Adipose Tissue Browning via UCP1 Expression and AMPK Activation. Cells 2023, 12, 714. [Google Scholar] [CrossRef]
- Matacchione, G.; Valli, D.; Silvestrini, A.; Giuliani, A.; Sabbatinelli, J.; Giordani, C.; Coppari, S.; Rippo, M.R.; Albertini, M.C.; Olivieri, F. Curcumin, Polydatin and Quercetin Synergistic Activity Protects from High-Glucose-Induced Inflammation and Oxidative Stress. Antioxidants 2022, 11, 1037. [Google Scholar] [CrossRef]
- Wang, J.; Huang, C.; Lin, Z.; Pan, X.; Chen, J.; Zheng, G.; Tian, N.; Yan, Y.; Zhang, Z.; Hu, J.; et al. Polydatin Suppresses Nucleus Pulposus Cell Senescence, Promotes Matrix Homeostasis and Attenuates Intervertebral Disc Degeneration in Rats. J. Cell. Mol. Med. 2018, 22, 5720–5731. [Google Scholar] [CrossRef]
- Wen, H.; Gao, X.; Qin, J. Probing the Anti-Aging Role of Polydatin in Caenorhabditis Elegans on a Chip. Integr. Biol. 2014, 6, 35–43. [Google Scholar] [CrossRef]
- Jiang, Y.; Zhou, Y.; Xu, W.; Wang, X.; Jin, H.; Bao, X.; Lu, C. Induction of Sestrin2 by Pterostilbene Suppresses Ethanol-Triggered Hepatocyte Senescence by Degrading CCN1 via P62-Dependent Selective Autophagy. Cell Biol. Toxicol. 2021, 39, 729–749. [Google Scholar] [CrossRef] [PubMed]
- Teng, W.-L.; Huang, P.-H.; Wang, H.-C.; Tseng, C.-H.; Yen, F.-L. Pterostilbene Attenuates Particulate Matter-Induced Oxidative Stress, Inflammation and Aging in Keratinocytes. Antioxidants 2021, 10, 1552. [Google Scholar] [CrossRef] [PubMed]
- Huang, P.-P.; Fu, J.; Liu, L.-H.; Wu, K.-F.; Liu, H.-X.; Qi, B.-M.; Liu, Y.; Qi, B.-L. Honokiol Antagonizes Doxorubicin-induced Cardiomyocyte Senescence by Inhibiting TXNIP-mediated NLRP3 Inflammasome Activation. Int. J. Mol. Med. 2020, 45, 186–194. [Google Scholar] [CrossRef]
- Seto, E.; Yoshida, M. Erasers of Histone Acetylation: The Histone Deacetylase Enzymes. Cold Spring Harb. Perspect. Biol. 2014, 6, a018713. [Google Scholar] [CrossRef] [PubMed]
- van de Ven, R.A.H.; Santos, D.; Haigis, M.C. Mitochondrial Sirtuins and Molecular Mechanisms of Aging. Trends Mol. Med. 2017, 23, 320–331. [Google Scholar] [CrossRef]
- Matsushima, S.; Sadoshima, J. The Role of Sirtuins in Cardiac Disease. Am. J. Physiol. Heart Circ. Physiol. 2015, 309, H1375–H1389. [Google Scholar] [CrossRef] [PubMed]
- Kane, A.E.; Sinclair, D.A. Sirtuins and NAD+ in the Development and Treatment of Metabolic and Cardiovascular Diseases. Circ. Res. 2018, 123, 868–885. [Google Scholar] [CrossRef]
- Spallarossa, P.; Altieri, P.; Aloi, C.; Garibaldi, S.; Barisione, C.; Ghigliotti, G.; Fugazza, G.; Barsotti, A.; Brunelli, C. Doxorubicin Induces Senescence or Apoptosis in Rat Neonatal Cardiomyocytes by Regulating the Expression Levels of the Telomere Binding Factors 1 and 2. Am. J. Physiol. Heart Circ. Physiol. 2009, 297, H2169–H2181. [Google Scholar] [CrossRef] [PubMed]
- Allegretti, M.; Ricciardi, M.R.; Licchetta, R.; Mirabilii, S.; Orecchioni, S.; Reggiani, F.; Talarico, G.; Foà, R.; Bertolini, F.; Amadori, S.; et al. The Pan-Class I Phosphatidyl-Inositol-3 Kinase Inhibitor NVP-BKM120 Demonstrates Anti-Leukemic Activity in Acute Myeloid Leukemia. Sci. Rep. 2015, 5, 18137. [Google Scholar] [CrossRef] [PubMed]
- Divakaruni, A.S.; Paradyse, A.; Ferrick, D.A.; Murphy, A.N.; Jastroch, M. Analysis and Interpretation of Microplate-Based Oxygen Consumption and PH Data. In Methods in Enzymology; Elsevier: Amsterdam, The Netherlands, 2014; Volume 547, pp. 309–354. ISBN 978-0-12-801415-8. [Google Scholar]
- Modesti, A.; Masuelli, L.; Modica, A.; D’Orazi, G.; Scarpa, S.; Bosco, M.C.; Forni, G. Ultrastructural Evidence of the Mechanisms Responsible for Interleukin-4-Activated Rejection of a Spontaneous Murine Adenocarcinoma. Int. J. Cancer 1993, 53, 988–993. [Google Scholar] [CrossRef]
- Franchini, V.; De Sanctis, S.; Marinaccio, J.; De Amicis, A.; Coluzzi, E.; Di Cristofaro, S.; Lista, F.; Regalbuto, E.; Doria, A.; Giovenale, E.; et al. Study of the Effects of 0.15 Terahertz Radiation on Genome Integrity of Adult Fibroblasts. Environ. Mol. Mutagen. 2018, 59, 476–487. [Google Scholar] [CrossRef] [PubMed]
- Altieri, P.; Barisione, C.; Lazzarini, E.; Garuti, A.; Bezante, G.P.; Canepa, M.; Spallarossa, P.; Tocchetti, C.G.; Bollini, S.; Brunelli, C.; et al. Testosterone Antagonizes Doxorubicin-Induced Senescence of Cardiomyocytes. J. Am. Heart Assoc. 2016, 5, e002383. [Google Scholar] [CrossRef]
- Lee, S.-H.; Lee, J.-H.; Lee, H.-Y.; Min, K.-J. Sirtuin Signaling in Cellular Senescence and Aging. BMB Rep. 2019, 52, 24–34. [Google Scholar] [CrossRef]
- He, L.; Liu, F.; Li, J. Mitochondrial Sirtuins and Doxorubicin-Induced Cardiotoxicity. Cardiovasc. Toxicol. 2021, 21, 179–191. [Google Scholar] [CrossRef]
- Wallace, K.B.; Sardão, V.A.; Oliveira, P.J. Mitochondrial Determinants of Doxorubicin-Induced Cardiomyopathy. Circ. Res. 2020, 126, 926–941. [Google Scholar] [CrossRef]
- Wang, X.-Q.; Shao, Y.; Ma, C.-Y.; Chen, W.; Sun, L.; Liu, W.; Zhang, D.-Y.; Fu, B.-C.; Liu, K.-Y.; Jia, Z.-B.; et al. Decreased SIRT3 in Aged Human Mesenchymal Stromal/Stem Cells Increases Cellular Susceptibility to Oxidative Stress. J. Cell. Mol. Med. 2014, 18, 2298–2310. [Google Scholar] [CrossRef]
- Ma, C.; Sun, Y.; Pi, C.; Wang, H.; Sun, H.; Yu, X.; Shi, Y.; He, X. Sirt3 Attenuates Oxidative Stress Damage and Rescues Cellular Senescence in Rat Bone Marrow Mesenchymal Stem Cells by Targeting Superoxide Dismutase 2. Front. Cell Dev. Biol. 2020, 8, 599376. [Google Scholar] [CrossRef]
- Li, P.; Newhardt, M.F.; Matsuzaki, S.; Eyster, C.; Pranay, A.; Peelor, F.F.; Batushansky, A.; Kinter, C.; Subramani, K.; Subrahmanian, S.; et al. The Loss of Cardiac SIRT3 Decreases Metabolic Flexibility and Proteostasis in an Age-Dependent Manner. GeroScience 2023, 45, 983–999. [Google Scholar] [CrossRef] [PubMed]
- Haigis, M.C.; Mostoslavsky, R.; Haigis, K.M.; Fahie, K.; Christodoulou, D.C.; Murphy, A.J.; Valenzuela, D.M.; Yancopoulos, G.D.; Karow, M.; Blander, G.; et al. SIRT4 Inhibits Glutamate Dehydrogenase and Opposes the Effects of Calorie Restriction in Pancreatic Beta Cells. Cell 2006, 126, 941–954. [Google Scholar] [CrossRef] [PubMed]
- Liang, W.J.; Gustafsson, Å.B. The Aging Heart: Mitophagy at the Center of Rejuvenation. Front. Cardiovasc. Med. 2020, 7, 18. [Google Scholar] [CrossRef]
- Sivandzade, F.; Bhalerao, A.; Cucullo, L. Analysis of the Mitochondrial Membrane Potential Using the Cationic JC-1 Dye as a Sensitive Fluorescent Probe. Bio-Protocol 2019, 9, e3128. [Google Scholar] [CrossRef] [PubMed]
- Dimri, G.P.; Lee, X.; Basile, G.; Acosta, M.; Scott, G.; Roskelley, C.; Medrano, E.E.; Linskens, M.; Rubelj, I.; Pereira-Smith, O. A Biomarker That Identifies Senescent Human Cells in Culture and in Aging Skin in Vivo. Proc. Natl. Acad. Sci. USA 1995, 92, 9363–9367. [Google Scholar] [CrossRef] [PubMed]
- Luo, Y.-X.; Tang, X.; An, X.-Z.; Xie, X.-M.; Chen, X.-F.; Zhao, X.; Hao, D.-L.; Chen, H.-Z.; Liu, D.-P. SIRT4 Accelerates Ang II-Induced Pathological Cardiac Hypertrophy by Inhibiting Manganese Superoxide Dismutase Activity. Eur. Heart J. 2017, 38, 1389–1398. [Google Scholar] [CrossRef] [PubMed]
- Minguzzi, M.; Cetrullo, S.; D’Adamo, S.; Silvestri, Y.; Flamigni, F.; Borzì, R.M. Emerging Players at the Intersection of Chondrocyte Loss of Maturational Arrest, Oxidative Stress, Senescence and Low-Grade Inflammation in Osteoarthritis. Oxid. Med. Cell. Longev. 2018, 2018, 3075293. [Google Scholar] [CrossRef]
- Del Pinto, R.; Ferri, C. Inflammation-Accelerated Senescence and the Cardiovascular System: Mechanisms and Perspectives. Int. J. Mol. Sci. 2018, 19, 3701. [Google Scholar] [CrossRef]
- Gugliandolo, E.; Fusco, R.; Biundo, F.; D’Amico, R.; Benedetto, F.; Di Paola, R.; Cuzzocrea, S. Palmitoylethanolamide and Polydatin Combination Reduces Inflammation and Oxidative Stress in Vascular Injury. Pharmacol. Res. 2017, 123, 83–92. [Google Scholar] [CrossRef]
- Herranz, N.; Gil, J. Mitochondria and Senescence: New Actors for an Old Play. EMBO J. 2016, 35, 701–702. [Google Scholar] [CrossRef]
- De Gaetano, A.; Gibellini, L.; Zanini, G.; Nasi, M.; Cossarizza, A.; Pinti, M. Mitophagy and Oxidative Stress: The Role of Aging. Antioxidants 2021, 10, 794. [Google Scholar] [CrossRef]
- Li, J.; Lin, Q.; Shao, X.; Li, S.; Zhu, X.; Wu, J.; Mou, S.; Gu, L.; Wang, Q.; Zhang, M.; et al. HIF1α-BNIP3-Mediated Mitophagy Protects against Renal Fibrosis by Decreasing ROS and Inhibiting Activation of the NLRP3 Inflammasome. Cell Death Dis. 2023, 14, 200. [Google Scholar] [CrossRef] [PubMed]
- Liu, S.; Wang, C.; Zhang, Y.; Zhang, Y.; Song, Y.; Jiang, J.; Liu, R.; Jin, H.; Yan, G.; Jin, Y. Polydatin Inhibits Mitochondrial Damage and Mitochondrial ROS by Promoting PINK1-Parkin-Mediated Mitophagy in Allergic Rhinitis. FASEB J. 2023, 37, e22852. [Google Scholar] [CrossRef]
- Wan, W.; Hua, F.; Fang, P.; Li, C.; Deng, F.; Chen, S.; Ying, J.; Wang, X. Regulation of Mitophagy by Sirtuin Family Proteins: A Vital Role in Aging and Age-Related Diseases. Front. Aging Neurosci. 2022, 14, 845330. [Google Scholar] [CrossRef] [PubMed]
- Zheng, Y.; Shi, B.; Ma, M.; Wu, X.; Lin, X. The Novel Relationship between Sirt3 and Autophagy in Myocardial Ischemia–Reperfusion. J. Cell. Physiol. 2019, 234, 5488–5495. [Google Scholar] [CrossRef]
- Zhang, M.; Zhao, Z.; Shen, M.; Zhang, Y.; Duan, J.; Guo, Y.; Zhang, D.; Hu, J.; Lin, J.; Man, W.; et al. Polydatin Protects Cardiomyocytes against Myocardial Infarction Injury by Activating Sirt3. Biochim. Biophys. Acta Mol. Basis Dis. 2017, 1863, 1962–1972. [Google Scholar] [CrossRef] [PubMed]
- Zhang, M.; Wang, S.; Cheng, Z.; Xiong, Z.; Lv, J.; Yang, Z.; Li, T.; Jiang, S.; Gu, J.; Sun, D.; et al. Polydatin Ameliorates Diabetic Cardiomyopathy via Sirt3 Activation. Biochem. Biophys. Res. Commun. 2017, 493, 1280–1287. [Google Scholar] [CrossRef]
- Wei, T.; Huang, G.; Gao, J.; Huang, C.; Sun, M.; Wu, J.; Bu, J.; Shen, W. Sirtuin 3 Deficiency Accelerates Hypertensive Cardiac Remodeling by Impairing Angiogenesis. J. Am. Heart Assoc. 2017, 6, e006114. [Google Scholar] [CrossRef]
- Li, R.; Xin, T.; Li, D.; Wang, C.; Zhu, H.; Zhou, H. Therapeutic Effect of Sirtuin 3 on Ameliorating Nonalcoholic Fatty Liver Disease: The Role of the ERK-CREB Pathway and Bnip3-Mediated Mitophagy. Redox Biol. 2018, 18, 229–243. [Google Scholar] [CrossRef]
- Zhao, D.; Sun, Y.; Tan, Y.; Zhang, Z.; Hou, Z.; Gao, C.; Feng, P.; Zhang, X.; Yi, W.; Gao, F. Short-Duration Swimming Exercise after Myocardial Infarction Attenuates Cardiac Dysfunction and Regulates Mitochondrial Quality Control in Aged Mice. Oxid. Med. Cell. Longev. 2018, 2018, 4079041. [Google Scholar] [CrossRef]
- Parodi-Rullán, R.M.; Chapa-Dubocq, X.R.; Javadov, S. Acetylation of Mitochondrial Proteins in the Heart: The Role of SIRT3. Front. Physiol. 2018, 9, 1094. [Google Scholar] [CrossRef]
- Tomczyk, M.M.; Cheung, K.G.; Xiang, B.; Tamanna, N.; Fonseca Teixeira, A.L.; Agarwal, P.; Kereliuk, S.M.; Spicer, V.; Lin, L.; Treberg, J.; et al. Mitochondrial Sirtuin-3 (SIRT3) Prevents Doxorubicin-Induced Dilated Cardiomyopathy by Modulating Protein Acetylation and Oxidative Stress. Circ. Heart Fail. 2022, 15, e008547. [Google Scholar] [CrossRef]
- Lang, A.; Anand, R.; Altinoluk-Hambüchen, S.; Ezzahoini, H.; Stefanski, A.; Iram, A.; Bergmann, L.; Urbach, J.; Böhler, P.; Hänsel, J.; et al. SIRT4 Interacts with OPA1 and Regulates Mitochondrial Quality Control and Mitophagy. Aging 2017, 9, 2163–2189. [Google Scholar] [CrossRef] [PubMed]
- Hescheler, J.; Meyer, R.; Plant, S.; Krautwurst, D.; Rosenthal, W.; Schultz, G. Morphological, Biochemical, and Electrophysiological Characterization of a Clonal Cell (H9c2) Line from Rat Heart. Circ. Res. 1991, 69, 1476–1486. [Google Scholar] [CrossRef]
- Kimes, B.W.; Brandt, B.L. Properties of a Clonal Muscle Cell Line from Rat Heart. Exp. Cell Res. 1976, 98, 367–381. [Google Scholar] [CrossRef] [PubMed]
- Brostrom, M.A.; Reilly, B.A.; Wilson, F.J.; Brostrom, C.O. Vasopressin-Induced Hypertrophy in H9c2 Heart-Derived Myocytes. Int. J. Biochem. Cell Biol. 2000, 32, 993–1006. [Google Scholar] [CrossRef]
- Wayman, N.; McDonald, M.C.; Thompson, A.S.; Threadgill, M.D.; Thiemermann, C. 5-Aminoisoquinolinone, a Potent Inhibitor of Poly (Adenosine 5’-Diphosphate Ribose) Polymerase, Reduces Myocardial Infarct Size. Eur. J. Pharmacol. 2001, 430, 93–100. [Google Scholar] [CrossRef]
- Sardão, V.A.; Oliveira, P.J.; Holy, J.; Oliveira, C.R.; Wallace, K.B. Morphological Alterations Induced by Doxorubicin on H9c2 Myoblasts: Nuclear, Mitochondrial, and Cytoskeletal Targets. Cell Biol. Toxicol. 2009, 25, 227–243. [Google Scholar] [CrossRef] [PubMed]
- Bian, X.; Teng, T.; Zhao, H.; Qin, J.; Qiao, Z.; Sun, Y.; Liun, Z.; Xu, Z. Zinc Prevents Mitochondrial Superoxide Generation by Inducing Mitophagy in the Setting of Hypoxia/Reoxygenation in Cardiac Cells. Free Radic. Res. 2018, 52, 80–91. [Google Scholar] [CrossRef]
- Zhu, H.; Wang, X.; Meng, X.; Kong, Y.; Li, Y.; Yang, C.; Guo, Y.; Wang, X.; Yang, H.; Liu, Z.; et al. Selenium Supplementation Improved Cardiac Functions by Suppressing DNMT2-Mediated GPX1 Promoter DNA Methylation in AGE-Induced Heart Failure. Oxid. Med. Cell. Longev. 2022, 2022, 5402997. [Google Scholar] [CrossRef] [PubMed]
- Finkel, T.; Holbrook, N.J. Oxidants, Oxidative Stress and the Biology of Ageing. Nature 2000, 408, 239–247. [Google Scholar] [CrossRef] [PubMed]
- Pellegrino, D. Antioxidants and Cardiovascular Risk Factors. Diseases 2016, 4, 11. [Google Scholar] [CrossRef] [PubMed]


Disclaimer/Publisher’s Note: The statements, opinions and data contained in all publications are solely those of the individual author(s) and contributor(s) and not of MDPI and/or the editor(s). MDPI and/or the editor(s) disclaim responsibility for any injury to people or property resulting from any ideas, methods, instructions or products referred to in the content. |
© 2023 by the authors. Licensee MDPI, Basel, Switzerland. This article is an open access article distributed under the terms and conditions of the Creative Commons Attribution (CC BY) license (https://creativecommons.org/licenses/by/4.0/).
Share and Cite
Foglio, E.; D’Avorio, E.; Vitiello, L.; Masuelli, L.; Bei, R.; Pacifici, F.; Della-Morte, D.; Mirabilii, S.; Ricciardi, M.R.; Tafuri, A.; et al. Doxorubicin-Induced Cardiac Senescence Is Alleviated Following Treatment with Combined Polyphenols and Micronutrients through Enhancement in Mitophagy. Cells 2023, 12, 2605. https://doi.org/10.3390/cells12222605
Foglio E, D’Avorio E, Vitiello L, Masuelli L, Bei R, Pacifici F, Della-Morte D, Mirabilii S, Ricciardi MR, Tafuri A, et al. Doxorubicin-Induced Cardiac Senescence Is Alleviated Following Treatment with Combined Polyphenols and Micronutrients through Enhancement in Mitophagy. Cells. 2023; 12(22):2605. https://doi.org/10.3390/cells12222605
Chicago/Turabian StyleFoglio, Eleonora, Erica D’Avorio, Laura Vitiello, Laura Masuelli, Roberto Bei, Francesca Pacifici, David Della-Morte, Simone Mirabilii, Maria Rosaria Ricciardi, Agostino Tafuri, and et al. 2023. "Doxorubicin-Induced Cardiac Senescence Is Alleviated Following Treatment with Combined Polyphenols and Micronutrients through Enhancement in Mitophagy" Cells 12, no. 22: 2605. https://doi.org/10.3390/cells12222605