
Chloroquine Enhances Death in Lung Adenocarcinoma A549 Cells Exposed to Cold Atmospheric Plasma Jet
 , , , , and
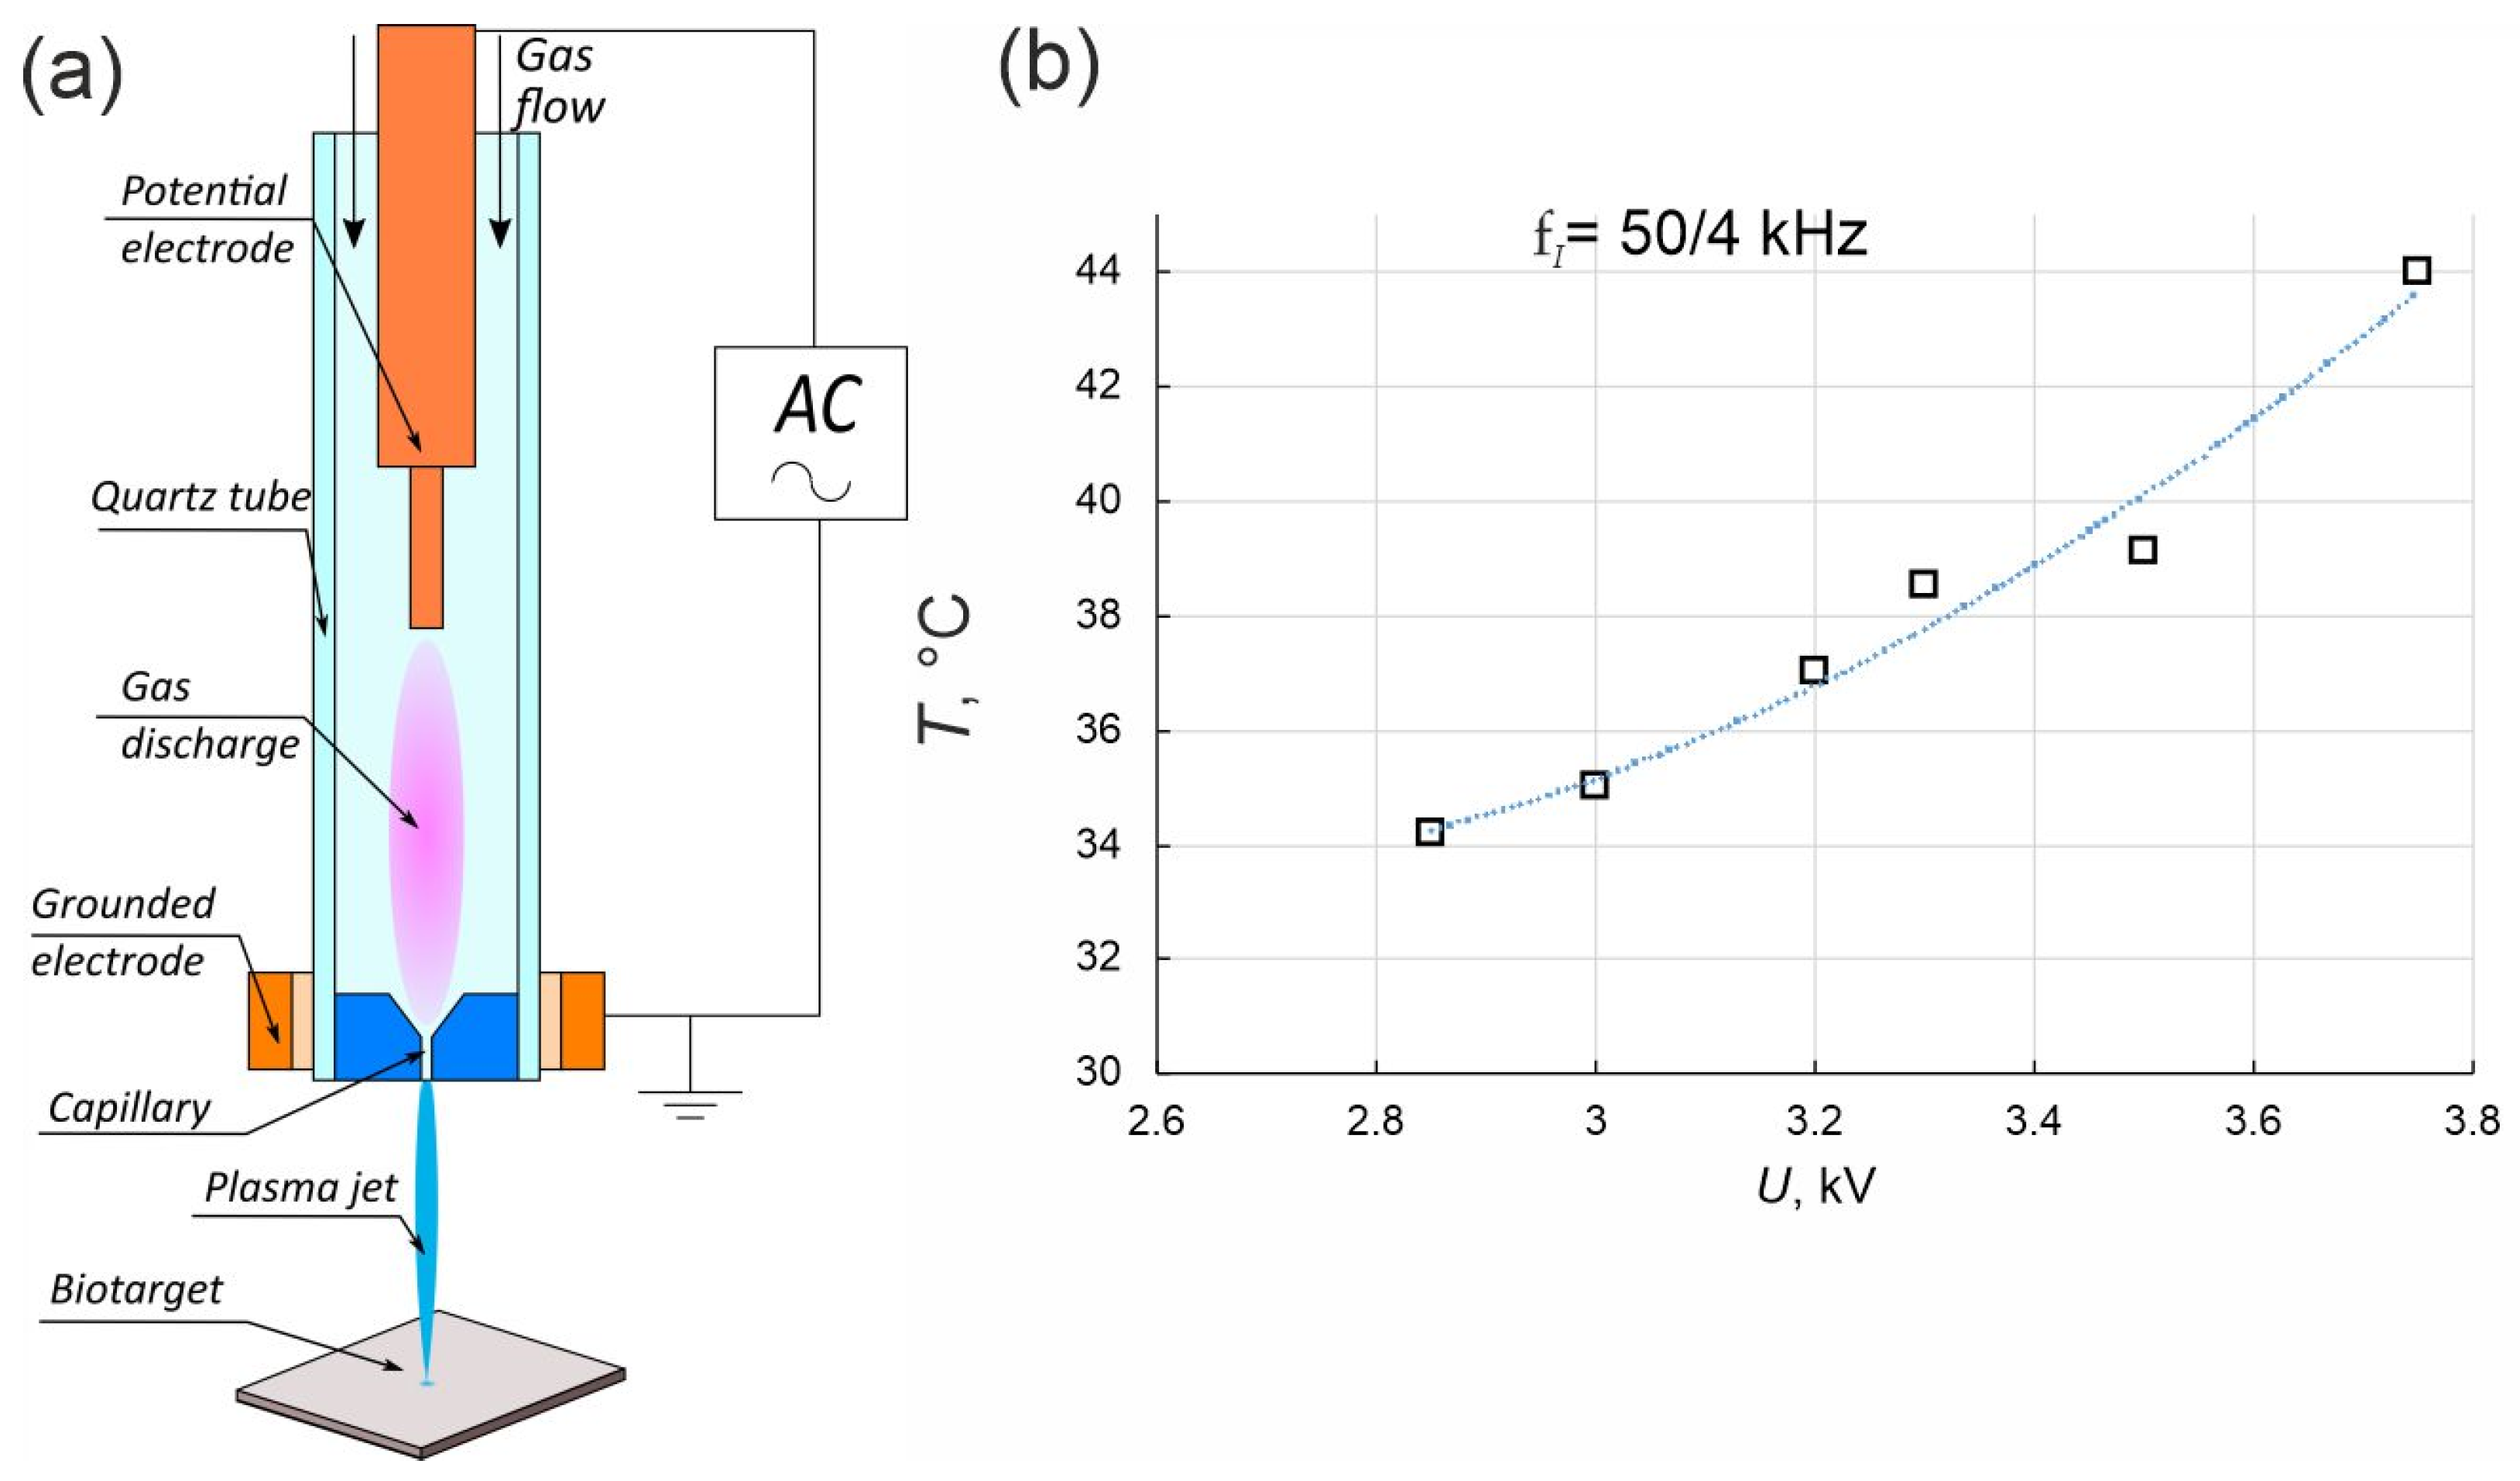
Abstract
:1. Introduction
2. Materials and Methods
2.1. Cell Cultures
2.2. Experimental Plasma Jet Setup and Plasma Jet Simulation Details
2.3. Cell Viability Assay
2.4. Cell Death Analysis with Annexin V/PI-Staining
2.5. Measurement of ROS
2.6. RNA-Seq and Transcriptome Analysis
2.7. Western Blot
2.8. Cellular Fractionation
2.9. Cathepsin D Activity Assay
2.10. Lysosomes Content Analysis with Acridine Orange
2.11. Lysosomes Content Analysis with LysoTracker
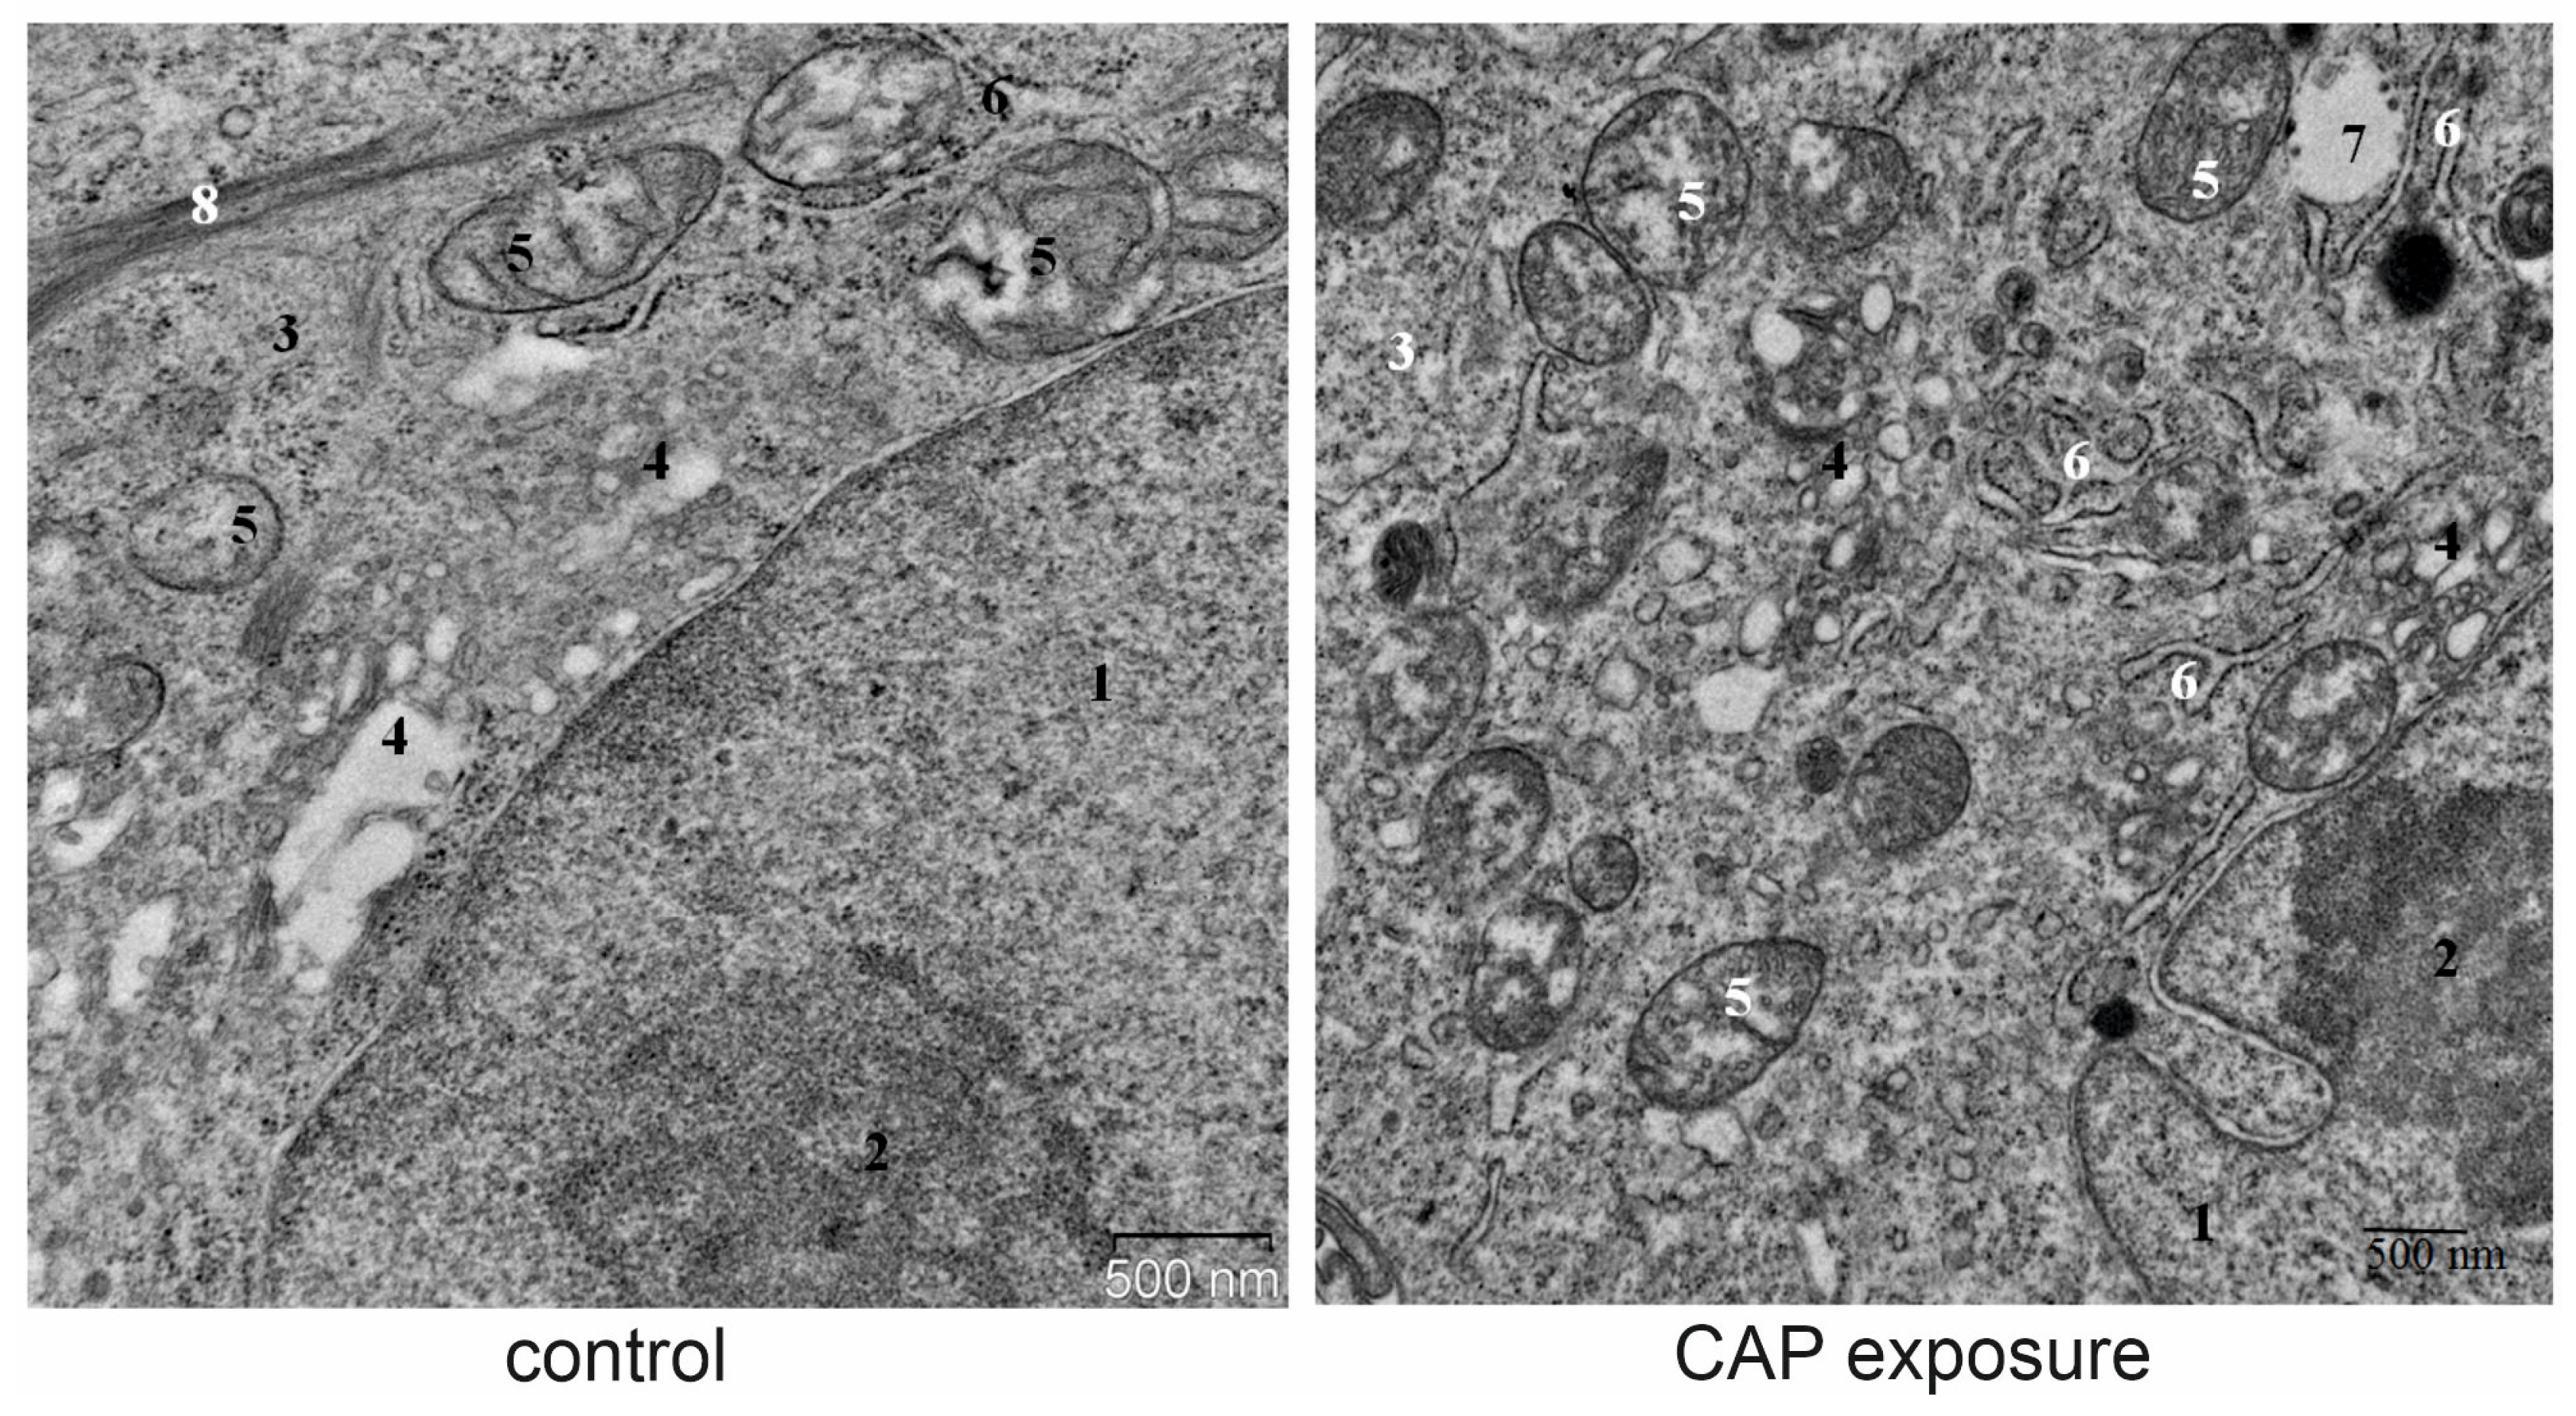
2.12. Transmission Electron Microscopy
2.13. Statistical Analysis
3. Results
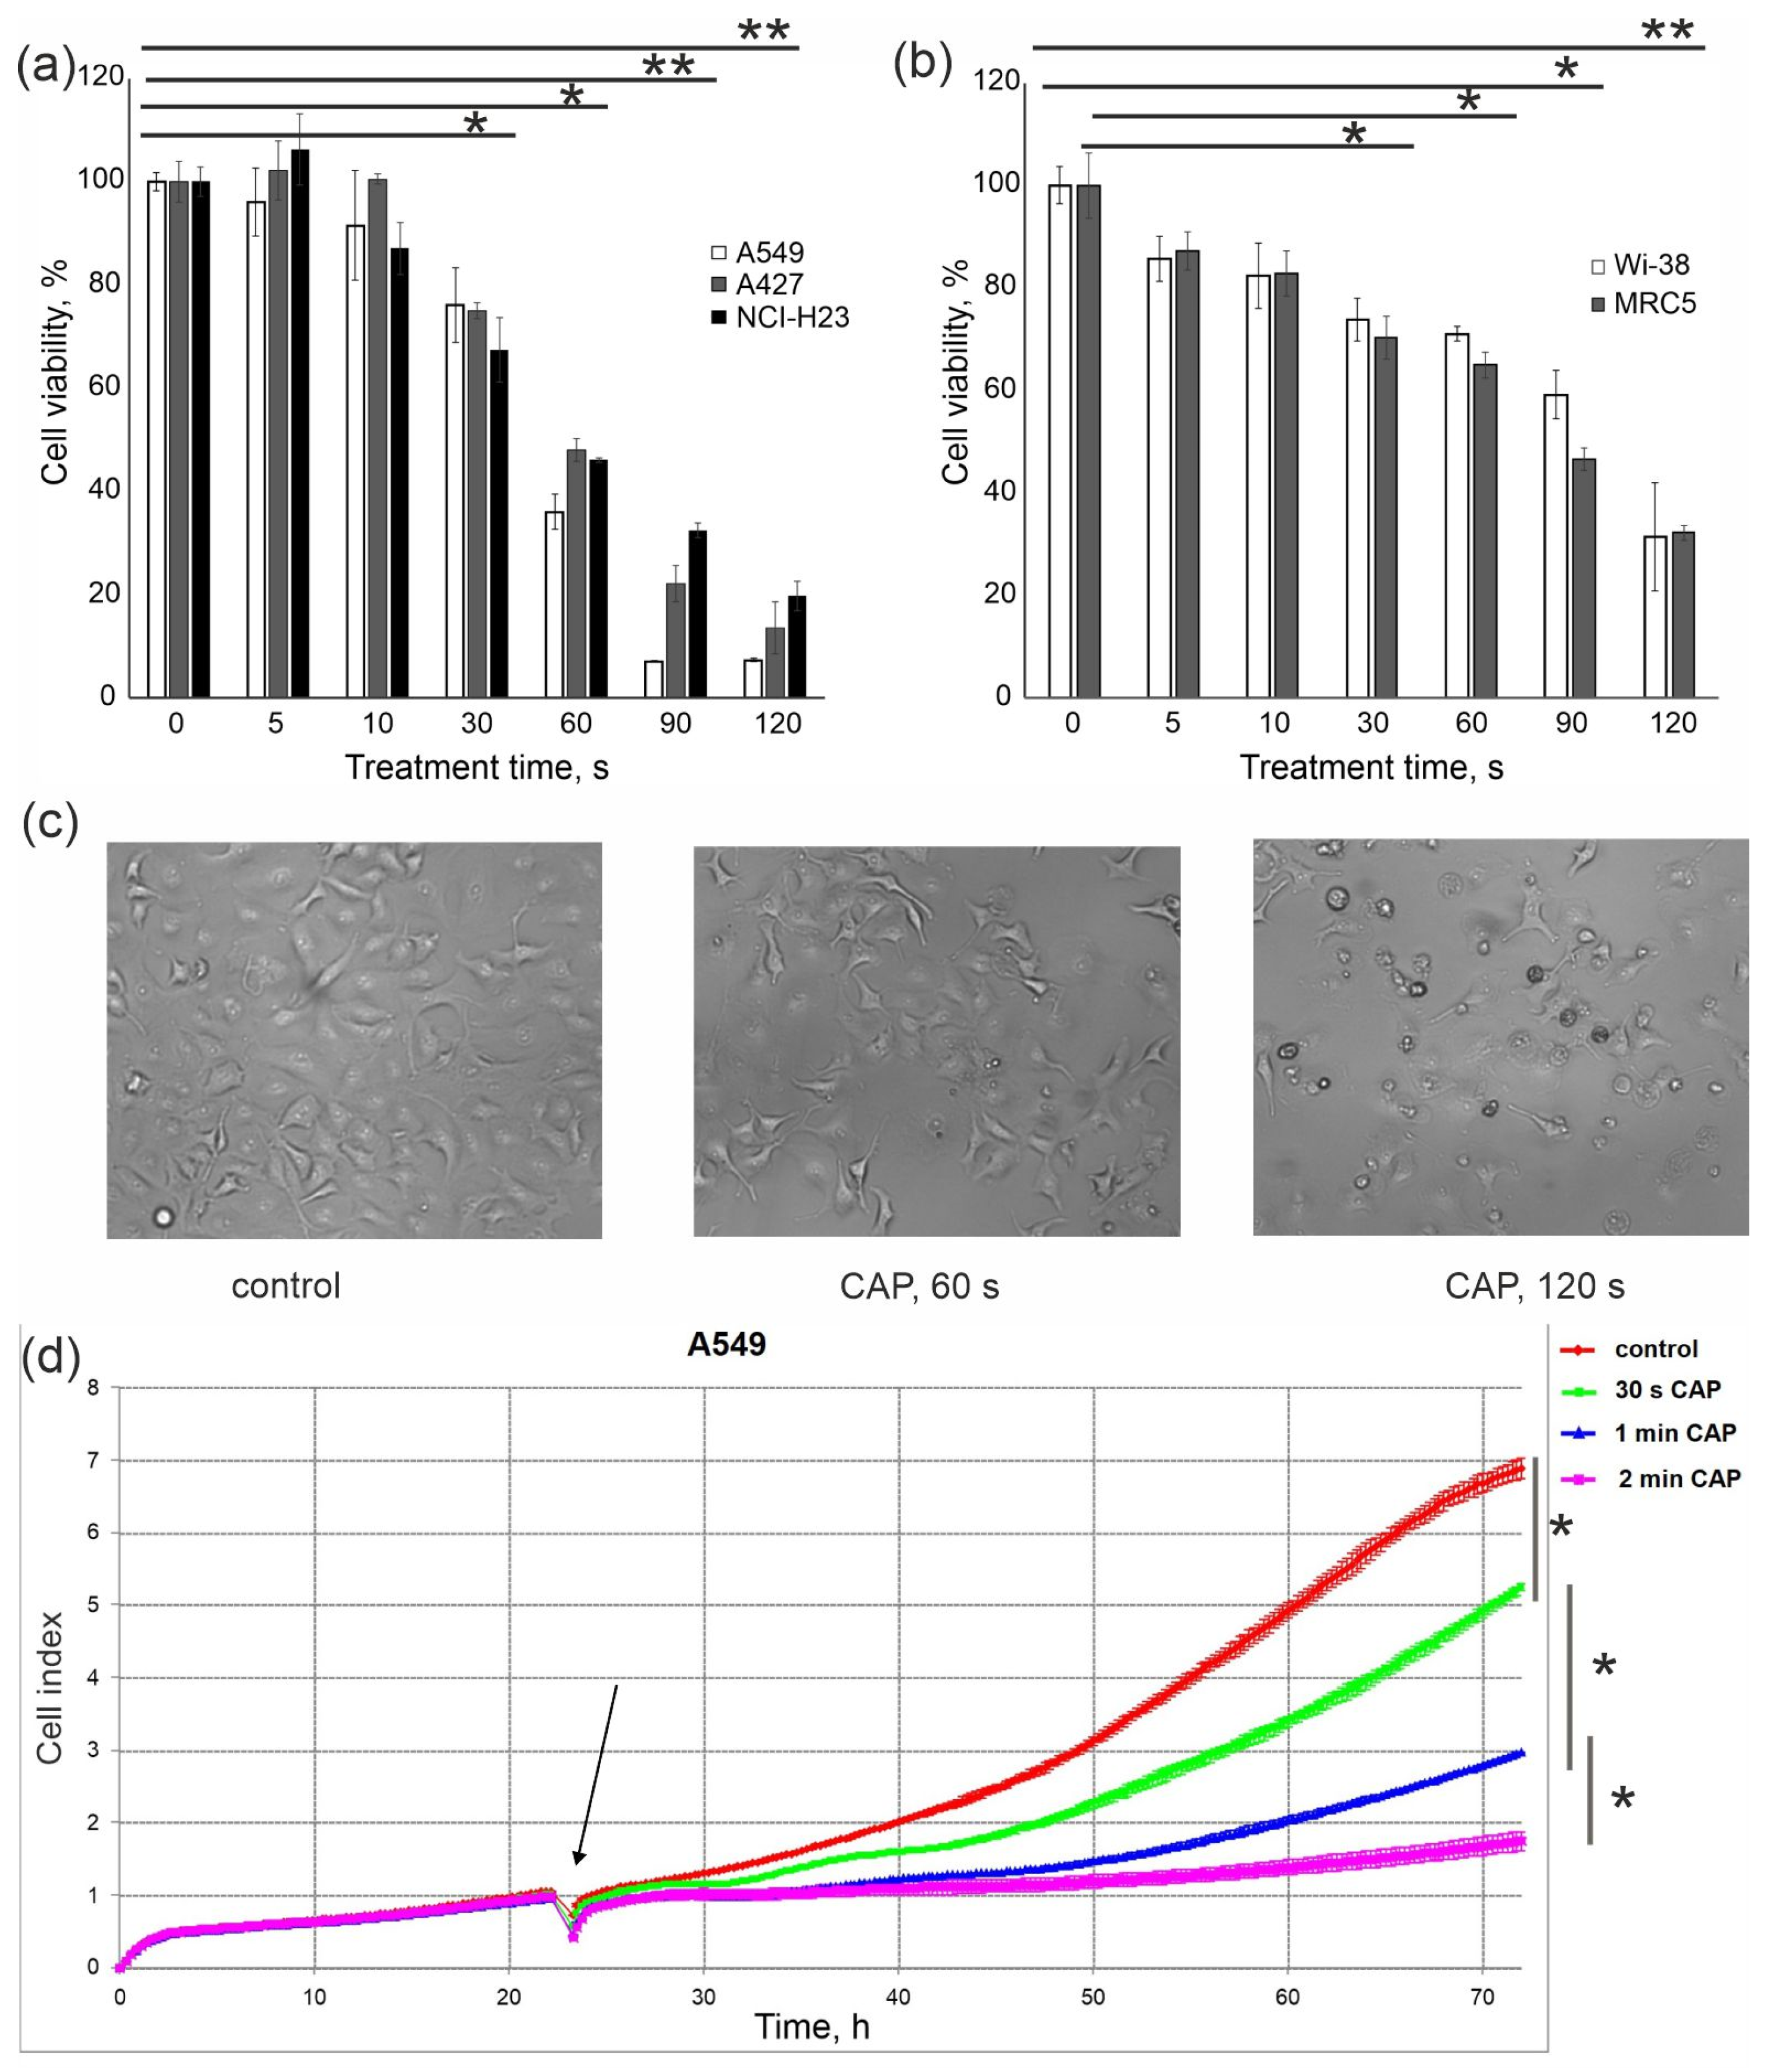
3.1. Finding CAP Exposure Regimens for Predominant Death Induction in Cancer Cells
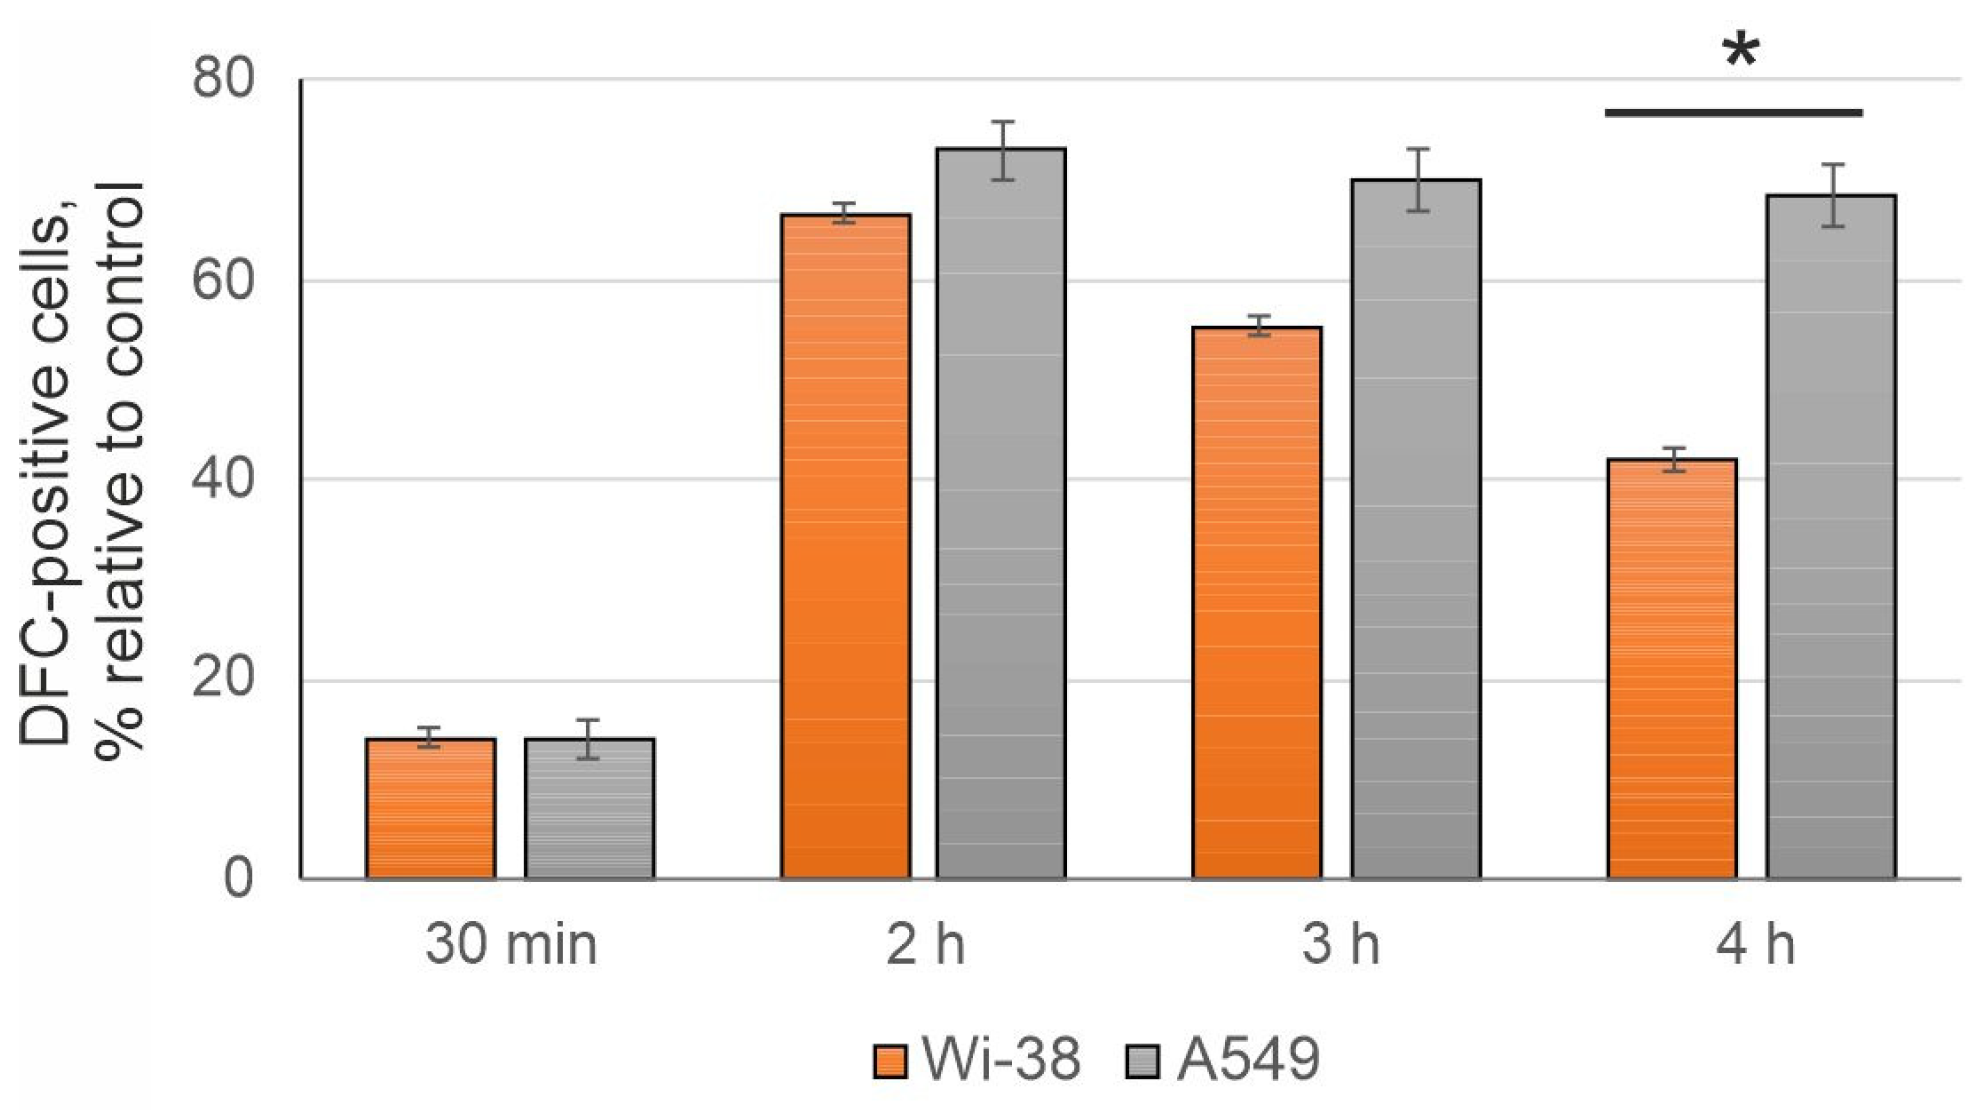
3.2. The CAP-Dependent Increase of Intracellular ROS
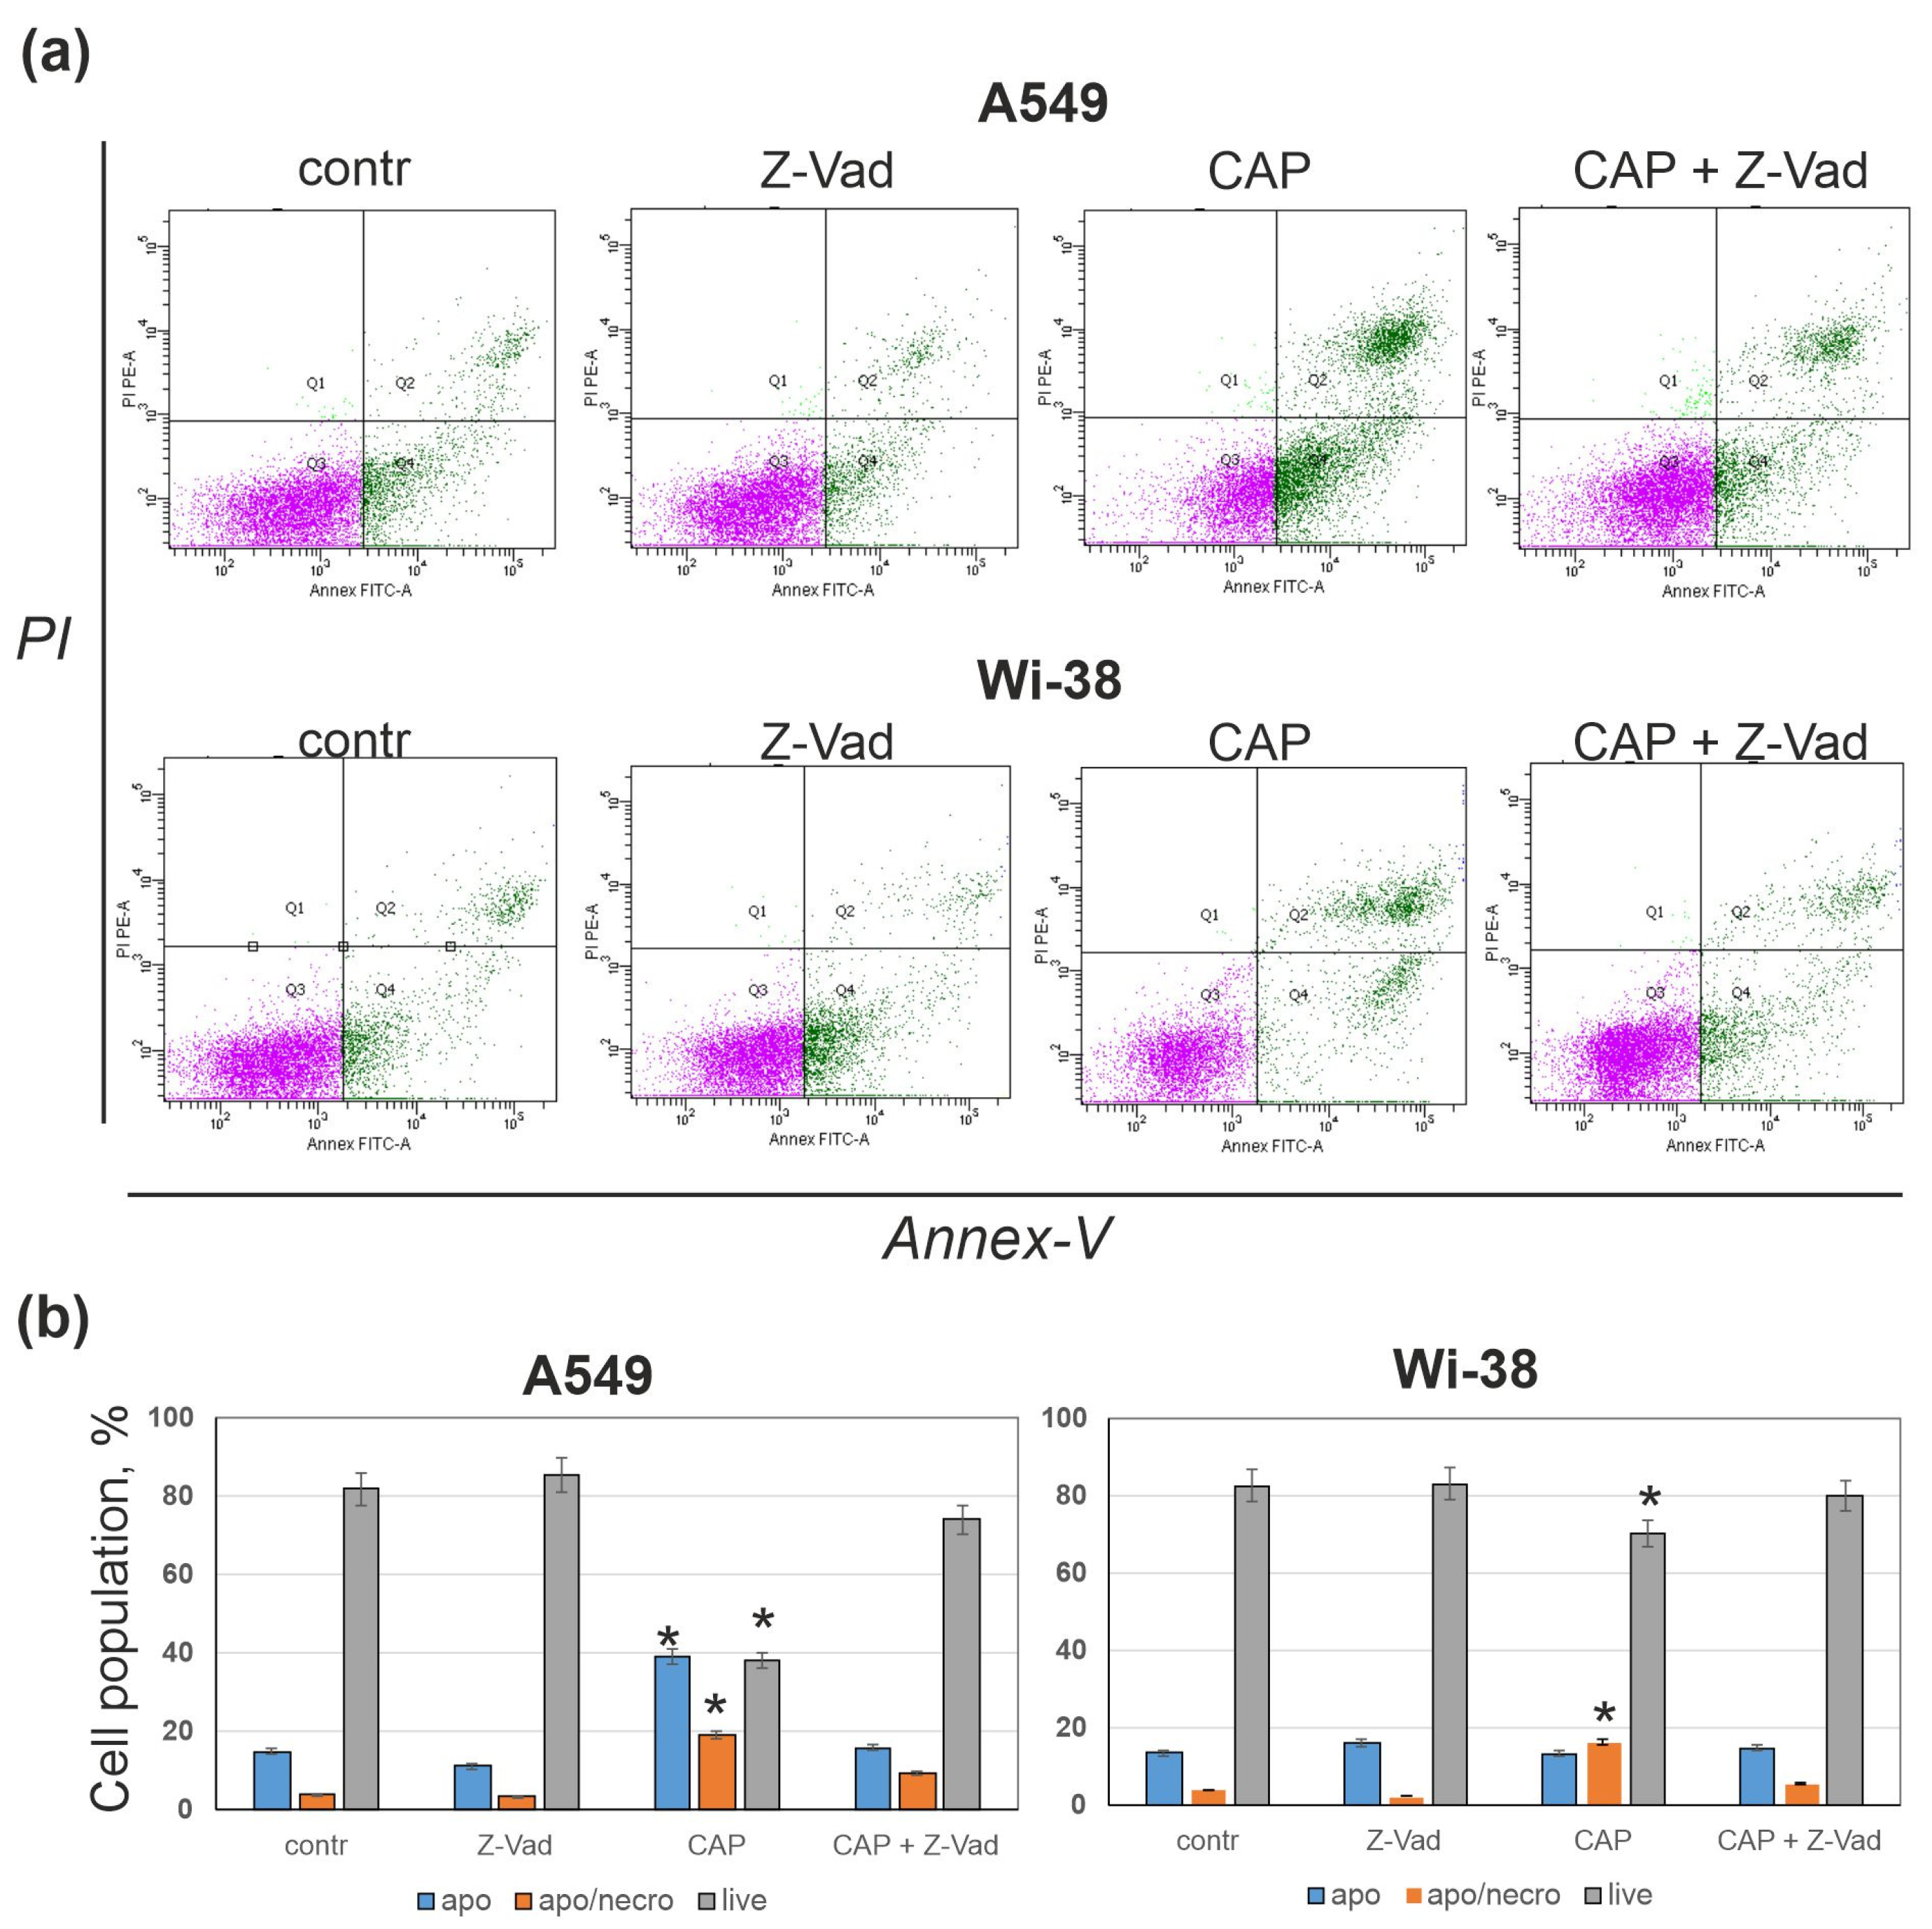
3.3. Pan-Caspase Inhibitor Z-Vad Markedly Suppresses CAP-Dependent Cell Death
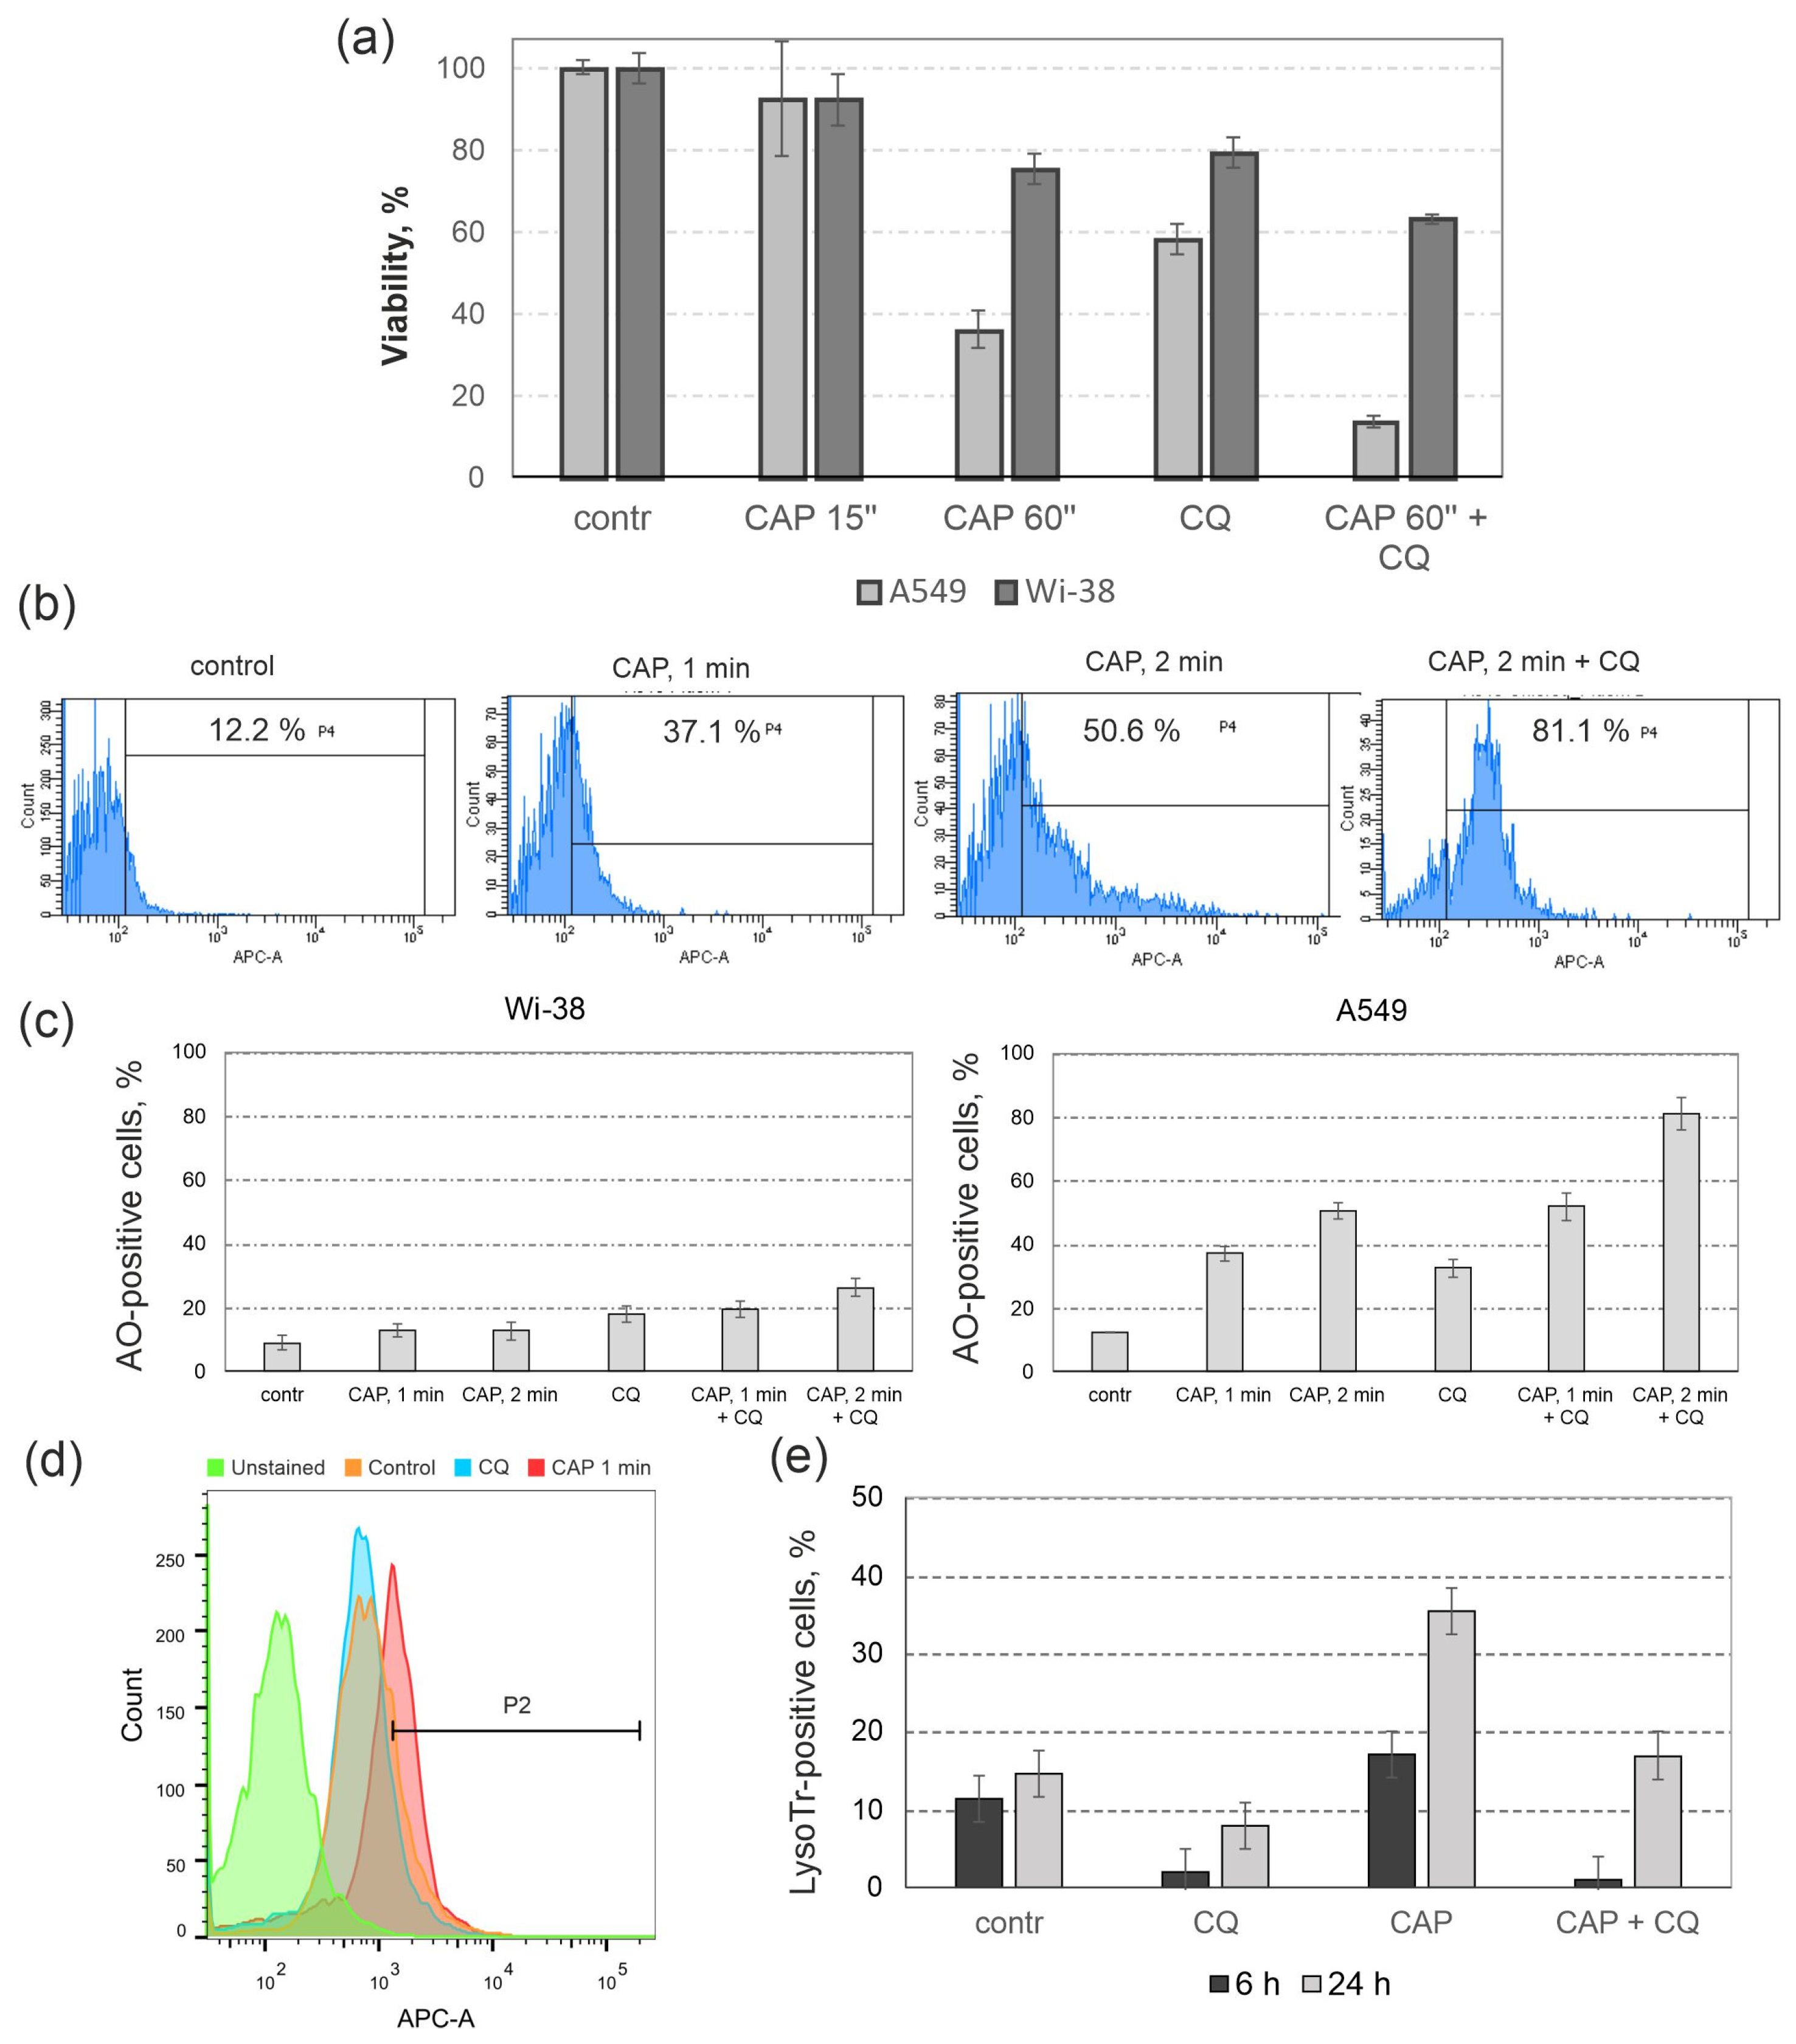
3.4. The Influence of Autophagy Inhibitor Chloroquine (CQ) on the Cytotoxic Effects of CAP
3.5. Lysosomal Response to CAP Treatment and to Autophagy Inhibition
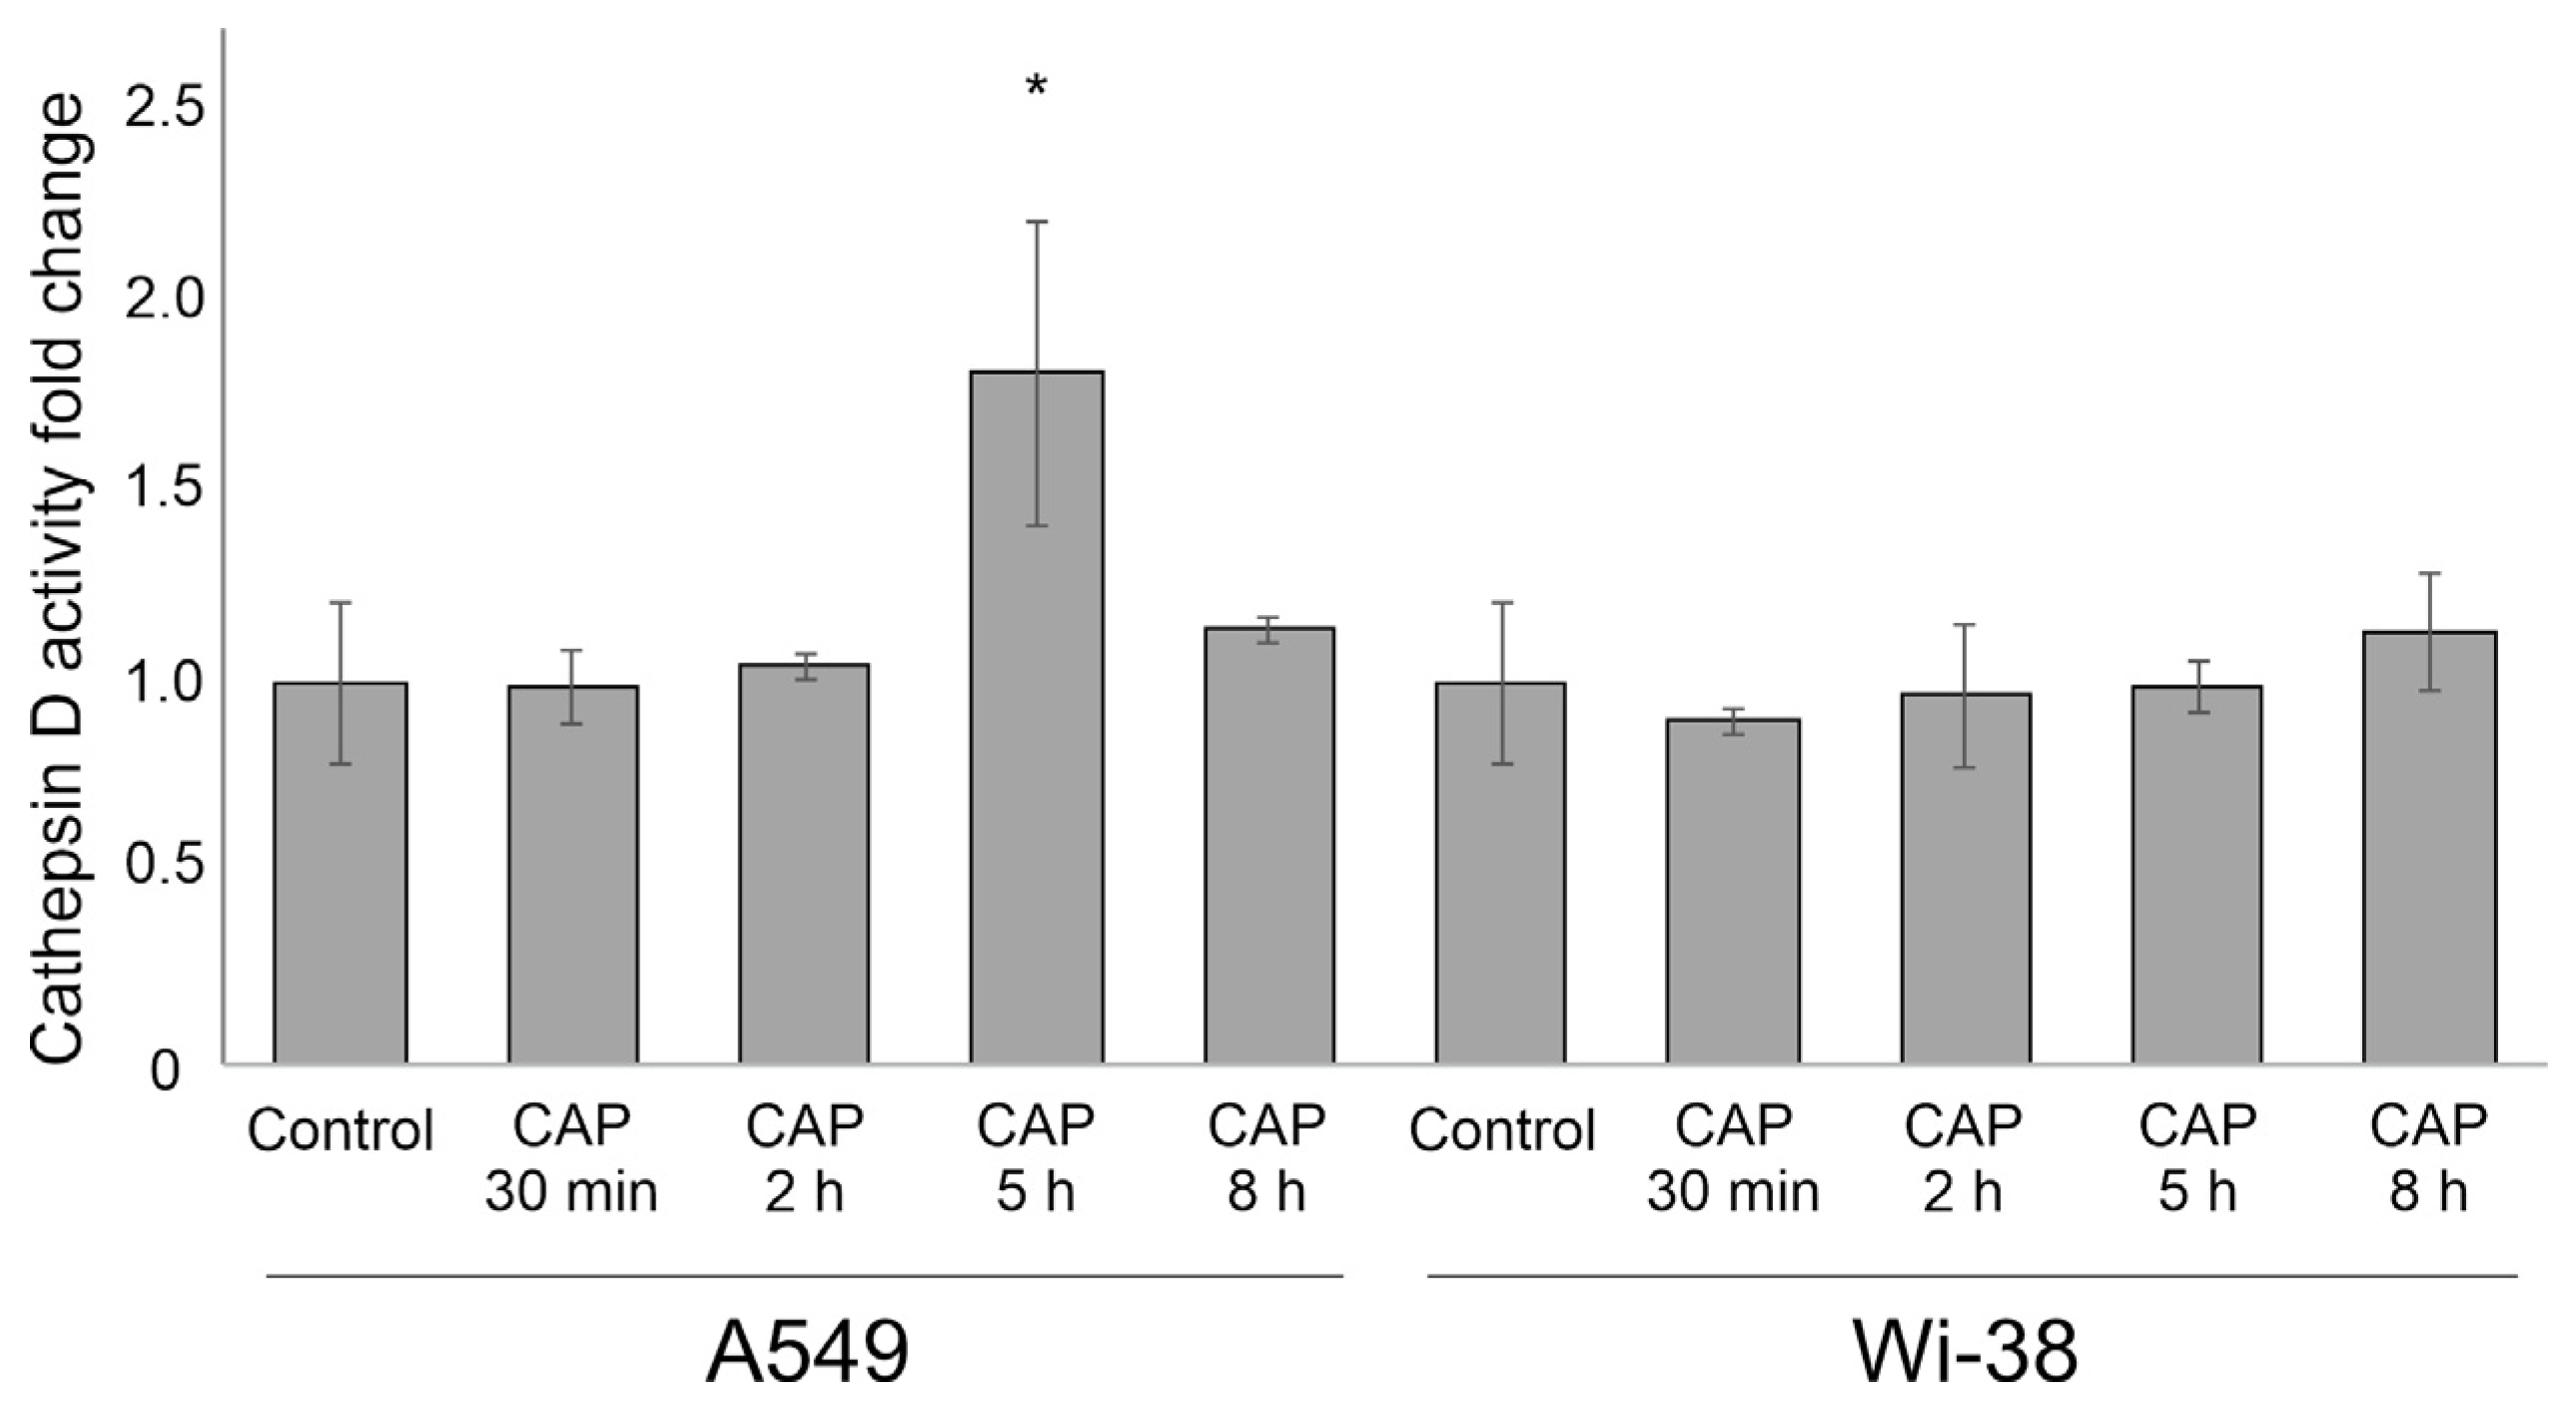
3.6. Cathepsin D Activity after CAP Exposure
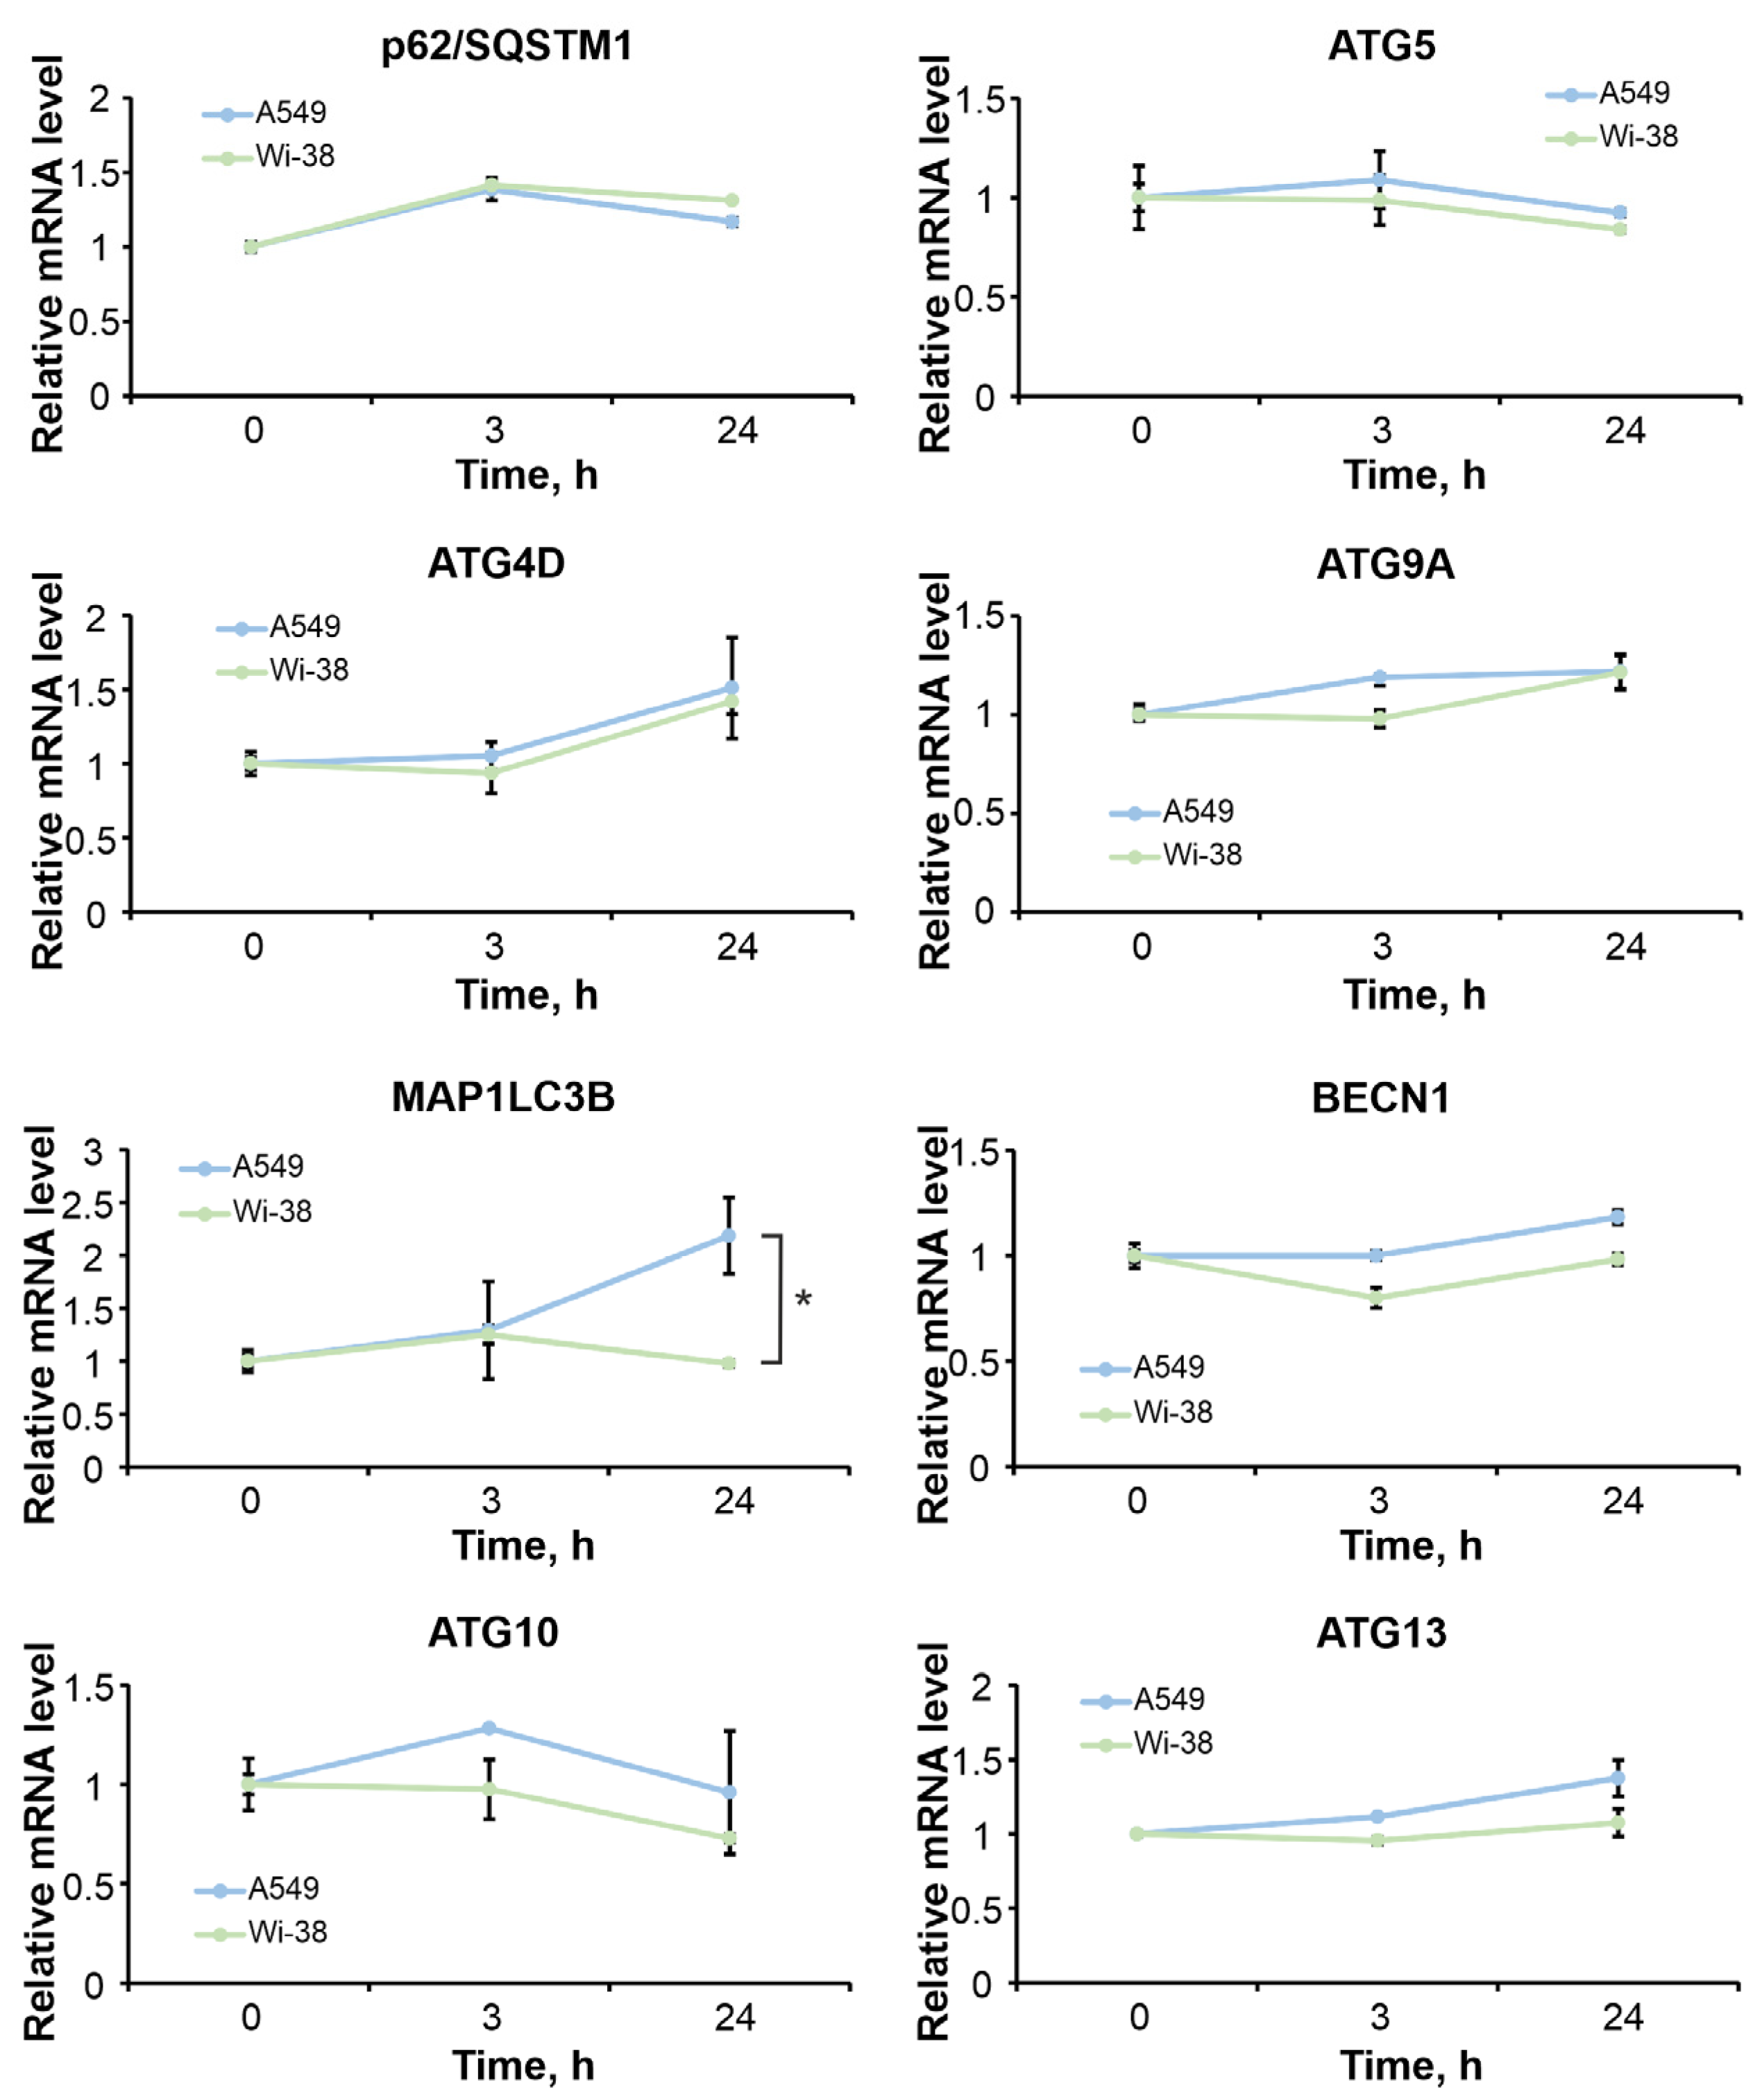
3.7. The Differences in Autophagy-Related Gene Responses to CAP Exposure in Cancer and Healthy Cells
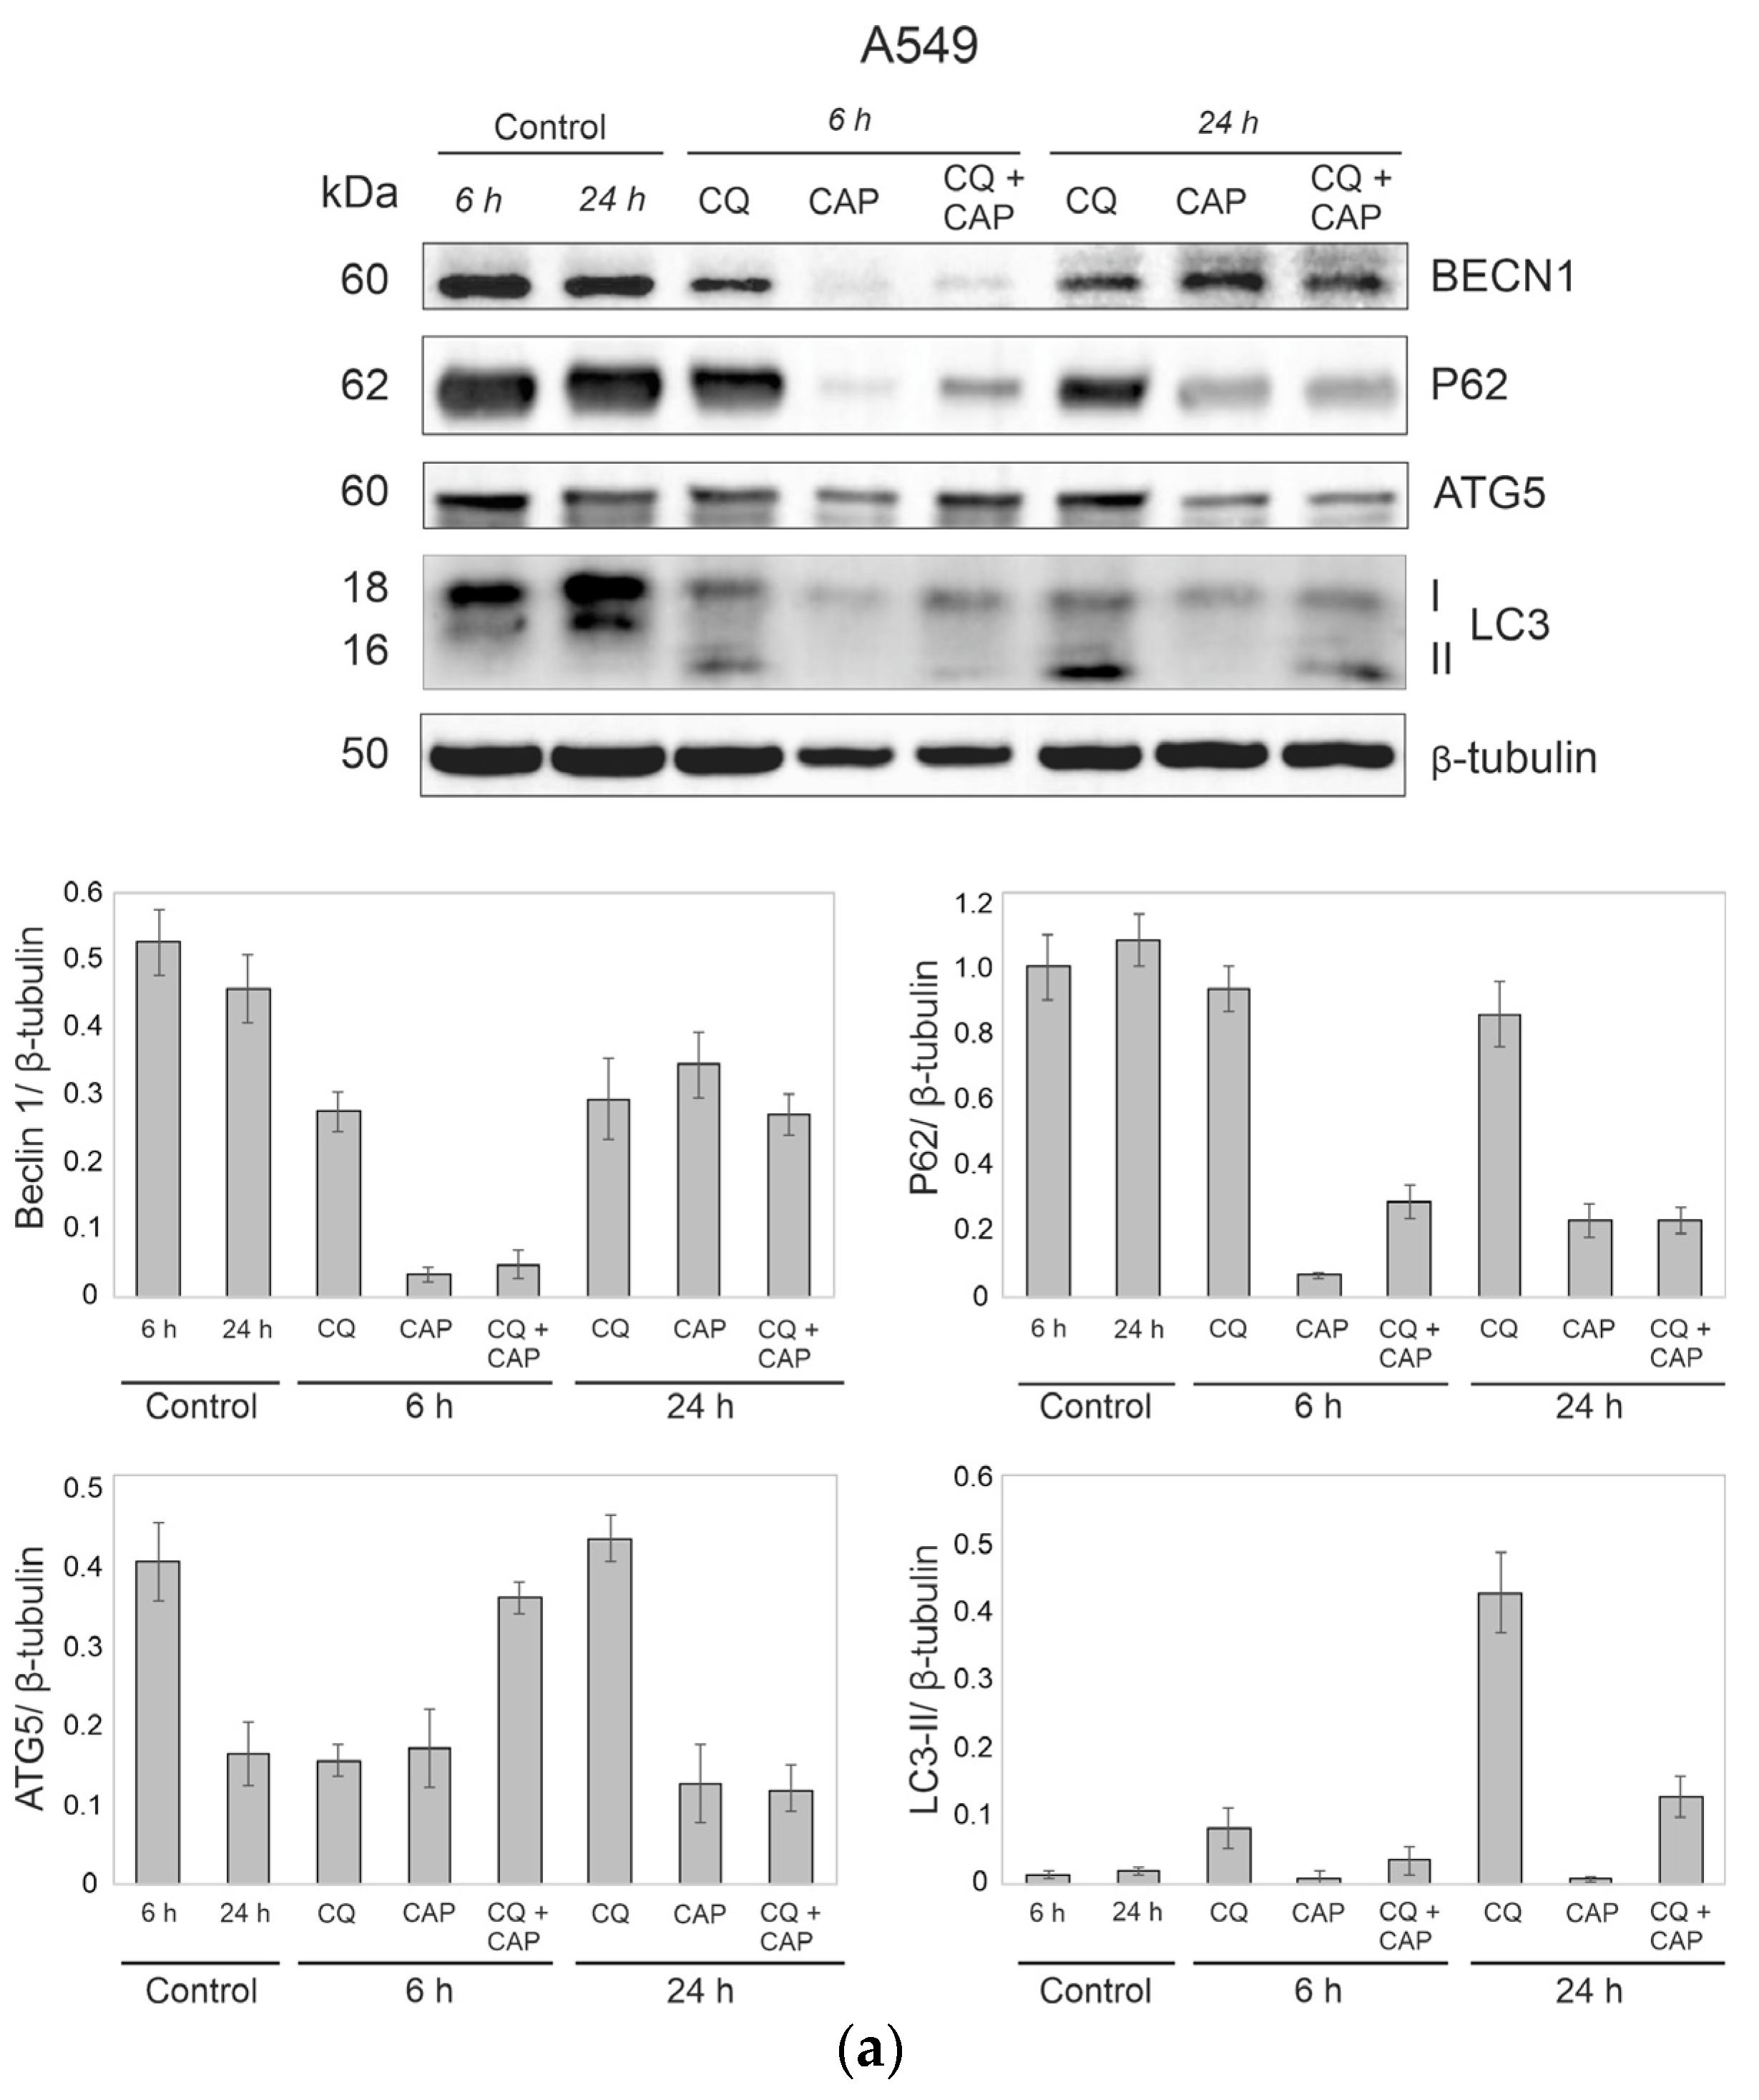
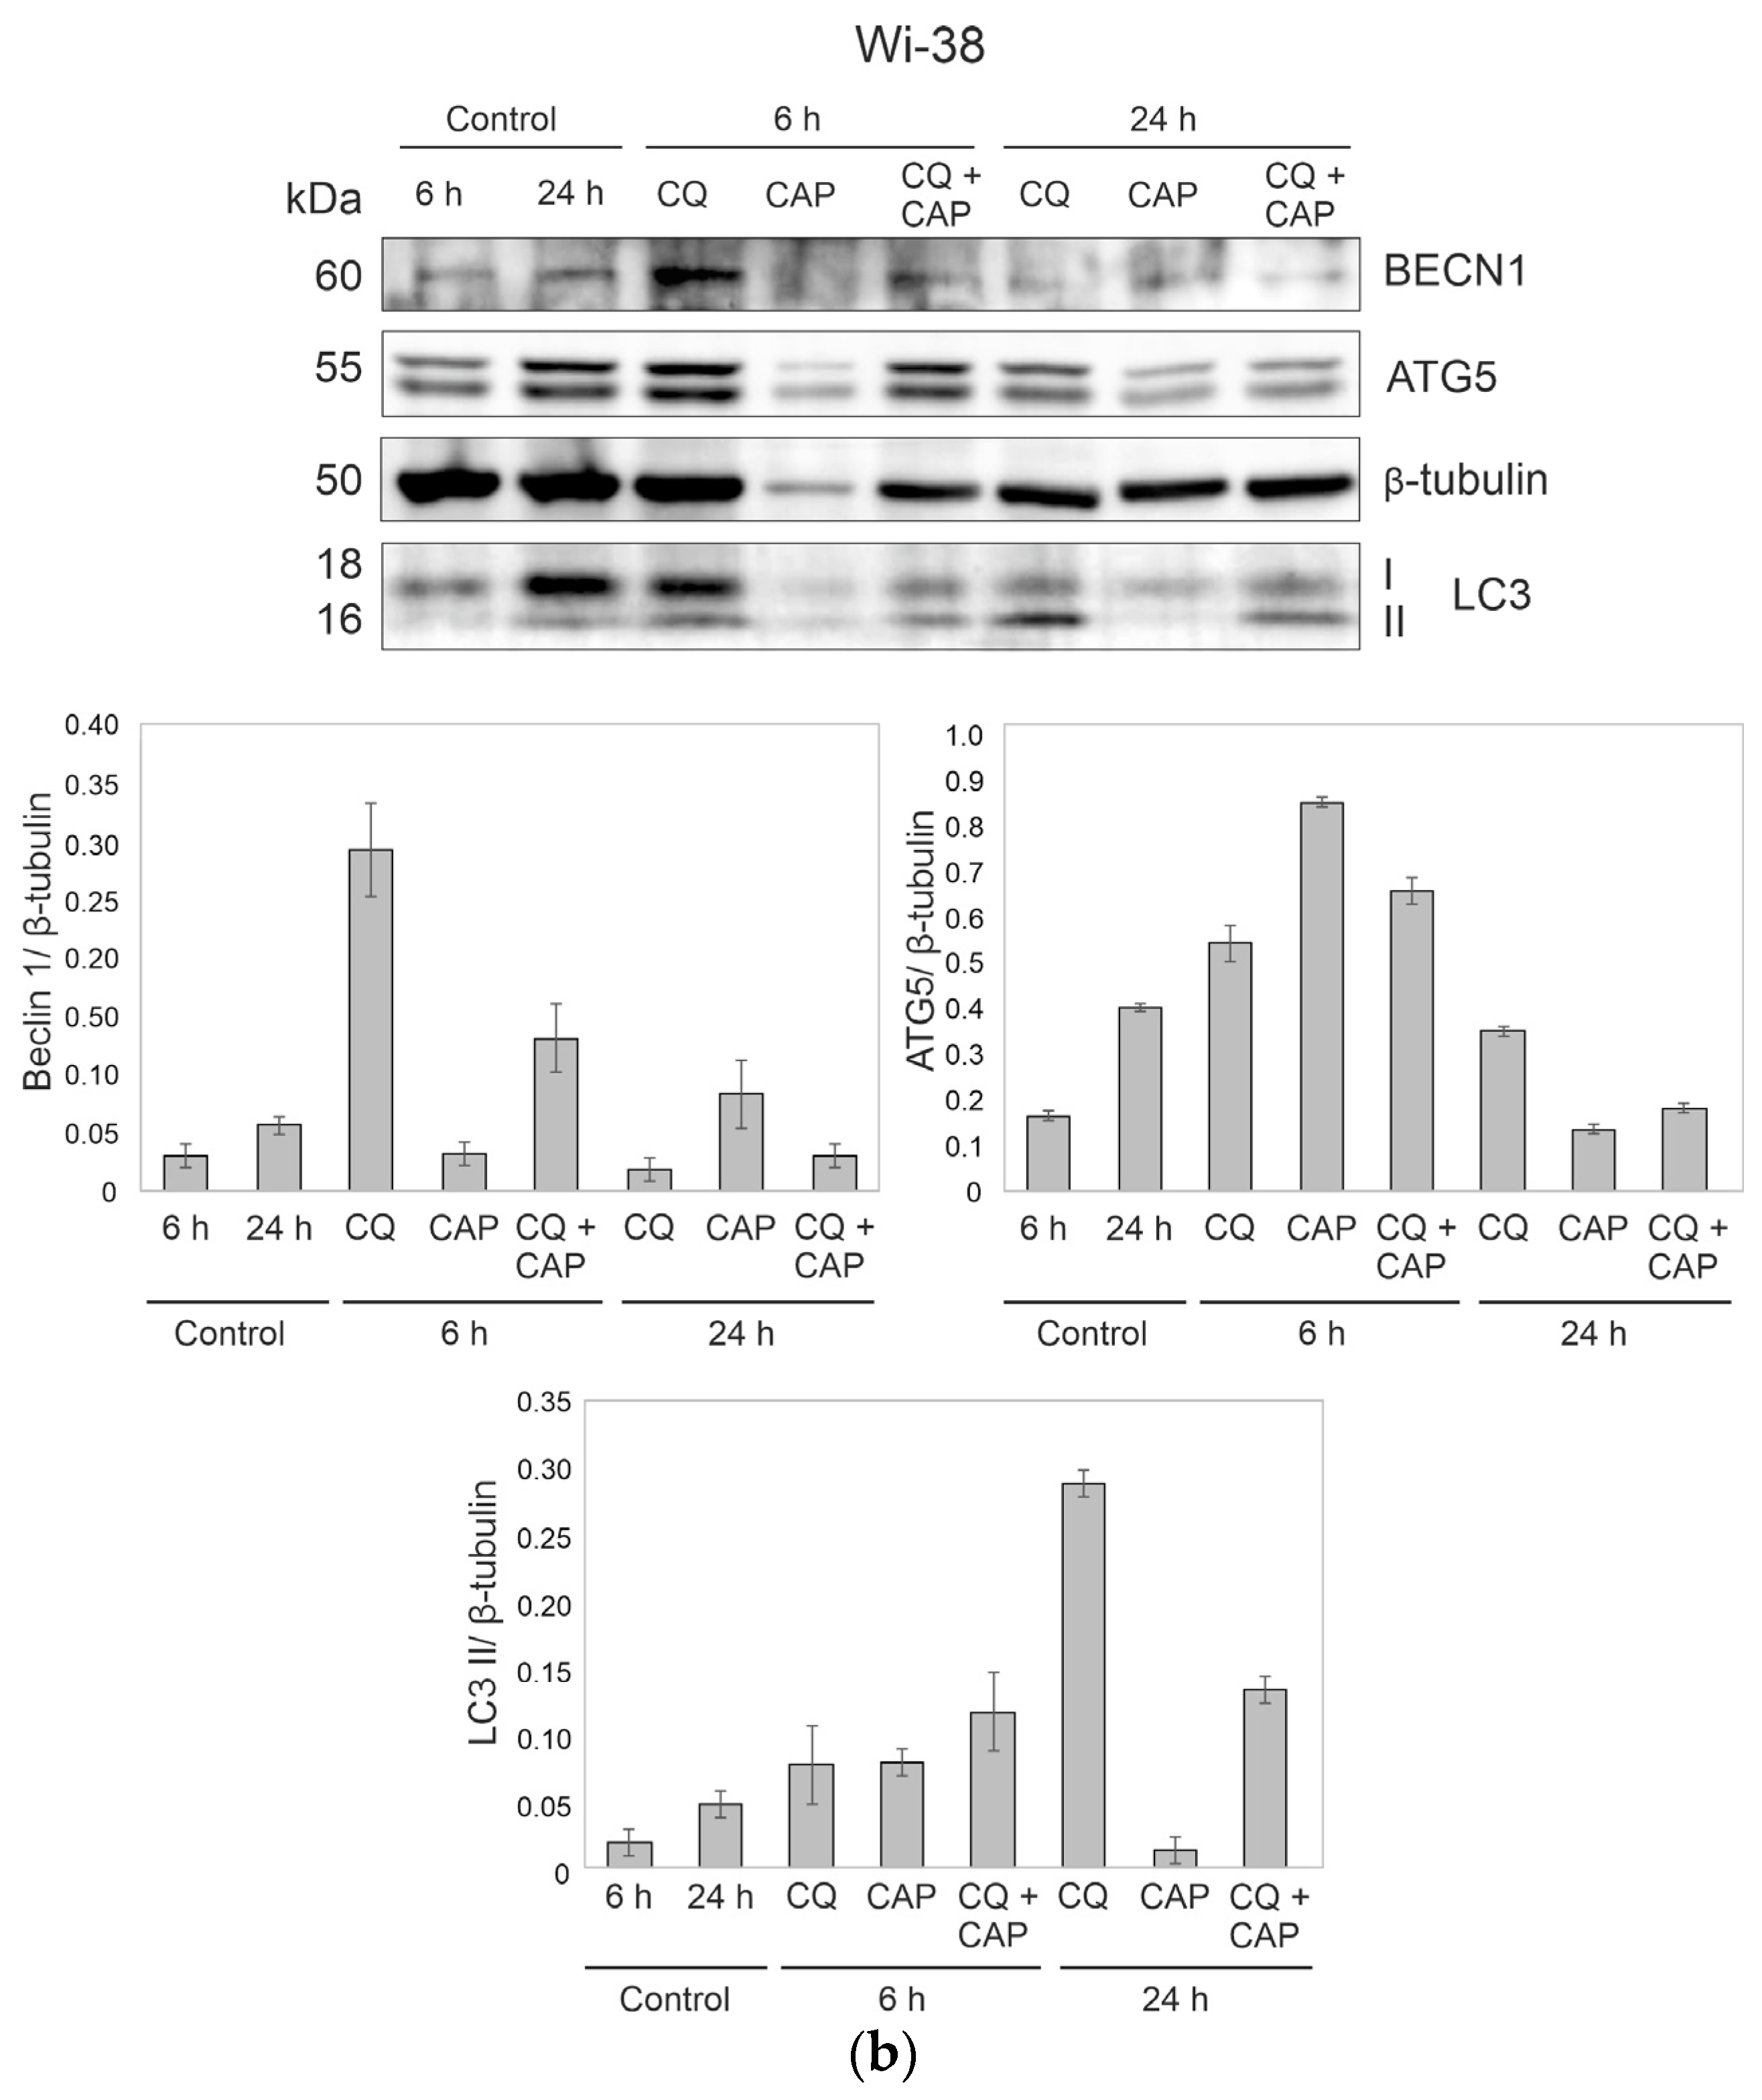
3.8. Autophagy-Related Protein Responses to CAP Treatment
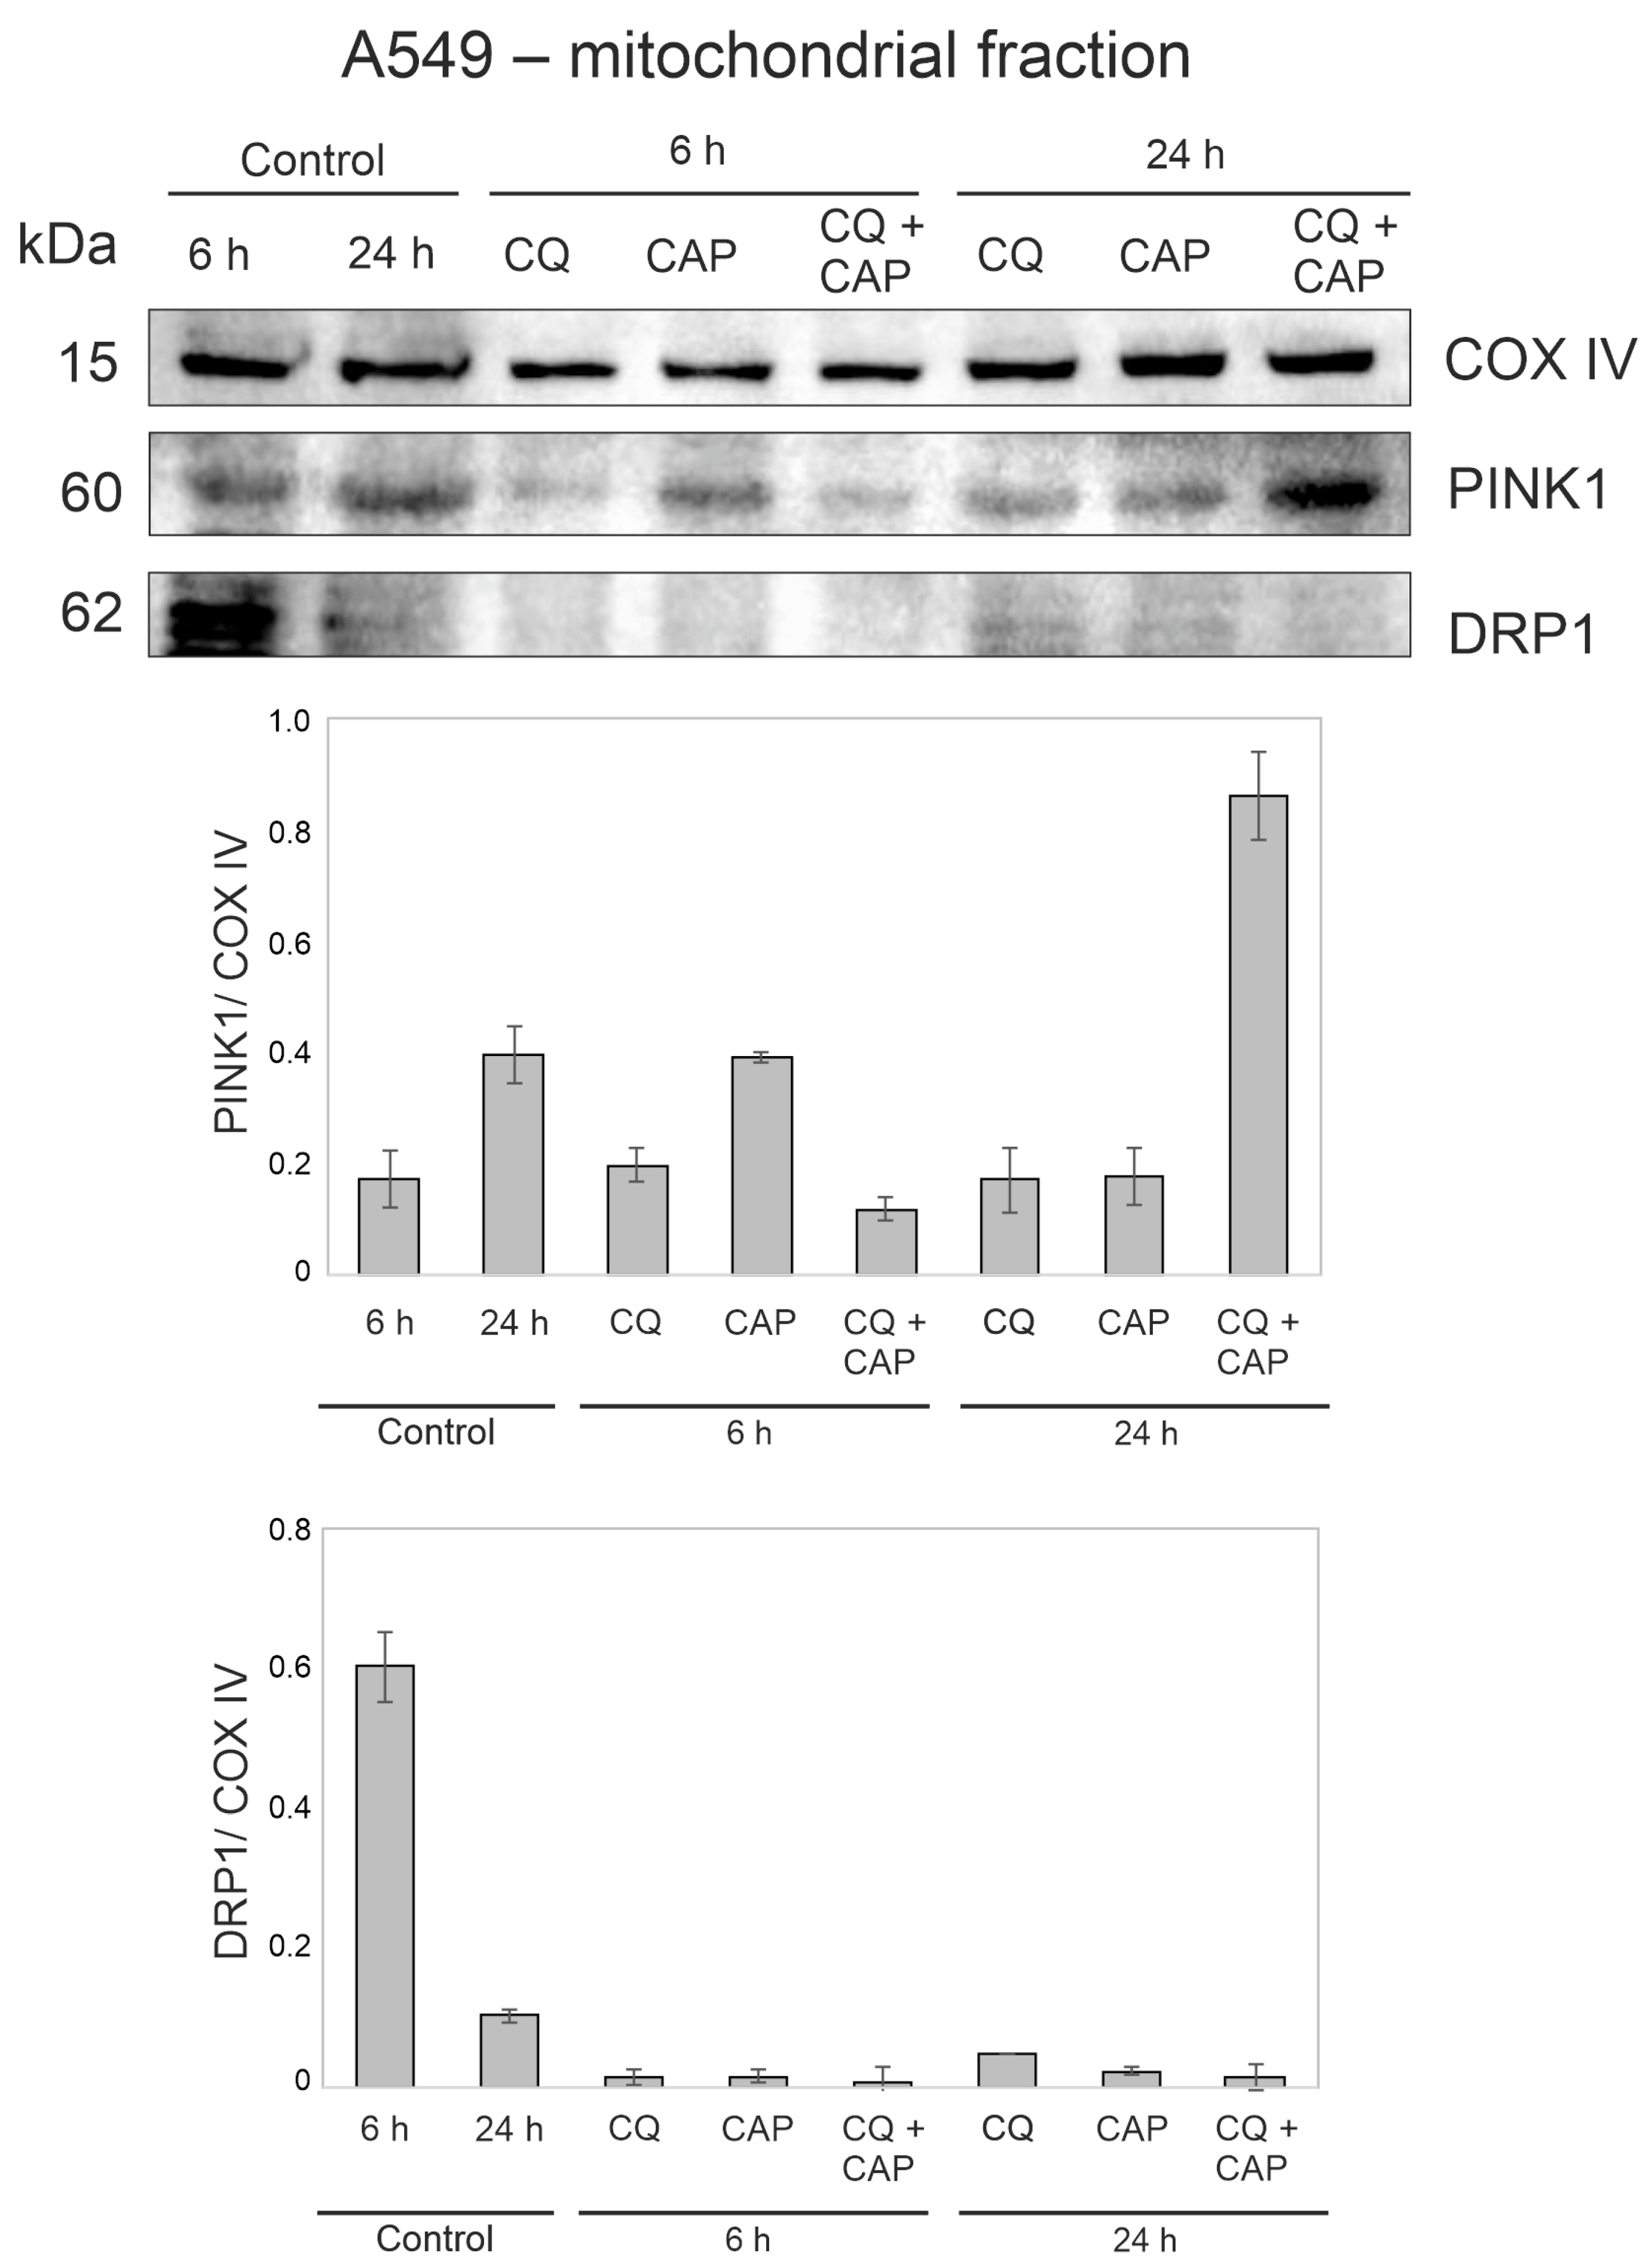
3.9. CAP and CQ Change the Proteins Associated with Mitochondrial Quality Control
4. Discussion
5. Conclusions
Supplementary Materials
Author Contributions
Funding
Institutional Review Board Statement
Informed Consent Statement
Data Availability Statement
Conflicts of Interest
References
- Keidar, M. Plasma for Cancer Treatment. Plasma Sources Sci. Technol. 2015, 24, 033001. [Google Scholar] [CrossRef]
- Metelmann, H.-R.; Nedrelow, D.S.; Seebauer, C.; Schuster, M.; von Woedtke, T.; Weltmann, K.-D.; Kindler, S.; Metelmann, P.H.; Finkelstein, S.E.; Von Hoff, D.D.; et al. Head and Neck Cancer Treatment and Physical Plasma. Clin. Plasma Med. 2015, 3, 17–23. [Google Scholar] [CrossRef]
- Kalghatgi, S.; Kelly, C.M.; Cerchar, E.; Torabi, B.; Alekseev, O.; Fridman, A.; Friedman, G.; Azizkhan-Clifford, J. Effects of Non-Thermal Plasma on Mammalian Cells. PLoS ONE 2011, 6, e16270. [Google Scholar] [CrossRef] [PubMed] [Green Version]
- Ja Kim, S.; Min Joh, H.; Chung, T.H. Production of Intracellular Reactive Oxygen Species and Change of Cell Viability Induced by Atmospheric Pressure Plasma in Normal and Cancer Cells. Appl. Phys. Lett. 2013, 103, 153705. [Google Scholar] [CrossRef]
- Kim, S.J.; Chung, T.H.; Bae, S.H.; Leem, S.H. Induction of Apoptosis in Human Breast Cancer Cells by a Pulsed Atmospheric Pressure Plasma Jet. Appl. Phys. Lett. 2010, 97, 023702. [Google Scholar] [CrossRef]
- Lin, L.; Keidar, M. A Map of Control for Cold Atmospheric Plasma Jets: From Physical Mechanisms to Optimizations. Appl. Phys. Rev. 2021, 8, 011306. [Google Scholar] [CrossRef]
- Schweigert, I.; Zakrevsky, D.; Milakhina, E.; Gugin, P.; Biryukov, M.; Patrakova, E.; Koval, O. A Grounded Electrode beneath Dielectric Targets, Including Cancer Cells, Enhances the Impact of Cold Atmospheric Plasma Jet. Plasma Phys. Control. Fusion 2022, 64, 044015. [Google Scholar] [CrossRef]
- Schweigert, I.; Zakrevsky, D.; Gugin, P.; Yelak, E.; Golubitskaya, E.; Troitskaya, O.; Koval, O. Interaction of Cold Atmospheric Argon and Helium Plasma Jets with Bio-Target with Grounded Substrate Beneath. Appl. Sci. 2019, 9, 4528. [Google Scholar] [CrossRef] [Green Version]
- Golubitskaya, E.A.; Troitskaya, O.S.; Yelak, E.V.; Gugin, P.P.; Richter, V.A.; Schweigert, I.V.; Zakrevsky, D.E.; Koval, O.A. Cold Physical Plasma Decreases the Viability of Lung Adenocarcinoma Cells. Acta Nat. 2019, 11, 16–19. [Google Scholar] [CrossRef] [Green Version]
- Schweigert, I.V.; Zakrevsky, D.E.; Gugin, P.P.; Milakhina, E.V.; Biryukov, M.M.; Keidar, M.; Koval, O.A. Effect of Voltage Pulse Duration on Electrophysical and Thermal Characteristics of Cold Atmospheric Plasma Jet. Plasma Sources Sci. Technol. 2022, 31, 114004. [Google Scholar] [CrossRef]
- Motaln, H.; Recek, N.; Rogelj, B. Intracellular Responses Triggered by Cold Atmospheric Plasma and Plasma-Activated Media in Cancer Cells. Molecules 2021, 26, 1336. [Google Scholar] [CrossRef] [PubMed]
- Yilmazer, A. Cancer Cell Lines Involving Cancer Stem Cell Populations Respond to Oxidative Stress. Biotechnol. Rep. 2018, 17, 24–30. [Google Scholar] [CrossRef] [PubMed]
- Canal, C.; Fontelo, R.; Hamouda, I.; Guillem-Marti, J.; Cvelbar, U.; Ginebra, M.-P. Plasma-Induced Selectivity in Bone Cancer Cells Death. Free. Radic. Biol. Med. 2017, 110, 72–80. [Google Scholar] [CrossRef] [PubMed] [Green Version]
- Jo, A.; Bae, J.H.; Yoon, Y.J.; Chung, T.H.; Lee, E.-W.; Kim, Y.-H.; Joh, H.M.; Chung, J.W. Plasma-Activated Medium Induces Ferroptosis by Depleting FSP1 in Human Lung Cancer Cells. Cell Death Dis. 2022, 13, 212. [Google Scholar] [CrossRef]
- Yan, D.; Malyavko, A.; Wang, Q.; Ostrikov, K. (Ken); Sherman, J.H.; Keidar, M. Multi-Modal Biological Destruction by Cold Atmospheric Plasma: Capability and Mechanism. Biomedicines 2021, 9, 1259. [Google Scholar] [CrossRef]
- Scherz-Shouval, R.; Shvets, E.; Fass, E.; Shorer, H.; Gil, L.; Elazar, Z. Reactive Oxygen Species Are Essential for Autophagy and Specifically Regulate the Activity of Atg4. EMBO J. 2007, 26, 1749–1760. [Google Scholar] [CrossRef] [Green Version]
- Levy, J.M.M.; Towers, C.G.; Thorburn, A. Targeting Autophagy in Cancer. Nat. Rev. Cancer 2017, 17, 528–542. [Google Scholar] [CrossRef]
- Denton, D.; Xu, T.; Kumar, S. Autophagy as a Pro-death Pathway. Immunol. Cell Biol. 2015, 93, 35–42. [Google Scholar] [CrossRef]
- Conway, G.E.; He, Z.; Hutanu, A.L.; Cribaro, G.P.; Manaloto, E.; Casey, A.; Traynor, D.; Milosavljevic, V.; Howe, O.; Barcia, C.; et al. Cold Atmospheric Plasma Induces Accumulation of Lysosomes and Caspase-Independent Cell Death in U373MG Glioblastoma Multiforme Cells. Sci. Rep. 2019, 9, 12891. [Google Scholar] [CrossRef] [Green Version]
- Yoshikawa, N.; Liu, W.; Nakamura, K.; Yoshida, K.; Ikeda, Y.; Tanaka, H.; Mizuno, M.; Toyokuni, S.; Hori, M.; Kikkawa, F.; et al. Plasma-Activated Medium Promotes Autophagic Cell Death along with Alteration of the MTOR Pathway. Sci. Rep. 2020, 10, 1614. [Google Scholar] [CrossRef]
- Solomon, V.R.; Lee, H. Chloroquine and Its Analogs: A New Promise of an Old Drug for Effective and Safe Cancer Therapies. Eur. J. Pharmacol. 2009, 625, 220–233. [Google Scholar] [CrossRef] [PubMed]
- Mauthe, M.; Orhon, I.; Rocchi, C.; Zhou, X.; Luhr, M.; Hijlkema, K.-J.; Coppes, R.P.; Engedal, N.; Mari, M.; Reggiori, F. Chloroquine Inhibits Autophagic Flux by Decreasing Autophagosome-Lysosome Fusion. Autophagy 2018, 14, 1435–1455. [Google Scholar] [CrossRef] [PubMed] [Green Version]
- Maycotte, P.; Aryal, S.; Cummings, C.T.; Thorburn, J.; Morgan, M.J.; Thorburn, A. Chloroquine Sensitizes Breast Cancer Cells to Chemotherapy Independent of Autophagy. Autophagy 2012, 8, 200–212. [Google Scholar] [CrossRef] [PubMed] [Green Version]
- Bagamanshina, A.V.; Troitskaya, O.S.; Nushtaeva, A.A.; Yunusova, A.Y.; Starykovych, M.O.; Kuligina, E.V.; Kit, Y.Y.; Richter, M.; Wohlfromm, F.; Kähne, T.; et al. Cytotoxic and Antitumor Activity of Lactaptin in Combination with Autophagy Inducers and Inhibitors. BioMed Res. Int. 2019, 2019, 4087160. [Google Scholar] [CrossRef] [PubMed] [Green Version]
- Koval, O.; Kochneva, G.; Tkachenko, A.; Troitskaya, O.; Sivolobova, G.; Grazhdantseva, A.; Nushtaeva, A.; Kuligina, E.; Richter, V. Recombinant Vaccinia Viruses Coding Transgenes of Apoptosis-Inducing Proteins Enhance Apoptosis But Not Immunogenicity of Infected Tumor Cells. BioMed Res. Int. 2017, 2017, 3620510. [Google Scholar] [CrossRef] [Green Version]
- Schweigert, I.V.; Alexandrov, A.L.; Zakrevsky, D.E. Self-Organization of Touching-Target Current with Ac Voltage in Atmospheric Pressure Plasma Jet for Medical Application Parameters. Plasma Sources Sci. Technol. 2020, 29, 12LT02. [Google Scholar] [CrossRef]
- Chou, T.-C. Drug Combination Studies and Their Synergy Quantification Using the Chou-Talalay Method. Cancer Res. 2010, 70, 440–446. [Google Scholar] [CrossRef] [Green Version]
- Bolger, A.M.; Lohse, M.; Usadel, B. Trimmomatic: A Flexible Trimmer for Illumina Sequence Data. Bioinformatics 2014, 30, 2114–2120. [Google Scholar] [CrossRef] [Green Version]
- Jurka, J.; Kapitonov, V.V.; Pavlicek, A.; Klonowski, P.; Kohany, O.; Walichiewicz, J. Repbase Update, a Database of Eukaryotic Repetitive Elements. Cytogenet. Genome Res. 2005, 110, 462–467. [Google Scholar] [CrossRef]
- Dobin, A.; Davis, C.A.; Schlesinger, F.; Drenkow, J.; Zaleski, C.; Jha, S.; Batut, P.; Chaisson, M.; Gingeras, T.R. STAR: Ultrafast Universal RNA-Seq Aligner. Bioinformatics 2013, 29, 15–21. [Google Scholar] [CrossRef]
- Hartley, S.W.; Mullikin, J.C. QoRTs: A Comprehensive Toolset for Quality Control and Data Processing of RNA-Seq Experiments. BMC Bioinform. 2015, 16, 224. [Google Scholar] [CrossRef] [PubMed] [Green Version]
- Love, M.I.; Huber, W.; Anders, S. Moderated Estimation of Fold Change and Dispersion for RNA-Seq Data with DESeq2. Genome Biol. 2014, 15, 550. [Google Scholar] [CrossRef] [PubMed] [Green Version]
- Richter, M.; Wohlfromm, F.; Kähne, T.; Bongartz, H.; Seyrek, K.; Kit, Y.; Chinak, O.; Richter, V.A.; Koval, O.A.; Lavrik, I.N. The Recombinant Fragment of Human κ-Casein Induces Cell Death by Targeting the Proteins of Mitochondrial Import in Breast Cancer Cells. Cancers 2020, 12, 1427. [Google Scholar] [CrossRef]
- Mitra, S.; Nguyen, L.N.; Akter, M.; Park, G.; Choi, E.H.; Kaushik, N.K. Impact of ROS Generated by Chemical, Physical, and Plasma Techniques on Cancer Attenuation. Cancers 2019, 11, 1030. [Google Scholar] [CrossRef] [PubMed] [Green Version]
- Mateu-Sanz, M.; Tornín, J.; Ginebra, M.-P.; Canal, C. Cold Atmospheric Plasma: A New Strategy Based Primarily on Oxidative Stress for Osteosarcoma Therapy. JCM 2021, 10, 893. [Google Scholar] [CrossRef]
- Nitsch, A.; Strakeljahn, S.; Jacoby, J.M.; Sieb, K.F.; Mustea, A.; Bekeschus, S.; Ekkernkamp, A.; Stope, M.B.; Haralambiev, L. New Approach against Chondrosoma Cells—Cold Plasma Treatment Inhibits Cell Motility and Metabolism, and Leads to Apoptosis. Biomedicines 2022, 10, 688. [Google Scholar] [CrossRef] [PubMed]
- Denton, D.; Kumar, S. Autophagy-Dependent Cell Death. Cell Death Differ. 2019, 26, 605–616. [Google Scholar] [CrossRef] [Green Version]
- Trivedi, P.C.; Bartlett, J.J.; Pulinilkunnil, T. Lysosomal Biology and Function: Modern View of Cellular Debris Bin. Cells 2020, 9, 1131. [Google Scholar] [CrossRef]
- Kaminskyy, V.; Zhivotovsky, B. Proteases in Autophagy. Biochim. Biophys. Acta (BBA)—Proteins Proteom. 2012, 1824, 44–50. [Google Scholar] [CrossRef]
- Masson, O.; Bach, A.-S.; Derocq, D.; Prébois, C.; Laurent-Matha, V.; Pattingre, S.; Liaudet-Coopman, E. Pathophysiological Functions of Cathepsin D: Targeting Its Catalytic Activity versus Its Protein Binding Activity? Biochimie 2010, 92, 1635–1643. [Google Scholar] [CrossRef]
- Redmann, M.; Benavides, G.A.; Berryhill, T.F.; Wani, W.Y.; Ouyang, X.; Johnson, M.S.; Ravi, S.; Barnes, S.; Darley-Usmar, V.M.; Zhang, J. Inhibition of Autophagy with Bafilomycin and Chloroquine Decreases Mitochondrial Quality and Bioenergetic Function in Primary Neurons. Redox Biol. 2017, 11, 73–81. [Google Scholar] [CrossRef] [PubMed] [Green Version]
- Matsuda, S.; Kitagishi, Y.; Kobayashi, M. Function and Characteristics of PINK1 in Mitochondria. Oxidative Med. Cell. Longev. 2013, 2013, 601587. [Google Scholar] [CrossRef] [PubMed] [Green Version]
- Xie, L.; Shi, F.; Li, Y.; Li, W.; Yu, X.; Zhao, L.; Zhou, M.; Hu, J.; Luo, X.; Tang, M.; et al. Drp1-Dependent Remodeling of Mitochondrial Morphology Triggered by EBV-LMP1 Increases Cisplatin Resistance. Signal Transduct. Target. Ther. 2020, 5, 56. [Google Scholar] [CrossRef] [PubMed]
- Guerrero-Preston, R.; Ogawa, T.; Uemura, M.; Shumulinsky, G.; Valle, B.L.; Pirini, F.; Ravi, R.; Sidransky, D.; Keidar, M.; Trink, B. Cold Atmospheric Plasma Treatment Selectively Targets Head and Neck Squamous Cell Carcinoma Cells. Int. J. Mol. Med. 2014, 34, 941–946. [Google Scholar] [CrossRef] [PubMed] [Green Version]
- Chen, Z.; Lin, L.; Gjika, E.; Cheng, X.; Canady, J.; Keidar, M. Selective Treatment of Pancreatic Cancer Cells by Plasma-Activated Saline Solutions. IEEE Trans. Radiat. Plasma Med. Sci. 2018, 2, 116–120. [Google Scholar] [CrossRef]
- Bauer, G.; Graves, D.B. Mechanisms of Selective Antitumor Action of Cold Atmospheric Plasma-Derived Reactive Oxygen and Nitrogen Species: Mechanisms of Selective Antitumor Action…. Plasma Process. Polym. 2016, 13, 1157–1178. [Google Scholar] [CrossRef]
- Kaushik, N.; Lee, S.J.; Choi, T.G.; Baik, K.Y.; Uhm, H.S.; Kim, C.H.; Kaushik, N.K.; Choi, E.H. Non-Thermal Plasma with 2-Deoxy-D-Glucose Synergistically Induces Cell Death by Targeting Glycolysis in Blood Cancer Cells. Sci. Rep. 2015, 5, 8726. [Google Scholar] [CrossRef] [Green Version]
- Yan, D.; Talbot, A.; Nourmohammadi, N.; Sherman, J.H.; Cheng, X.; Keidar, M. Toward Understanding the Selective Anticancer Capacity of Cold Atmospheric Plasma—A Model Based on Aquaporins (Review). Biointerphases 2015, 10, 040801. [Google Scholar] [CrossRef]
- Bauer, G.; Sersenová, D.; Graves, D.B.; Machala, Z. Cold Atmospheric Plasma and Plasma-Activated Medium Trigger RONS-Based Tumor Cell Apoptosis. Sci. Rep. 2019, 9, 14210. [Google Scholar] [CrossRef] [Green Version]
- Sklias, K.; Santos Sousa, J.; Girard, P.-M. Role of Short- and Long-Lived Reactive Species on the Selectivity and Anti-Cancer Action of Plasma Treatment In Vitro. Cancers 2021, 13, 615. [Google Scholar] [CrossRef]
- Troitskaya, O.; Golubitskaya, E.; Biryukov, M.; Varlamov, M.; Gugin, P.; Milakhina, E.; Richter, V.; Schweigert, I.; Zakrevsky, D.; Koval, O. Non-Thermal Plasma Application in Tumor-Bearing Mice Induces Increase of Serum HMGB1. Int. J. Mol. Sci. 2020, 21, 5128. [Google Scholar] [CrossRef] [PubMed]
- Troitskaya, O.; Novak, D.; Varlamov, M.; Biryukov, M.; Nushtaeva, A.; Kochneva, G.; Zakrevsky, D.; Schweigert, I.; Richter, V.; Koval, O. Immunological Effects of Cold Atmospheric Plasma-Treated Cells in Comparison with Those of Cells Treated with Lactaptin-Based Anticancer Drugs. Biophysica 2022, 2, 266–280. [Google Scholar] [CrossRef]
- Siu, A.; Volotskova, O.; Cheng, X.; Khalsa, S.S.; Bian, K.; Murad, F.; Keidar, M.; Sherman, J.H. Differential Effects of Cold Atmospheric Plasma in the Treatment of Malignant Glioma. PLoS ONE 2015, 10, e0126313. [Google Scholar] [CrossRef] [PubMed]
- Biade, S.; Stobbe, C.C.; Chapman, J.D. The Intrinsic Radiosensitivity of Some Human Tumor Cells throughout Their Cell Cycles. Radiat. Res. 1997, 147, 416–421. [Google Scholar] [CrossRef] [PubMed]
- Adjemian, S.; Oltean, T.; Martens, S.; Wiernicki, B.; Goossens, V.; Vanden Berghe, T.; Cappe, B.; Ladik, M.; Riquet, F.B.; Heyndrickx, L.; et al. Ionizing Radiation Results in a Mixture of Cellular Outcomes Including Mitotic Catastrophe, Senescence, Methuosis, and Iron-Dependent Cell Death. Cell Death Dis. 2020, 11, 1003. [Google Scholar] [CrossRef]
- Shi, L.; Ito, F.; Wang, Y.; Okazaki, Y.; Tanaka, H.; Mizuno, M.; Hori, M.; Hirayama, T.; Nagasawa, H.; Richardson, D.R.; et al. Non-Thermal Plasma Induces a Stress Response in Mesothelioma Cells Resulting in Increased Endocytosis, Lysosome Biogenesis and Autophagy. Free Radic. Biol. Med. 2017, 108, 904–917. [Google Scholar] [CrossRef]
- Duchesne, C.; Frescaline, N.; Blaise, O.; Lataillade, J.-J.; Banzet, S.; Dussurget, O.; Rousseau, A. Cold Atmospheric Plasma Promotes Killing of Staphylococcus Aureus by Macrophages. mSphere 2021, 6, e00217-21. [Google Scholar] [CrossRef]
- Towers, C.G.; Wodetzki, D.; Thorburn, A. Autophagy and Cancer: Modulation of Cell Death Pathways and Cancer Cell Adaptations. J. Cell Biol. 2020, 219, e201909033. [Google Scholar] [CrossRef]
- Schwake, M.; Schröder, B.; Saftig, P. Lysosomal Membrane Proteins and Their Central Role in Physiology: Lysosomal Membrane Proteins. Traffic 2013, 14, 739–748. [Google Scholar] [CrossRef]
- Varisli, L.; Cen, O.; Vlahopoulos, S. Dissecting Pharmacological Effects of Chloroquine in Cancer Treatment: Interference with Inflammatory Signaling Pathways. Immunology 2020, 159, 257–278. [Google Scholar] [CrossRef]
- Bik, E.; Mateuszuk, L.; Orleanska, J.; Baranska, M.; Chlopicki, S.; Majzner, K. Chloroquine-Induced Accumulation of Autophagosomes and Lipids in the Endothelium. Int. J. Mol. Sci. 2021, 22, 2401. [Google Scholar] [CrossRef] [PubMed]
- Wang, Y.; Peng, R.-Q.; Li, D.-D.; Ding, Y.; Wu, X.-Q.; Zeng, Y.-X.; Zhu, X.-F.; Zhang, X.-S. Chloroquine Enhances the Cytotoxicity of Topotecan by Inhibiting Autophagy in Lung Cancer Cells. Chin. J. Cancer 2011, 30, 690–700. [Google Scholar] [CrossRef] [PubMed]
- Pascolo, S. Time to Use a Dose of Chloroquine as an Adjuvant to Anti-Cancer Chemotherapies. Eur. J. Pharmacol. 2016, 771, 139–144. [Google Scholar] [CrossRef]
- Klionsky, D.J.; Abdel-Aziz, A.K.; Abdelfatah, S.; Abdellatif, M.; Abdoli, A.; Abel, S.; Abeliovich, H.; Abildgaard, M.H.; Abudu, Y.P.; Acevedo-Arozena, A.; et al. Guidelines for the Use and Interpretation of Assays for Monitoring Autophagy (4th Edition)1. Autophagy 2021, 17, 1–382. [Google Scholar] [CrossRef] [PubMed]


Disclaimer/Publisher’s Note: The statements, opinions and data contained in all publications are solely those of the individual author(s) and contributor(s) and not of MDPI and/or the editor(s). MDPI and/or the editor(s) disclaim responsibility for any injury to people or property resulting from any ideas, methods, instructions or products referred to in the content. |
© 2023 by the authors. Licensee MDPI, Basel, Switzerland. This article is an open access article distributed under the terms and conditions of the Creative Commons Attribution (CC BY) license (https://creativecommons.org/licenses/by/4.0/).
Share and Cite
Patrakova, E.; Biryukov, M.; Troitskaya, O.; Gugin, P.; Milakhina, E.; Semenov, D.; Poletaeva, J.; Ryabchikova, E.; Novak, D.; Kryachkova, N.; et al. Chloroquine Enhances Death in Lung Adenocarcinoma A549 Cells Exposed to Cold Atmospheric Plasma Jet. Cells 2023, 12, 290. https://doi.org/10.3390/cells12020290
Patrakova E, Biryukov M, Troitskaya O, Gugin P, Milakhina E, Semenov D, Poletaeva J, Ryabchikova E, Novak D, Kryachkova N, et al. Chloroquine Enhances Death in Lung Adenocarcinoma A549 Cells Exposed to Cold Atmospheric Plasma Jet. Cells. 2023; 12(2):290. https://doi.org/10.3390/cells12020290
Chicago/Turabian StylePatrakova, Ekaterina, Mikhail Biryukov, Olga Troitskaya, Pavel Gugin, Elena Milakhina, Dmitriy Semenov, Julia Poletaeva, Elena Ryabchikova, Diana Novak, Nadezhda Kryachkova, and et al. 2023. "Chloroquine Enhances Death in Lung Adenocarcinoma A549 Cells Exposed to Cold Atmospheric Plasma Jet" Cells 12, no. 2: 290. https://doi.org/10.3390/cells12020290