
Adverse Childhood Experiences Predict the Phenome of Affective Disorders and These Effects Are Mediated by Staging, Neuroimmunotoxic and Growth Factor Profiles

 , , ,
, , ,  and
and
Abstract
:1. Introduction
2. Methods and Participants
2.1. Participants
2.2. Clinical Measurements
2.3. Assays
2.4. Statistical Analysis
3. Results
3.1. Sociodemographic Data of Patients Divided According to ACE Scores and Controls
3.2. Factor Structure of the 10 ACE Items
3.3. Differences in Immune Profiles between Patients with Low/High ACE-DEP Scores and Controls
3.4. Associations between ACEs and ROI, SBs, and the Phenome
3.5. Best Prediction of the Phenome
3.6. Associations between ACEs and Immune Profiles
3.7. Construction of Pathway Phenotypes and Results of PLS Analysis
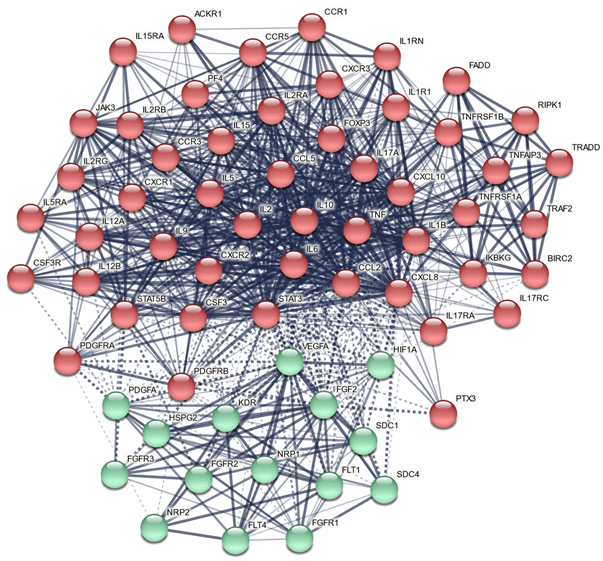
3.8. Results of Network, Annotation, and Enrichment Analysis
3.8.1. All ACE DEPs
3.8.2. DEPs of the Growth Factor Cluster
4. Discussion
4.1. Activated Immune Profiles Due to ACEs
4.2. ACEs, ROI-IMMUNE Pathway Phenotype and the Phenome
4.3. Network, Enrichment, and Annotation Analysis
5. Limitations
6. Conclusions
Supplementary Materials
Author Contributions
Funding
Institutional Review Board Statements
Informed Consent Statement
Data Availability Statement
Conflicts of Interest
References
- Maes, M.; Moraes, J.B.; Congio, A.; Bonifacio, K.L.; Barbosa, D.S.; Vargas, H.O.; Michelin, A.P.; Carvalho, A.F.; Nunes, S.O.V. Development of a Novel Staging Model for Affective Disorders Using Partial Least Squares Bootstrapping: Effects of Lipid-Associated Antioxidant Defenses and Neuro-Oxidative Stress. Mol. Neurobiol. 2019, 56, 6626–6644. [Google Scholar] [CrossRef] [PubMed]
- Maes, M.; Moraes, J.B.; Bonifacio, K.L.; Barbosa, D.S.; Vargas, H.O.; Michelin, A.P.; Nunes, S.O.V. Towards a new model and classification of mood disorders based on risk resilience, neuro-affective toxicity, staging, and phenome features using the nomothetic network psychiatry approach. Metab. Brain Dis. 2021, 36, 509–521. [Google Scholar] [CrossRef] [PubMed]
- Maes, M. Precision Nomothetic Medicine in Depression Research: A New Depression Model, and New Endophenotype Classes and Pathway Phenotypes, and A Digital Self. J. Pers. Med. 2022, 12, 403. [Google Scholar] [CrossRef]
- Agnew-Blais, J.; Danese, A. Childhood maltreatment and unfavourable clinical outcomes in bipolar disorder: A systematic review and meta-analysis. Lancet Psychiatry 2016, 3, 342–349. [Google Scholar] [CrossRef]
- Jansen, K.; Cardoso, T.A.; Fries, G.R.; Branco, J.C.; Silva, R.A.; Kauer-Sant’Anna, M.; Kapczinski, F.; Magalhaes, P.V. Childhood trauma, family history, and their association with mood disorders in early adulthood. Acta Psychiatr. Scand. 2016, 134, 281–286. [Google Scholar] [CrossRef] [PubMed]
- Larsson, S.; Andreassen, O.A.; Aas, M.; Røssberg, J.I.; Mork, E.; Steen, N.E.; Barrett, E.A.; Lagerberg, T.V.; Peleikis, D.; Agartz, I.; et al. High prevalence of childhood trauma in patients with schizophrenia spectrum and affective disorder. Compr. Psychiatry. 2013, 54, 123–127. [Google Scholar] [CrossRef]
- Hadland, S.E.; Marshall, B.D.; Kerr, T.; Qi, J.; Montaner, J.S.; Wood, E. Suicide and history of childhood trauma among street youth. J. Affect Disord. 2012, 136, 377–380. [Google Scholar] [CrossRef] [PubMed] [Green Version]
- Roy, A.; Janal, M. Family history of suicide, female sex, and childhood trauma: Separate or interacting risk factors for attempts at suicide? Acta. Psychiatr. Scand. 2005, 112, 367–371. [Google Scholar] [CrossRef]
- Krug, E.G.; Dahlberg, L.L.; Mercy, J.; Zwi, A.; Lozano, R. Child abuse and neglect by parents and other caregivers. In World Report on Violence and Health; World Health Organization: Geneva, Switzerland, 28 March 2002; pp. 59–86. Available online: https://apps.who.int/iris/bitstream/handle/10665/42495/9241545615_eng.pdf;jsessionid=785F7033A37D18F473DDA7ABE0DC0F9C?sequence=1 (accessed on 28 March 2022).
- Alvarez, M.J.; Roura, P.; Oses, A.; Foguet, Q.; Sola, J.; Arrufat, F.X. Prevalence and clinical impact of childhood trauma in patients with severe mental disorders. J. Nerv. Ment. Dis. 2011, 199, 156–161. [Google Scholar] [CrossRef]
- Aas, M.; Henry, C.; Bellivier, F.; Lajnef, M.; Gard, S.; Kahn, J.P.; Lagerberg, T.V.; Aminoff, S.R.; Bjella, T.; Leboyer, M.; et al. Affective lability mediates the association between childhood trauma and suicide attempts, mixed episodes and co-morbid anxiety disorders in bipolar disorders. Psychol. Med. 2017, 47, 902–912. [Google Scholar] [CrossRef]
- Moraes, J.B.; Maes, M.; Barbosa, D.S.; Ferrari, T.Z.; Uehara, M.K.S.; Carvalho, A.F.; Nunes, S.O.V. Elevated C-reactive Protein Levels in Women with Bipolar Disorder may be Explained by a History of Childhood Trauma, Especially Sexual Abuse, Body Mass Index and Age. CNS Neurol Disord Drug Targets 2017, 16, 514–521. [Google Scholar] [CrossRef] [PubMed]
- Janiri, D.; Sani, G.; Danese, E.; Simonetti, A.; Ambrosi, E.; Angeletti, G.; Erbuto, D.; Caltagirone, C.; Girardi, P.; Spalletta, G. Childhood traumatic experiences of patients with bipolar disorder type I and type II. J. Affect Disord. 2015, 175, 92–97. [Google Scholar] [CrossRef] [PubMed]
- Schoedl, A.F.; Costa, M.C.; Mari, J.J.; Mello, M.F.; Tyrka, A.R.; Carpenter, L.L.; Price, L.H. The clinical correlates of reported childhood sexual abuse: An association between age at trauma onset and severity of depression and PTSD in adults. J. Child Sex Abus 2010, 19, 156–170. [Google Scholar] [CrossRef] [PubMed]
- Marangoni, C.; Hernandez, M.; Faedda, G.L. The role of environmental exposures as risk factors for bipolar disorder: A systematic review of longitudinal studies. J. Affect Disord. 2016, 193, 165–174. [Google Scholar] [CrossRef]
- Catone, G.; Marwaha, S.; Kuipers, E.; Lennox, B.; Freeman, D.; Bebbington, P.; Broome, M. Bullying victimisation and risk of psychotic phenomena: Analyses of British national survey data. Lancet Psychiatry 2015, 2, 618–624. [Google Scholar] [CrossRef] [Green Version]
- Miao, H.; Zhong, S.; Liu, X.; Lai, S.; He, J.; Zhu, Y.; Song, Z.; Chen, P.; Wang, Y.; Jia, Y. Childhood trauma history is linked to abnormal brain metabolism of non-medicated adult patients with major depressive disorder. J. Affect Disord. 2022, 302, 101–109. [Google Scholar] [CrossRef]
- Whitaker, R.C.; Dearth-Wesley, T.; Herman, A.N.; Block, A.E.; Holderness, M.H.; Waring, N.A.; Oakes, J.M. The interaction of adverse childhood experiences and gender as risk factors for depression and anxiety disorders in US adults: A cross-sectional study. BMC Public Health 2021, 21, 2078. [Google Scholar] [CrossRef]
- Pechtel, P.; Pizzagalli, D.A. Effects of early life stress on cognitive and affective function: An integrated review of human literature. Psychopharmacology 2011, 214, 55–70. [Google Scholar] [CrossRef] [Green Version]
- Kaplan, G.A.; Turrell, G.; Lynch, J.W.; Everson, S.A.; Helkala, E.L.; Salonen, J.T. Childhood socioeconomic position and cognitive function in adulthood. Int. J. Epidemiol. 2001, 30, 256–263. [Google Scholar] [CrossRef] [Green Version]
- Garno, J.L.; Goldberg, J.F.; Ramirez, P.M.; Ritzler, B.A. Impact of childhood abuse on the clinical course of bipolar disorder. Br. J. Psychiatry. 2005, 186, 121–125. [Google Scholar] [CrossRef] [Green Version]
- Ventegodt, S.; Flensborg-Madsen, T.; Andersen, N.J.; Merrick, J. Which factors determine our quality of life, health and ability? Results from a Danish population sample and the Copenhagen perinatal cohort. J. Coll. Physicians Surg Pak. 2008, 18, 445–450. [Google Scholar]
- Erten, E.; Funda Uney, A.; Saatçioğlu, Ö.; Özdemir, A.; Fıstıkçı, N.; Çakmak, D. Effects of childhood trauma and clinical features on determining quality of life in patients with bipolar I disorder. J. Affect Disord. 2014, 162, 107–113. [Google Scholar] [CrossRef] [PubMed]
- Spratt, E.G.; Back, S.E.; Yeatts, S.D.; Simpson, A.N.; McRae-Clark, A.; Moran-Santa Maria, M.M.; Price, K.L.; Hartwell, K.T.; Brady, K.T. Relationship between child abuse and adult smoking. Int. J. Psychiatry Med. 2009, 39, 417–426. [Google Scholar] [CrossRef] [PubMed] [Green Version]
- Maes, M.; Congio, A.; Moraes, J.B.; Bonifacio, K.L.; Barbosa, D.S.; Vargas, H.O.; Morris, G.; Puri, B.K.; Michelin, A.P.; Nunes, S.O.V. Early Life Trauma Predicts Affective Phenomenology and the Effects are Partly Mediated by Staging Coupled with Lowered Lipid-Associated Antioxidant Defences. Biomol. Concepts. 2018, 9, 115–130. [Google Scholar] [CrossRef] [PubMed] [Green Version]
- Etain, B.; Lajnef, M.; Henry, C.; Aubin, V.; Azorin, J.M.; Bellivier, F.; Bougerol, T.; Courtet, P.; Gard, S.; Kahn, J.P.; et al. FACE-BD Clinical Coordinating Center (FondaMental Foundation); FACE-BD Data Coordinating Center (FondaMental Foundation); FACE-BD Clinical Sites and Principal Collaborators in France. Childhood trauma, dimensions of psychopathology and the clinical expression of bipolar disorders: A pathway analysis. J. Psychiatr. Res. 2017, 95, 37–45. [Google Scholar] [PubMed]
- Moraes, J.B.; Maes, M.; Roomruangwong, C.; Bonifacio, K.L.; Barbosa, D.S.; Vargas, H.O.; Anderson, G.; Kubera, M.; Carvalho, A.F.; Nunes, S.O.V. In major affective disorders, early life trauma predict increased nitro-oxidative stress, lipid peroxidation and protein oxidation and recurrence of major affective disorders, suicidal behaviors and a lowered quality of life. Metab. Brain Dis. 2018, 33, 1081–1096. [Google Scholar] [CrossRef] [PubMed]
- Maes, M. False dogmas in affective disorders research. World J. Psychiatry 2022, in press. [Google Scholar]
- Stoyanov, D.; Maes, M.H. How to construct neuroscience-informed psychiatric classification? Towards nomothetic networks psychiatry. World J. Psychiatry. 2021, 11, 1–12. [Google Scholar] [CrossRef]
- Moylan, S.; Berk, M.; Dean, O.M.; Samuni, Y.; Williams, L.J.; O’Neil, A.; Hayley, A.C.; Pasco, J.A.; Anderson, G.; Jacka, F.N.; et al. Oxidative & nitrosative stress in depression: Why so much stress? Neurosci. Biobehav. Rev. 2014, 45, 46–62. [Google Scholar] [CrossRef]
- Maes, M.; Galecki, P.; Chang, Y.S.; Berk, M. A review on the oxidative and nitrosative stress (O&NS) pathways in major depression and their possible contribution to the (neuro)degenerative processes in that illness. Prog. Neuropsychopharmacol. Biol. Psychiatry 2011, 35, 676–692, Epub 2010 May 12. [Google Scholar] [CrossRef]
- Maes, M.; Carvalho, A.F. The Compensatory Immune-Regulatory Reflex System (CIRS) in Depression and Bipolar Disorder. Mol. Neurobiol. 2018, 55, 8885–8903. [Google Scholar] [CrossRef] [PubMed]
- Rachayon, M.; Jirakran, K.; Sodsai, P.; Klinchanhom, S.; Sughondhabirom, A.; Plaimas, K.; Suratanee, A.; Maes, M. In Vitro Effects of Cannabidiol on Activated Immune–Inflammatory Pathways in Major Depressive Patients and Healthy Controls. Pharmaceuticals 2022, 15, 405. [Google Scholar] [CrossRef]
- Maes, M.; Rachayon, M.; Jirakran, K.; Sodsai, P.; Klinchanhom, S.; Gałecki, P.; Sughondhabirom, A.; Basta-Kaim, A. The immune profile of Major Dysmood Disorder: Proof of concept and mechanism using the precision nomothetic psychiatry approach. Cells 2022, in press. [Google Scholar] [CrossRef] [PubMed]
- Bourassa, K.J.; Rasmussen, L.J.H.; Danese, A.; Eugen-Olsen, J.; Harrington, H.; Houts, R.; Poulton, R.; Ramrakha, S.; Sugden, K.; Williams, B.; et al. Linking stressful life events and chronic inflammation using suPAR (soluble urokinase plasminogen activator receptor). Brain Behav. Immun. 2021, 97, 79–88. [Google Scholar] [CrossRef] [PubMed]
- Heard-Garris, N.; Davis, M.M.; Estabrook, R.; Burns, J.; Briggs-Gowan, M.; Allen, N.; Carnethon, M.; Aguayo, L.; Wakschlag, L.; Penedo, F. Adverse childhood experiences and biomarkers of inflammation in a diverse cohort of early school-aged children. Brain Behav. Immunity-Health. 2020, 1, 100006. [Google Scholar] [CrossRef]
- Fischer, K.F.; Simon, M.S.; Elsner, J.; Dobmeier, J.; Dorr, J.; Blei, L.; Zill, P.; Obermeier, M.; Musil, R. Assessing the links between childhood trauma, C-reactive protein and response to antidepressant treatment in patients with affective disorders. Eur. Arch. Psychiatry Clin Neurosci. 2021, 271, 1331–1341. [Google Scholar] [CrossRef]
- Desplats, P.; Gutierrez, A.M.; Antonelli, M.C.; Frasch, M.G. Microglial memory of early life stress and inflammation: Susceptibility to neurodegeneration in adulthood. Neurosci. Biobehav. Rev. 2020, 117, 32–242. [Google Scholar] [CrossRef] [Green Version]
- Flouri, E.; Francesconi, M.; Midouhas, E.; Lewis, G. Prenatal and childhood adverse life events, inflammation and depressive symptoms across adolescence. J. Affect Disord. 2020, 260, 577–582. [Google Scholar] [CrossRef]
- Rasmussen, L.J.H.; Moffitt, T.E.; Arseneault, L.; Danese, A.; Eugen-Olsen, J.; Fisher, H.L.; Harrington, H.; Houts, R.; Matthews, T.; Sugden, K.; et al. Association of Adverse Experiences and Exposure to Violence in Childhood and Adolescence With Inflammatory Burden in Young People. JAMA Pediatr. 2020, 174, 38–47. [Google Scholar] [CrossRef] [Green Version]
- de Baumont, A.; Bortoluzzi, A.; Wollenhaupt de Aguiar, B.; Scotton, E.; Pinto Guimarães, L.S.; Kapczinski, F.; Belem da Silva, C.T.; Manfro, G.G. Anxiety disorders in childhood are associated with youth IL-6 levels: A mediation study including metabolic stress and childhood traumatic events. J. Psychiatr. Res. 2019, 115, 43–50. [Google Scholar] [CrossRef]
- Kim, S.; Watt, T.; Ceballos, N.; Sharma, S. Adverse childhood experiences and neuroinflammatory biomarkers-The role of sex. Stress Health 2019, 35, 432–440. [Google Scholar] [CrossRef] [PubMed]
- Lo Iacono, L.; Bussone, S.; Andolina, D.; Tambelli, R.; Troisi, A.; Carola, V. Dissecting major depression: The role of blood biomarkers and adverse childhood experiences in distinguishing clinical subgroups. J. Affect Disord. 2020, 276, 351–360. [Google Scholar] [CrossRef] [PubMed]
- Hamilton, M. A rating scale for depression. J. Neurol. Neurosurg. Psychiatry. 1960, 23, 56–62. [Google Scholar] [CrossRef] [PubMed] [Green Version]
- Pettersson, A.; Modin, S.; Wahlström, R.; Hammarberg, S.A.W.; Krakau, I. The Mini-International Neuropsychiatric Interview is useful and well accepted as part of the clinical assessment for depression and anxiety in primary care: A mixed-methods study. BMC Fam. Pract. 2018, 19, 19. [Google Scholar] [CrossRef] [PubMed]
- Rungmueanporn, L.; Buanthong, N.; Chandarasiri, P.; Wittayasai, W. Development of the adverse childhood experiences (ACE) questionnaire Thai version. Chula Med. Bull. 2019, 1, 251–260. [Google Scholar]
- Spielberger, C.; Gorsuch, R.; Lushene, R.; Vagg, P.R.; Jacobs, G. Manual for the State-Trait Anxiety Inventory (Form Y1–Y2); Consulting Psychologists Press: Palo Alto, CA, USA, 1983; Volume 4. [Google Scholar]
- Posner, K.; Brown, G.K.; Stanley, B.; Brent, D.A.; Yershova, K.V.; Oquendo, M.A.; Currier, G.W.; Melvin, G.A.; Greenhill, L.; Shen, S.; et al. The Columbia-Suicide Severity Rating Scale: Initial validity and internal consistency findings from three multisite studies with adolescents and adults. Am. J. Psychiatry. 2011, 168, 1266–1277. [Google Scholar] [CrossRef] [Green Version]
- De Groote, D.; Zangerle, P.F.; Gevaert, Y.; Fassotte, M.F.; Beguin, Y.; Noizat-Pirenne, F.; Pirenne, J.; Gathy, R.; Lopez, M.; Dehart, I.; et al. Direct stimulation of cytokines (IL-1 beta, TNF-alpha, IL-6, IL-2, IFN-gamma and GM-CSF) in whole blood. I. Comparison with isolated PBMC stimulation. Cytokine 1992, 4(3), 239–248. [Google Scholar] [CrossRef]
- Maes, M.; Song, C.; Lin, A.H.; Bonaccorso, S.; Kenis, G.; De Jongh, R.; Bosmans, E.; Scharpé, S. Negative immunoregulatory effects of antidepressants: Inhibition of interferon-gamma and stimulation of interleukin-10 secretion. Neuropsychopharmacol 1999, 20, 370–379. [Google Scholar] [CrossRef]
- Kubera, M.; Lin, A.H.; Kenis, G.; Bosmans, E.; van Bockstaele, D.; Maes, M. Anti-Inflammatory effects of antidepressants through suppression of the interferon-gamma/interleukin-10 production ratio. J. Clin. Psychopharmacol. 2001, 21, 199–206. [Google Scholar] [CrossRef]
- Breen, E.J.; Polaskova, V.; Khan, A. Bead-based multiplex immuno-assays for cytokines, chemokines, growth factors and other analytes: Median fluorescence intensities versus their derived absolute concentration values for statistical analysis. Cytokine 2015, 71, 188–198. [Google Scholar] [CrossRef]
- Benjamini, Y.; Hochberg, Y. Controlling the False Discovery Rate: A Practical and Powerful Approach to Multiple Testing. J. Royal Statist. Soc. Series B 1995, 57, 289–300. [Google Scholar] [CrossRef]
- Ringle, C.; Da Silva, D.; Bido, D. Structural equation modeling with the SmartPLS. Braz J. Market. 2015, 13, 56–73. [Google Scholar]
- Bradley, B.; Mogg, K.; Galbraith, M.; Perrett, A. Negative recall bias and neuroticism: State vs. trait effects. Behav. Res. Ther. 1993, 31, 125–127. [Google Scholar] [CrossRef]
- Gill, H.; El-Halabi, S.; Majeed, A.; Gill, B.; Lui, L.M.W.; Mansur, R.B.; Lipsitz, O.; Rodrigues, N.B.; Phan, L.; Chen-Li, D.; et al. The Association Between Adverse Childhood Experiences and Inflammation in Patients with Major Depressive Disorder: A Systematic Review. J. Affect Disord. 2020, 272, 1–7. [Google Scholar] [CrossRef]
- Simeonova, D.; Stoyanov, D.; Leunis, J.C.; Murdjeva, M.; Maes, M. Construction of a nitro-oxidative stress-driven, mechanistic model of mood disorders: A nomothetic network approach. Nitric. Oxide. 2021, 106, 45–54. [Google Scholar] [CrossRef]
- Wu, C.K.; Tseng, P.T.; Chen, Y.W.; Tu, K.Y.; Lin, P.Y. Significantly higher peripheral fibroblast growth factor-2 levels in patients with major depressive disorder: A preliminary meta-analysis under MOOSE guidelines. Medicine 2016, 95, e4563. [Google Scholar] [CrossRef]
- He, S.; Zhang, T.; Hong, B.; Peng, D.; Su, H.; Lin, Z.; Fang, Y.; Jiang, K.; Liu, X.; Li, H. Decreased serum fibroblast growth factor - 2 levels in pre- and post-treatment patients with major depressive disorder. Neurosci. Lett. 2014, 579, 168–172. [Google Scholar] [CrossRef]
- Clark-Raymond, A.; Halaris, A. VEGF and depression: A comprehensive assessment of clinical data. J. Psychiatr. Res. 2013, 47, 1080–1087. [Google Scholar] [CrossRef]
- Kahl, K.G.; Bens, S.; Ziegler, K.; Rudolf, S.; Kordon, A.; Dibbelt, L.; Schweiger, U. Angiogenic factors in patients with current major depressive disorder comorbid with borderline personality disorder. Psychoneuroendocrinol 2009, 34, 353–357. [Google Scholar] [CrossRef]
- Iga, J.-I.; Ueno, S.-I.; Yamauchi, K.; Numata, S.; Tayoshi-Shibuya, S.; Kinouchi, S.; Nakataki, M.; Song, H.; Hokoishi, K.; Tanabe, H.; et al. Gene expression and association analysis of vascular endothelial growth factor in major depressive disorder. Prog. Neuro.-Psychopharmacol. Biol. Psychiatry 2007, 31, 658–663. [Google Scholar] [CrossRef]
- Jha, M.K.; Minhajuddin, A.; Gadad, B.S.; Trivedi, M.H. Platelet-Derived Growth Factor as an Antidepressant Treatment Selection Biomarker: Higher Levels Selectively Predict Better Outcomes with Bupropion-SSRI Combination. Int. J. Neuropsychopharmacol. 2017, 20, 919–927. [Google Scholar] [CrossRef] [PubMed] [Green Version]
- Thisayakorn, P.; Thipakorn, Y.; Tantavisut, S.; Sirivichayakul, S.; Maes, M. Delirium due to hip fracture is associated with activated immune-inflammatory pathways and a reduction in negative immunoregulatory mechanisms. medRxiv 22271663. Available online: https://www.medrxiv.org/content/10.1101/2022.02.28.22271663v1.full (accessed on 4 May 2022). [CrossRef]
- Vasupanrajit, A.; Jirakran, K.; Tunvirachaisakul, C.; Maes, M. Suicide attempts are associated with activated immune-inflammatory, nitro-oxidative, and neurotoxic pathways: A systematic review and meta-analysis. J. Affect Disord. 2021, 295, 80–92. [Google Scholar] [CrossRef] [PubMed]
- Vasupanrajit, A.; Jirakran, K.; Tunvirachaisakul, C.; Solmi, M.; Maes, M. Inflammation and nitro-oxidative stress in current suicidal attempts and current suicidal ideation: A systematic review and meta-analysis. Mol. Psychiatry 2022, 1–12. [Google Scholar] [CrossRef] [PubMed]
- Nakada, M.; Kita, D.; Watanabe, T.; Hayashi, Y.; Teng, L.; Pyko, I.V.; Hamada, J. Aberrant signaling pathways in glioma. Cancers 2011, 3, 3242–3378. [Google Scholar] [CrossRef] [Green Version]
- Morris, R.; Kershaw, N.J.; Babon, J.J. The molecular details of cytokine signaling via the JAK/STAT pathway. Protein Sci. 2018, 27, 1984–2009. [Google Scholar] [CrossRef] [Green Version]
- Murray, P.J. The JAK-STAT Signaling Pathway: Input and Output Integration. J. Immunol. 2007, 178, 2623–2629. [Google Scholar] [CrossRef] [Green Version]
- Gong, M.; Zhuo, X.; Ma, A. STAT6 Upregulation Promotes M2 Macrophage Polarization to Suppress Atherosclerosis. Med. Sci. Monit. Basic Res. 2017, 23, 240–249. [Google Scholar] [CrossRef]
- Sharma, R.P.; Rosen, C.; Melbourne, J.K.; Feiner, B.; Chase, K.A. Activated Phosphorylated STAT1 Levels as a Biologically Relevant Immune Signal in Schizophrenia. Neuroimmunomodulation 2016, 23, 224–229. [Google Scholar] [CrossRef] [Green Version]
- Maes, M.; Vojdani, A.; Sirivichayakul, S.; Barbosa, D.S.; Kanchanatawan, B. Inflammatory and Oxidative Pathways Are New Drug Targets in Multiple Episode Schizophrenia and Leaky Gut, Klebsiella pneumoniae, and C1q Immune Complexes Are Additional Drug Targets in First Episode Schizophrenia. Mol. Neurobiol. 2021, 58, 3319–3334. [Google Scholar] [CrossRef]
- UniProtB. UniProtKB—Q04206 (TF65_HUMAN). RELA—Transcription Factor p65—Homo Sapiens (Human)—RELA Gene & Protein. Available online: https://www.uniprot.org (accessed on 23 July 2021).
- Felitti, V.J.; Anda, R.F.; Nordenberg, D.; Williamson, D.F.; Spitz, A.M.; Edwards, V.; Koss, M.P.; Marks, J.S. Relationship of childhood abuse and household dysfunction to many of the leading causes of death in adults. The Adverse Childhood Experiences (ACE) Study. Am. J. Prev. Med. 1998, 14, 245–258. [Google Scholar] [CrossRef]
- Scott, K.M.; Von Korff, M.; Angermeyer, M.C.; Benjet, C.; Bruffaerts, R.; de Girolamo, G.; Haro, J.M.; Lépine, J.P.; Ormel, J.; Posada-Villa, J.; et al. Association of childhood adversities and early-onset mental disorders with adult-onset chronic physical conditions. Arch. Gen. Psychiatry 2011, 68, 838–844. [Google Scholar] [CrossRef] [PubMed] [Green Version]
- Al-Hakeim, H.K.; Al-Jassas, H.K.; Morris, G.; Maes, M. Increased ACE2, sRAGE, and immune activation, but lowered calcium and magnesium in COVID-19. Recent Adv. Inflamm. Allergy Drug Discov. 2022, 16. [Google Scholar] [CrossRef] [PubMed]
- Haus, E.; Dumitriu, L.; Nicolau, G.Y.; Bologa, S.; Sackett-Lundeen, L. Circadian rhythms of basic fibroblast growth factor (bFGF), epidermal growth factor (EGF), insulin-like growth factor-1 (IGF-1), insulin-like growth factor binding protein-3 (IGFBP-3), cortisol, and melatonin in women with breast cancer. Chronobiol Int. 2001, 18, 709–727. [Google Scholar] [CrossRef] [PubMed]
- Bookout, A.L.; de Groot, M.H.; Owen, B.M.; Lee, S.; Gautron, L.; Lawrence, H.L.; Ding, X.; Elmquist, J.K.; Takahashi, J.S.; Mangelsdorf, D.J.; et al. FGF21 regulates metabolism and circadian behavior by acting on the nervous system. Nat. Med. 2013, 19, 1147–1152. [Google Scholar] [CrossRef]
- Jensen, L.D.; Gyllenhaal, C.; Block, K. Circadian angiogenesis. Biomol Concepts. 2014, 5, 245–256. [Google Scholar] [CrossRef] [PubMed]
- Baik, L.S.; Fogle, K.J.; Roberts, L.; Galschiodt, A.M.; Chevez, J.A.; Recinos, Y.; Nguy, V.; Holmes, T.C. CRYPTOCHROME mediates behavioral executive choice in response to UV light. Proc. Natl. Acad. Sci. USA 2017, 114, 776–781. [Google Scholar] [CrossRef] [Green Version]
- Bozek, K.; Relógio, A.; Kielbasa, S.M.; Heine, M.; Dame, C.; Kramer, A.; Herzel, H. Regulation of clock-controlled genes in mammals. PLoS ONE 2009, 4, e4882. [Google Scholar] [CrossRef]
- Maes, M.; Kubera, M.; Obuchowiczwa, E.; Goehler, L.; Brzeszcz, J. Depression’s multiple comorbidities explained by (neuro)inflammatory and oxidative & nitrosative stress pathways. Neuro. Endocrinol. Lett. 2011, 32, 7–24. [Google Scholar]
- Maes, M. The cytokine hypothesis of depression: Inflammation, oxidative & nitrosative stress (IO&NS) and leaky gut as new targets for adjunctive treatments in depression. Neuro. Endocrinol. Lett. 2008, 29, 287–291. [Google Scholar]
- Maes, M.; Nani, J.V.; Noto, C.; Rizzo, L.; Hayashi, M.A.F.; Brietzke, E. Impairments in Peripheral Blood T Effector and T Regulatory Lymphocytes in Bipolar Disorder Are Associated with Staging of Illness and Anti-cytomegalovirus IgG Levels. Mol. Neurobiol. 2021, 58, 229–242. [Google Scholar] [CrossRef] [PubMed]


| Variables | HC (n = 20) | Major Depression (n = 30) | F/X2/FEPT | df | p |
|---|---|---|---|---|---|
| Sex (Male/Female) | 6/14 | 11/19 | 0.24 | 1 | 0.626 |
| Age (years) | 33.6 (8.0) | 28.7 (8.6) | 2.47 | 2/47 | 0.095 |
| Education (years) | 16.1 (2.2) | 15.6 (1.4) | 2.99 | 2/47 | 0.060 |
| BMI (kg/m2) | 21.33 (2.51) | 25.52 (5.95) | 4.32 | 2/47 | 0.019 |
| TUD (No/Yes) | 18/2 | 23/7 | FEPT | - | 0.285 |
| HDRS | 0.9 (1.5) | 23.5 (5.8) | 147.01 | 2/47 | <0.001 |
| STAI | 37.8 (10.6) | 56.8 (7.2) | 28.00 | 2/47 | <0.001 |
| Total number of all episodes | 0.0 | 2.10 (0.92 | |||
| Reoccurrence of illness | −1.089 (0.00) | 0.726 (0.586) | KW | - | <0.001 |
| Lifetime suicidal behaviors | −0.987 (0.0) | 0.658 (0.767) | KW | - | <0.001 |
| Recent suicidal behaviors | −0.916 (0.0) c | 0.611 (0.861) | KW | - | <0.001 |
| LV phenome | −1.123 (0.225) | 0.749 (0.455) | 170.48 | 2/47 | <0.001 |
| Mental trauma | 19/1 | 13/17 | 13.90 | 1 | <0.001 |
| Physical trauma | 19/1 | 16/14 | 9.92 | 1 | 0.002 |
| Sexual abuse | 20/0 | 22/8 | FEBT | 0.015 | |
| Mental neglect | 20/0 | 14/16 | 15.69 | 1 | <0.001 |
| Physical neglect | 17/3 | 27/3 | FEPT | - | 0.672 |
| Domestic violence | 119/1 | 19/11 | FEPT | - | 0.016 |
| Drug abuse in family | 19/1 | 29/1 | FEPT | - | 1.00 |
| Family history of mental illness | 20/0 | 18/12 | FEPT | - | 0.001 |
| Losing a parent | 18/2 | 19/11 | 4.44 | 1 | 0.035 |
| Criminal behavior | 18/2 | 29/1 | FEPT | - | 0.556 |
| ACE domain 1 | 0.25 (0.55) | 2.70 (1.82) | 39.66 | 1/48 | <0.001 |
| ACE domain 2 | 0.300 (0.66) | 0.43 (0.68) | 0.48 | 1/48 | 0.494 |
| Variables (z Scores) | HC a n = 20 | ACE < 3 b n = 11 | ACE ≥ 3 c n = 19 | Wald df = 2 | p | |
|---|---|---|---|---|---|---|
| M1 | UNST | −0.879 (0.061) | −0.867 (0.068) | −0.837 (0.060) | 7.80 | 0.020 |
| STIM | 0.607 (0.043) c | 0.762 (0.132) | 1.269 (0.227) a | |||
| Th1 | UNST | −1.385 (0.074) | −1.549 (0.086) | −1.484 (0.058) | 8.05 | 0.018 |
| STIM | 0.222 (0.085) c | 0.284 (0.152) | 0.776 (0.237) a | |||
| Th17 | UNST | −1.672 (0.058) | −1.693 (0.043) | −1.743 (0.004) | 6.74 | 0.039 |
| STIM | 0.266 (0.073) c | 0.370 (0.103) | 0.738 (0.196) a | |||
| Th2 | UNST | −1.324 (0.074) | −1.345 (0.617) | −1.299 (0.084) | 12.14 | 0.002 |
| STIM | 0.061 (0.089) c | 0.304 (0.198) | 0.902 (0.269) a | |||
| IRS | UNST | −1.521 (0.095) | −1.566 (0.110) | −1.496 (0.096) | 12.65 | 0.002 |
| STIM | 0.123 (0.049) c | 0.309 (0.160) c | 0.885 (0.234) a | |||
| CIRS | UNST | −0.924 (0.060) | −0.918 (0.067) | −0.787 (0.091) | 5.07 | 0.079 |
| STIM | 0.664 (0.083) | 0.807 (0.139) | 1.210 (0.175) | |||
| Tcell | UNST | −1.471 (0.092) | −1.518 (0.119) | −1.370 (0.146) | 13.73 | 0.001 |
| STIM | 0.032 (0.048) c | 0.194 (0.175) c | 0.846 (0.242) a | |||
| GF | UNST | −0.849 (0.098) | −0.828 (0.132) | −0.649 (0.149) | 13.88 | 0.003 |
| STIM | 0.474 (0.014) c | 0.717 (0.172) | 1.213 (0.235) a | |||
| NT | UNST | −1.615 (0.102) | −1.682 (0.117) | −1.687 (0.063) | 9.15 | 0.010 |
| STIM | 0.266 (0.065) c | 0.367 (0.117) | 0.799 (0.197) a |
| Variables (z Scores) | HC a | ACE < 3 b | ACE > 3 c | Wald (df = 2) | p Value |
|---|---|---|---|---|---|
| sIL-1RA | −0.272 (0.041) c | −0.053 (0.125) | 0.386 (0.229) a | 17.17 (G) | <0.001 |
| IL-2 | −0.222 (0.113) | 0.088 (0.131) c | 0.653 (0.200) a | 6.34 (T x G) | 0.042 |
| IL-5 | −0.303 (0.135) c | 0.053 (0.246) | 0.764 (0.361) a | 11.24 (T X G) | 0.005 |
| CXCL8 | −0.155 (0.018) c | 0.294 (0.357) | 0.900 (0.392) a | 9.20 (T X G) | 0.010 |
| IL-9 | −0.268 (0.034) c | 0.116 (0.281) | 0.812 (0.358) a | 9.80 (T X G) | 0.007 |
| IL-12 | −0.450 (0.031) c | −0.325 0.102 | −0.002 0.164 a | 7.29 (G) | 0.026 |
| IL-15 | 0.023 (0.029) c | 0.236 (0.191) | 0.728 (0.229) a | 14.34 (T X G) | <0.001 |
| IL-17 | 0.007 (0.063) c | 0.187 (0.180) | 0.731 (0.230) a | 10.49 (T X G) | 0.005 |
| FGF | −0.757 (0.025) c | −0.746 (0.044) c | −0.577 (0.044) a, b | 14.45 (G) | 0.006 |
| G-CSF | −0.256 (0.014) c | 0.106 (0.262) | 0.637 (0.354) a | 11.70 (T X G) | 0.003 |
| CXCL10 | −0.809 (0.086) c | -0.659 (0.161) | -0.336 (0.158) a | 6.94 (G) | 0.031 |
| MIP1A | −0.621 (0.085) c | −0.635 (0.107) c | −0.857 (0.031) a, b | 9.94 (G) | 0.007 |
| PDGF | −0.383(0.007) c | −0.043 (0.228) | 0.637 (0.349) a | 10.84 (T X G) | 0.004 |
| CCL5 | −0.023 (0.132) c | 0.229 (0.232) | 0.805 (0.303) a | 7.91 (T X G) | 0.019 |
| TNF-α | −0.283 (0.014) c | −0.041 (0.180) | 0.689 (0.397) a | 7.78 (T X G) | 0.020 |
| VEGF | 0.050 (0.132) c | 0.292 (0.167) | 0.734 (0.211) a | 8.03 (T X G) | 0.018 |
| Variables | ROI | Lifetime SB | Recent SB | Phenome | IRS | NIT | GF |
|---|---|---|---|---|---|---|---|
| Mental trauma | 0.466 *** | 0.388 ** | 0.342 * | 0.547 *** | 0.467 *** | 0.401 ** | 0.447 *** |
| Physical trauma | 0.422 ** | 0.432 ** | 0.319 * | 0.455 *** | 0.436 ** | 0.410 ** | 0.449 *** |
| Sexual abuse | 0.231 | 0.225 | 0.315 * | 0.347 * | −0.128 | −0.186 | −0.078 |
| Mental neglect | 0.646 *** | 0.569 *** | 0.574 *** | 0.609 *** | 0.464 *** | 0.462 *** | 0.403 ** |
| Physical neglect | 0.001 | −0.043 | 0.035 | −0.120 | −0.171 | −0.251 | −0.011 |
| Domestic violence | 0.369 ** | 0.394 ** | 0.407 ** | 0.321 * | 0.197 | 0.140 | 0.215 |
| Drug abuse family | −0.108 | −0.084 | −0.024 | −0.082 | −0.040 | −0.082 | 0.047 |
| Family history | 0.266 | 0.240 | 0.275 | 0.469 *** | 0.280 * | 0.261 | 0.266 |
| Losing a parent | 0.293 * | 0.263 | 0.313 * | 0.281 * | 0.019 | 0.001 | −0.022 |
| Criminal | −0.099 | −0.114 | −0.034 | −0.125 | −0.159 | −0.130 | −0.189 |
| ACE Domain1 | 0.633 *** | 0.589 *** | 0.582 *** | 0.294 *** | 0.413 ** | 0.337 * | 0.473 *** |
| Dependent Variables | Explanatory Variables | β | t | p | F model | df | p | R2 |
|---|---|---|---|---|---|---|---|---|
| 1. Phenome | Model | 10.26 | 4/45 | <0.001 | 0.477 | |||
| ACEs | 0.622 | 5.48 | <0.001 | |||||
| Age | −0.185 | −1.90 | 0.118 | |||||
| Gender | −0.112 | −0.99 | 0.325 | |||||
| Education | −0.021 | −0.19 | 0.849 | |||||
| 2. Phenome | Model | 37.21 | 5/44 | <0.001 | 0.809 | |||
| ACEs | 0.120 | 1.34 | 0.187 | |||||
| ROI | 0.711 | 8.40 | <0.001 | |||||
| Neuroimmunotoxicity | 0.351 | 3.08 | 0.004 | |||||
| Age | −0.162 | −2.37 | 0.022 | |||||
| CIRS | −0.227 | −2.03 | 0.048 | |||||
| 3. Phenome | Model | 45.26 | 4/45 | <0.001 | 0.801 | |||
| ROI | 0.775 | 11.05 | <0.001 | |||||
| Neuroimmunotoxicity | 0.388 | 3.47 | 0.001 | |||||
| Age | −0.181 | −2.67 | 0.010 | |||||
| CIRS | −0.240 | −2.13 | 0.038 | |||||
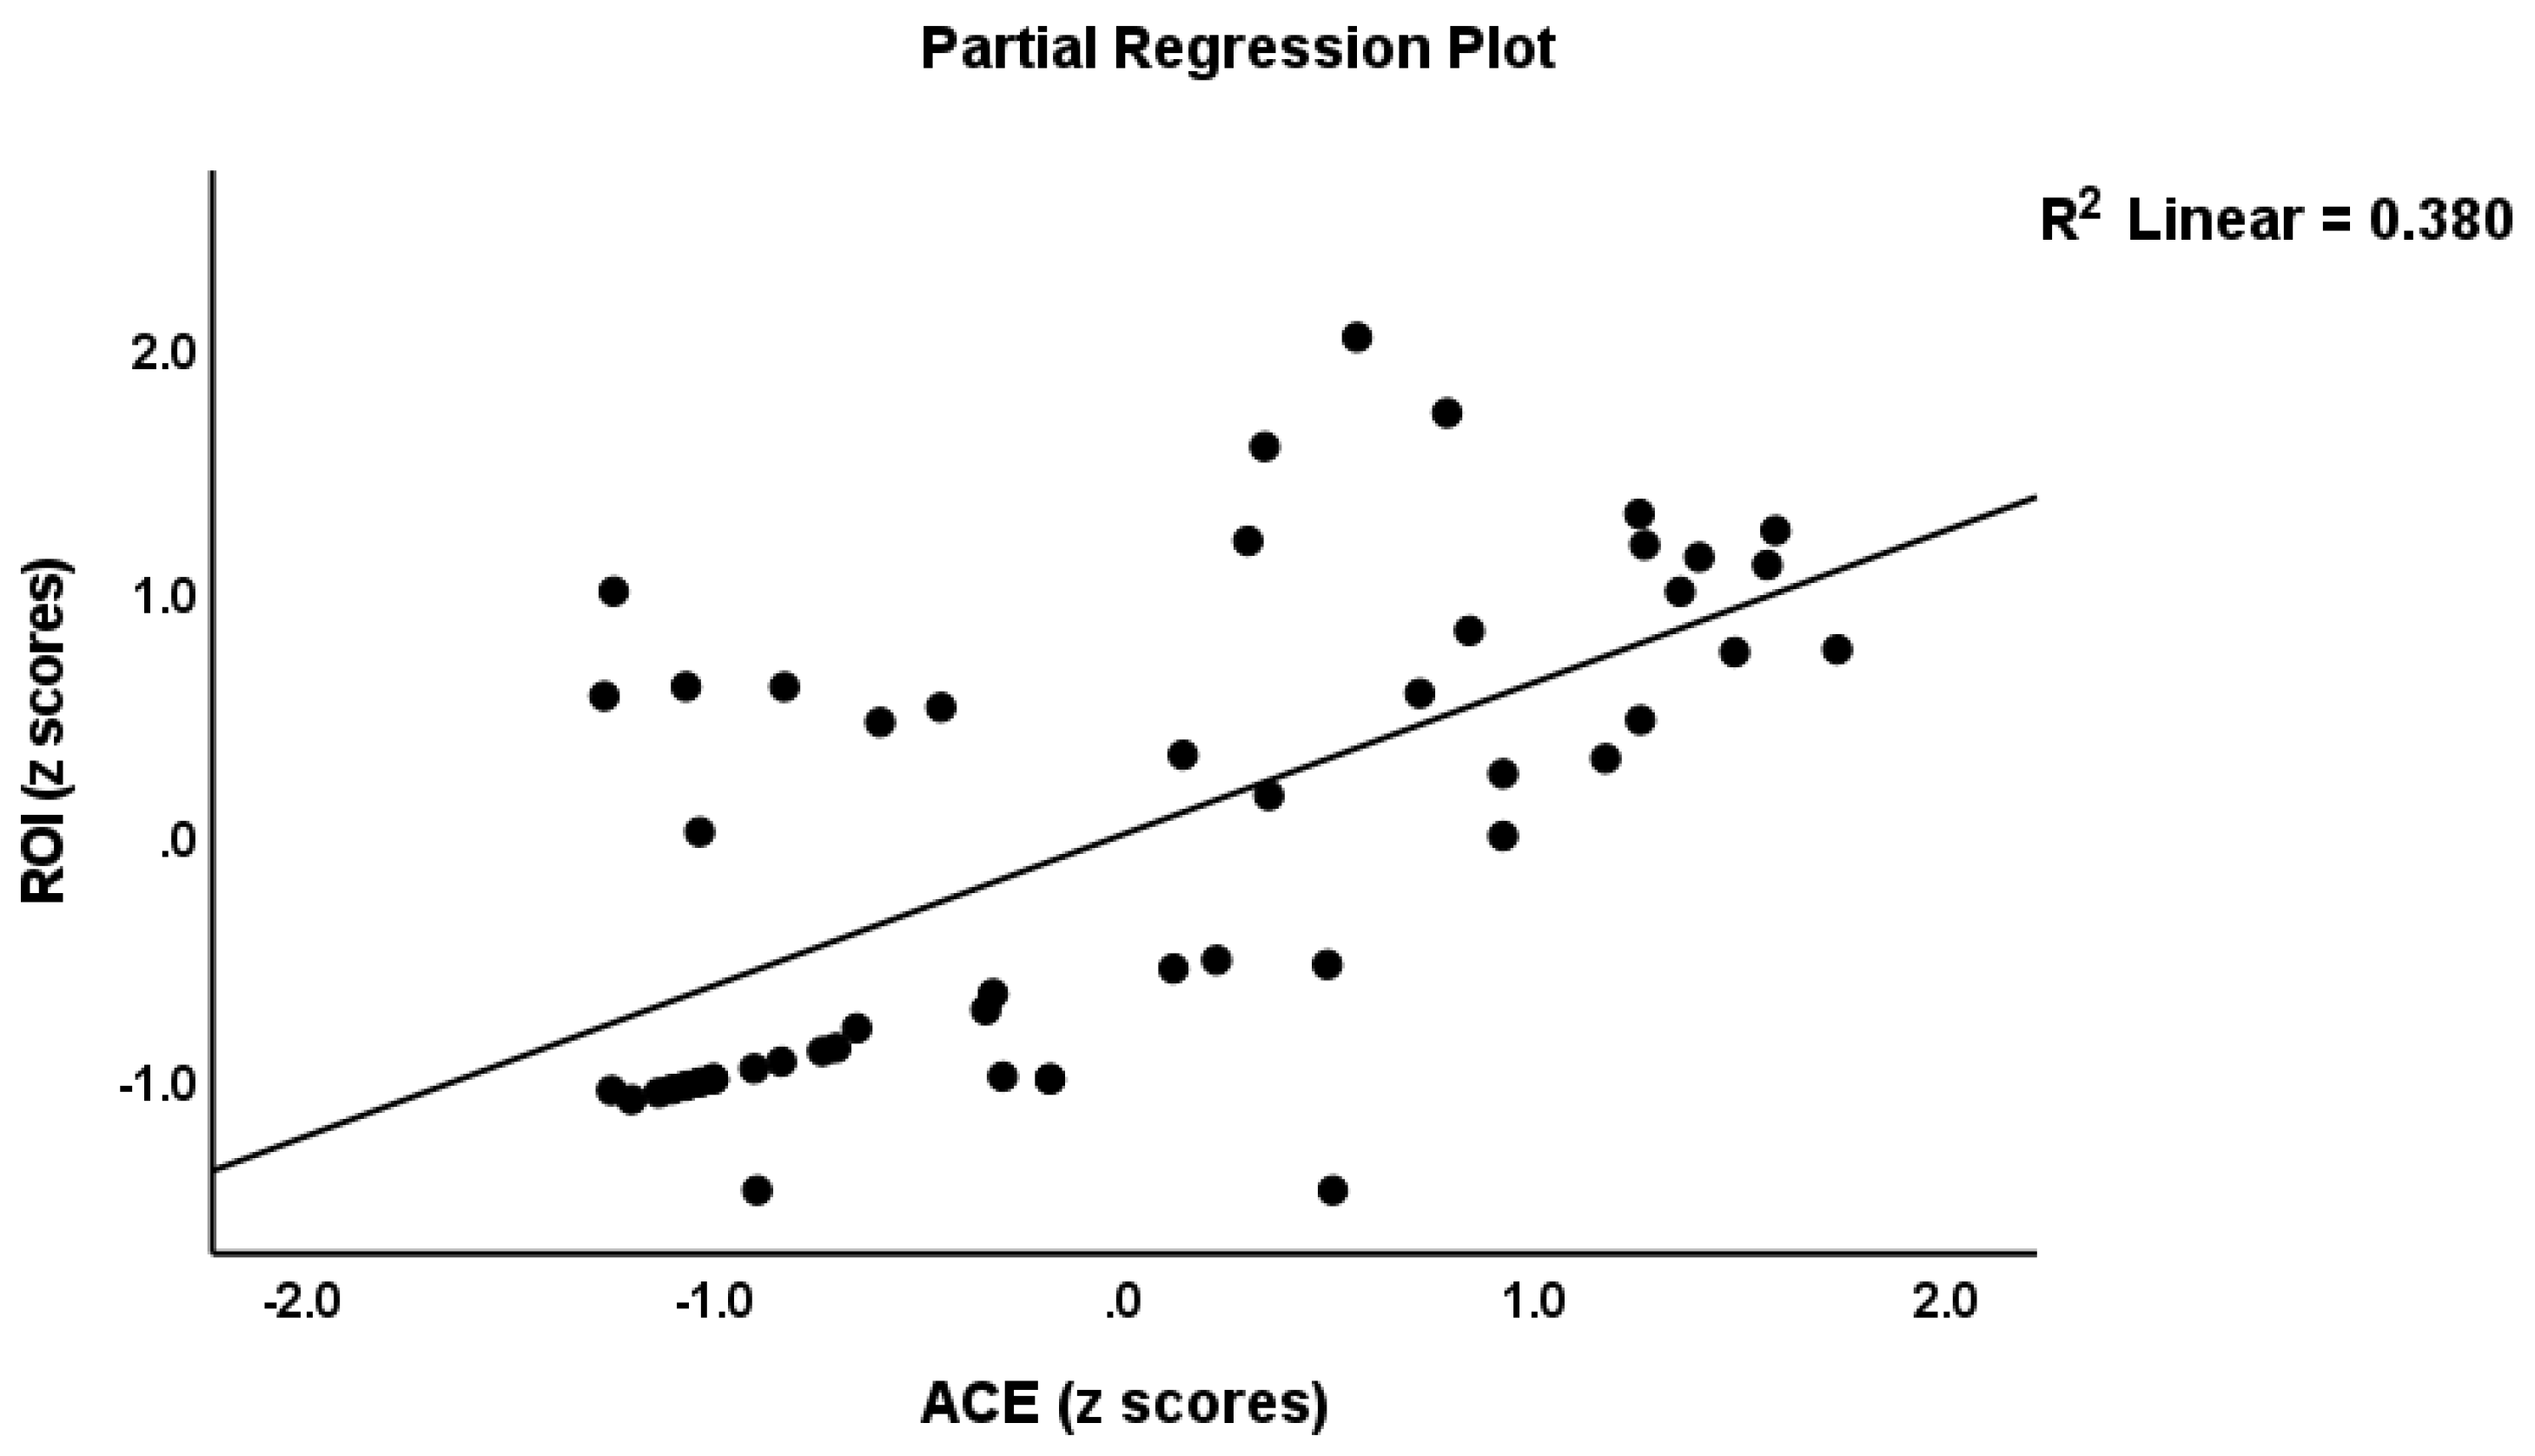
| 4. ROI | Model | 29.31 | 1/48 | <0.001 | 0.379 | |||
| ACEs | 0.616 | 5.41 | <0.001 | |||||
| 5.1 M1 macrophage | ACEs | 0.384 | 2.88 | 0.006 | 8.30 | 1/48 | 0.006 | 0.147 |
| 5.2 Thelper (Th)1 | ACEs | 0.357 | 2.65 | 0.011 | 7.03 | 1/48 | 0.011 | 0.128 |
| 5.3 Th2 | ACEs | 0.475 | 3.74 | <0.001 | 13.99 | 1/48 | <0.001 | 0.226 |
| 5.4 Th17 | ACEs | 0.299 | 2.17 | 0.035 | 4.73 | 1/48 | 0.035 | 0.090 |
| 5.5 IRS | ACEs | 0.442 | 3.22 | 0.002 | 11.62 | 1/48 | 0.001 | 0.195 |
| 5.6 CIRS | ACEs | 0.317 | 2.32 | 0.025 | 5.37 | 1/48 | 0.025 | 0.101 |
| 5.7 Neuroimmunotoxic | ACEs | 0.388 | 2.92 | 0.005 | 8.51 | 1/48 | 0.005 | 0.151 |
| 5.8 T cell growth | ACEs | 0.452 | 3.51 | <0.001 | 12.33 | 1/48 | <0.001 | 0.204 |
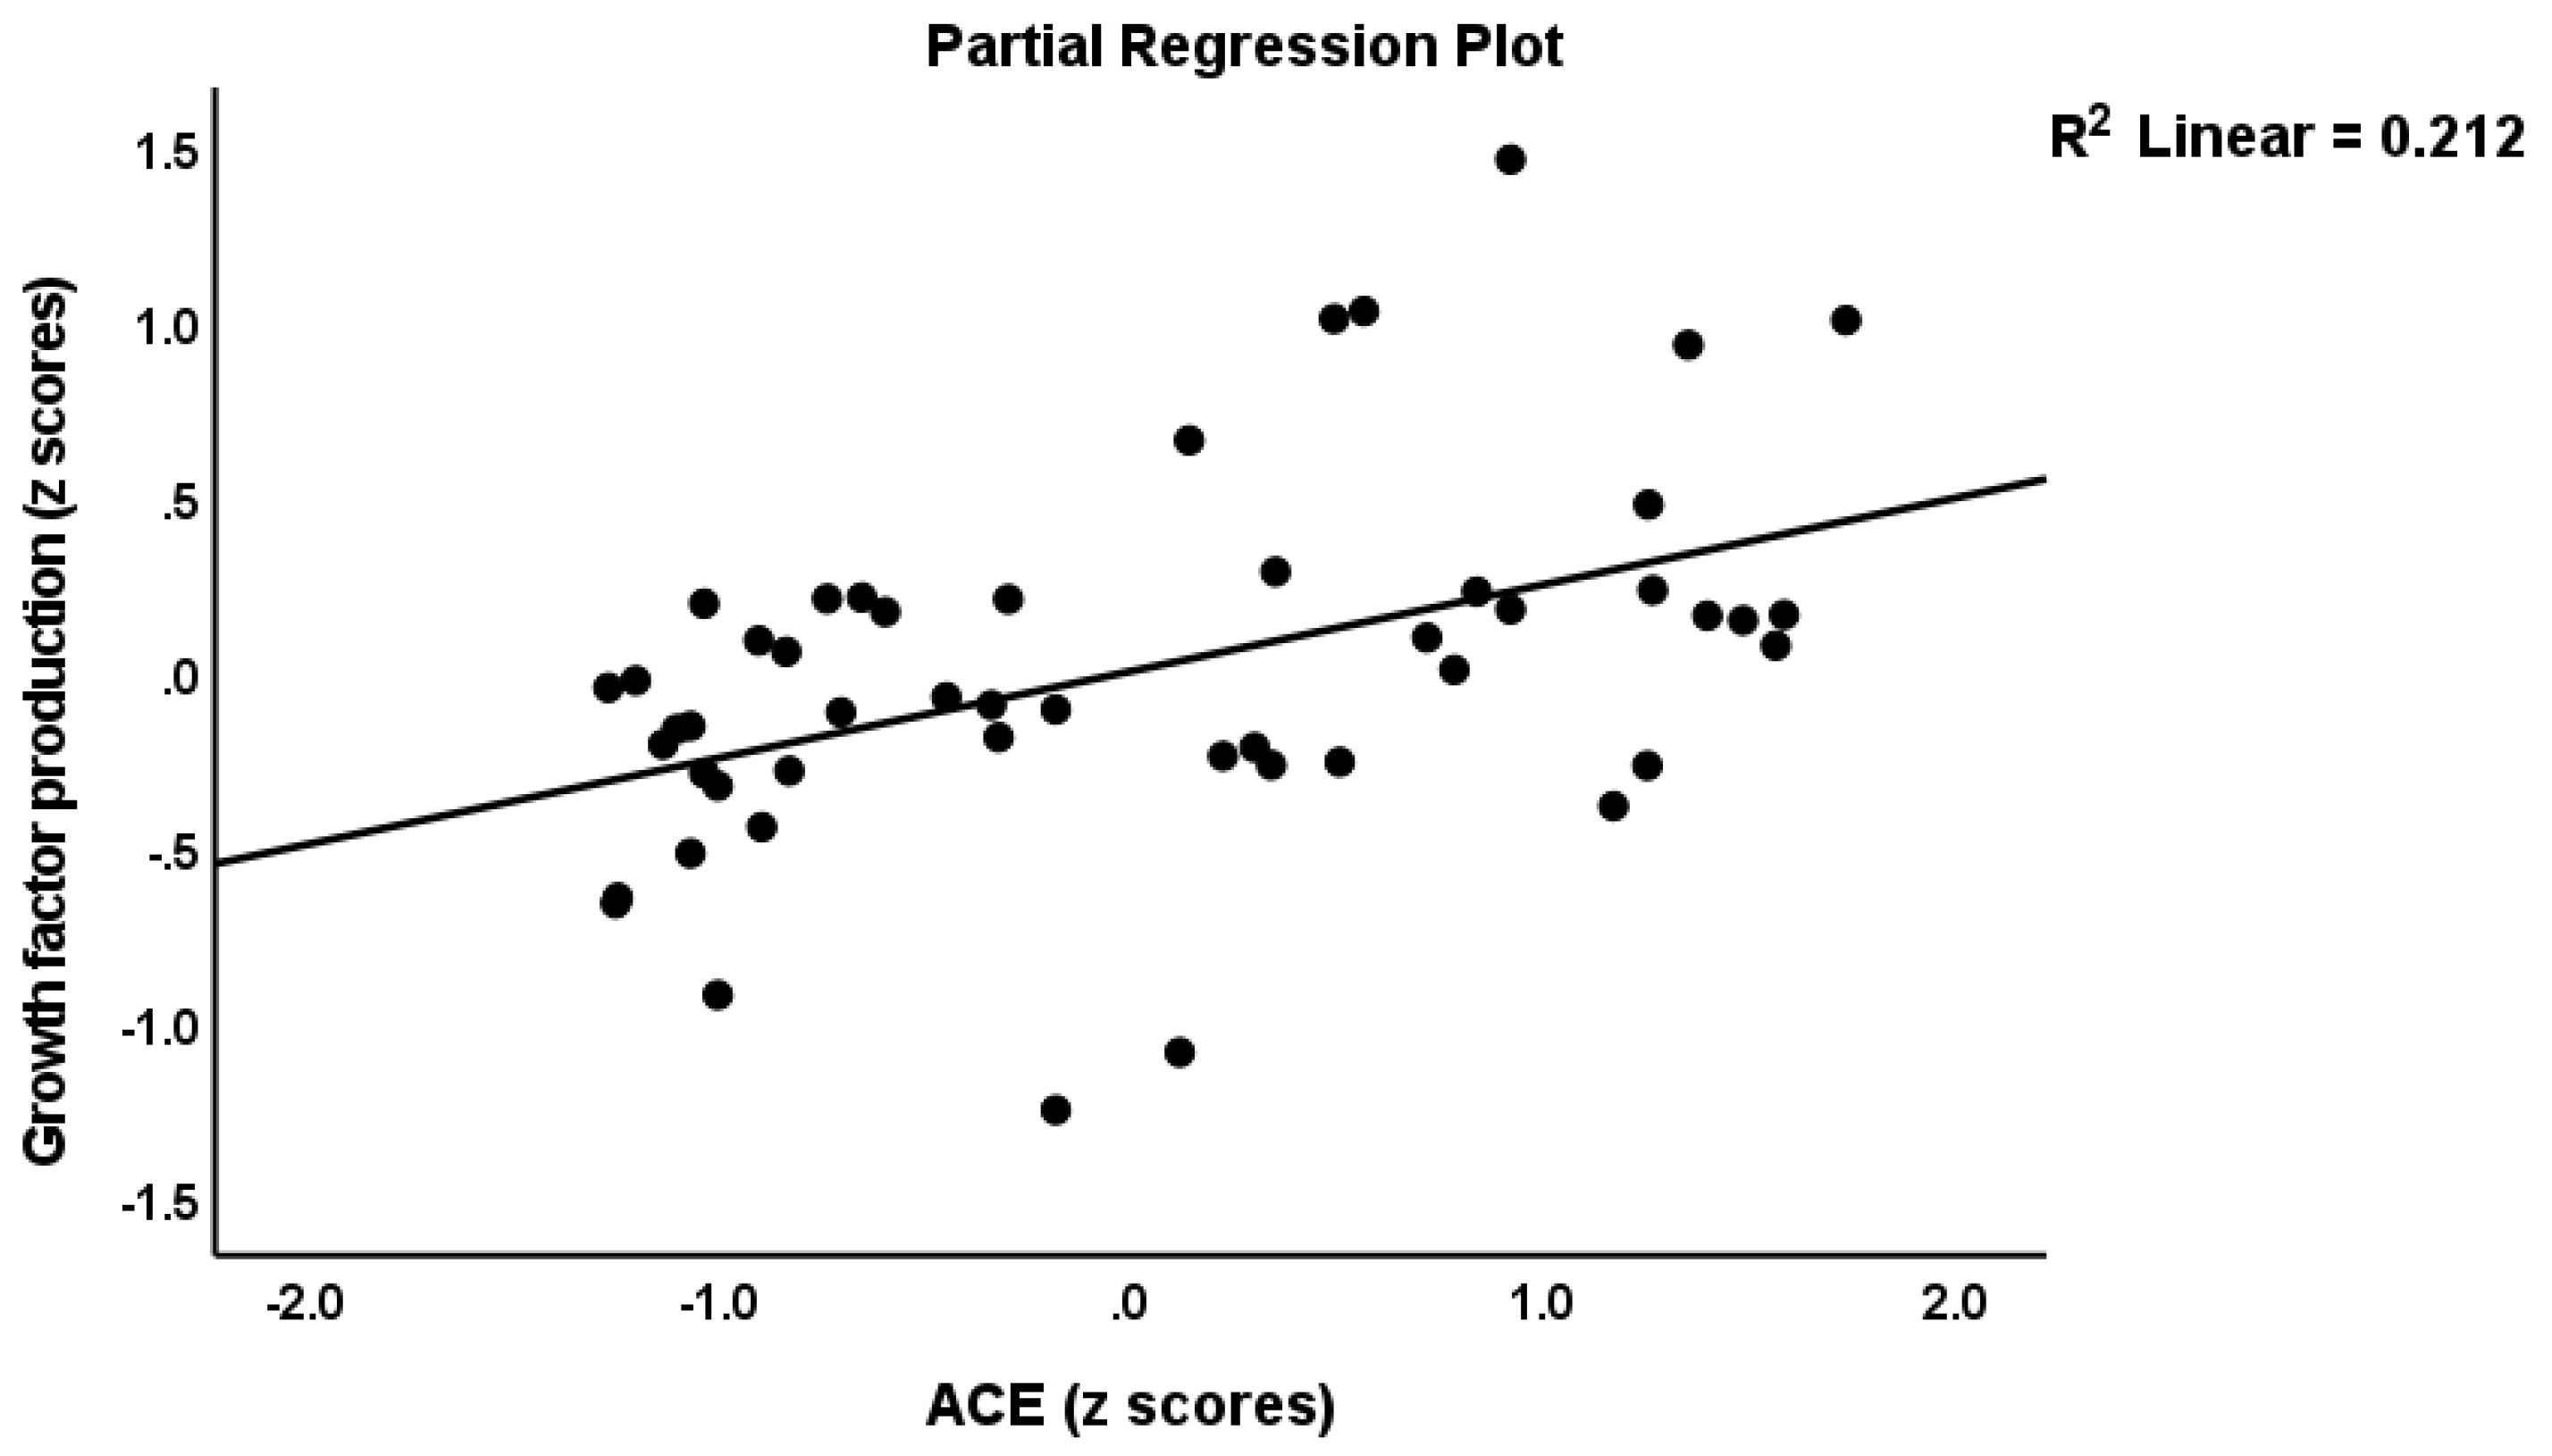
| 5.9 Growth factors | ACEs | 0.425 | 3.25 | 0.002 | 10.58 | 1/48 | 0.002 | 0.181 |
| GO Biological Process | Total | Expected | Hits | p | pFDR |
|---|---|---|---|---|---|
| intracellular protein kinase cascade | 1140 | 133 | 285 | 3.37 × 10−39 | 2.76 × 10−36 |
| regulation of I−kappaB kinase/NF−kappaB cascade | 210 | 24.7 | 90 | 1.77 × 10⁻³⁰ | 7.25 × 10⁻²⁸ |
| I−kappaB kinase/NF−kappaB cascade | 246 | 28.9 | 98 | 5.50 × 10⁻³⁰ | 1.50 × 10⁻²⁷ |
| viral reproductive process | 597 | 70.1 | 169 | 1.91 × 10⁻²⁹ | 3.92 × 10⁻²⁷ |
| positive regulation of signal transduction | 998 | 117 | 233 | 7.30 × 10⁻²⁷ | 1.20 × 10⁻²⁴ |
| interaction with host | 426 | 50 | 131 | 1.21 × 10⁻²⁶ | 1.66 × 10⁻²⁴ |
| regulation of cellular protein metabolic process | 1560 | 183 | 319 | 4.22 × 10⁻²⁶ | 4.95 × 10⁻²⁴ |
| regulation of protein modification process | 1250 | 147 | 266 | 3.03 × 10⁻²⁴ | 3.11 × 10⁻²² |
| positive regulation of I−kappaB kinase/NF−kappaB cascade | 150 | 17.6 | 66 | 1.93 × 10⁻²³ | 1.76 × 10⁻²¹ |
| positive regulation of cellular protein metabolic process | 968 | 114 | 218 | 6.06 × 10⁻²³ | 4.97 ×10⁻²¹ |
| positive regulation of protein modification process | 867 | 102 | 201 | 9.54 × 10⁻²³ | 7.11 ×10⁻²¹ |
| regulation of protein metabolic process | 1820 | 214 | 347 | 1.81 ×10⁻²² | 1.18 ×10⁻²⁰ |
| positive regulation of response to stimulus | 1550 | 182 | 307 | 1.86 ×10⁻²² | 1.18 ×10⁻²⁰ |
| viral reproduction | 803 | 94.3 | 189 | 3.39 ×10⁻²² | 1.90 ×10⁻²⁰ |
| regulation of MAPK cascade | 559 | 65.6 | 147 | 3.48 ×10⁻²² | 1.90 ×10⁻²⁰ |
| PANTHER Biological Process | Total | Expected | Hits | P | pFDR |
| Viral process | 448 | 52 | 150 | 6.09 × 10−36 | 1.18 × 10⁻³³ |
| Negative regulation of apoptotic process | 577 | 67 | 160 | 1.34 × 10⁻²⁷ | 1.30 × 10⁻²⁵ |
| Apoptotic process | 699 | 81.2 | 163 | 1.84 × 10⁻¹⁹ | 1.19 × 10⁻¹⁷ |
| Protein phosphorylation | 627 | 72.8 | 140 | 3.93 × 10⁻¹⁵ | 1.91 × 10⁻¹³ |
| Immune response | 387 | 44.9 | 96 | 1.61 × 10⁻¹³ | 6.24 × 10⁻¹² |
| Rhythmic process | 124 | 14.4 | 42 | 4.77 ×10⁻¹¹ | 1.54 × 10−09 |
| Angiogenesis | 252 | 29.3 | 61 | 1.27 ×10−08 | 3.53 × 10−07 |
| Cell−cell signaling | 232 | 26.9 | 57 | 2.18 ×10−08 | 5.28 × 10−07 |
| Circadian rhythm | 90 | 10.5 | 27 | 2.07 ×10−06 | 4.47 ×10−05 |
| Cell cycle | 647 | 75.1 | 111 | 1.16 ×10−05 | 0.000224 |
| Translation | 315 | 36.6 | 62 | 1.85 ×10−05 | 0.000326 |
| Cell proliferation | 386 | 44.8 | 72 | 2.73 ×10−05 | 0.000441 |
| Protein folding | 157 | 18.2 | 36 | 4.21 ×10−05 | 0.000628 |
| Protein folding | 157 | 17.8 | 35 | 5.72 ×10−05 | 0.000925 |
| Term ID all DEPs | Kegg Pathways | Observed | Background | Strength | FDR |
|---|---|---|---|---|---|
| hsa04060 | Cytokine−cytokine receptor interaction | 34 | 282 | 1.56 | 1.29 × 10−41 |
| hsa04061 | Viral protein interaction with cytokine and cytokine receptor | 20 | 96 | 1.8 | 1.84 × 10⁻²⁷ |
| hsa05200 | Pathways in cancer | 29 | 517 | 1.23 | 4.06 × 10⁻²⁶ |
| hsa04630 | JAK−STAT signaling pathway | 20 | 160 | 1.58 | 9.98 × 10⁻²⁴ |
| hsa05163 | Human cytomegalovirus infection | 20 | 218 | 1.44 | 2.47 × 10⁻²¹ |
| hsa04657 | IL−17 signaling pathway | 16 | 92 | 1.72 | 6.43 × 10⁻²¹ |
| hsa04668 | TNF signaling pathway | 16 | 112 | 1.63 | 9.65 × 10⁻²⁰ |
| hsa04151 | −Akt signaling pathway | 20 | 350 | 1.24 | 1.05 × 10⁻¹⁷ |
| hsa04659 | Th17 cell differentiation | 14 | 101 | 1.62 | 4.40 × 10⁻¹⁷ |
| hsa05162 | Measles | 15 | 138 | 1.51 | 5.89 × 10⁻¹⁷ |
| hsa04010 | MAPK signaling pathway | 18 | 288 | 1.27 | 1.41 × 10⁻¹⁶ |
| hsa04061 | Viral protein interaction with cytokine and cytokine receptor | 22 | 96 | 1.84 | 2.86 × 10⁻³¹ |
| Term ID Cluster 2 | Kegg Pathways | Observed | Background | Strength | FDR |
| hsa04015 | Rap1 signaling pathway | 9 | 202 | 1.76 | 2.63 × 10⁻¹² |
| hsa04014 | Ras signaling pathway | 9 | 226 | 1.72 | 3.50 × 10⁻¹² |
| hsa04010 | MAPK signaling pathway | 9 | 288 | 1.61 | 1.95 × 10⁻¹¹ |
| hsa05205 | Proteoglycans in cancer | 8 | 196 | 1.73 | 6.14 × 10⁻¹¹ |
| hsa04151 | −Akt signaling pathway | 9 | 350 | 1.53 | 6.47 × 10⁻¹¹ |
| hsa01521 | EGFR tyrosine kinase inhibitor resistance | 6 | 78 | 2 | 1.41 × 10−09 |
| hsa05200 | Pathways in cancer | 8 | 517 | 1.31 | 6.63 × 10−08 |
| hsa05418 | Fluid shear stress and atherosclerosis | 5 | 130 | 1.7 | 1.73 × 10−06 |
| hsa05230 | Central carbon metabolism in cancer | 4 | 69 | 1.88 | 8.78 × 10−06 |
| hsa04510 | Focal adhesion | 5 | 198 | 1.52 | 1.06 × 10−05 |
| hsa04810 | Regulation of actin cytoskeleton | 5 | 209 | 1.49 | 1.25 × 10−05 |
| Term ID Cluster 2 | GO Biological Processes | Observed | Background | Strength | FDR |
| GO:0001525 | Angiogenesis | 12 | 315 | 1.7 | 2.15 × 10⁻¹⁵ |
| GO:0001936 | Regulation of endothelial cell proliferation | 9 | 134 | 1.94 | 4.05 × 10⁻¹³ |
| GO:0001938 | Positive regulation of endothelial cell proliferation | 8 | 94 | 2.05 | 3.65 × 10⁻¹² |
| GO:0010595 | Positive regulation of endothelial cell migration | 8 | 103 | 2.01 | 6.16 × 10⁻¹² |
| GO:0050679 | Positive regulation of epithelial cell proliferation | 9 | 192 | 1.79 | 6.16 × 10⁻¹² |
| GO:0007169 | Transmembrane receptor protein tyrosine kinase signaling pathway | 11 | 518 | 1.44 | 6.18 × 10⁻¹² |
| GO:0050678 | Regulation of epithelial cell proliferation | 10 | 339 | 1.59 | 7.25 × 10⁻¹² |
| GO:0038084 | Vascular endothelial growth factor signaling pathway | 6 | 20 | 2.59 | 1.25 × 10⁻¹¹ |
| GO:0008284 | Positive regulation of cell population proliferation | 12 | 919 | 1.23 | 3.76 × 10⁻¹¹ |
| GO:0071363 | Cellular response to growth factor stimulus | 10 | 494 | 1.42 | 1.75 × 10⁻¹⁰ |
| MCODE Components | ID | Annotations | Log10 (p) Value |
|---|---|---|---|
| All DEPs, MCODE1 | Hsa 04060 | Cytokine-cytokine interaction | −55.7 |
| GO:0071345 | Cytokine-mediated signaling pathway | −50.7 | |
| GO:0071345 | Cellular response to cytokine stimulus | −42.8 | |
| All DEPs, MCODE2 | CORUM:5531 | Tumor necrosis factor receptor 1 signaling complex | −11.0 |
| Hsa 04010 | MAPK signaling pathway | −10.0 | |
| CORUM:6347 | TNF-R1 signaling complex | −9.6 | |
| DEPs cluster 2, MCODE1 | GO:0071363 | Cellular response to growth factor stimulus | −39.8 |
| GO:0070848 | Response to growth factor | −39.1 | |
| GO:0007167 | Enzyme-linked receptor protein signaling pathway | −36.7 | |
| DEPs cluster 2, MCODE2 | GO:0001666 | Response to hypoxia | −11.8 |
| GO:0036293 | Response to decreased oxygen levels | −11.7 | |
| GO:0071456 | Cellular response to hypoxia | −11.6 |
| Term ID all DEPs | DOID Annotations | Size | Overlap | Enrichment | FDR |
|---|---|---|---|---|---|
| DOID:0060032 | Autoimmune disease of musculoskeletal system | 645 | 91/342 | 8.25 | 1.4 × 10−57 |
| DOID:848 | Arthritis | 481 | 79/342 | 9.60 | 7.9 × 10−55 |
| DOID: 3342 | Bone inflammation disease | 501 | 80/342 | 9.34 | 1.5 × 10−54 |
| DOID:2914 | Immune system disease | 1.9 k | 139/342 | 4.28 | 4.5 × 10−54 |
| DOID:0050589 | Inflammatory bowel disease | 306 | 66/342 | 12.61 | 1.3 × 10−53 |
| DOID:7148 | Rheumatoid arthritis | 313 | 65/342 | 12.14 | 1.1 × 10−51 |
| DOID:612 | Primary immunodeficiency disease | 1.3 k | 115/342 | 5.06 | 7.4 × 10−51 |
| DOID:417 | Autoimmune disease | 1.1 k | 104/342 | 5.70 | 1.9 × 10−50 |
| DOID:65 | Connective tissue disease | 1.8 k | 128/342 | 4.06 | 1.6 × 10−46 |
| DOID:8893 | Psoriasis | 189 | 50/342 | 15.47 | 2.5 × 10−45 |
| Term ID all DEPs | Custom Term Annotations | Size | Overlap | Enrichment | FDR p |
| DOID: 3213 | Demyelinating disease | 218 | 42/342 | 11.27 | 5.8 × 10⁻³² |
| DOID:1936 | Atherosclerosis | 352 | 34/342 | 5.65 | 3.1 × 10⁻¹⁶ |
| DOID: 936 | Brain Disease | 1.5 k | 59/342 | 2.29 | 1.5 × 10⁻⁹ |
| WP 1455 | Serotonin transported activity | 11 | 3/342 | 15.95 | 7.4 × 10⁻⁴ |
| GO:1901215 | Negative regulation of neuron death | 65 | 5/342 | 4.50 | 5.1 × 10⁻³ |
| GO:1903978 | Regulation of microglial cell activation | 6 | 2/342 | 19.49 | 4.2 × 10⁻³ |
Publisher’s Note: MDPI stays neutral with regard to jurisdictional claims in published maps and institutional affiliations. |
© 2022 by the authors. Licensee MDPI, Basel, Switzerland. This article is an open access article distributed under the terms and conditions of the Creative Commons Attribution (CC BY) license (https://creativecommons.org/licenses/by/4.0/).
Share and Cite
Maes, M.; Rachayon, M.; Jirakran, K.; Sodsai, P.; Klinchanhom, S.; Debnath, M.; Basta-Kaim, A.; Kubera, M.; Almulla, A.F.; Sughondhabirom, A. Adverse Childhood Experiences Predict the Phenome of Affective Disorders and These Effects Are Mediated by Staging, Neuroimmunotoxic and Growth Factor Profiles. Cells 2022, 11, 1564. https://doi.org/10.3390/cells11091564
Maes M, Rachayon M, Jirakran K, Sodsai P, Klinchanhom S, Debnath M, Basta-Kaim A, Kubera M, Almulla AF, Sughondhabirom A. Adverse Childhood Experiences Predict the Phenome of Affective Disorders and These Effects Are Mediated by Staging, Neuroimmunotoxic and Growth Factor Profiles. Cells. 2022; 11(9):1564. https://doi.org/10.3390/cells11091564
Chicago/Turabian StyleMaes, Michael, Muanpetch Rachayon, Ketsupar Jirakran, Pimpayao Sodsai, Siriwan Klinchanhom, Monojit Debnath, Agnieska Basta-Kaim, Marta Kubera, Abbas F. Almulla, and Atapol Sughondhabirom. 2022. "Adverse Childhood Experiences Predict the Phenome of Affective Disorders and These Effects Are Mediated by Staging, Neuroimmunotoxic and Growth Factor Profiles" Cells 11, no. 9: 1564. https://doi.org/10.3390/cells11091564