
Glycogen Storage Disease Phenotypes Accompanying the Perturbation of the Methionine Cycle in NDRG3-Deficient Mouse Livers

 , , , , , , and
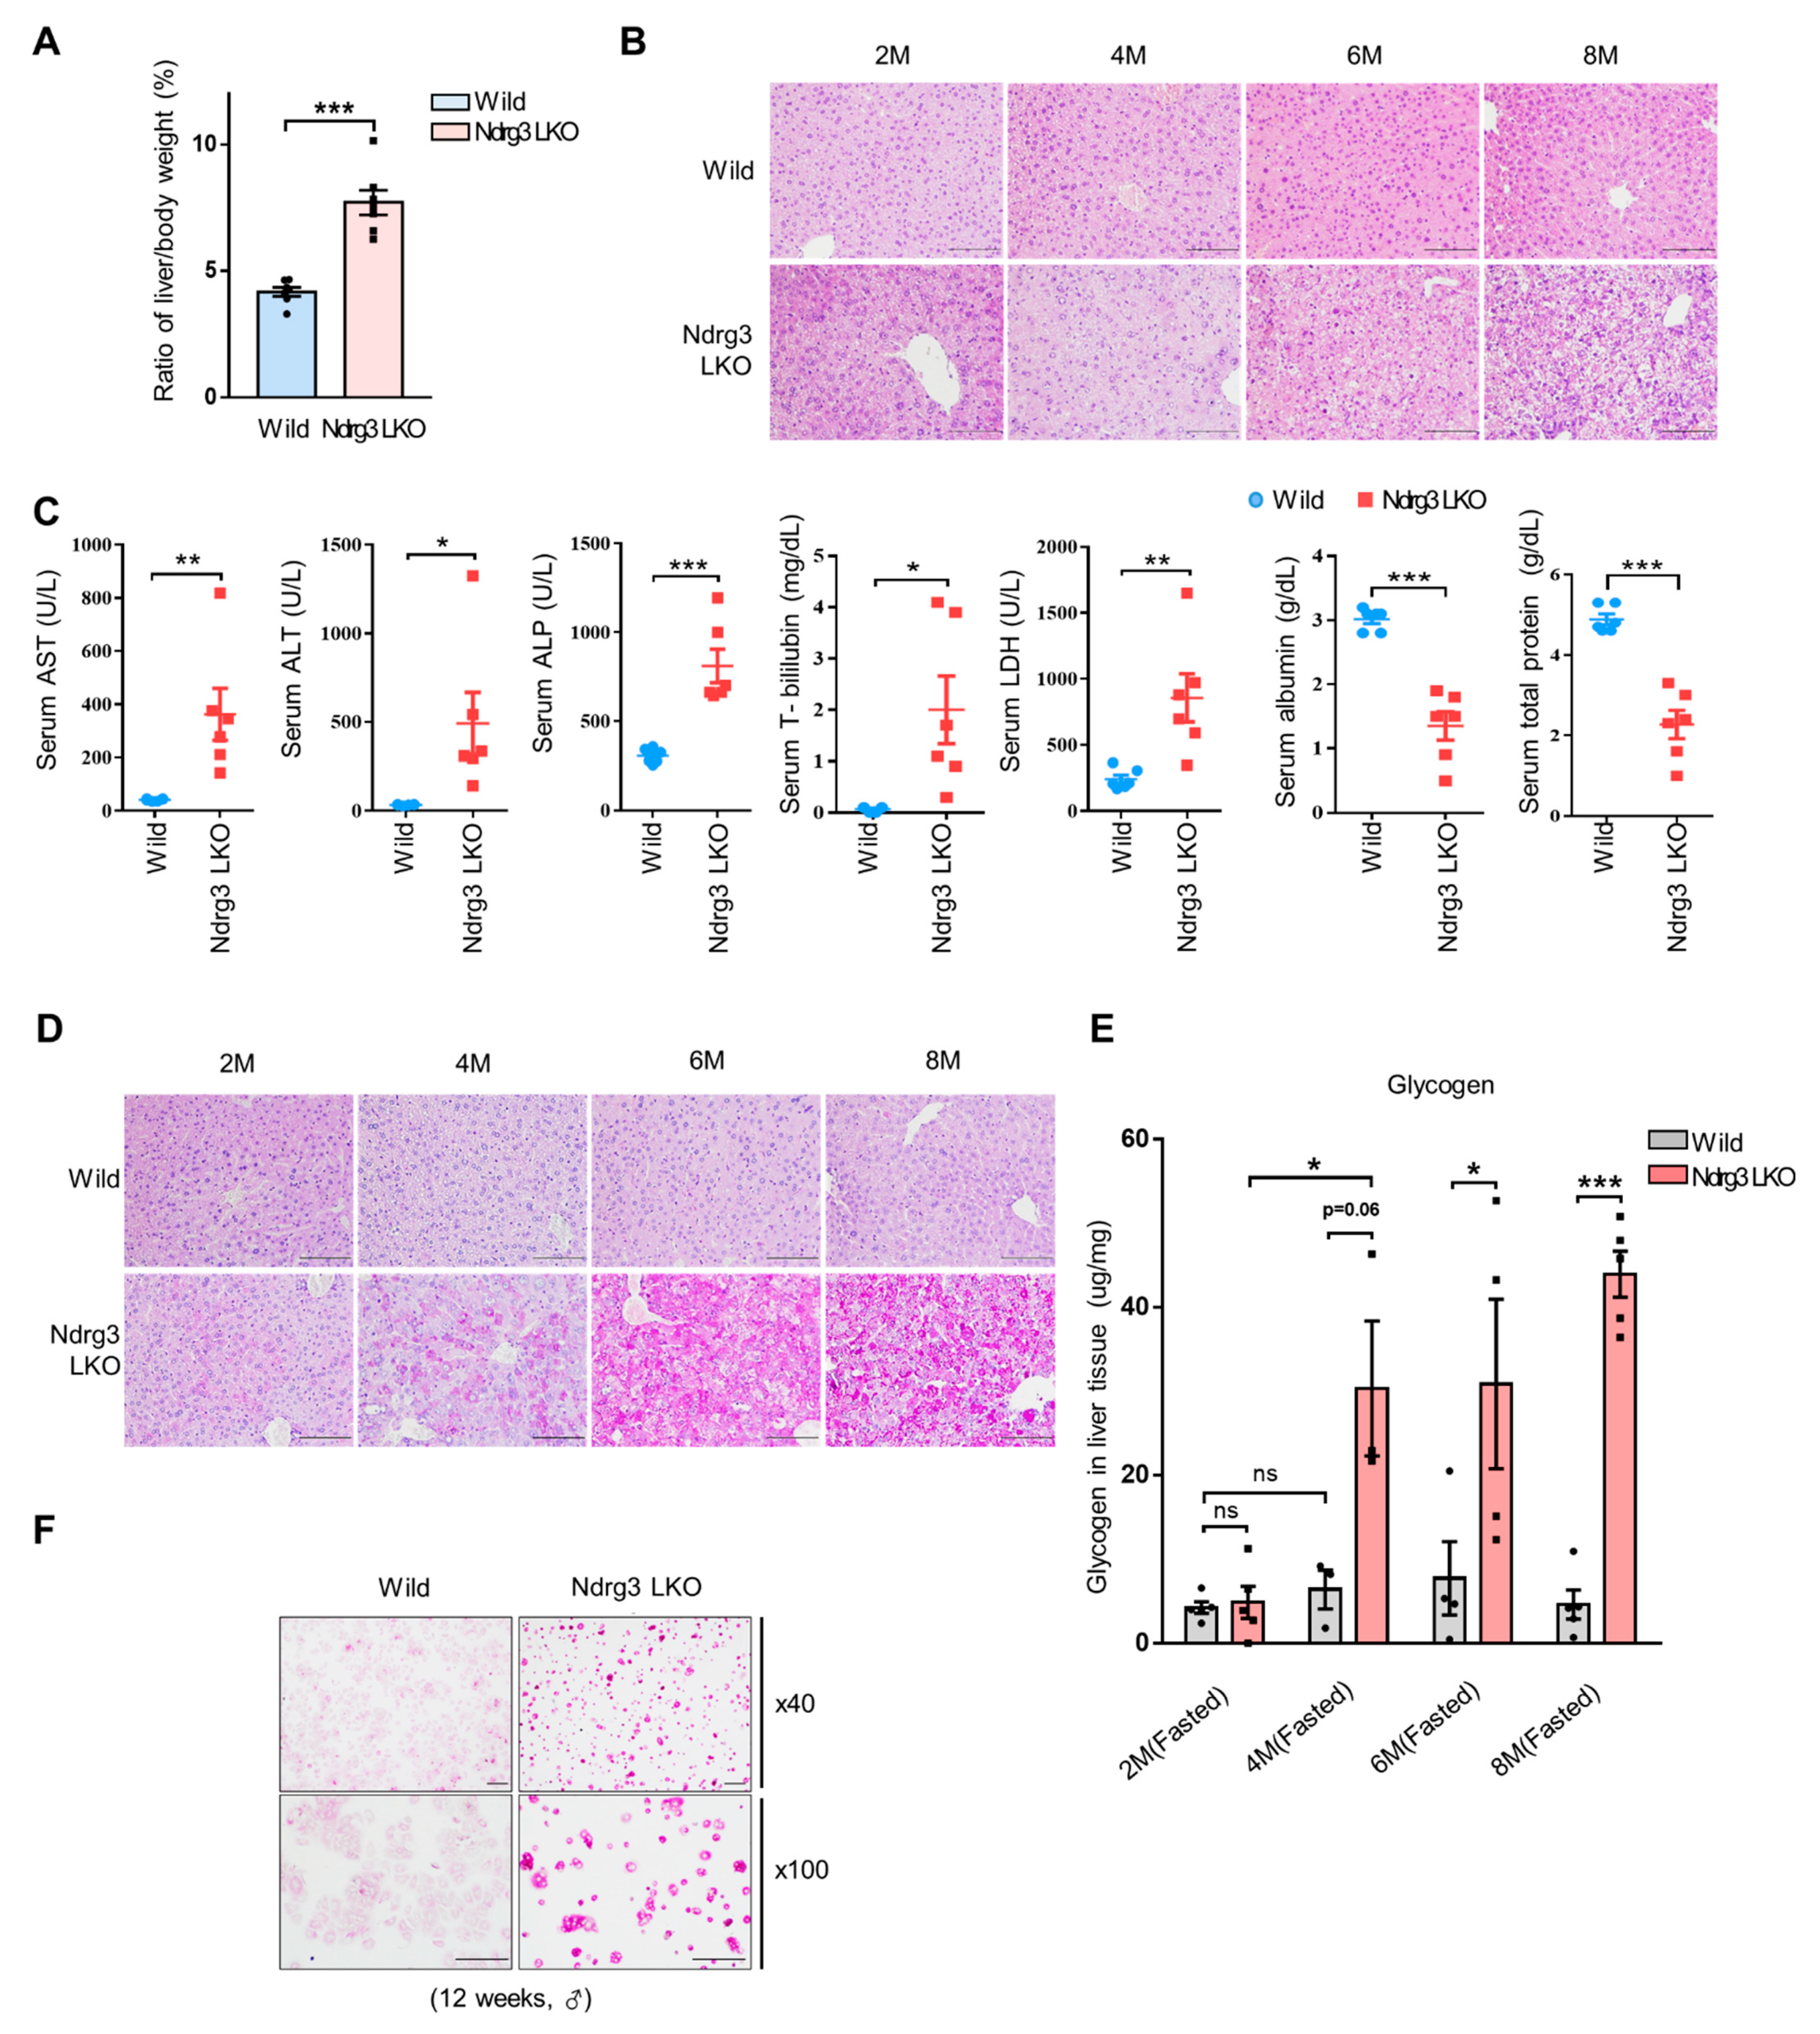
Abstract
:1. Introduction
2. Materials and Methods
2.1. Animals
2.2. Generation of Liver-Specific Conditional Ndrg3 Knockout (Ndrg3 LKO) Mouse
2.3. Glucose Tolerance Test (GTT)
2.4. Isolation of Primary Hepatocytes and Examination of Insulin/Glucagon Signaling
2.5. Liver Histology
2.6. Periodic Acid Schiff (PAS) Staining
2.7. Protein Analysis
2.8. Glycogen Measurement
2.9. Glucose Measurement
2.10. Glucose-6-Phosphate (G6P) Measurement
2.11. Glucose-1-Phosphate (G1P) Measurement
2.12. Glycogen Phosphorylase L (PYGL) Activity Measurement
2.13. Glycogen Synthase (GS) Activity Measurement
2.14. Real-Time RT-PCR
2.15. Metabolome Analysis
2.16. Blood Biochemistry
2.17. Triglyceride (TG) Measurement
2.18. RNA Sequencing
2.19. Statistical Analysis
3. Results
3.1. Liver-Specific Ablation of NDRG3 Results in Excessive Hepatic Glycogen Accumulation and Liver Injury
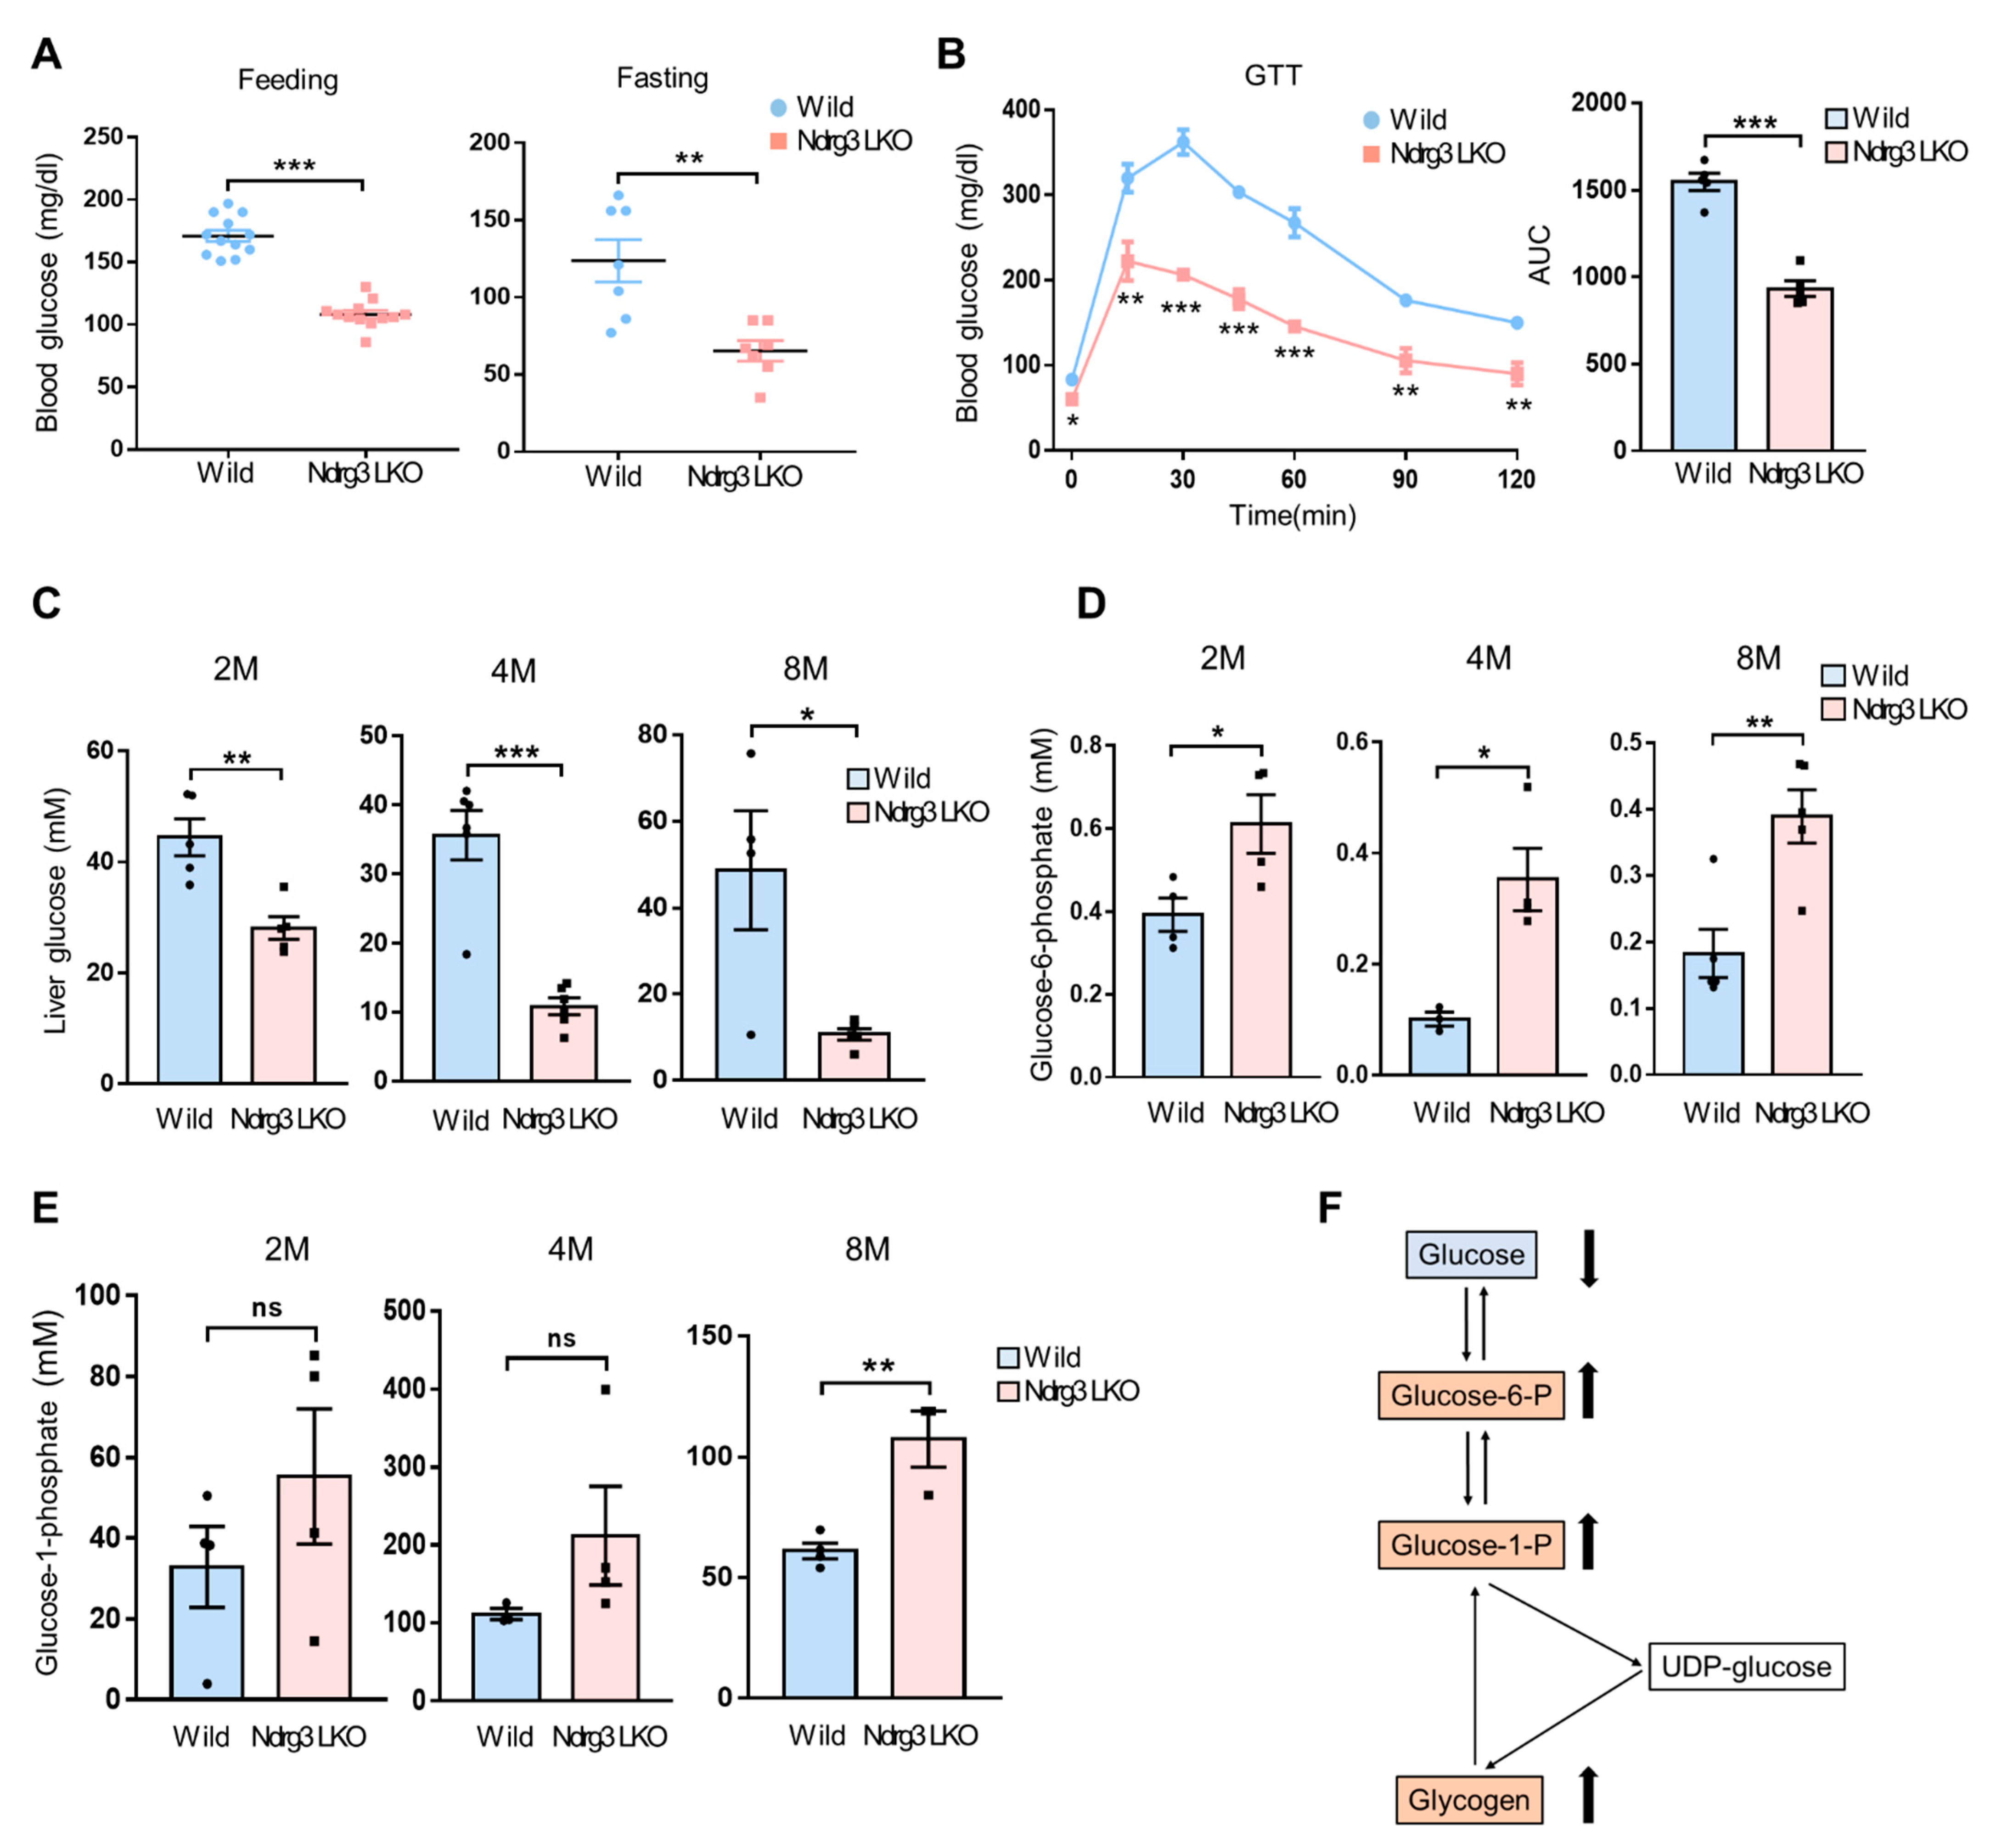
3.2. Liver-Specific NDRG3 Ablation Causes Impairment of Hepatic Glucose Homeostasis
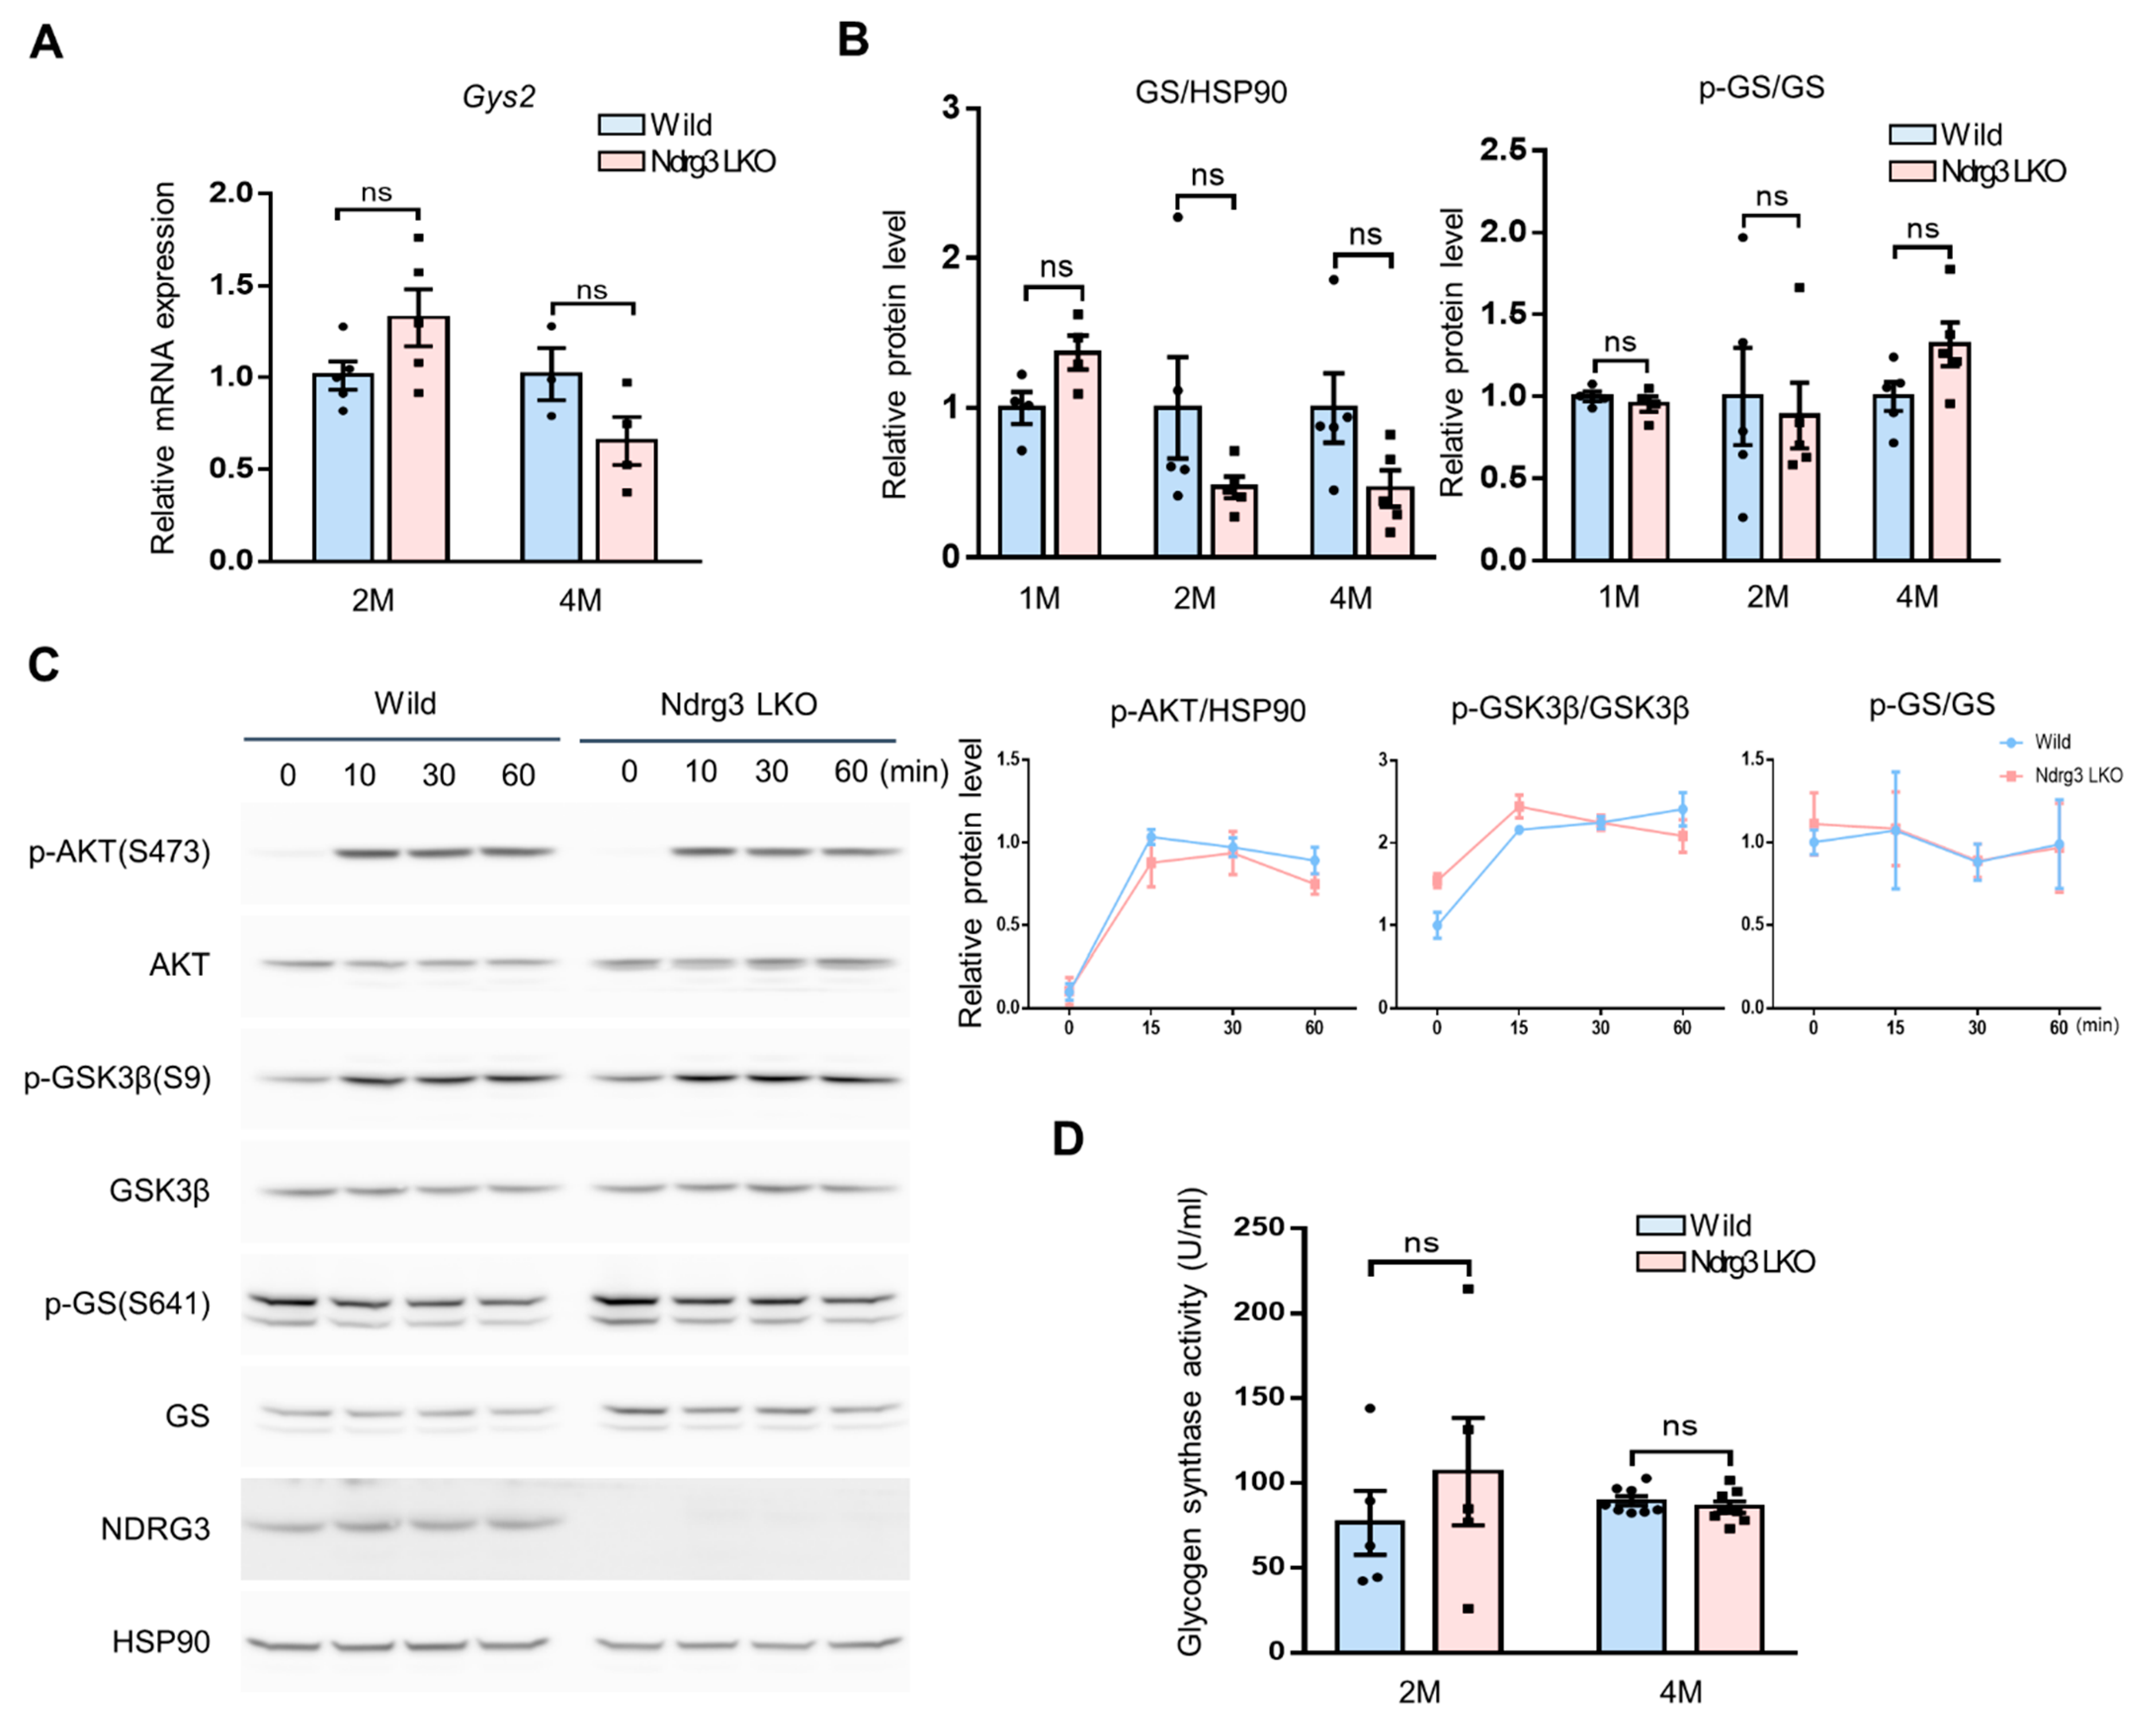
3.3. Glycogen Synthesis Is Not Hyper-Activated in Ndrg3 LKO Mice
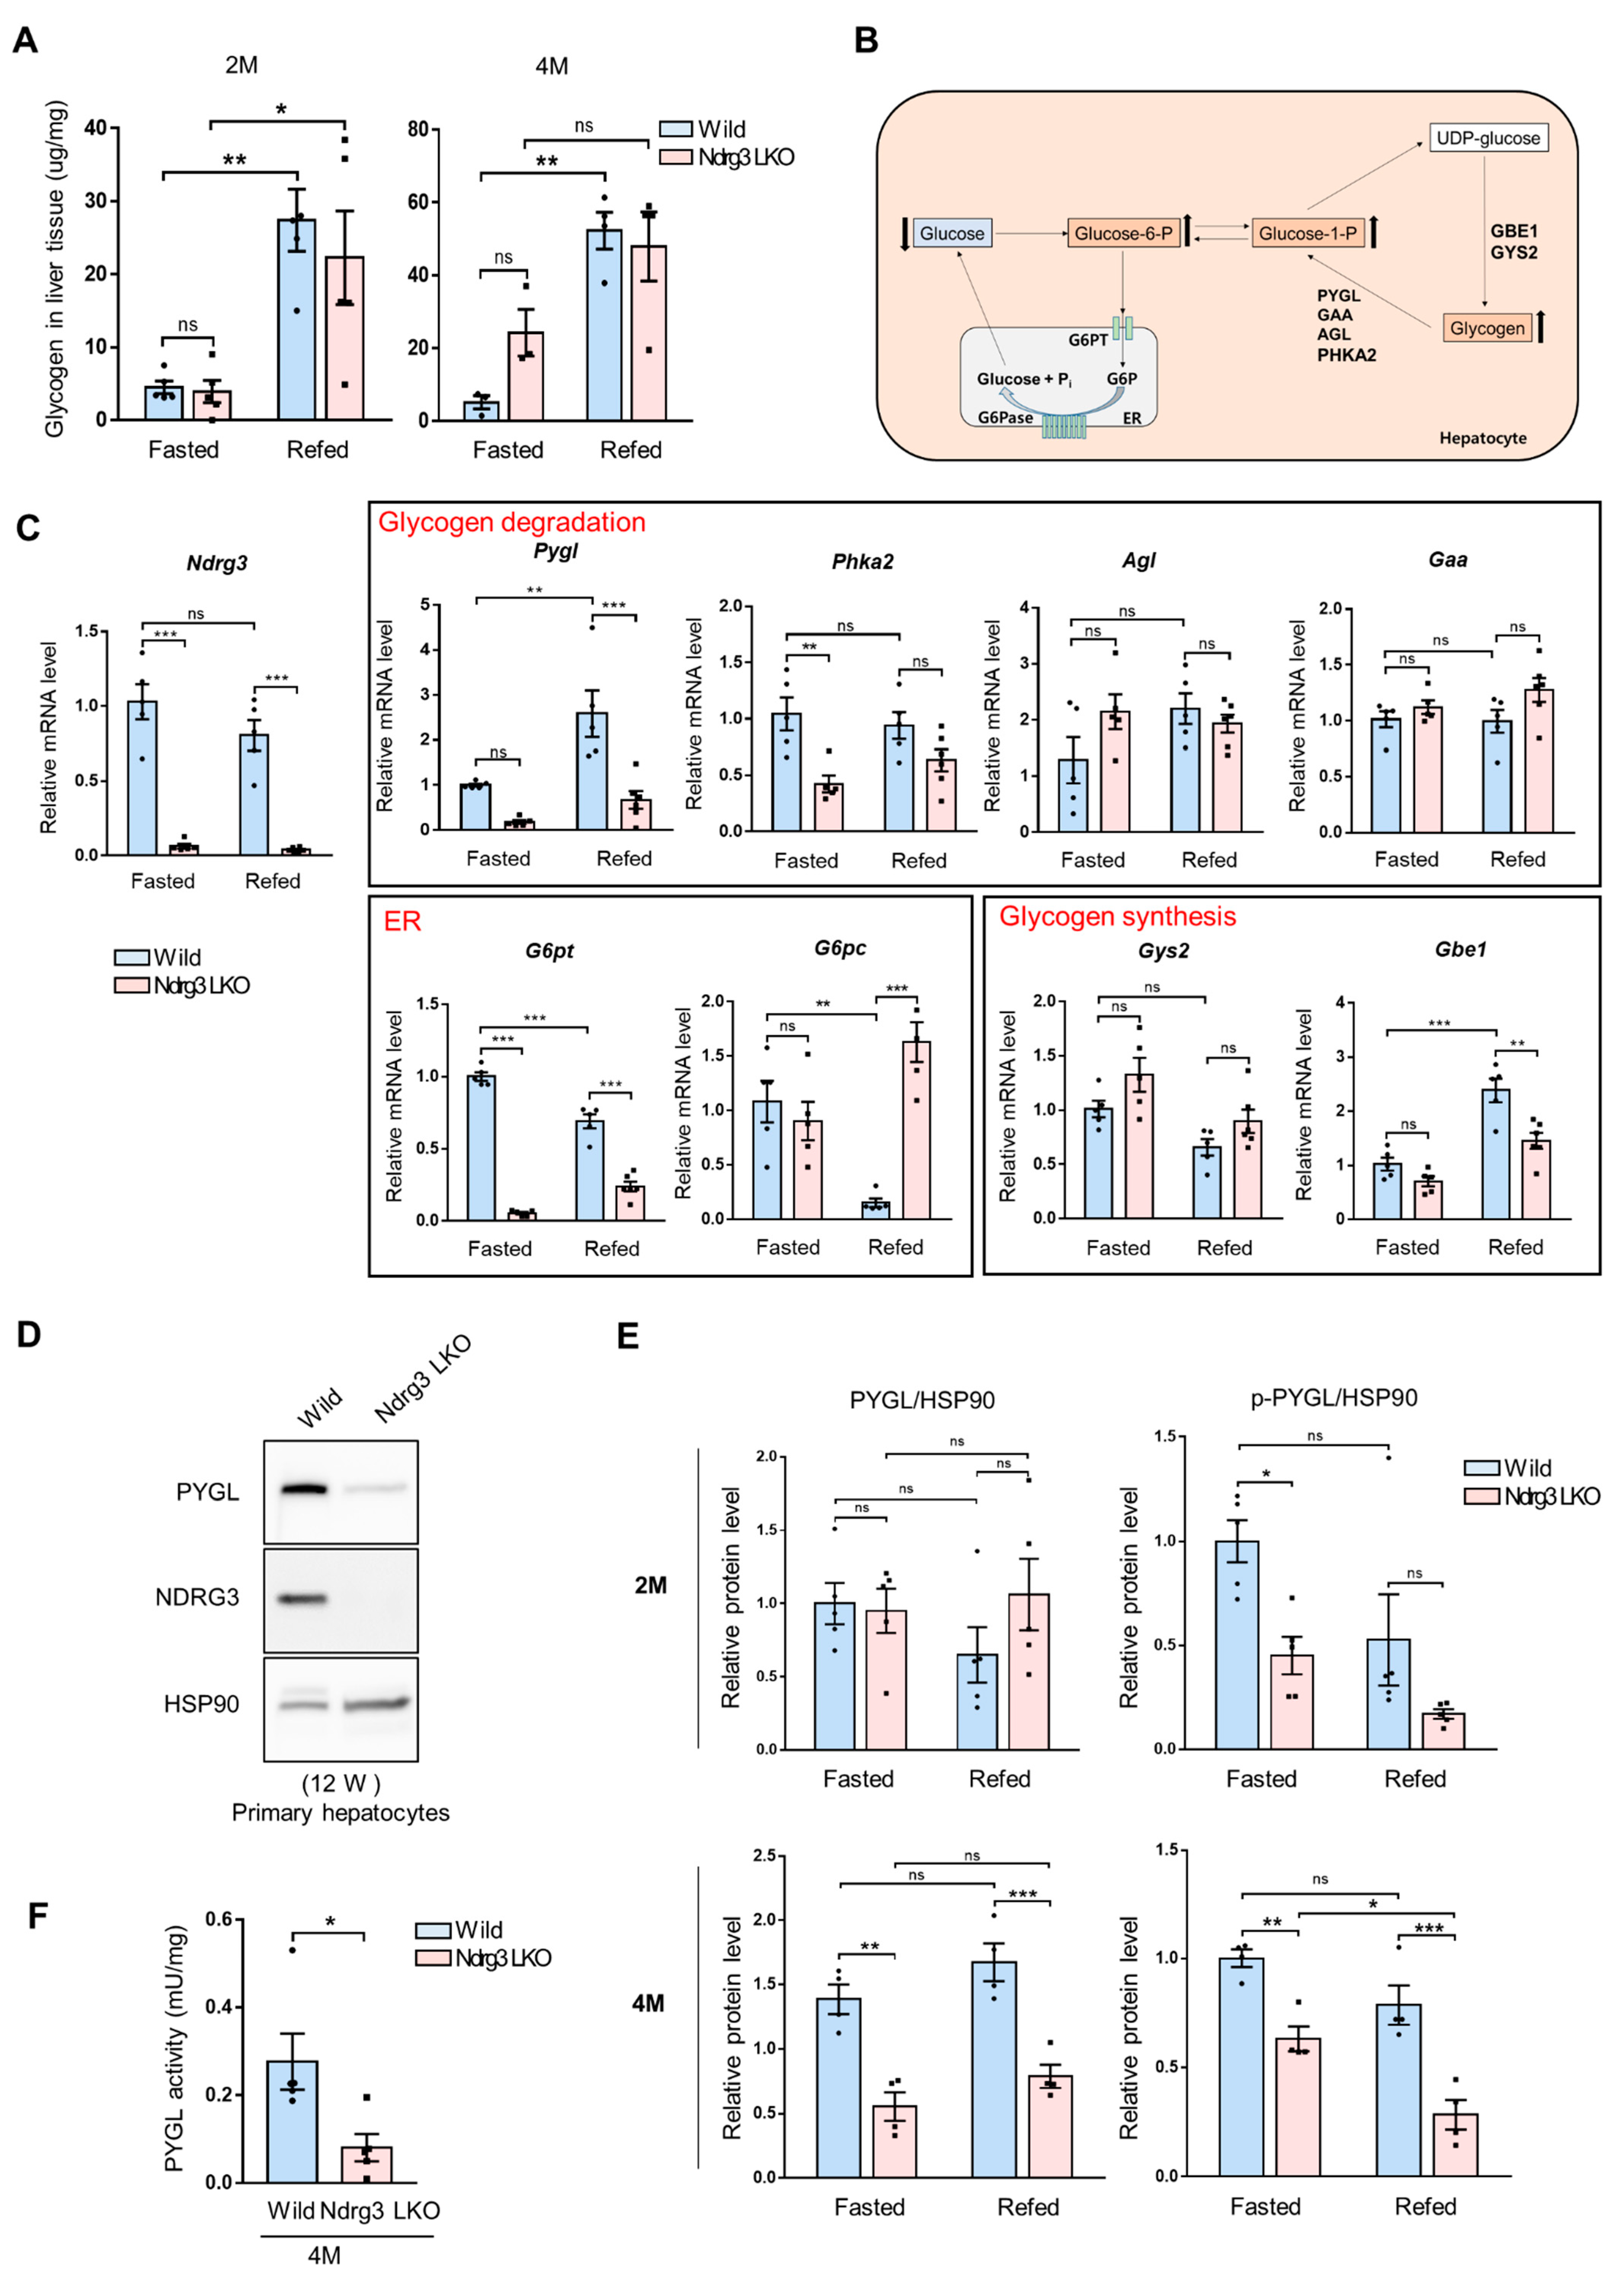
3.4. NDRG3 Abrogation in Liver Suppresses Glycogen Degradation Due to DownRegulation of PYGL and Glucose-6-Phosphate Transporter Member 4 (G6PT; SLC37A4) Expression
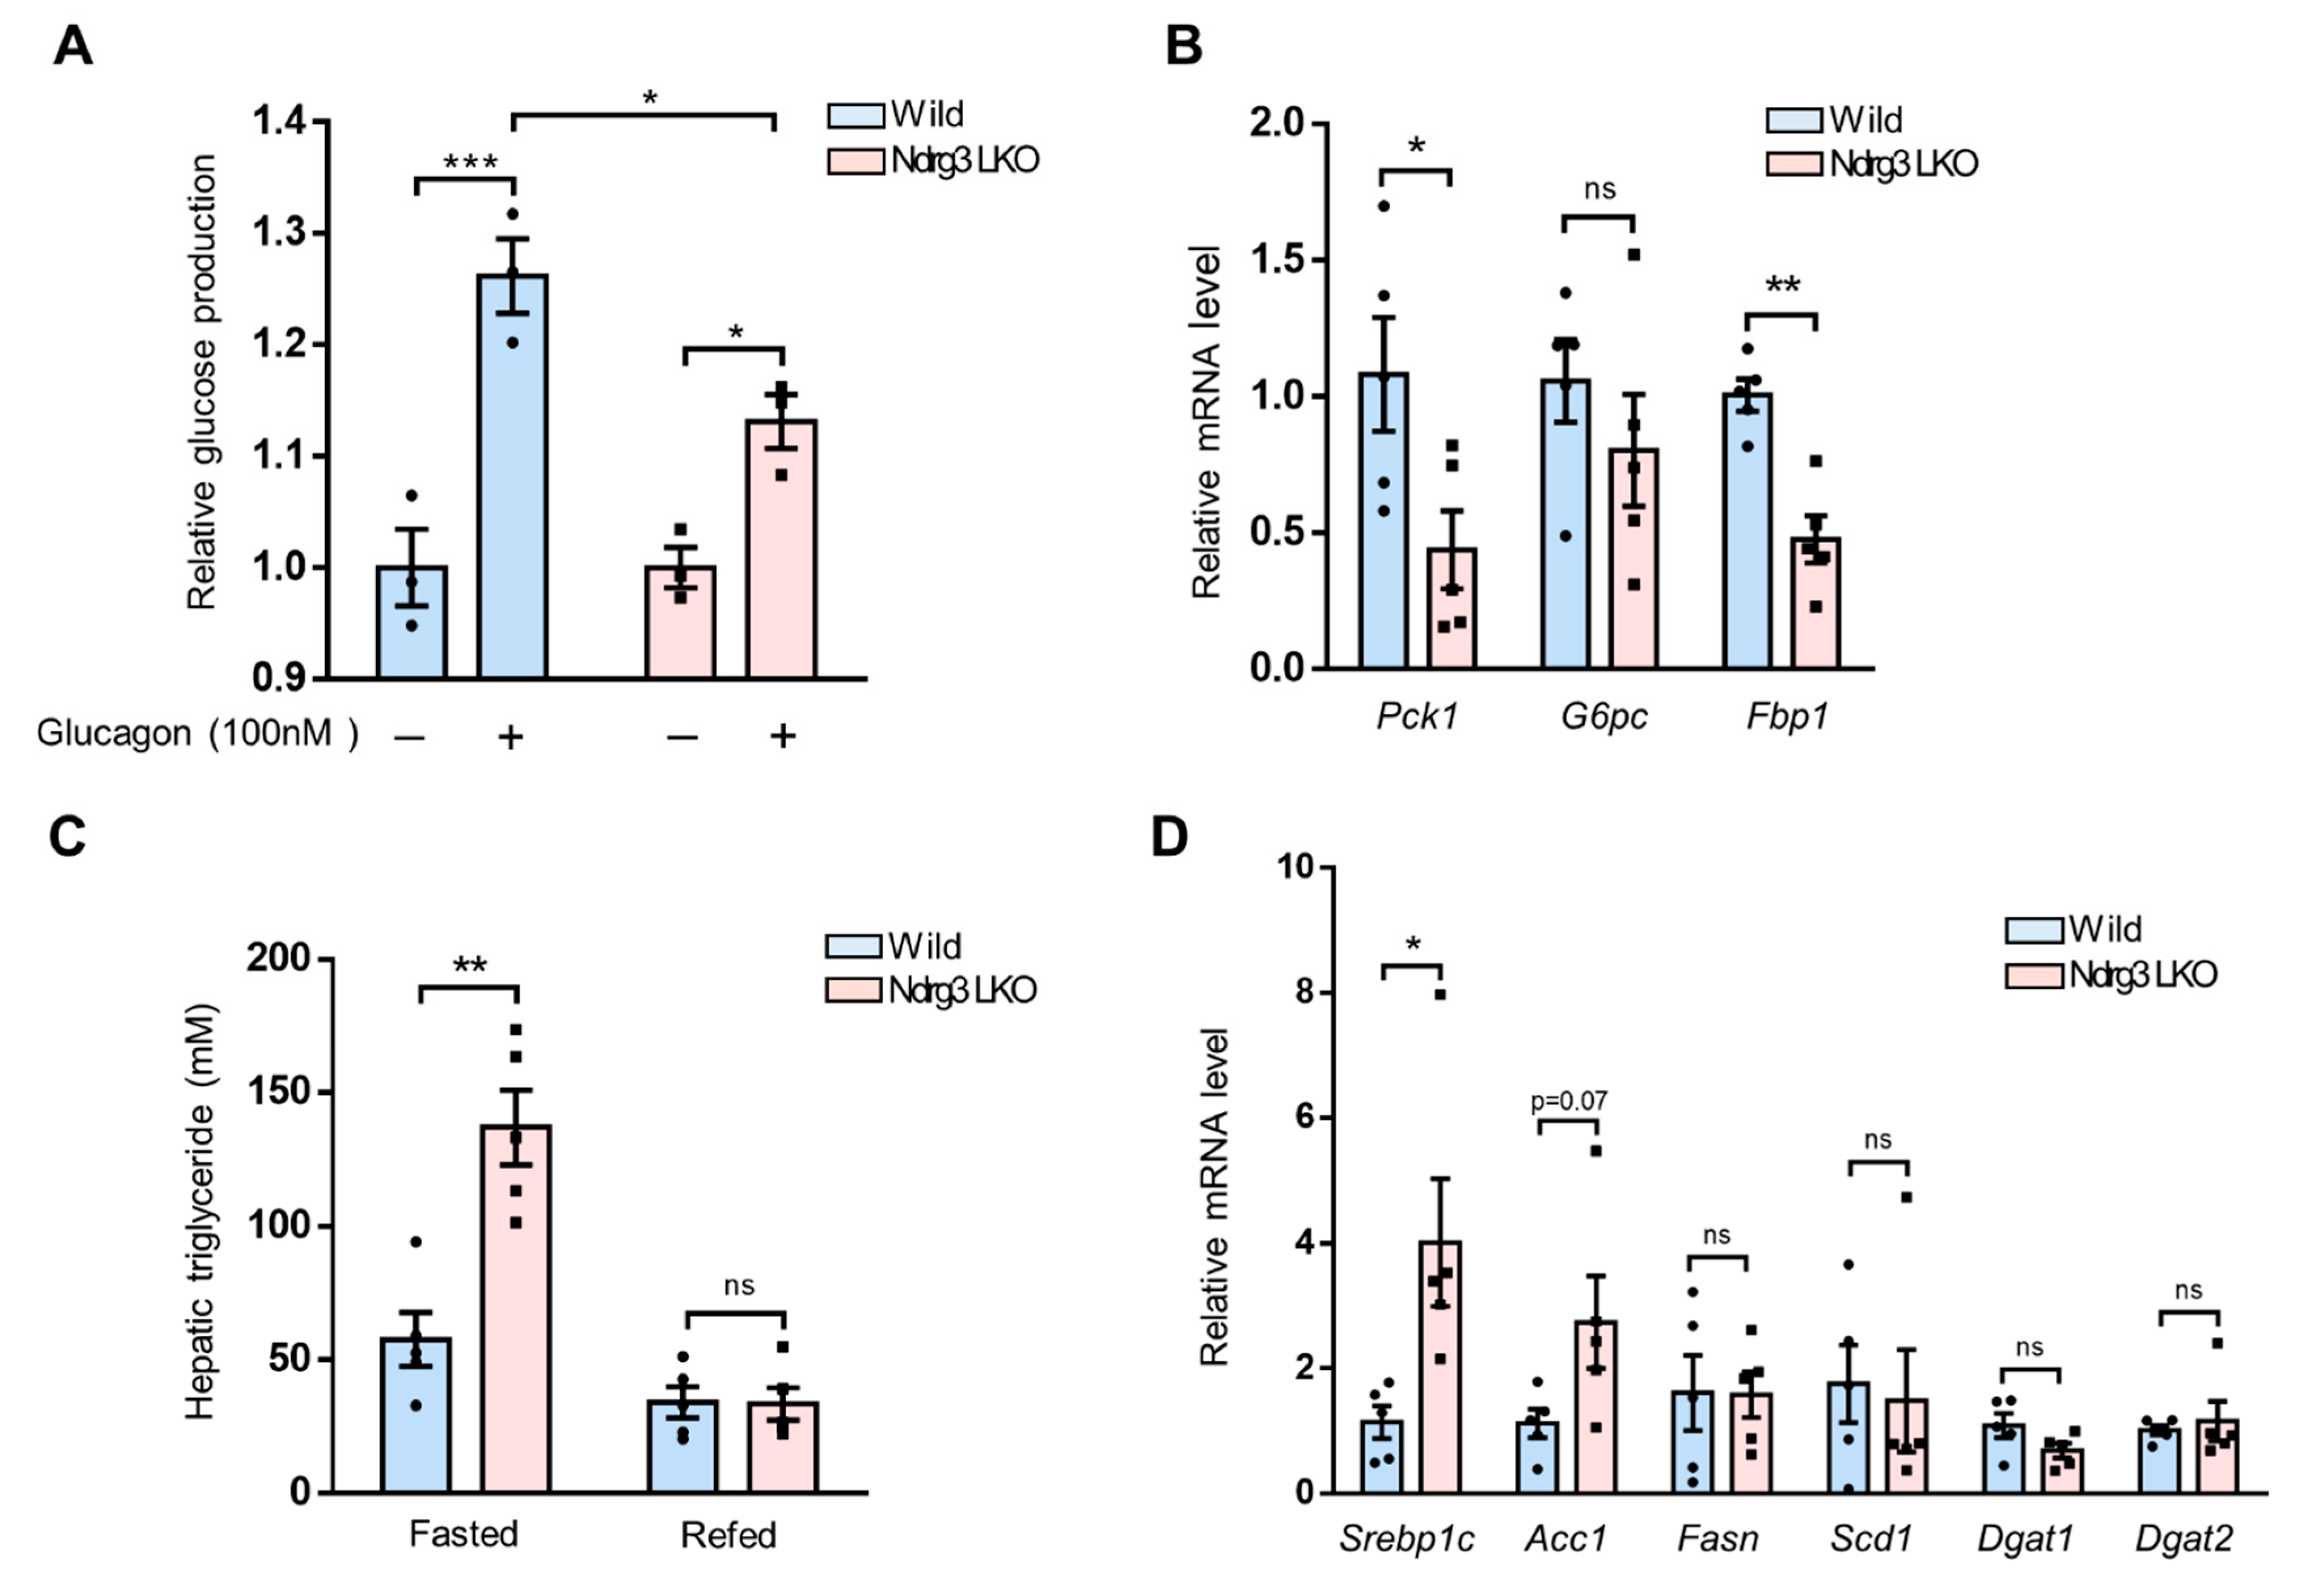
3.5. Liver-Specific Abrogation of NDRG3 Suppresses Hepatic Gluconeogenesis but Stimulates Liver Triglyceride Accumulation
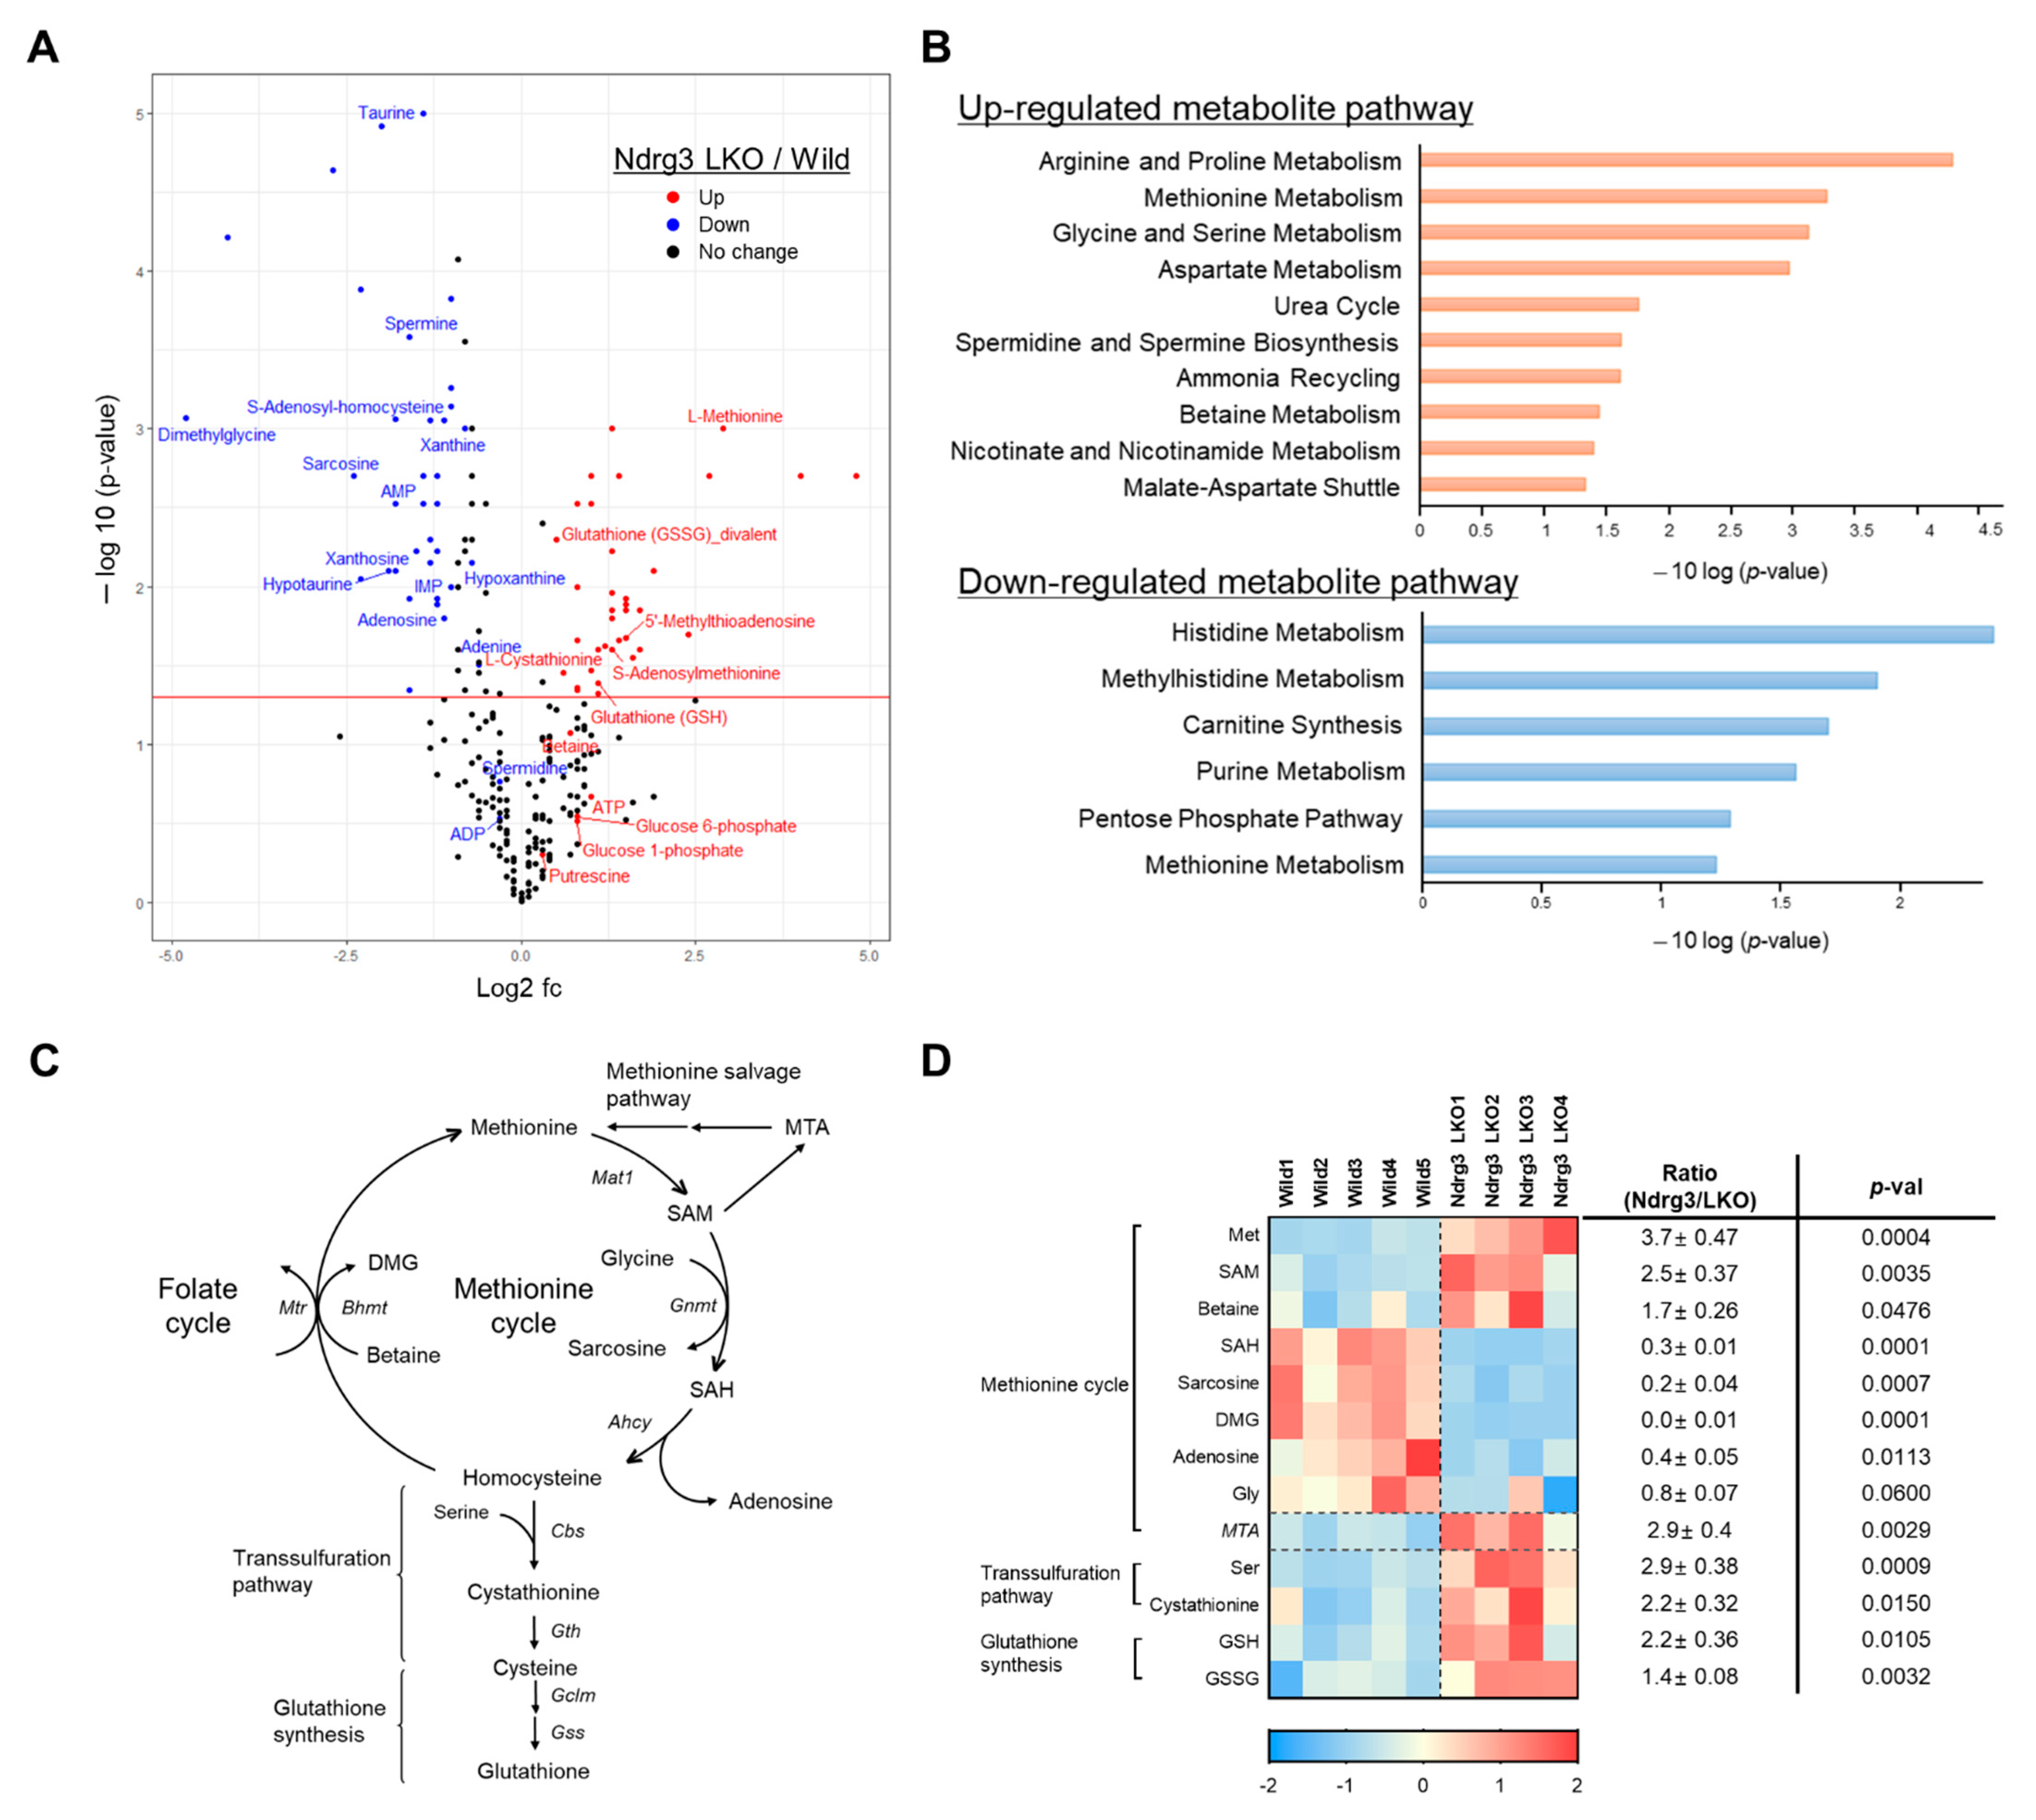
3.6. NDRG3 Depletion Perturbs Methionine Metabolism in Mouse Hepatocytes
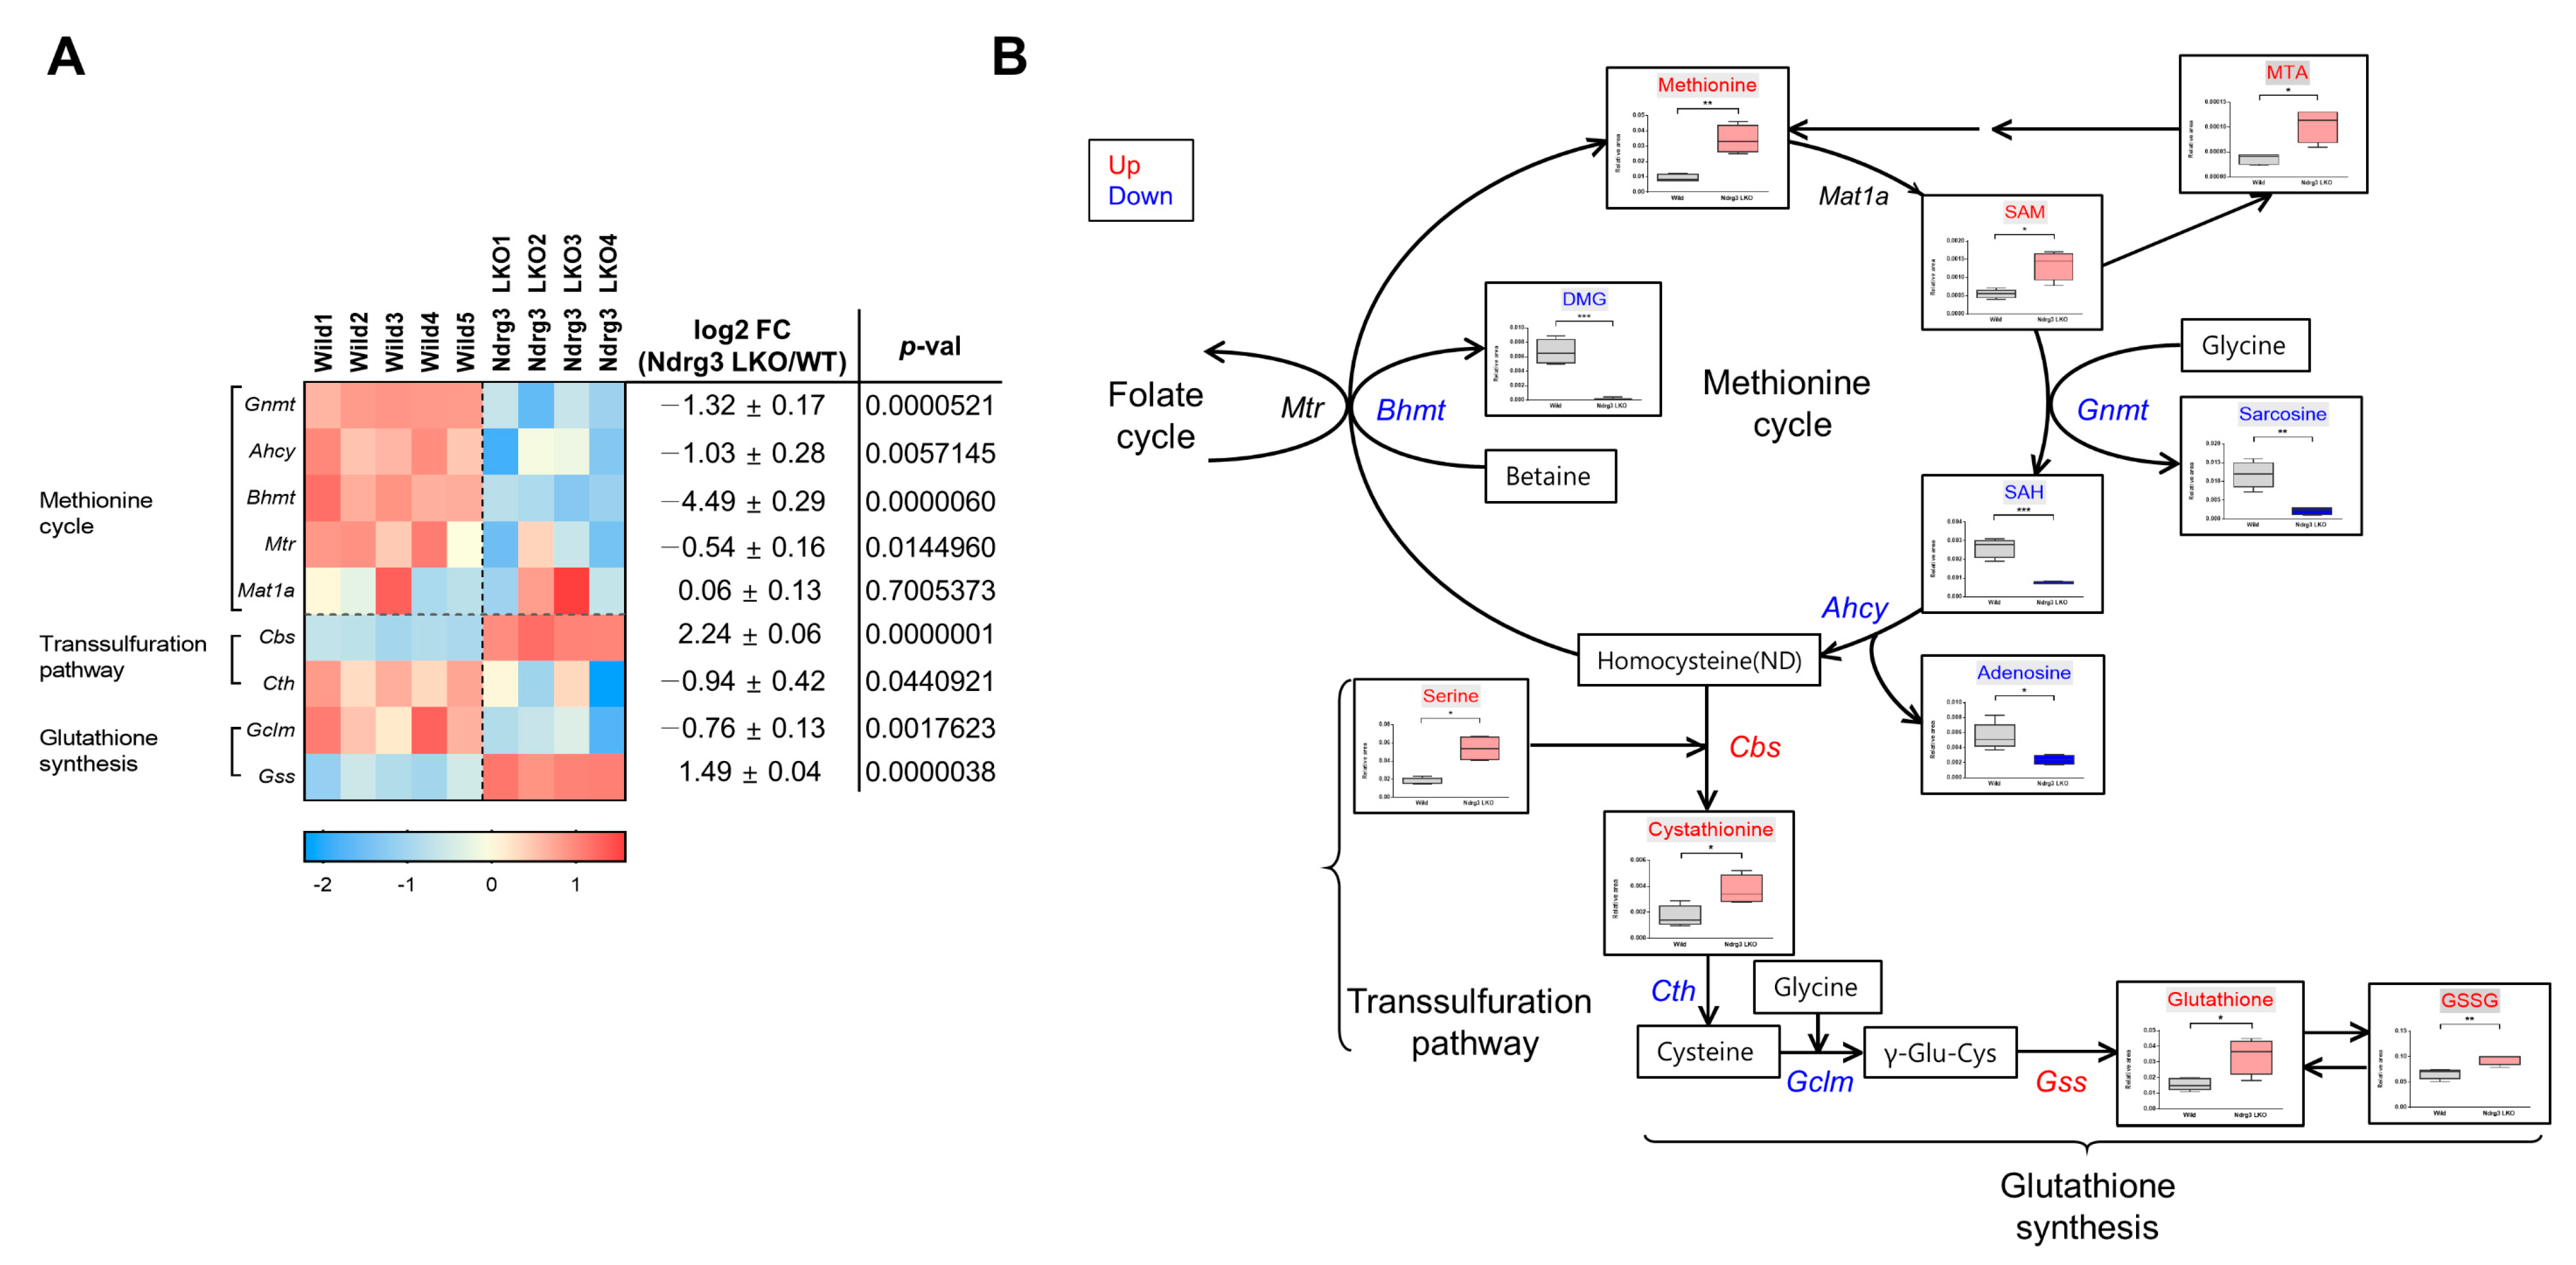
3.7. NDRG3 Depletion Causes Restructuring of the Methionine Cycle in Mouse Hepatocytes
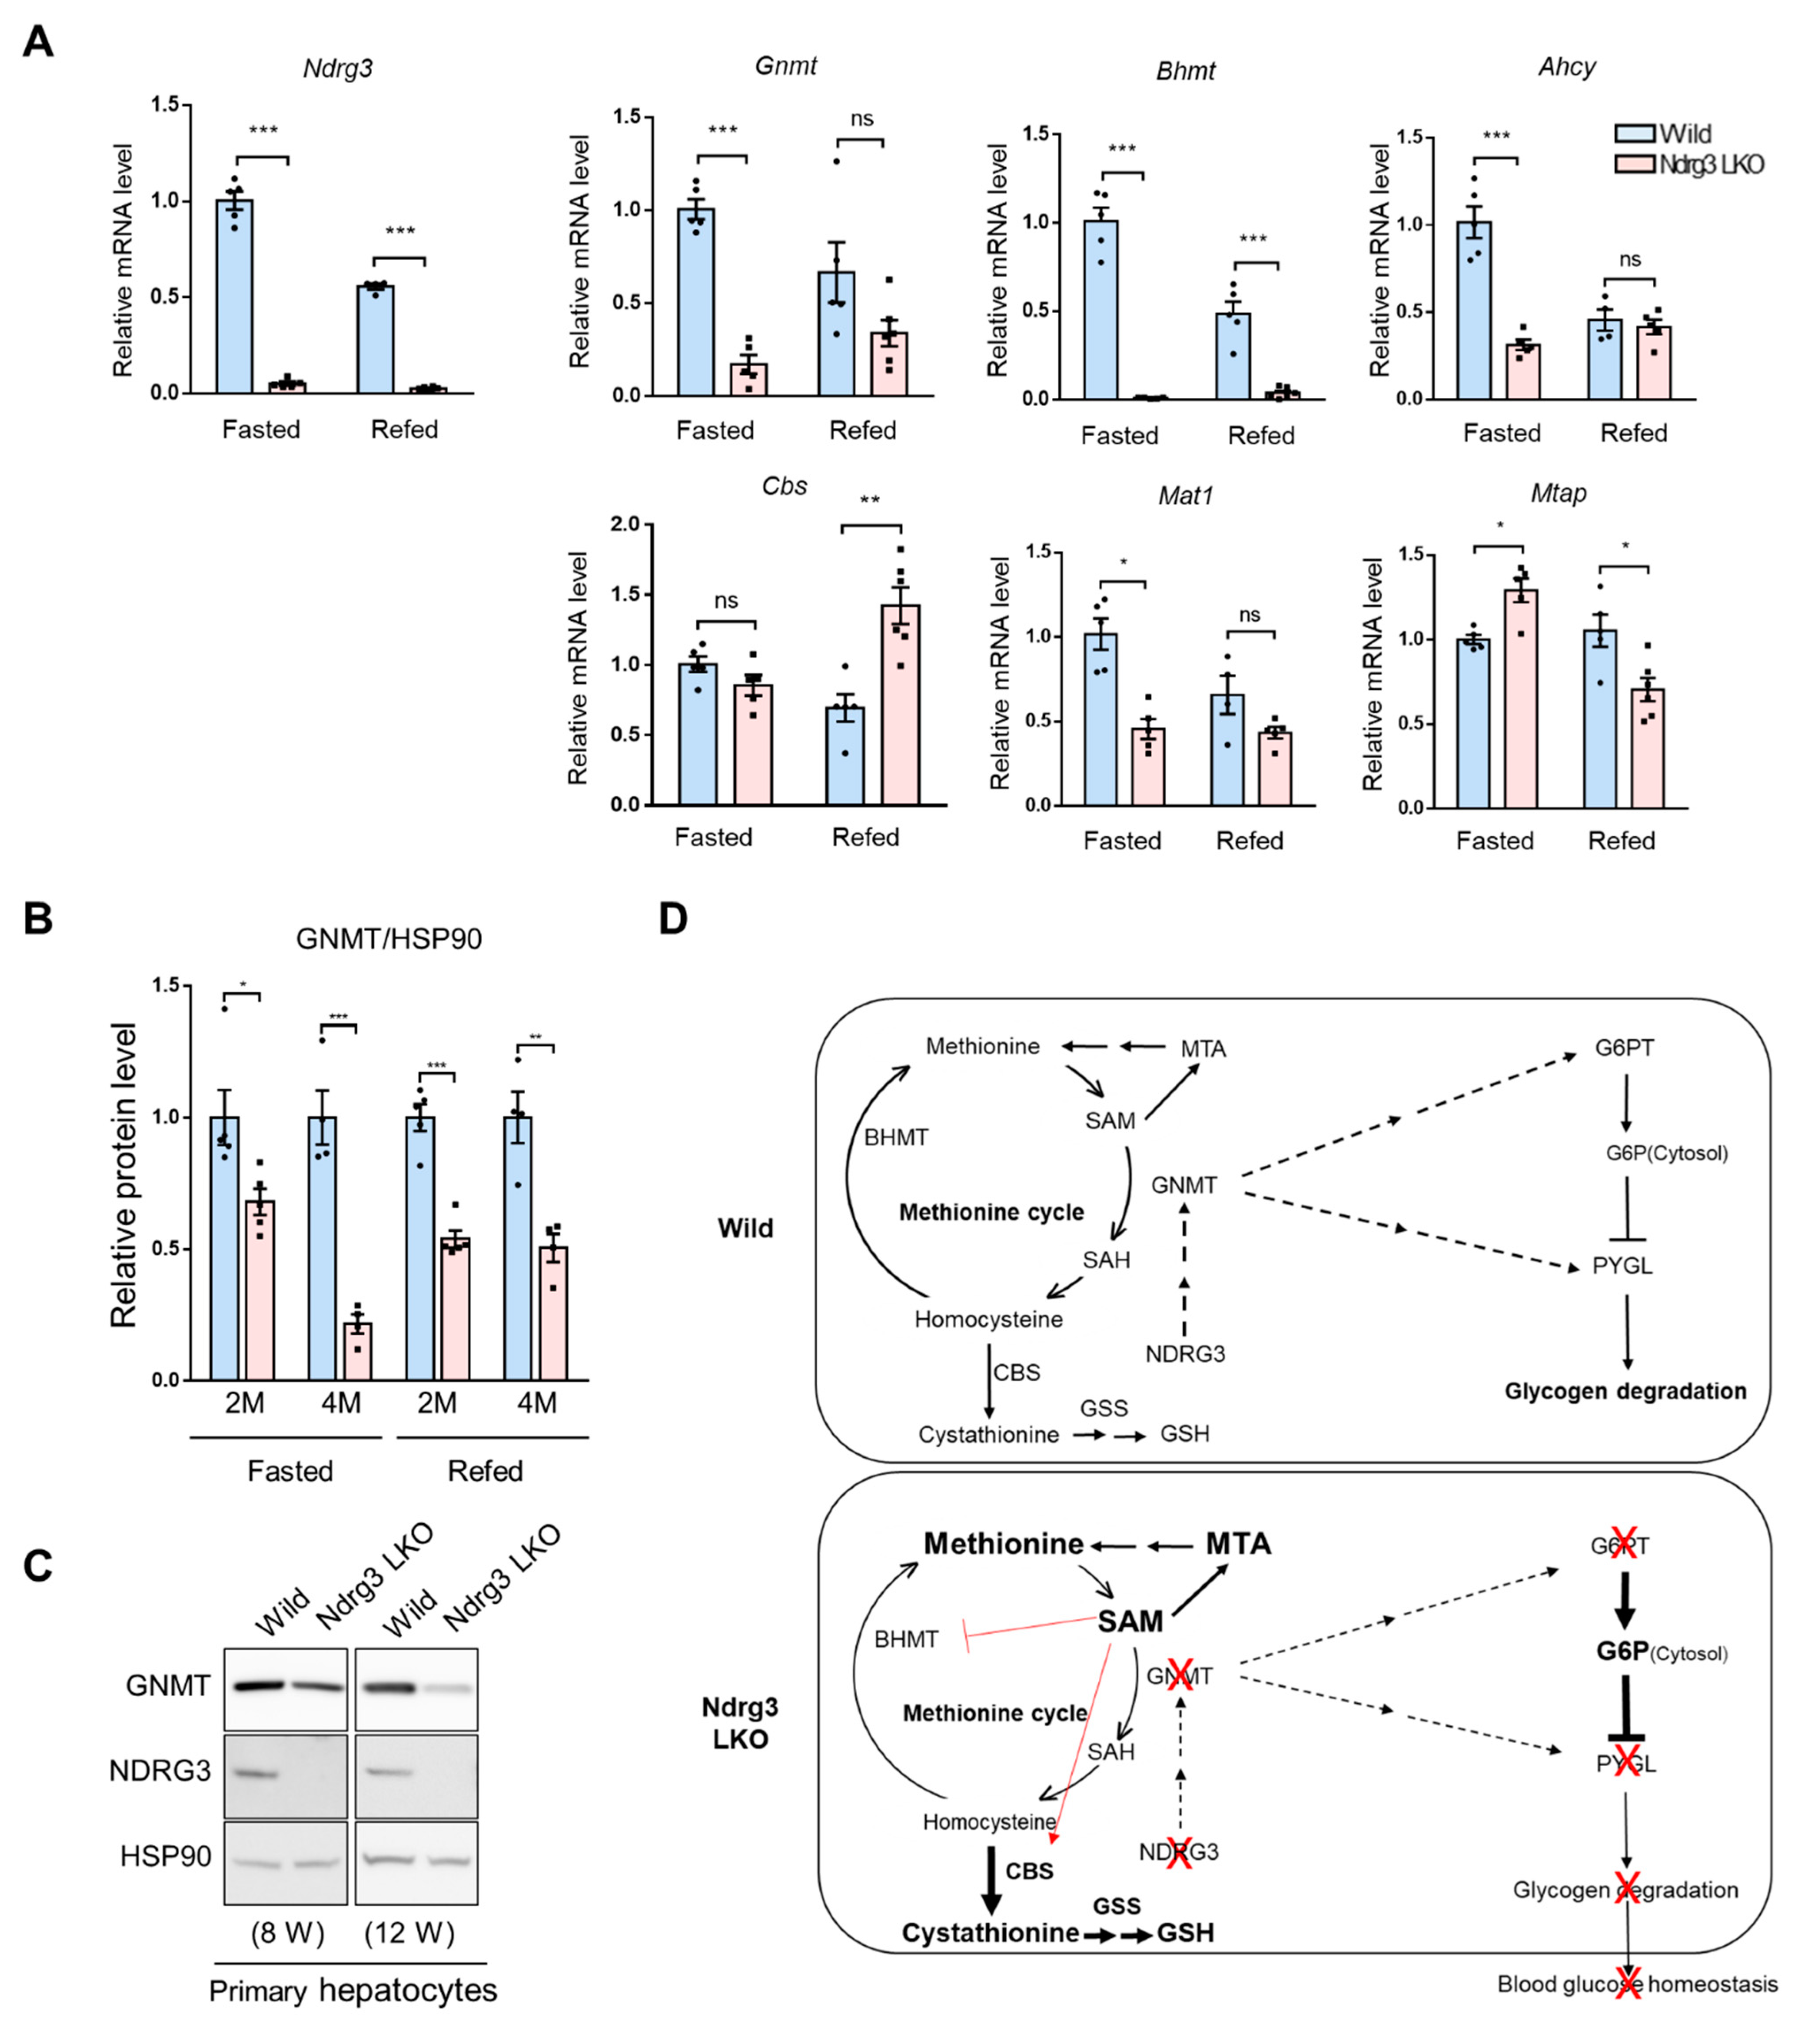
3.8. GNMT DownRegulation Is a Crucial Upstream Event in the Reprogramming of the Methionine Cycle in Ndrg3 LKO Livers
4. Discussion
5. Conclusions
Supplementary Materials
Author Contributions
Funding
Institutional Review Board Statement
Informed Consent Statement
Data Availability Statement
Acknowledgments
Conflicts of Interest
References
- Melotte, V.; Qu, X.; Ongenaert, M.; Van Criekinge, W.; de Bruïne, A.P.; Baldwin, H.S.; van Engeland, M. The N-myc downstream regulated gene (NDRG) family: Diverse functions, multiple applications. FASEB J. 2010, 24, 4153–4166. [Google Scholar] [CrossRef] [PubMed]
- Shaw, E.; McCue, L.A.; Lawrence, C.E.; Dordick, J.S. Identification of a novel class in the alpha/beta hydrolase fold superfamily: The N-myc differentiation-related proteins. Proteins 2002, 47, 163–168. [Google Scholar] [CrossRef] [PubMed]
- Marchot, P.; Chatonnet, A. Enzymatic activity and protein interactions in alpha/beta hydrolase fold proteins: Moonlighting versus promiscuity. Protein Pept Lett. 2012, 19, 132–143. [Google Scholar] [CrossRef] [PubMed]
- Lee, G.Y.; Chun, Y.S.; Shin, H.W.; Park, J.W. Potential role of the N-MYC downstream-regulated gene family in reprogramming cancer metabolism under hypoxia. Oncotarget 2016, 7, 57442–57451. [Google Scholar] [CrossRef] [Green Version]
- Wang, W.; Li, Y.; Li, Y.; Hong, A.; Wang, J.; Lin, B.; Li, R. NDRG3 is an androgen regulated and prostate enriched gene that promotes in vitro and in vivo prostate cancer cell growth. Int. J. Cancer 2009, 124, 521–530. [Google Scholar] [CrossRef] [PubMed]
- Jing, J.S.; Li, H.; Wang, S.C.; Ma, J.M.; Yu, L.Q.; Zhou, H. NDRG3 overexpression is associated with a poor prognosis in patients with hepatocellular carcinoma. Biosci. Rep. 2018, 38, BSR20180907. [Google Scholar] [CrossRef] [PubMed] [Green Version]
- Shi, J.; Zheng, H.; Yuan, L. High NDRG3 expression facilitates HCC metastasis by promoting nuclear translocation of beta-catenin. BMB Rep. 2019, 52, 451–456. [Google Scholar] [CrossRef] [Green Version]
- Luo, X.; Hou, N.; Chen, X.; Xu, Z.; Xu, J.; Wang, L.; Yang, S.; Liu, S.; Xu, L.; Chen, Y.; et al. High expression of NDRG3 associates with unfavorable overall survival in non-small cell lung cancer. Cancer Biomark. 2018, 21, 461–469. [Google Scholar] [CrossRef]
- Kim, M.C.; Park, M.H.; Kang, S.H.; Bae, Y.K. NDRG3 protein expression is associated with aggressive biologic phenotype and unfavorable outcome in patients with invasive breast cancer. Int. J. Clin. Exp. Pathol. 2019, 12, 3886–3893. [Google Scholar]
- Li, T.; Sun, R.; Lu, M.; Chang, J.; Meng, X.; Wu, H. NDRG3 facilitates colorectal cancer metastasis through activating Src phosphorylation. Onco Targets Ther. 2018, 11, 2843–2852. [Google Scholar] [CrossRef] [Green Version]
- Hanahan, D.; Weinberg, R.A. Hallmarks of cancer: The next generation. Cell. 2011, 144, 646–674. [Google Scholar] [CrossRef] [PubMed] [Green Version]
- Liu, W.; Zhang, B.; Hu, Q.; Qin, Y.; Xu, W.; Shi, S.; Liang, C.; Meng, Q.; Xiang, J.; Liang, D.; et al. A new facet of NDRG1 in pancreatic ductal adenocarcinoma: Suppression of glycolytic metabolism. Int. J. Oncol. 2017, 50, 1792–1800. [Google Scholar] [CrossRef] [PubMed]
- Xu, X.; Li, J.; Sun, X.; Guo, Y.; Chu, D.; Wei, L.; Li, X.; Yang, G.; Liu, X.; Yao, L.; et al. Tumor suppressor NDRG2 inhibits glycolysis and glutaminolysis in colorectal cancer cells by repressing c-Myc expression. Oncotarget 2015, 6, 26161–26176. [Google Scholar] [CrossRef] [PubMed]
- Ma, J.; Liu, W.; Guo, H.; Li, S.; Cao, W.; Du, X.; Lei, S.; Hou, W.; Xiong, L.; Yao, L.; et al. N-myc downstream-regulated gene 2 expression is associated with glucose transport and correlated with prognosis in breast carcinoma. Breast Cancer Res. 2014, 16, R27. [Google Scholar] [CrossRef] [Green Version]
- Kovacevic, Z.; Chikhani, S.; Lui, G.Y.; Sivagurunathan, S.; Richardson, D.R. The iron-regulated metastasis suppressor NDRG1 targets NEDD4L, PTEN, and SMAD4 and inhibits the PI3K and Ras signaling pathways. Antioxid Redox Signal. 2013, 18, 874–887. [Google Scholar] [CrossRef]
- Morishita, K.; Nakahata, S.; Ichikawa, T. Pathophysiological significance of N-myc downstream-regulated gene 2 in cancer development through protein phosphatase 2A phosphorylation regulation. Cancer Sci. 2021, 112, 22–30. [Google Scholar] [CrossRef]
- Chu, D.; Zhang, Z.; Zhou, Y.; Li, Y.; Zhu, S.; Zhang, J.; Zhao, Q.; Ji, G.; Wang, W.; Zheng, J. NDRG4, a novel candidate tumor suppressor, is a predictor of overall survival of colorectal cancer patients. Oncotarget 2015, 6, 7584–7596. [Google Scholar] [CrossRef] [Green Version]
- Lee, D.C.; Sohn, H.A.; Park, Z.-Y.; Oh, S.; Kang, Y.K.; Lee, K.-M.; Kang, M.; Jang, Y.J.; Yang, S.-J.; Hong, Y.K.; et al. A lactate-induced response to hypoxia. Cell 2015, 161, 595–609. [Google Scholar] [CrossRef] [Green Version]
- Charni-Natan, M.; Goldstein, I. Protocol for Primary Mouse Hepatocyte Isolation. STAR Protoc. 2020, 1, 100086. [Google Scholar] [CrossRef]
- Pang, Z.; Chong, J.; Zhou, G.; de Lima Morais, D.A.; Chang, L.; Barrette, M.; Gauthier, C.; Jacques, P.-É.; Li, S.; Xia, J. MetaboAnalyst 5.0: Narrowing the gap between raw spectra and functional insights. Nucleic Acids Res. 2021, 49, W388–W396. [Google Scholar] [CrossRef]
- Han, H.S.; Kang, G.; Kim, J.S.; Choi, B.H.; Koo, S.H. Regulation of glucose metabolism from a liver-centric perspective. Exp. Mol. Med. 2016, 48, e218. [Google Scholar] [CrossRef] [PubMed] [Green Version]
- Wilson, L.H.; Cho, J.-H.; Estrella, A.; Smyth, J.A.; Wu, R.; Chengsupanimit, T.; Brown, L.M.; Weinstein, D.A.; Lee, Y.M. Liver Glycogen Phosphorylase Deficiency Leads to Profibrogenic Phenotype in a Murine Model of Glycogen Storage Disease Type VI. Hepatol. Commun. 2019, 3, 1544–1555. [Google Scholar] [CrossRef] [PubMed] [Green Version]
- Johnson, L.N. Glycogen phosphorylase: Control by phosphorylation and allosteric effectors. FASEB J. 1992, 6, 2274–2282. [Google Scholar] [CrossRef] [PubMed]
- Sanderson, S.M.; Gao, X.; Dai, Z.; Locasale, J.W. Methionine metabolism in health and cancer: A nexus of diet and precision medicine. Nat. Rev. Cancer. 2019, 19, 625–637. [Google Scholar] [CrossRef] [PubMed]
- Prudova, A.; Bauman, Z.; Braun, A.; Vitvitsky, V.; Lu, S.C.; Banerjee, R. S-adenosylmethionine stabilizes cystathionine beta-synthase and modulates redox capacity. Proc. Natl. Acad. Sci. USA 2006, 103, 6489–6494. [Google Scholar] [CrossRef] [Green Version]
- Mato, J.M.; Lu, S.C. Role of S-adenosyl-L-methionine in liver health and injury. Hepatology 2007, 45, 1306–1312. [Google Scholar] [CrossRef]
- Liu, S.P.; Li, Y.S.; Chen, Y.J.; Chiang, E.P.; Li, A.F.Y.; Lee, Y.H.; Tsai, T.F.; Hsiao, M.; Hwang, S.F.; Chen, Y.M.A. Glycine N-methyltransferase-/- mice develop chronic hepatitis and glycogen storage disease in the liver. Hepatology 2007, 46, 1413–1425. [Google Scholar] [CrossRef]
- Sim, S.W.; Weinstein, D.A.; Lee, Y.M.; Jun, H.S. Glycogen storage disease type Ib: Role of glucose-6-phosphate transporter in cell metabolism and function. FEBS Lett. 2020, 594, 3–18. [Google Scholar] [CrossRef]
- Voet, D.; Voet, J.G. Glycogen metabolism. In Biochemistry, 3rd ed.; Hoboken, N., Ed.; John Wiley & Sons: Hoboken, NJ, USA, 2004; pp. 626–656. [Google Scholar]
- Labrador, E.; Weinstein, D.A. Glycogen Storage Disease Type VI. In GeneReviews®; Adam, M.P., Ardinger, H.H., Pagon, R.A., Wallace, S.E., Bean, L.H.J., Gripp, K.W., MirzaA, M.W., Amemiya, A., Eds.; University of Washington: Seattle, WA, USA, 2019; pp. 1993–2022. [Google Scholar]
- Chen, L.-Y.; Shieh, J.-J.; Lin, B.; Pan, C.-J.; Gao, J.-L.; Murphy, P.M.; Roe, T.F.; Moses, S.; Ward, J.M.; Lee, E.J.; et al. Impaired glucose homeostasis, neutrophil trafficking and function in mice lacking the glucose-6-phosphate transporter. Hum. Mol. Genet. 2003, 12, 2547–2558. [Google Scholar] [CrossRef]
- Ou, X.; Yang, H.; Ramani, K.; Ara, A.I.; Chen, H.; Mato, J.M.; Lu, S.C. Inhibition of human betaine-homocysteine methyltransferase expression by S-adenosylmethionine and methylthioadenosine. Biochem. J. 2007, 401, 87–96. [Google Scholar] [CrossRef] [Green Version]
- Hughey, C.C.; Trefts, E.; Bracy, D.P.; James, F.D.; Donahue, E.P.; Wasserman, D.H. Glycine N-methyltransferase deletion in mice diverts carbon flux from gluconeogenesis to pathways that utilize excess methionine cycle intermediates. J. Biol. Chem. 2018, 293, 11944–11954. [Google Scholar] [CrossRef] [PubMed] [Green Version]
- Luka, Z.; Capdevila, A.; Mato, J.M.; Wagner, C. A glycine N-methyltransferase knockout mouse model for humans with deficiency of this enzyme. Transgenic Res. 2006, 15, 393–397. [Google Scholar] [CrossRef] [PubMed]
- Luka, Z.; Mudd, S.H.; Wagner, C. Glycine N-methyltransferase and regulation of S-adenosylmethionine levels. J. Biol. Chem. 2009, 284, 22507–22511. [Google Scholar] [CrossRef] [PubMed] [Green Version]
- Lu, S.C.; Mato, J.M. S-adenosylmethionine in liver health, injury, and cancer. Physiol Rev. 2012, 92, 1515–1542. [Google Scholar] [CrossRef] [PubMed] [Green Version]
- Avila, M.A.; Garcia-Trevijano, E.R.; Lu, S.C.; Corrales, F.J.; Mato, J.M. Methylthioadenosine. Int. J. Biochem. Cell Biol. 2004, 36, 2125–2130. [Google Scholar] [CrossRef]
- Williams-Ashman, H.G.; Seidenfeld, J.; Galletti, P. Trends in the biochemical pharmacology of 5’-deoxy-5’-methylthioadenosine. Biochem. Pharmacol. 1982, 31, 277–288. [Google Scholar] [CrossRef]
- Pascale, R.M.; Simile, M.M.; De Miglio, M.R.; Feo, F. Chemoprevention of hepatocarcinogenesis: S-adenosyl-L-methionine. Alcohol 2002, 27, 193–198. [Google Scholar] [CrossRef]
- Simile, M.M.; Banni, S.; Angioni, E.; Carta, G.; De Miglio, M.R.; Muroni, M.R.; Calvisi, D.F.; Carru, A.; Pascale, R.M.; Feo, F. 5′-Methylthioadenosine administration prevents lipid peroxidation and fibrogenesis induced in rat liver by carbon-tetrachloride intoxication. J Hepatol. 2001, 34, 386–394. [Google Scholar] [CrossRef]
- Zhu, M.; Du, J.; Liu, A.D.; Holmberg, L.; Chen, S.Y.; Bu, D.; Jin, H. L-cystathionine inhibits oxidized low density lipoprotein-induced THP-1-derived macrophage inflammatory cytokine monocyte chemoattractant protein-1 generation via the NF-kappaB pathway. Sci. Rep. 2015, 5, 10453. [Google Scholar] [CrossRef] [Green Version]
- Sen, S.; Kawahara, B.; Mahata, S.K.; Tsai, R.; Yoon, A.; Hwang, L.; Hu-Moore, K.; Villanueva, C.; Vajihuddin, A.; Parameshwar, P.; et al. Cystathionine: A novel oncometabolite in human breast cancer. Arch. Biochem. Biophys. 2016, 604, 95–102. [Google Scholar] [CrossRef]
- Maclean, K.N.; Greiner, L.S.; Evans, J.R.; Sood, S.K.; Lhotak, S.; Markham, N.E.; Stabler, S.P.; Allen, R.H.; Austin, R.C.; Balasubramaniam, V.; et al. Cystathionine protects against endoplasmic reticulum stress-induced lipid accumulation, tissue injury, and apoptotic cell death. J. Biol. Chem. 2012, 287, 31994–32005. [Google Scholar] [CrossRef] [PubMed] [Green Version]
- Wada, K.; Kamisaki, Y.; Nakamoto, K.; Itoh, T. Effect of cystathionine as a scavenger of superoxide generated from human leukocytes or derived from xanthine oxidase in vitro. Eur. J. Pharmacol. 1996, 296, 335–340. [Google Scholar] [CrossRef]
- Kitamura, Y.; Kamisaki, Y.; Itoh, T. Hepatoprotective effects of cystathionine against acetaminophen-induced necrosis. J. Pharmacol. Exp. Ther. 1989, 250, 667–671. [Google Scholar] [PubMed]
- Aoyama, K.; Nakaki, T. Glutathione in Cellular Redox Homeostasis: Association with the Excitatory Amino Acid Carrier 1 (EAAC1). Molecules 2015, 20, 8742–8758. [Google Scholar] [CrossRef] [PubMed] [Green Version]
- Kim, K.R.; Park, J.S.; Jang, J.Y.; Choi, Y.; Lee, H.H.; Lee, D.C.; Park, K.C.; Yeom, Y.I.; Kim, H.-J.; Han, B.W. Structural and Biophysical Analyses of Human N-Myc Downstream-Regulated Gene 3 (NDRG3) Protein. Biomolecules 2020, 10, 90. [Google Scholar] [CrossRef] [PubMed] [Green Version]
- Ward, P.S.; Thompson, C.B. Metabolic reprogramming: A cancer hallmark even warburg did not anticipate. Cancer Cell 2012, 21, 297–308. [Google Scholar] [CrossRef] [PubMed] [Green Version]


Publisher’s Note: MDPI stays neutral with regard to jurisdictional claims in published maps and institutional affiliations. |
© 2022 by the authors. Licensee MDPI, Basel, Switzerland. This article is an open access article distributed under the terms and conditions of the Creative Commons Attribution (CC BY) license (https://creativecommons.org/licenses/by/4.0/).
Share and Cite
Sohn, H.A.; Lee, D.C.; Park, A.; Kang, M.; Yoon, B.-H.; Lee, C.-H.; Kim, Y.-H.; Oh, K.-J.; Kim, C.Y.; Park, S.-H.; et al. Glycogen Storage Disease Phenotypes Accompanying the Perturbation of the Methionine Cycle in NDRG3-Deficient Mouse Livers. Cells 2022, 11, 1536. https://doi.org/10.3390/cells11091536
Sohn HA, Lee DC, Park A, Kang M, Yoon B-H, Lee C-H, Kim Y-H, Oh K-J, Kim CY, Park S-H, et al. Glycogen Storage Disease Phenotypes Accompanying the Perturbation of the Methionine Cycle in NDRG3-Deficient Mouse Livers. Cells. 2022; 11(9):1536. https://doi.org/10.3390/cells11091536
Chicago/Turabian StyleSohn, Hyun Ahm, Dong Chul Lee, Anna Park, Minho Kang, Byoung-Ha Yoon, Chul-Ho Lee, Yong-Hoon Kim, Kyoung-Jin Oh, Cha Yeon Kim, Seong-Hwan Park, and et al. 2022. "Glycogen Storage Disease Phenotypes Accompanying the Perturbation of the Methionine Cycle in NDRG3-Deficient Mouse Livers" Cells 11, no. 9: 1536. https://doi.org/10.3390/cells11091536