
Activation of the Renin–Angiotensin System Disrupts the Cytoskeletal Architecture of Human Urine-Derived Podocytes

 ,
,  , and
, and 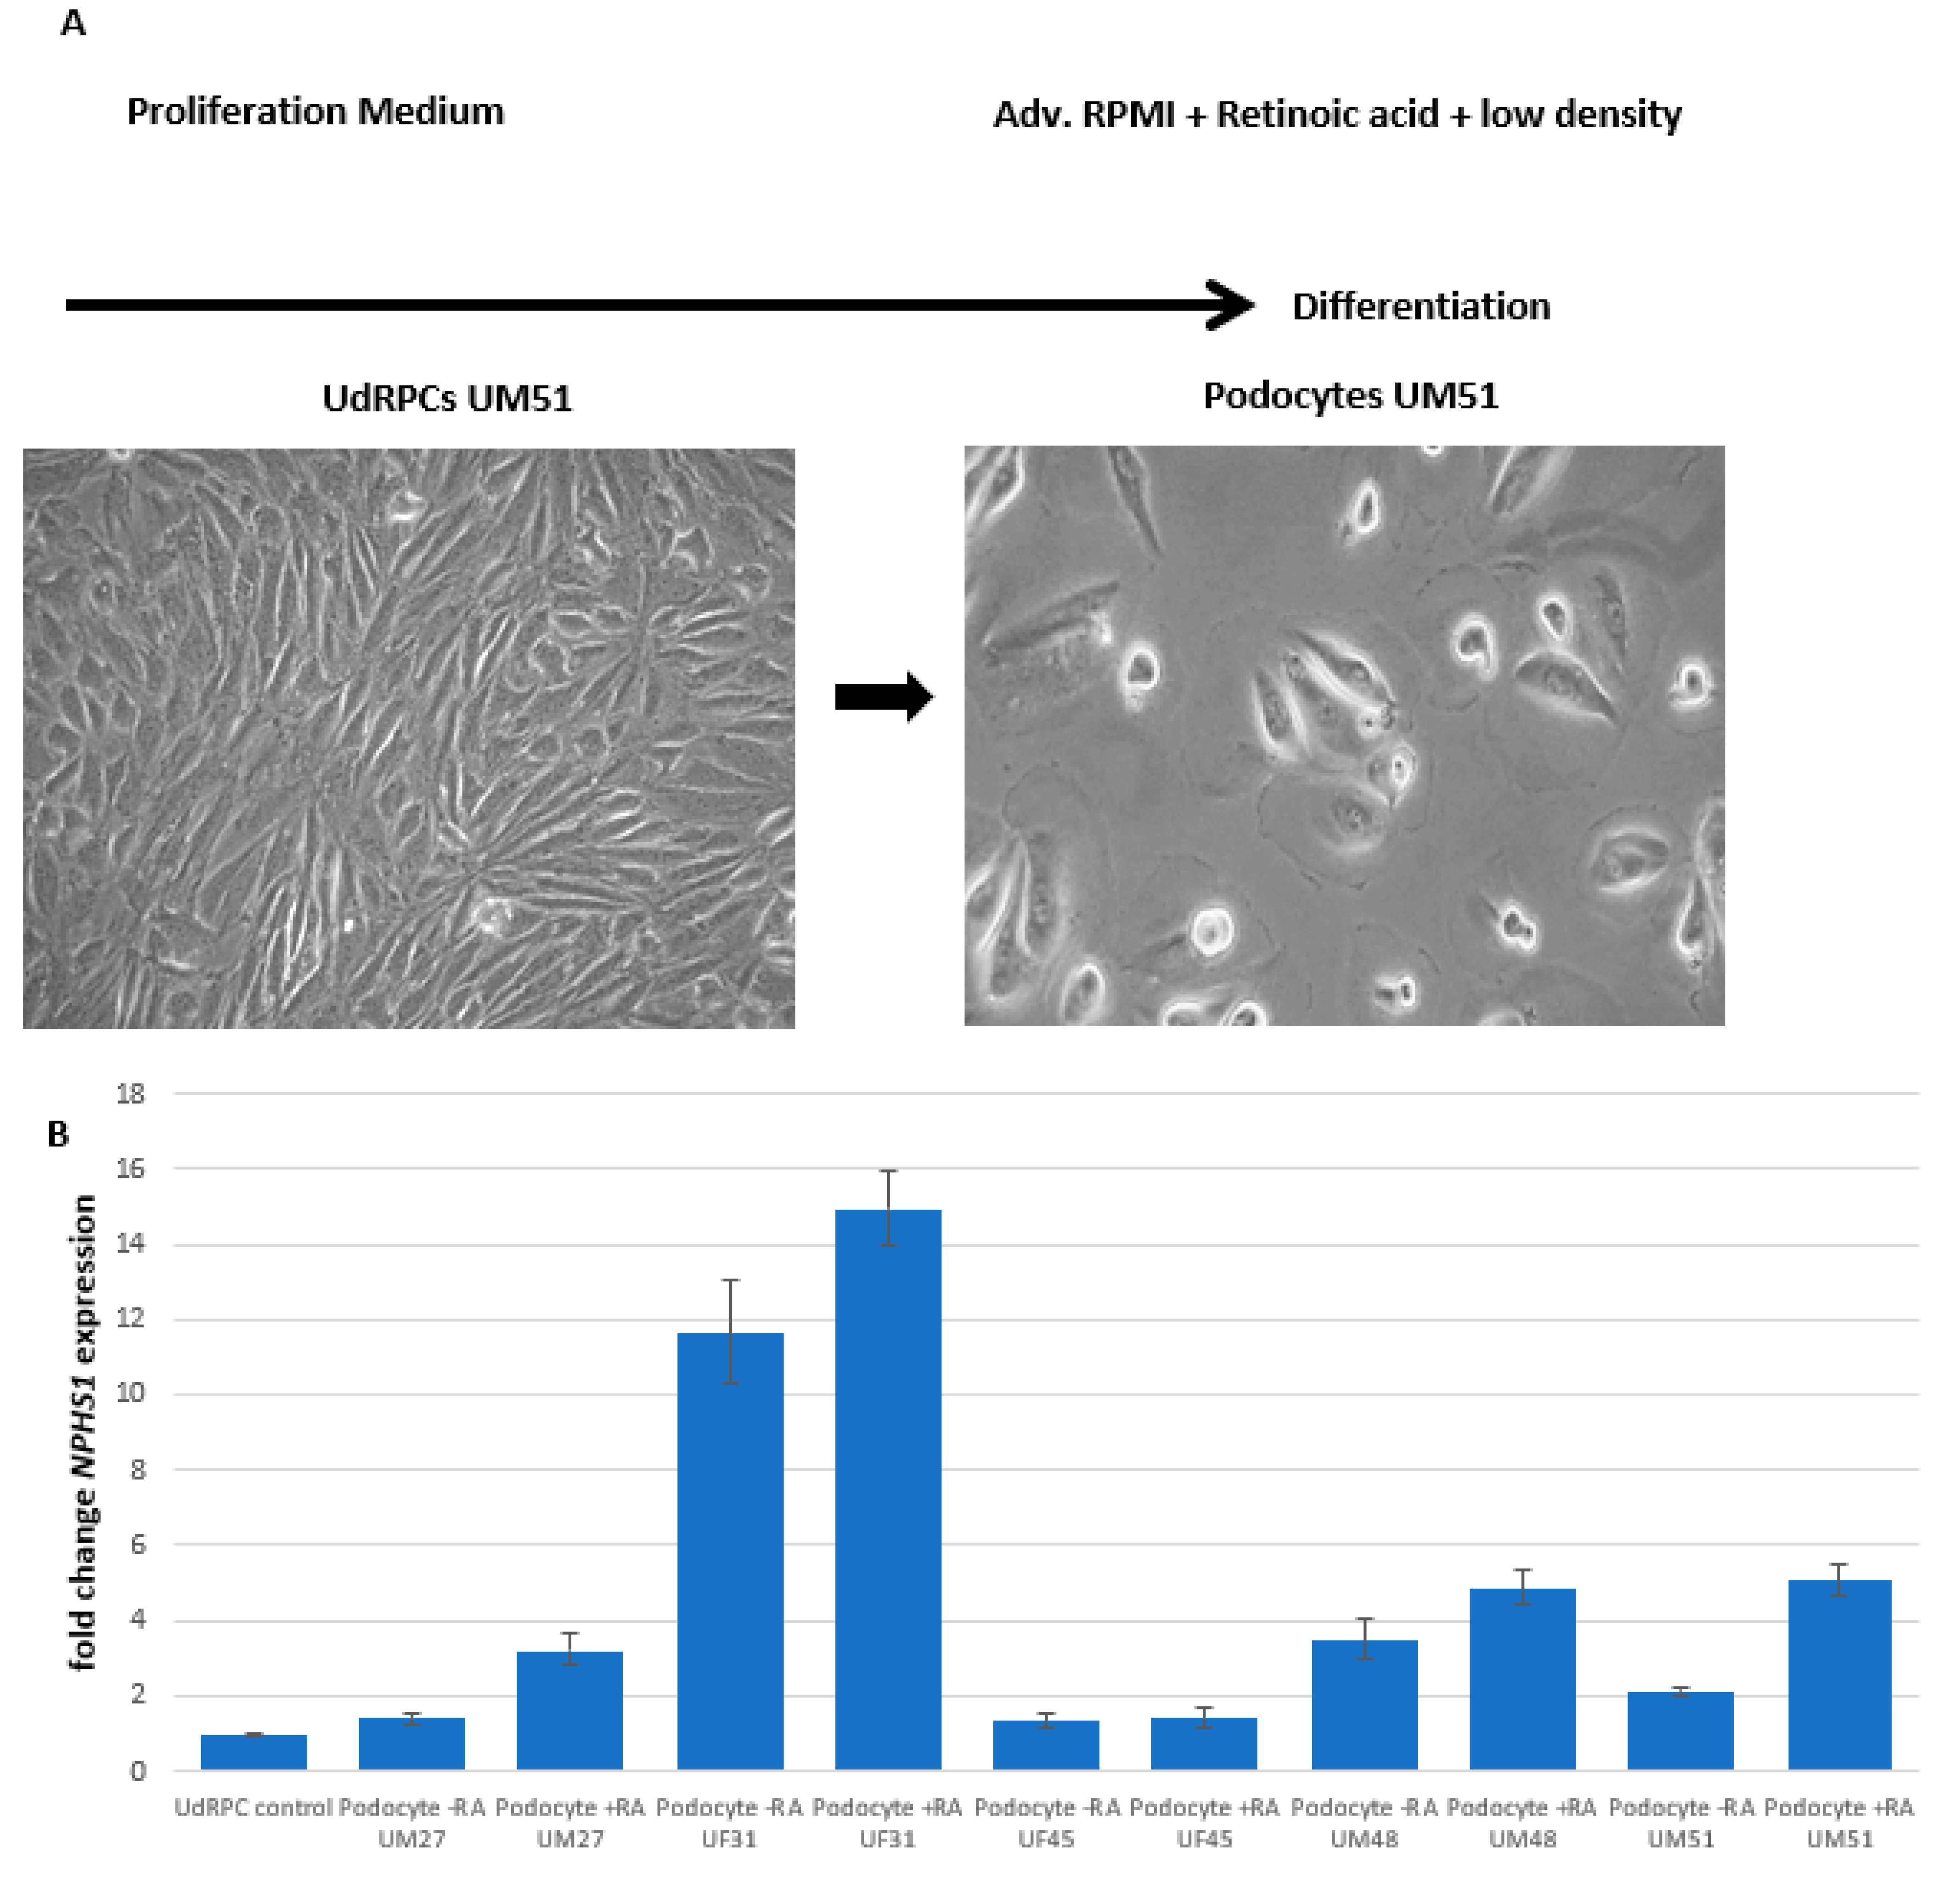
Abstract
:1. Introduction
2. Material and Methods
2.1. Cell Culture Conditions
2.2. Relative Quantification of Podocyte Associated Gene Expression by Real-Time PCR
2.3. Bisulfite Genomic Sequencing
2.4. Immunofluorescence Staining
2.5. Microarray Data Analyses
2.6. Secretome Analyses
2.7. Cluster Analysis of the Renin–Angiotensin Pathway
2.8. Western Blot Analysis
2.9. Statistics
2.10. Albumin Endocytosis Assay
3. Results
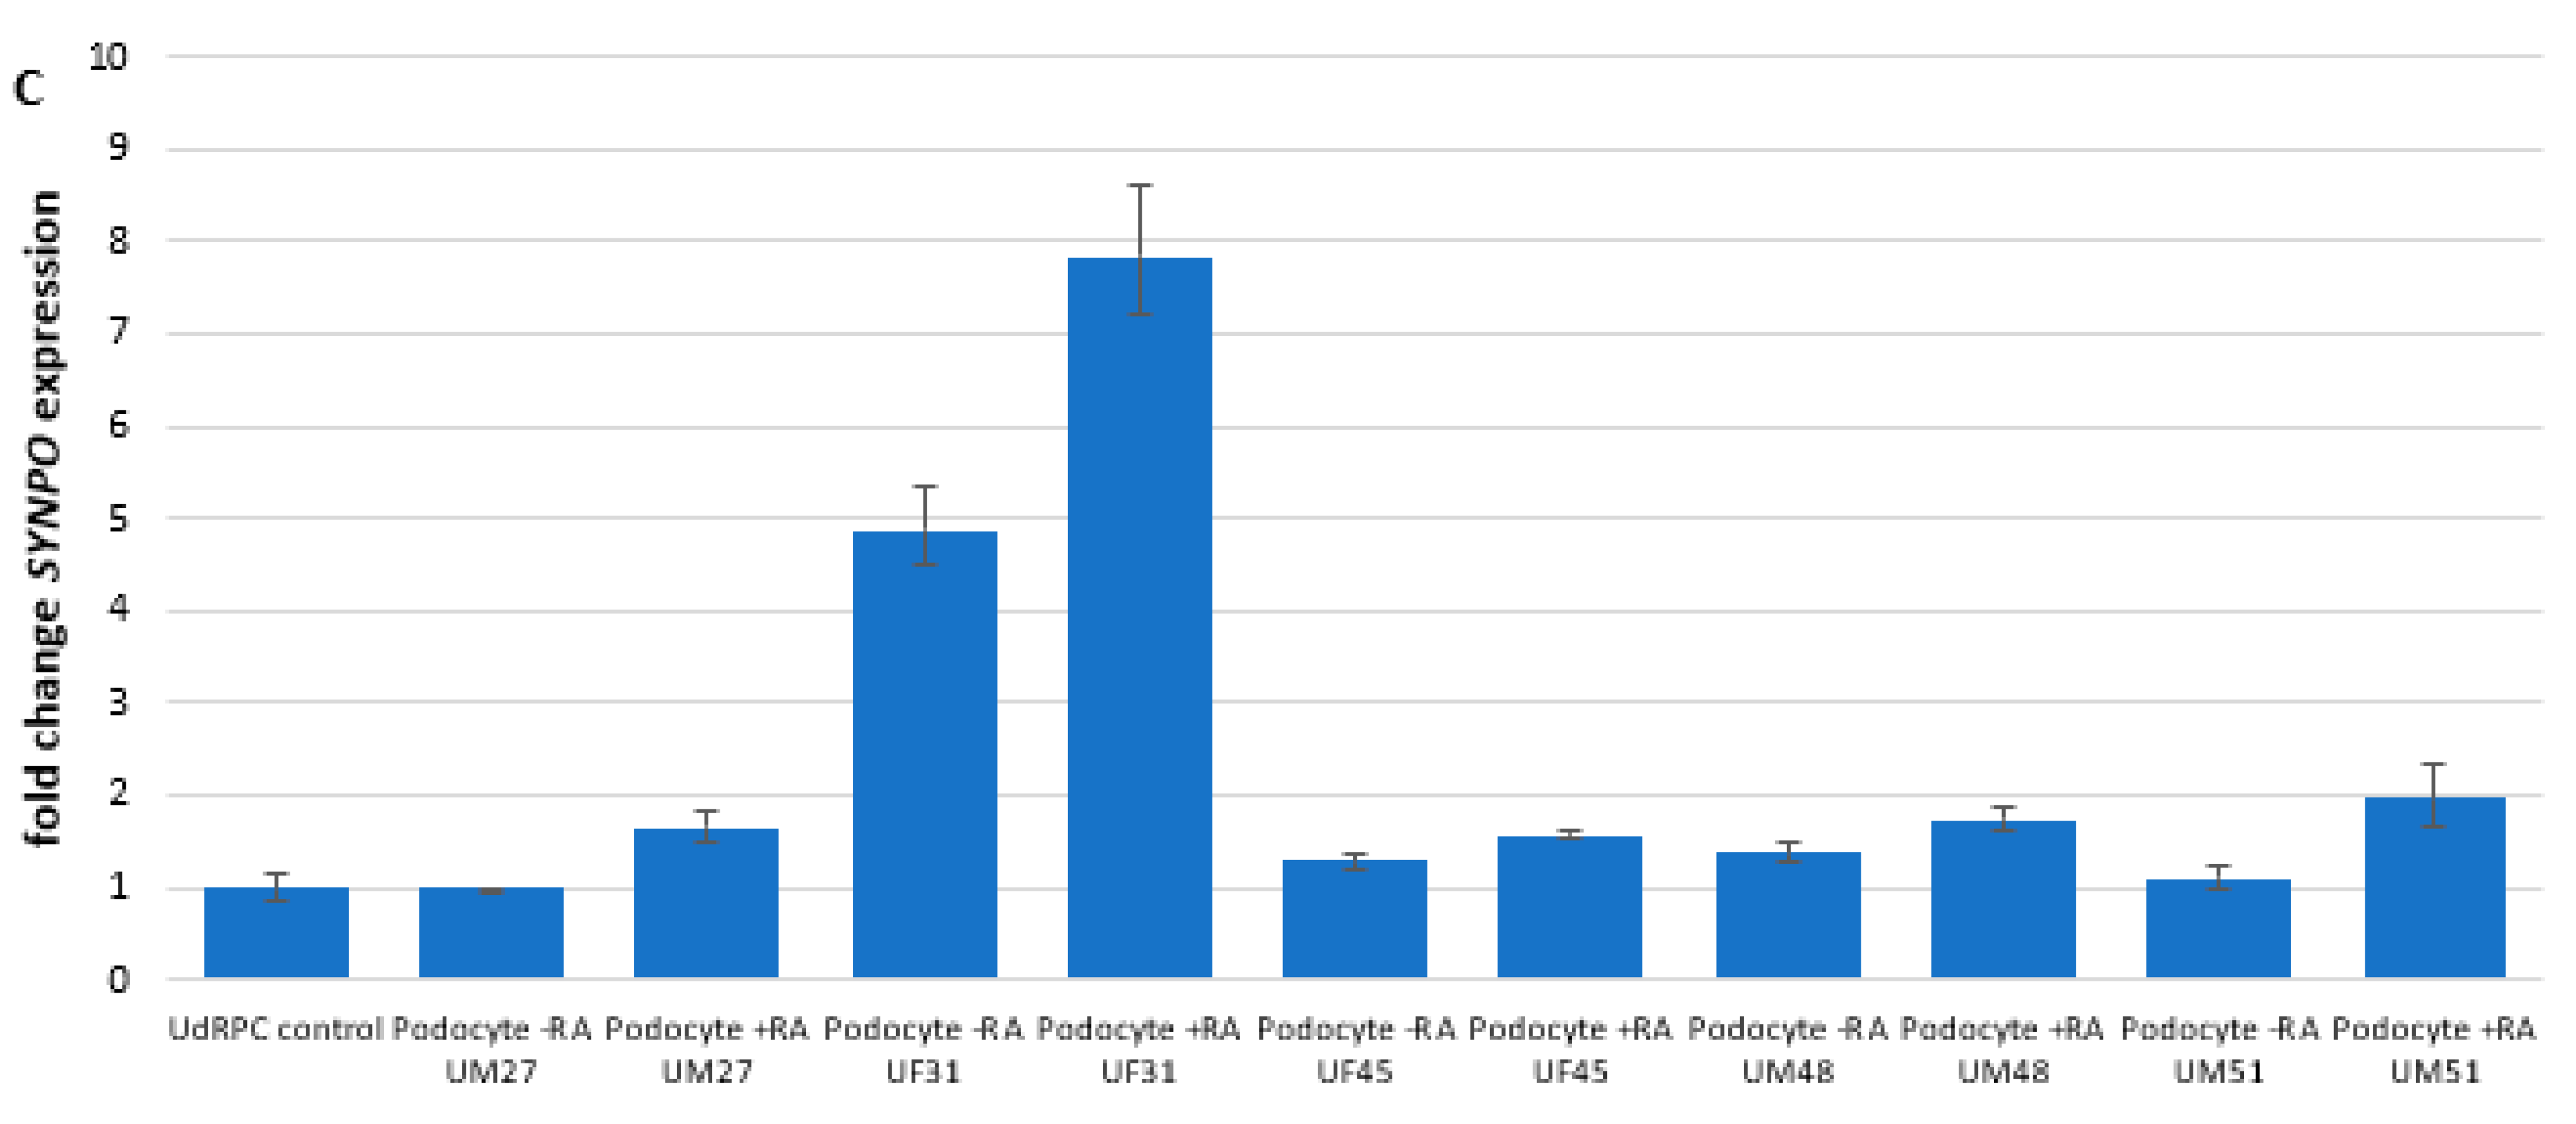
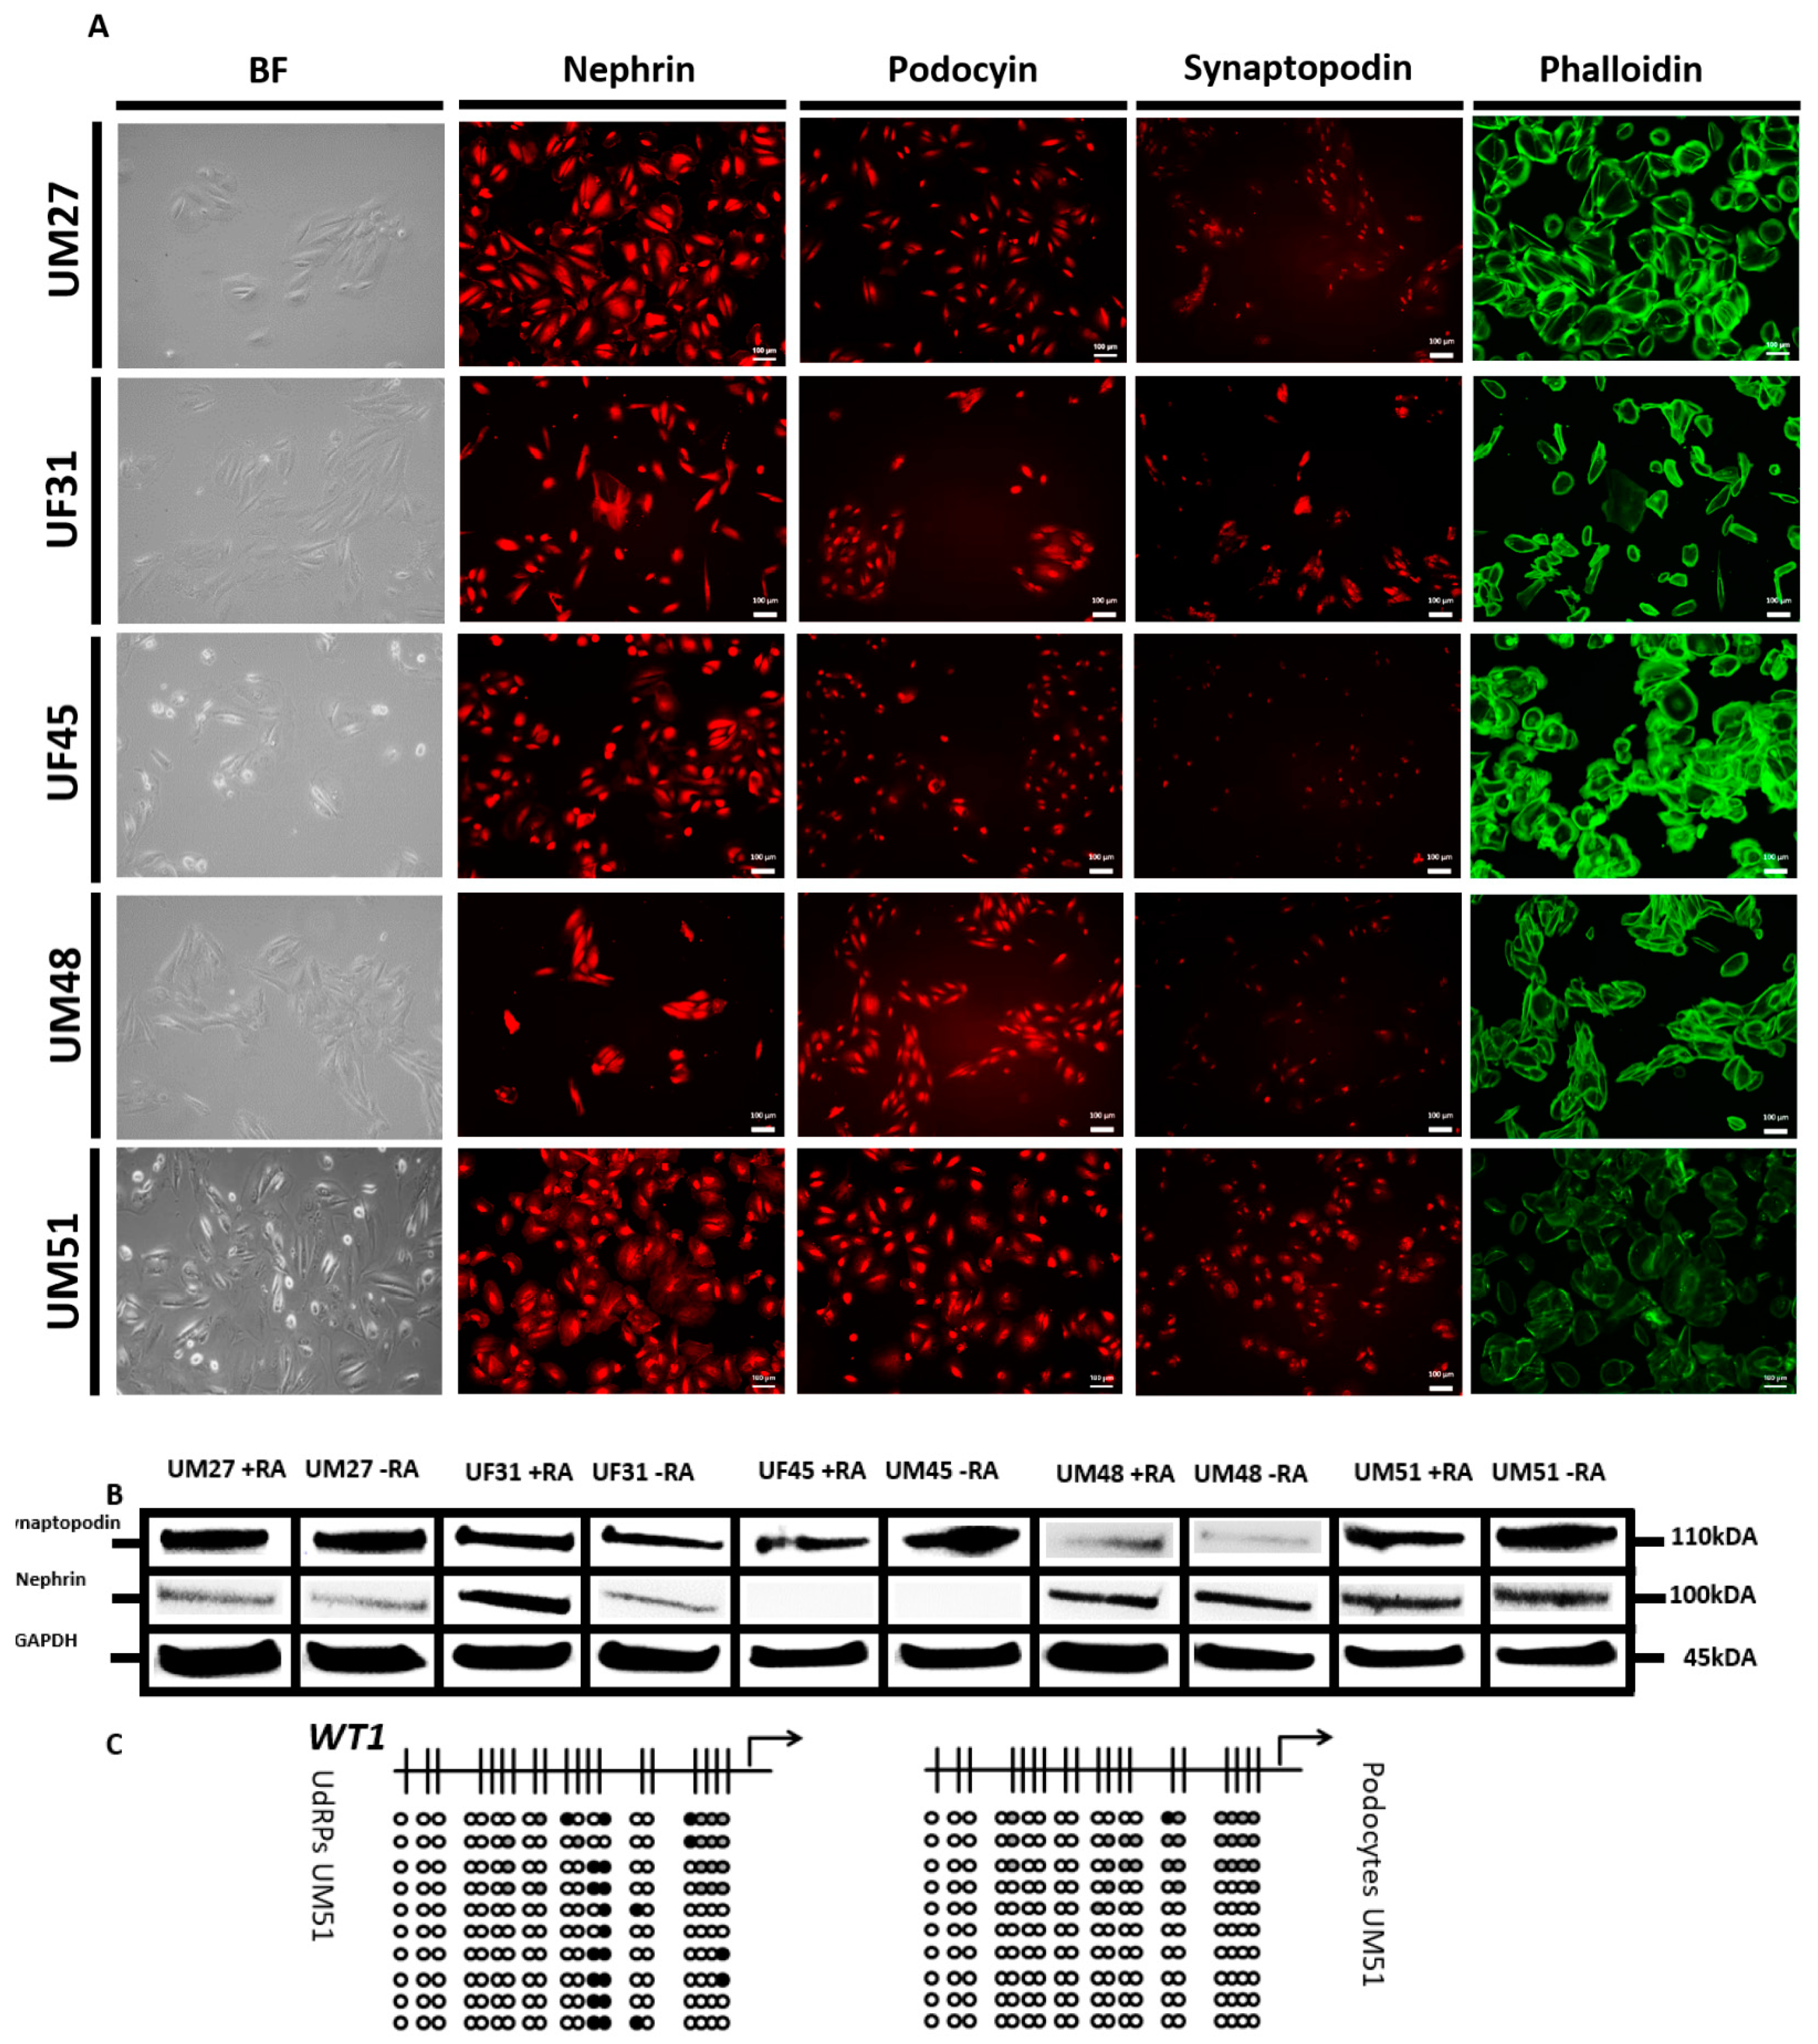
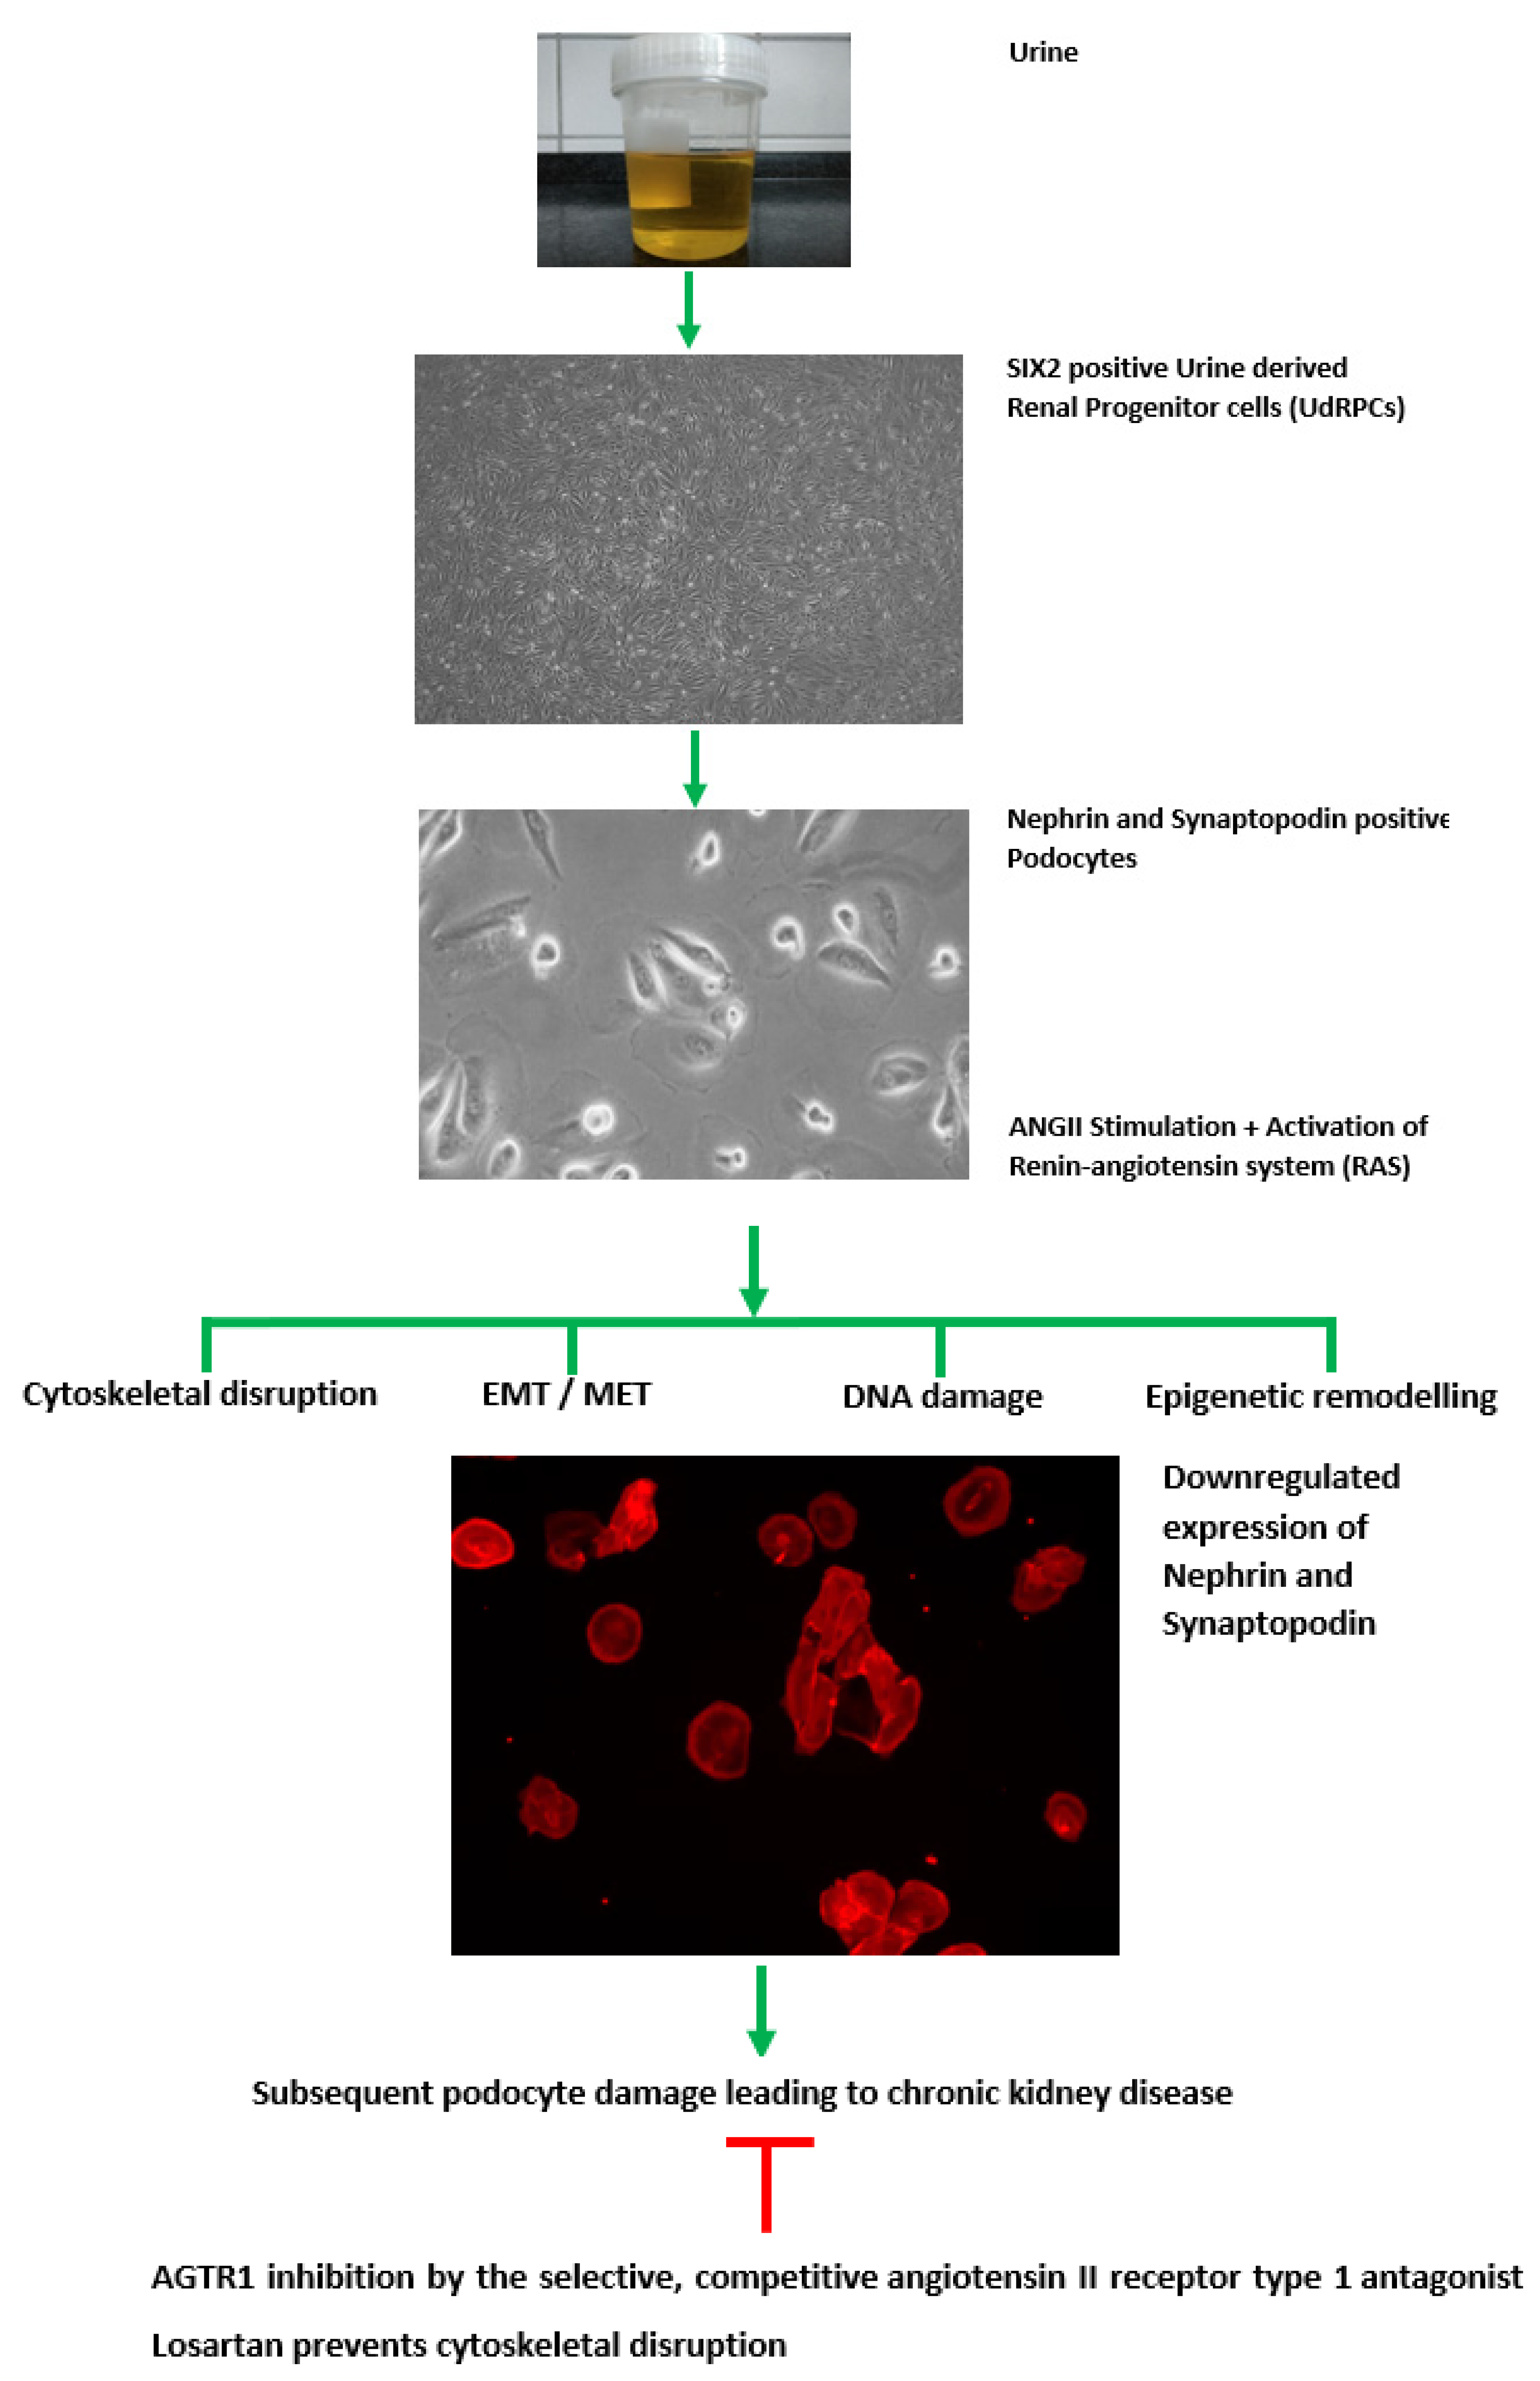
3.1. Generation of Human Podocytes from Urine-Derived Renal Progenitor Cells Is Enhanced by Retinoic Acid
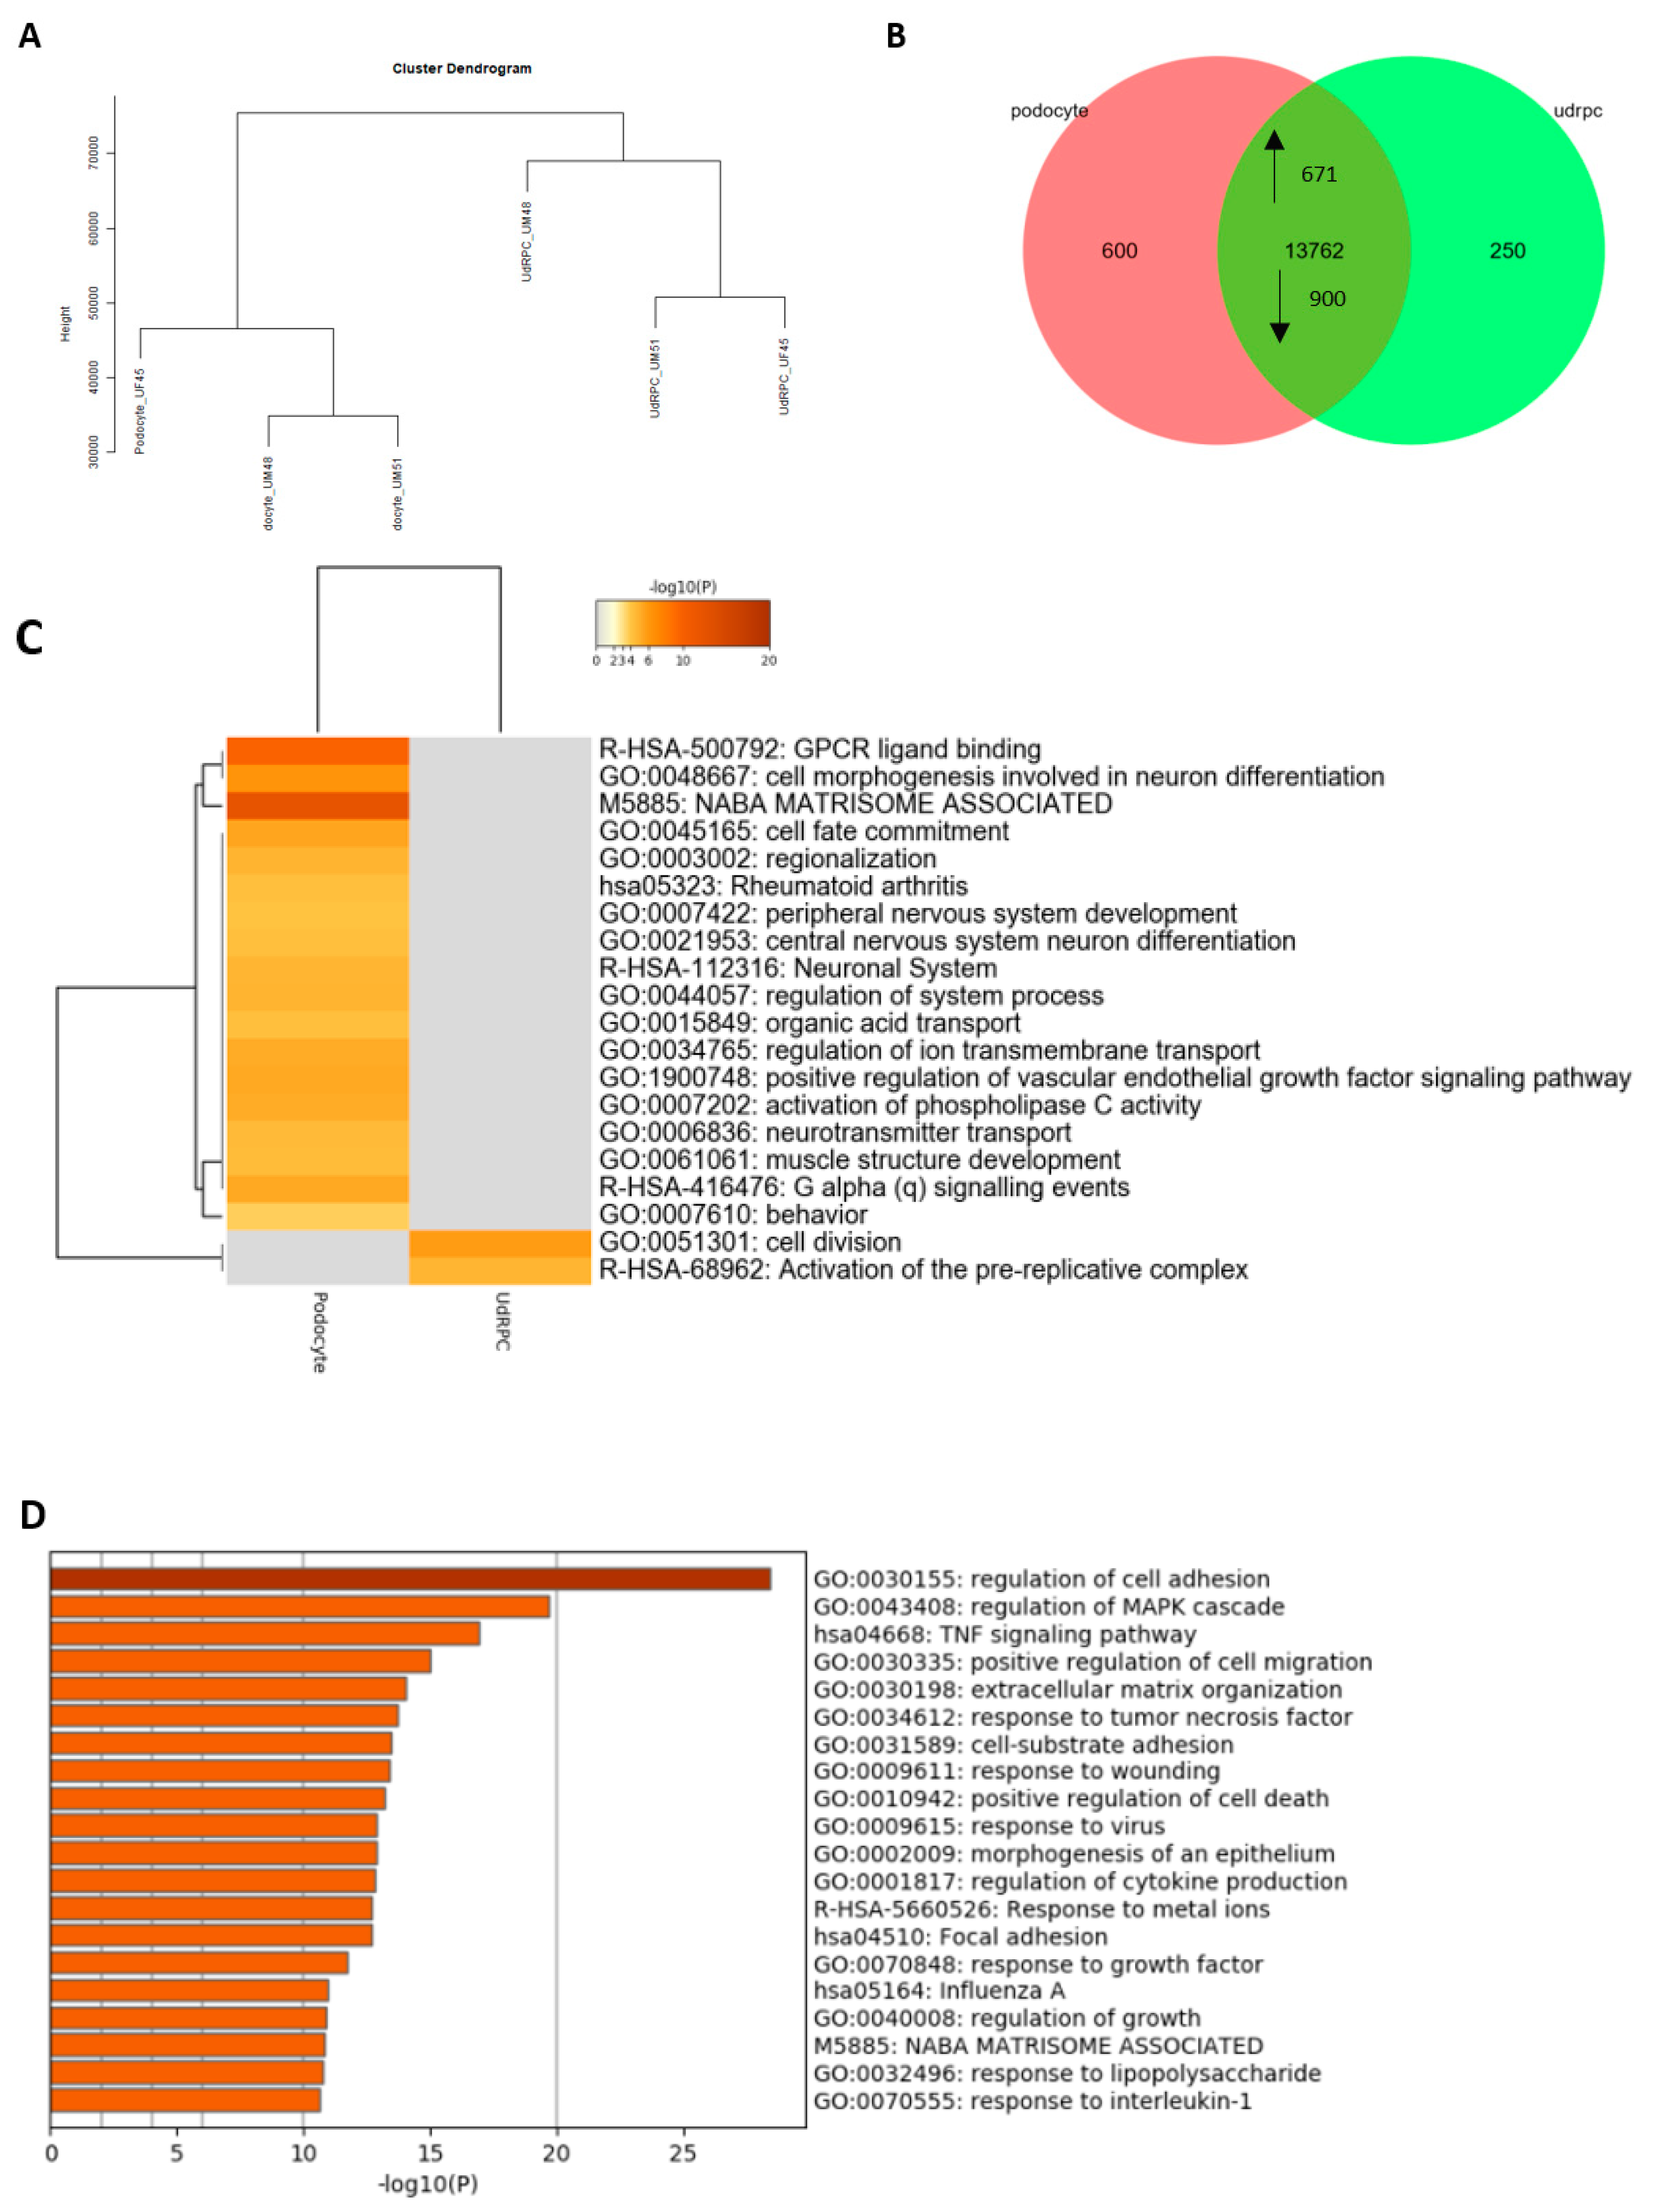
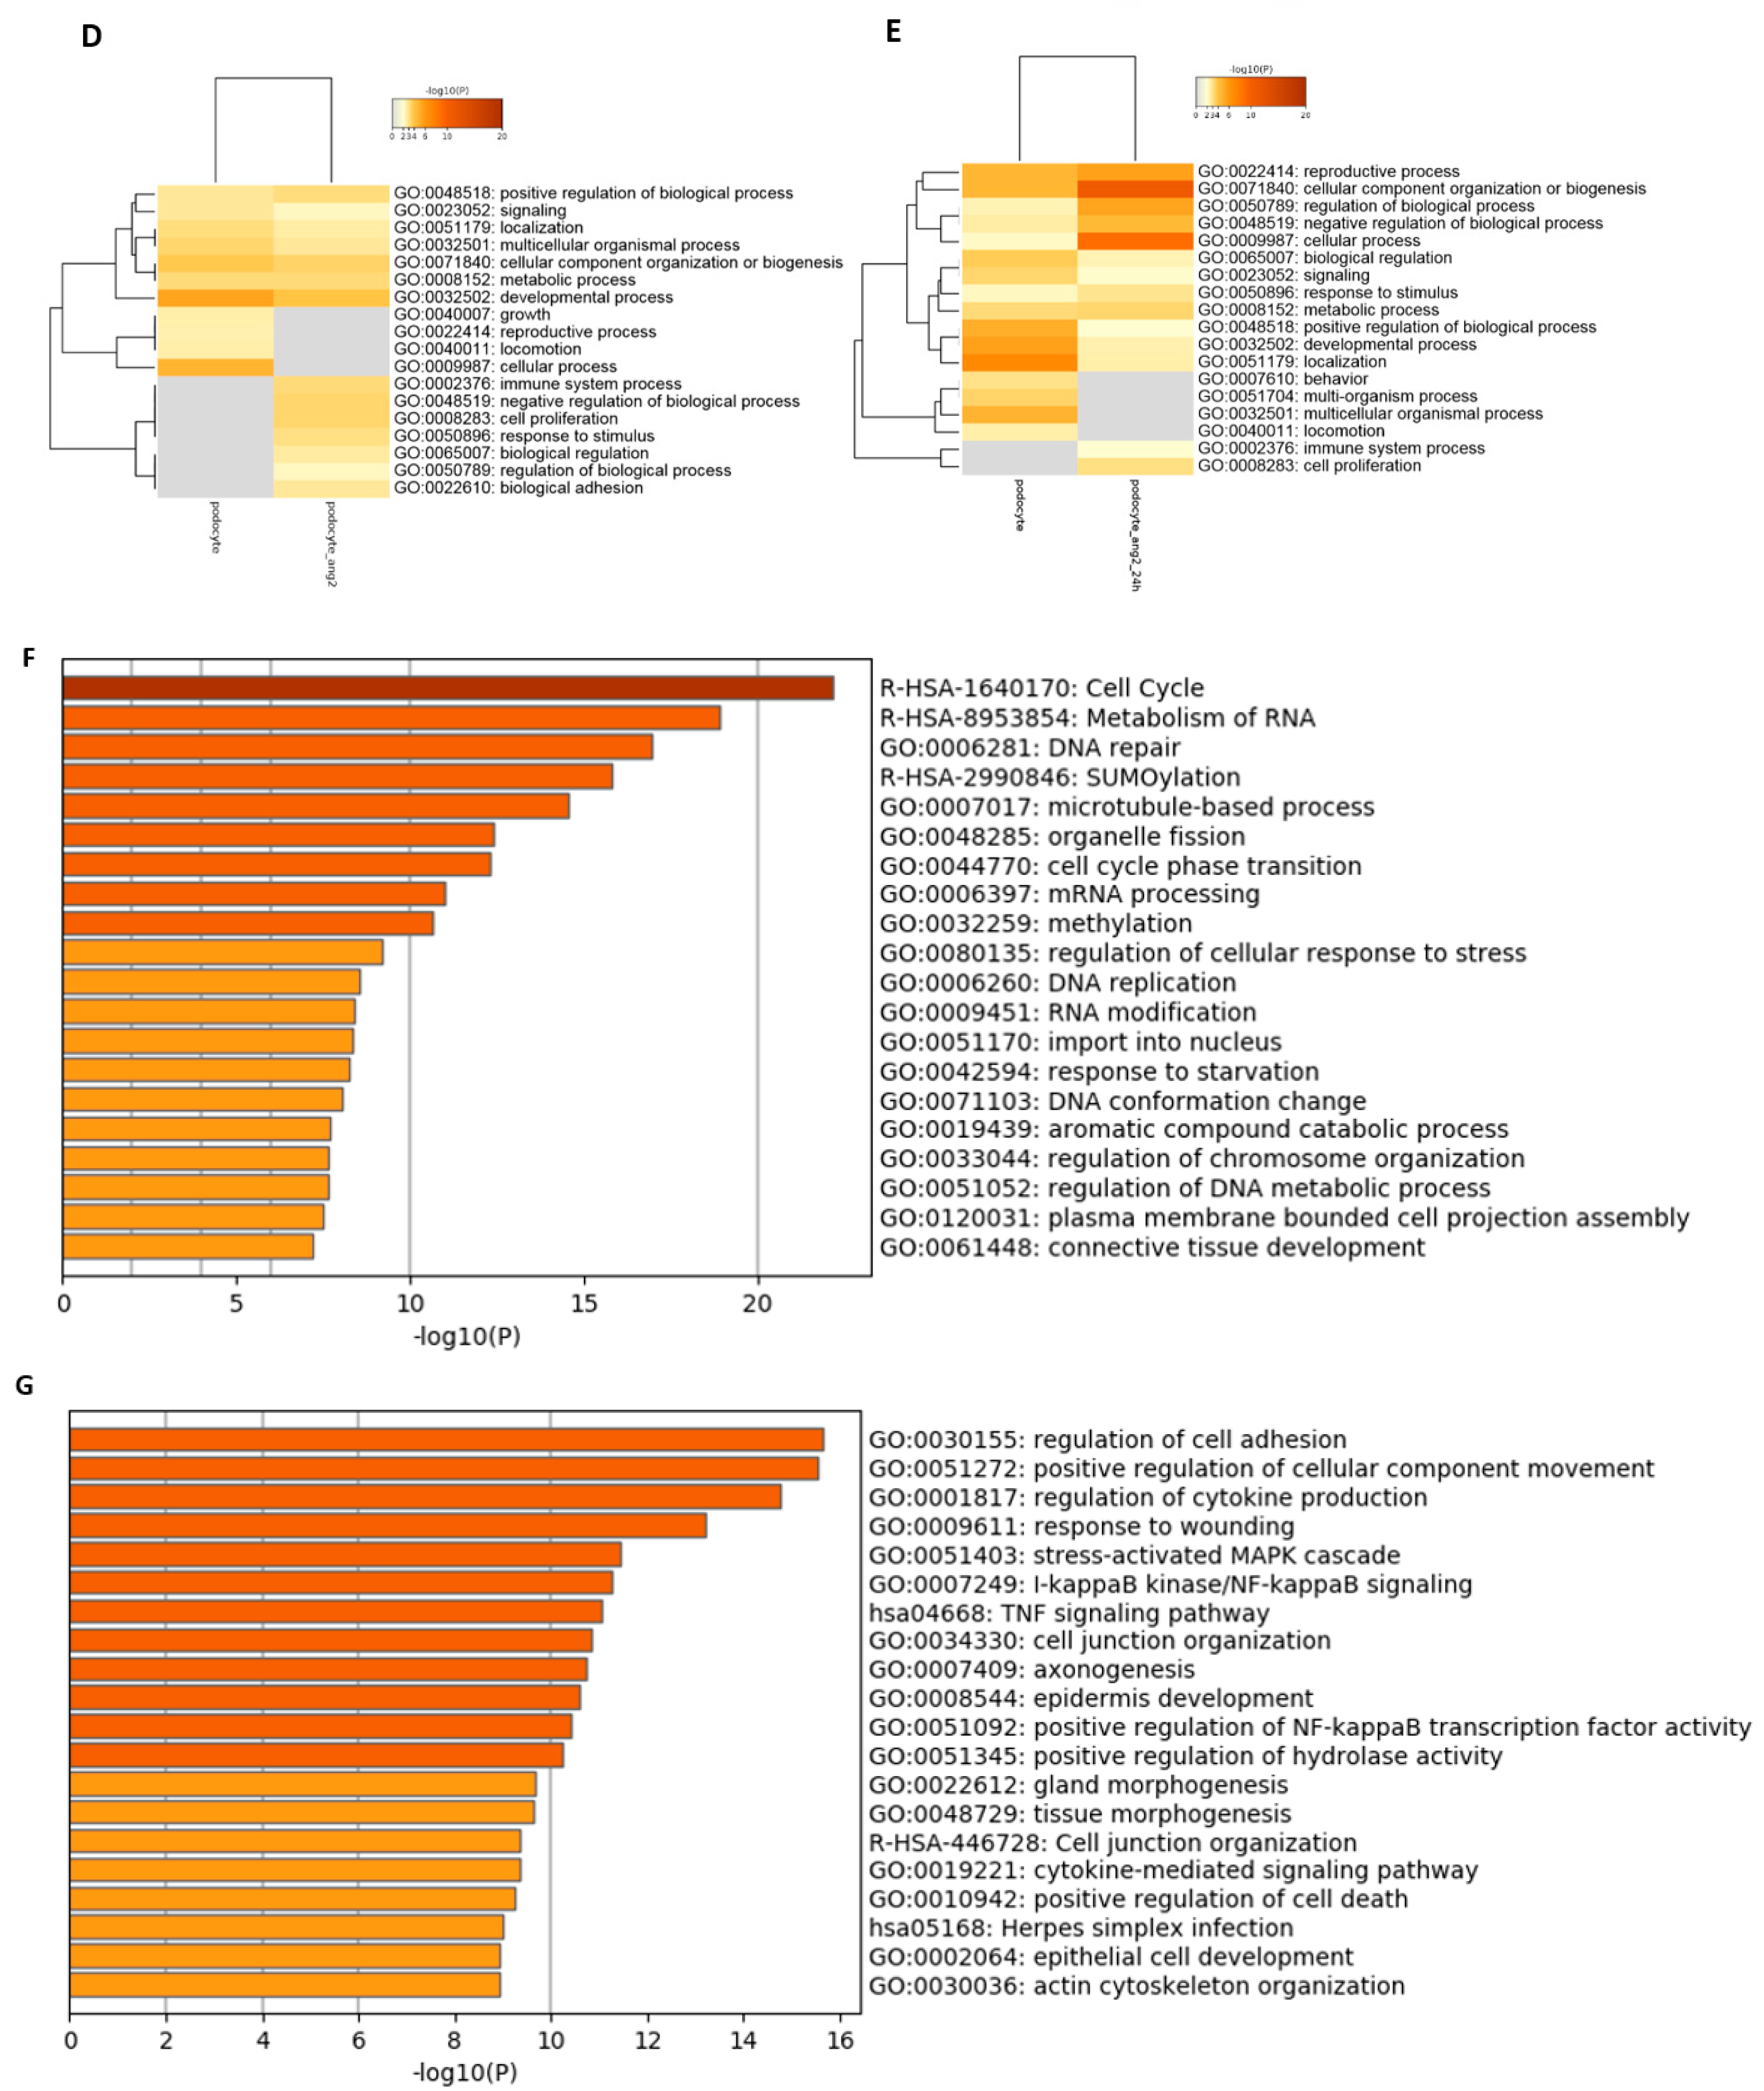
3.2. Comparative Transcriptome Analysis of Urine-Derived Renal Progenitor Cells with Their Podocyte Counterparts
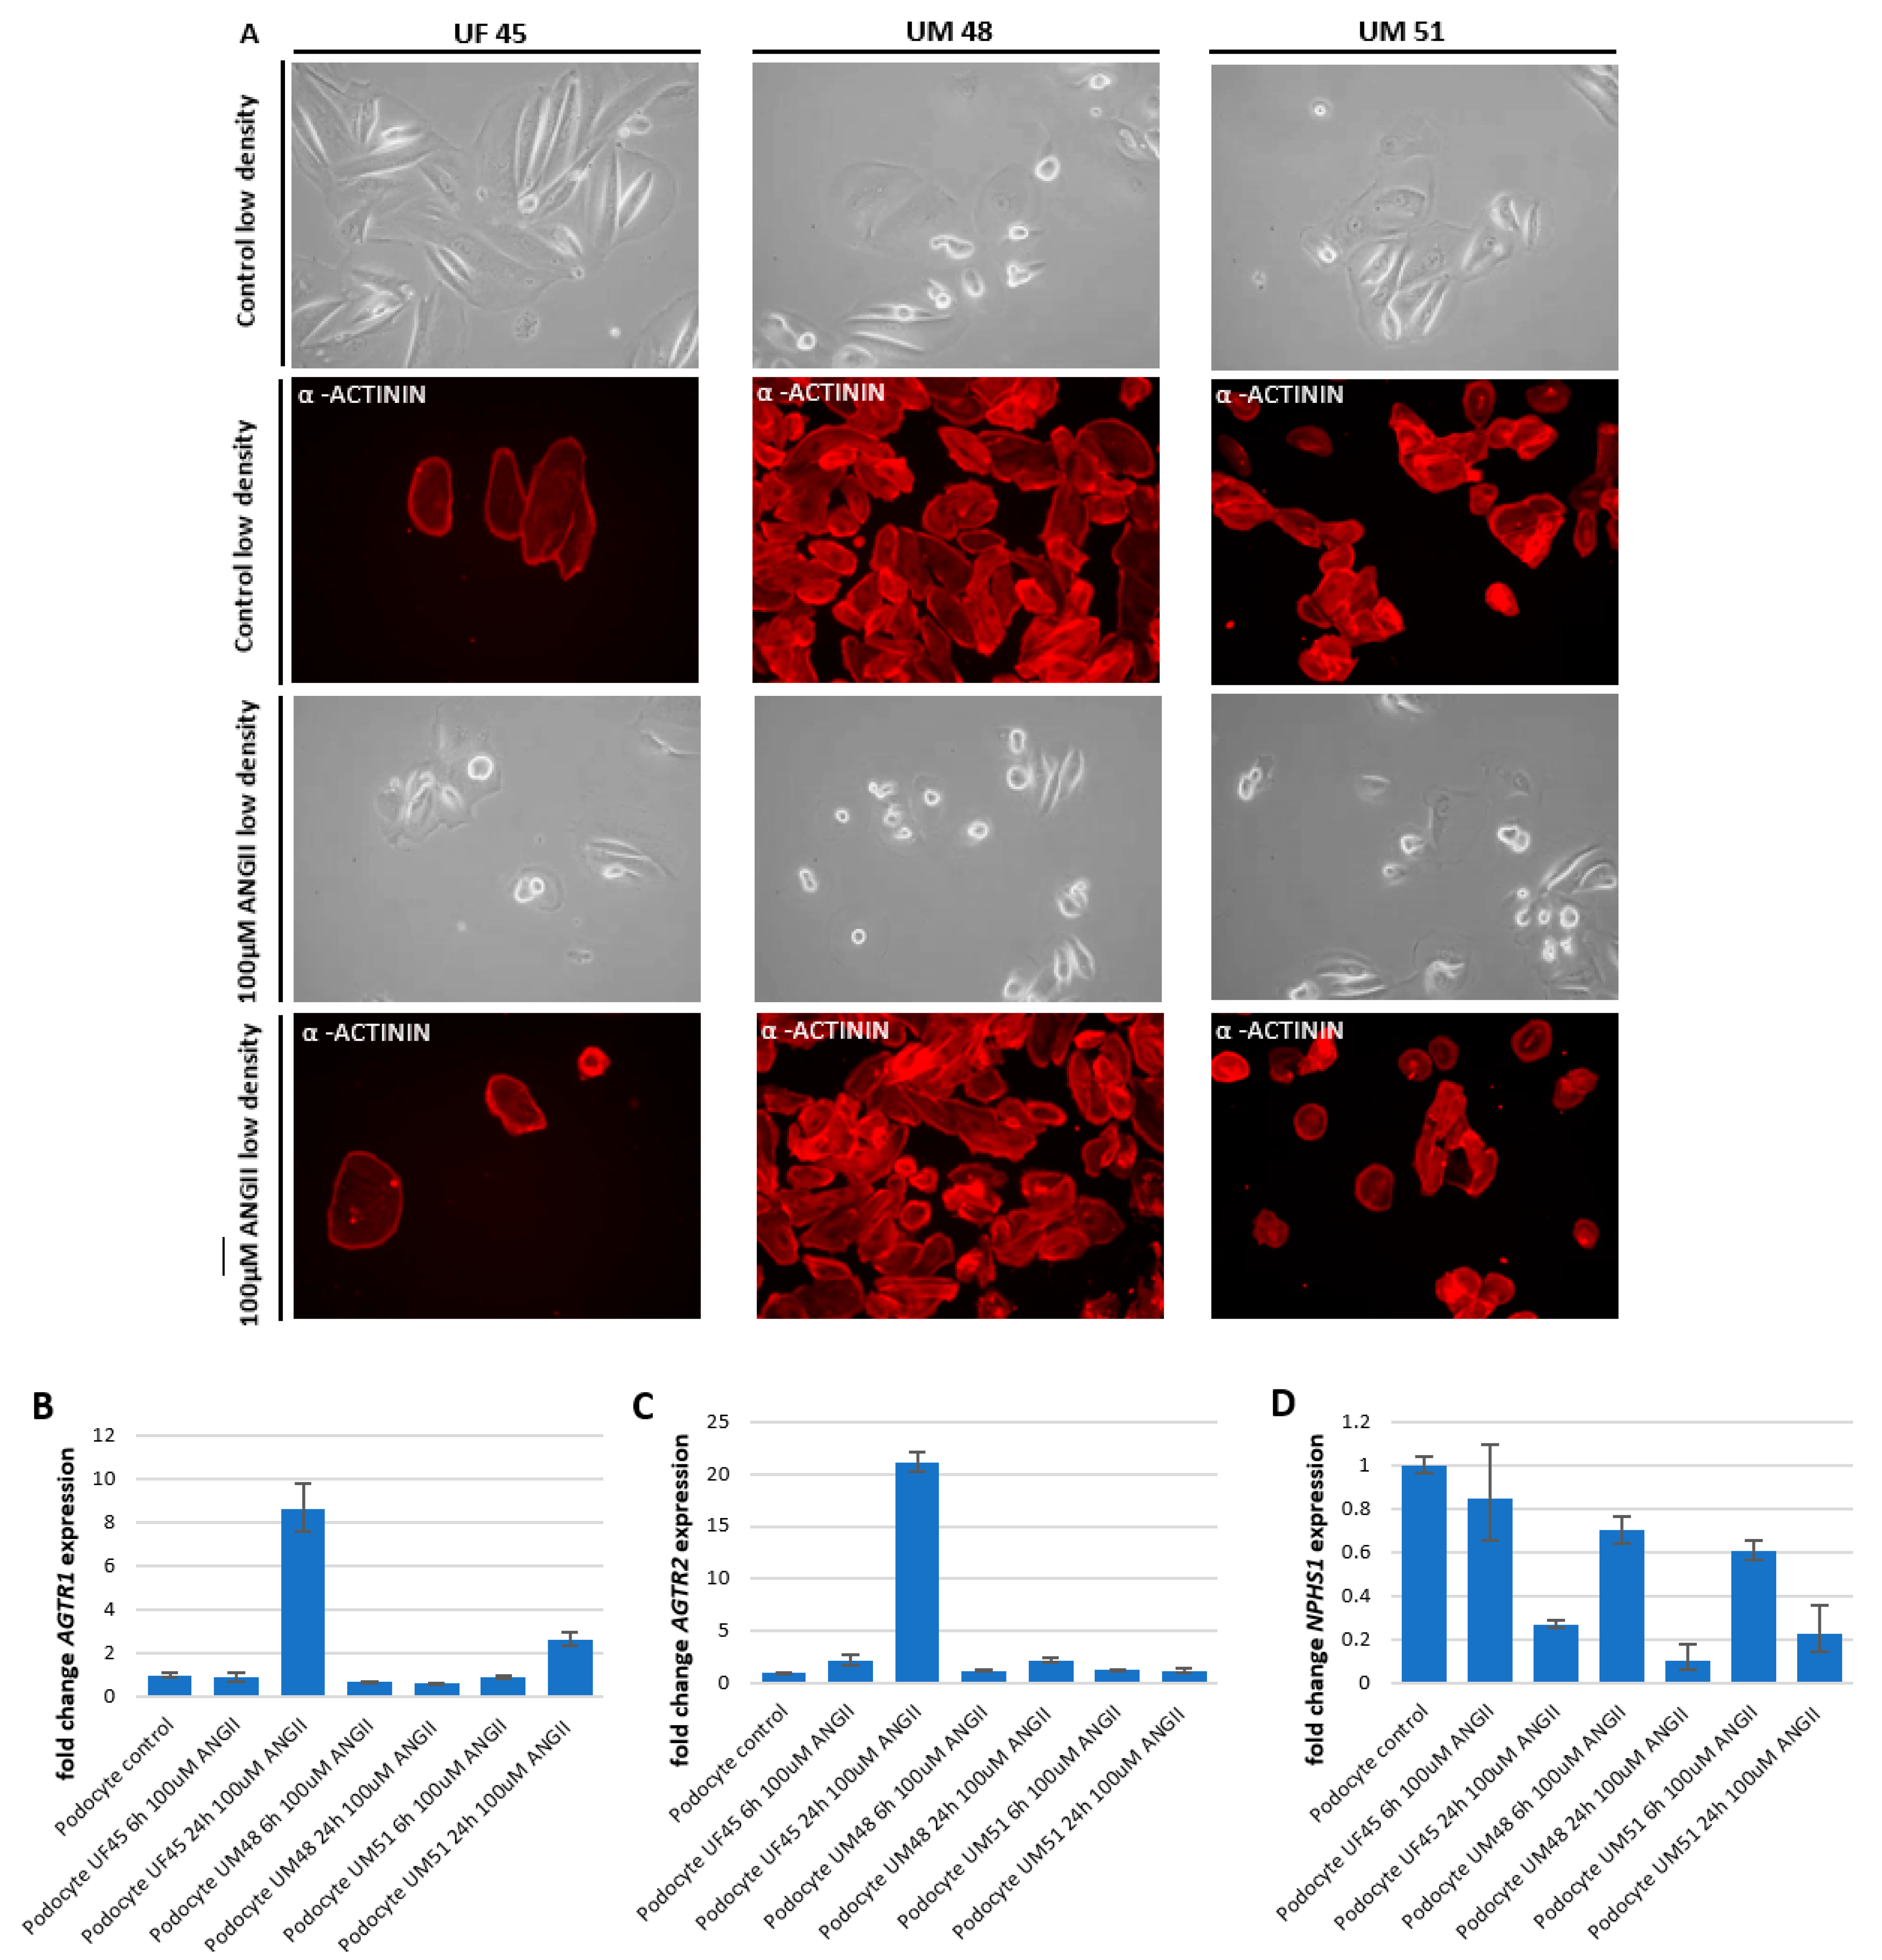
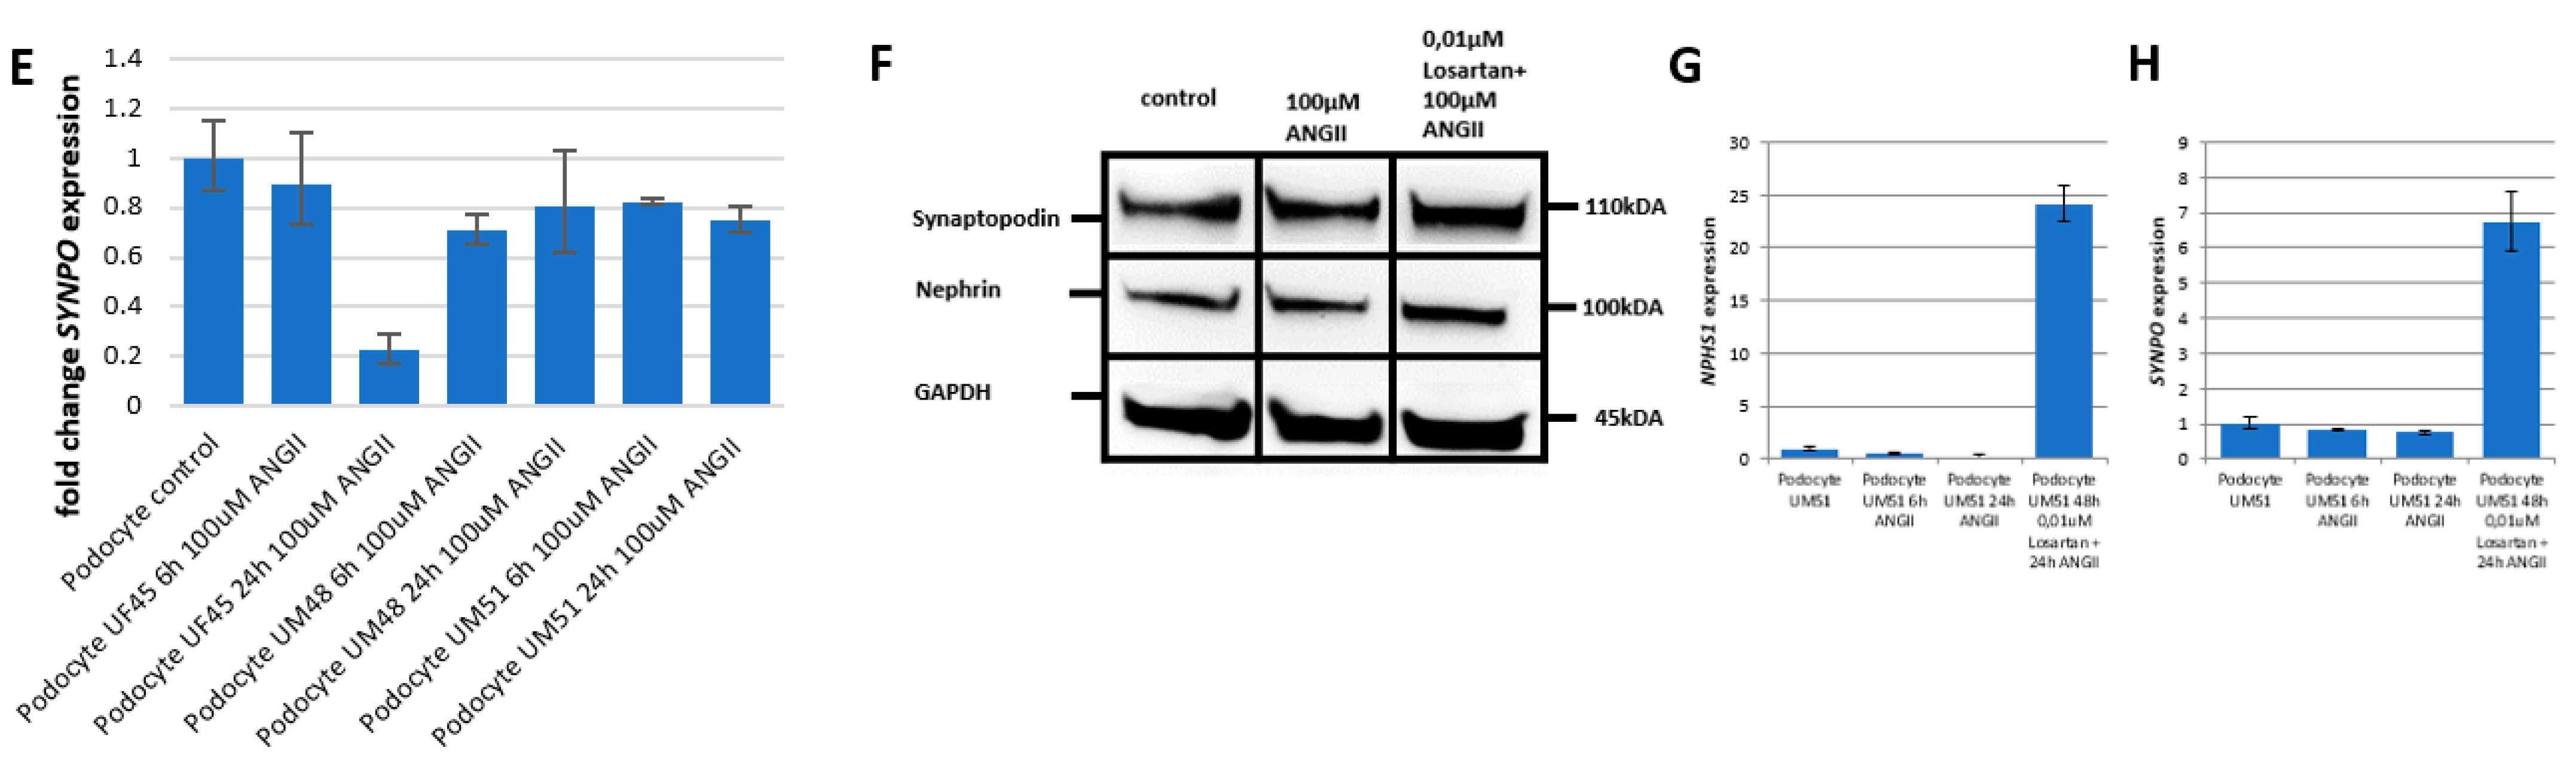
3.3. Effect of Angiotensin II (ANGII) on Podocyte Morphology and Expression of Podocyte-Specific Genes
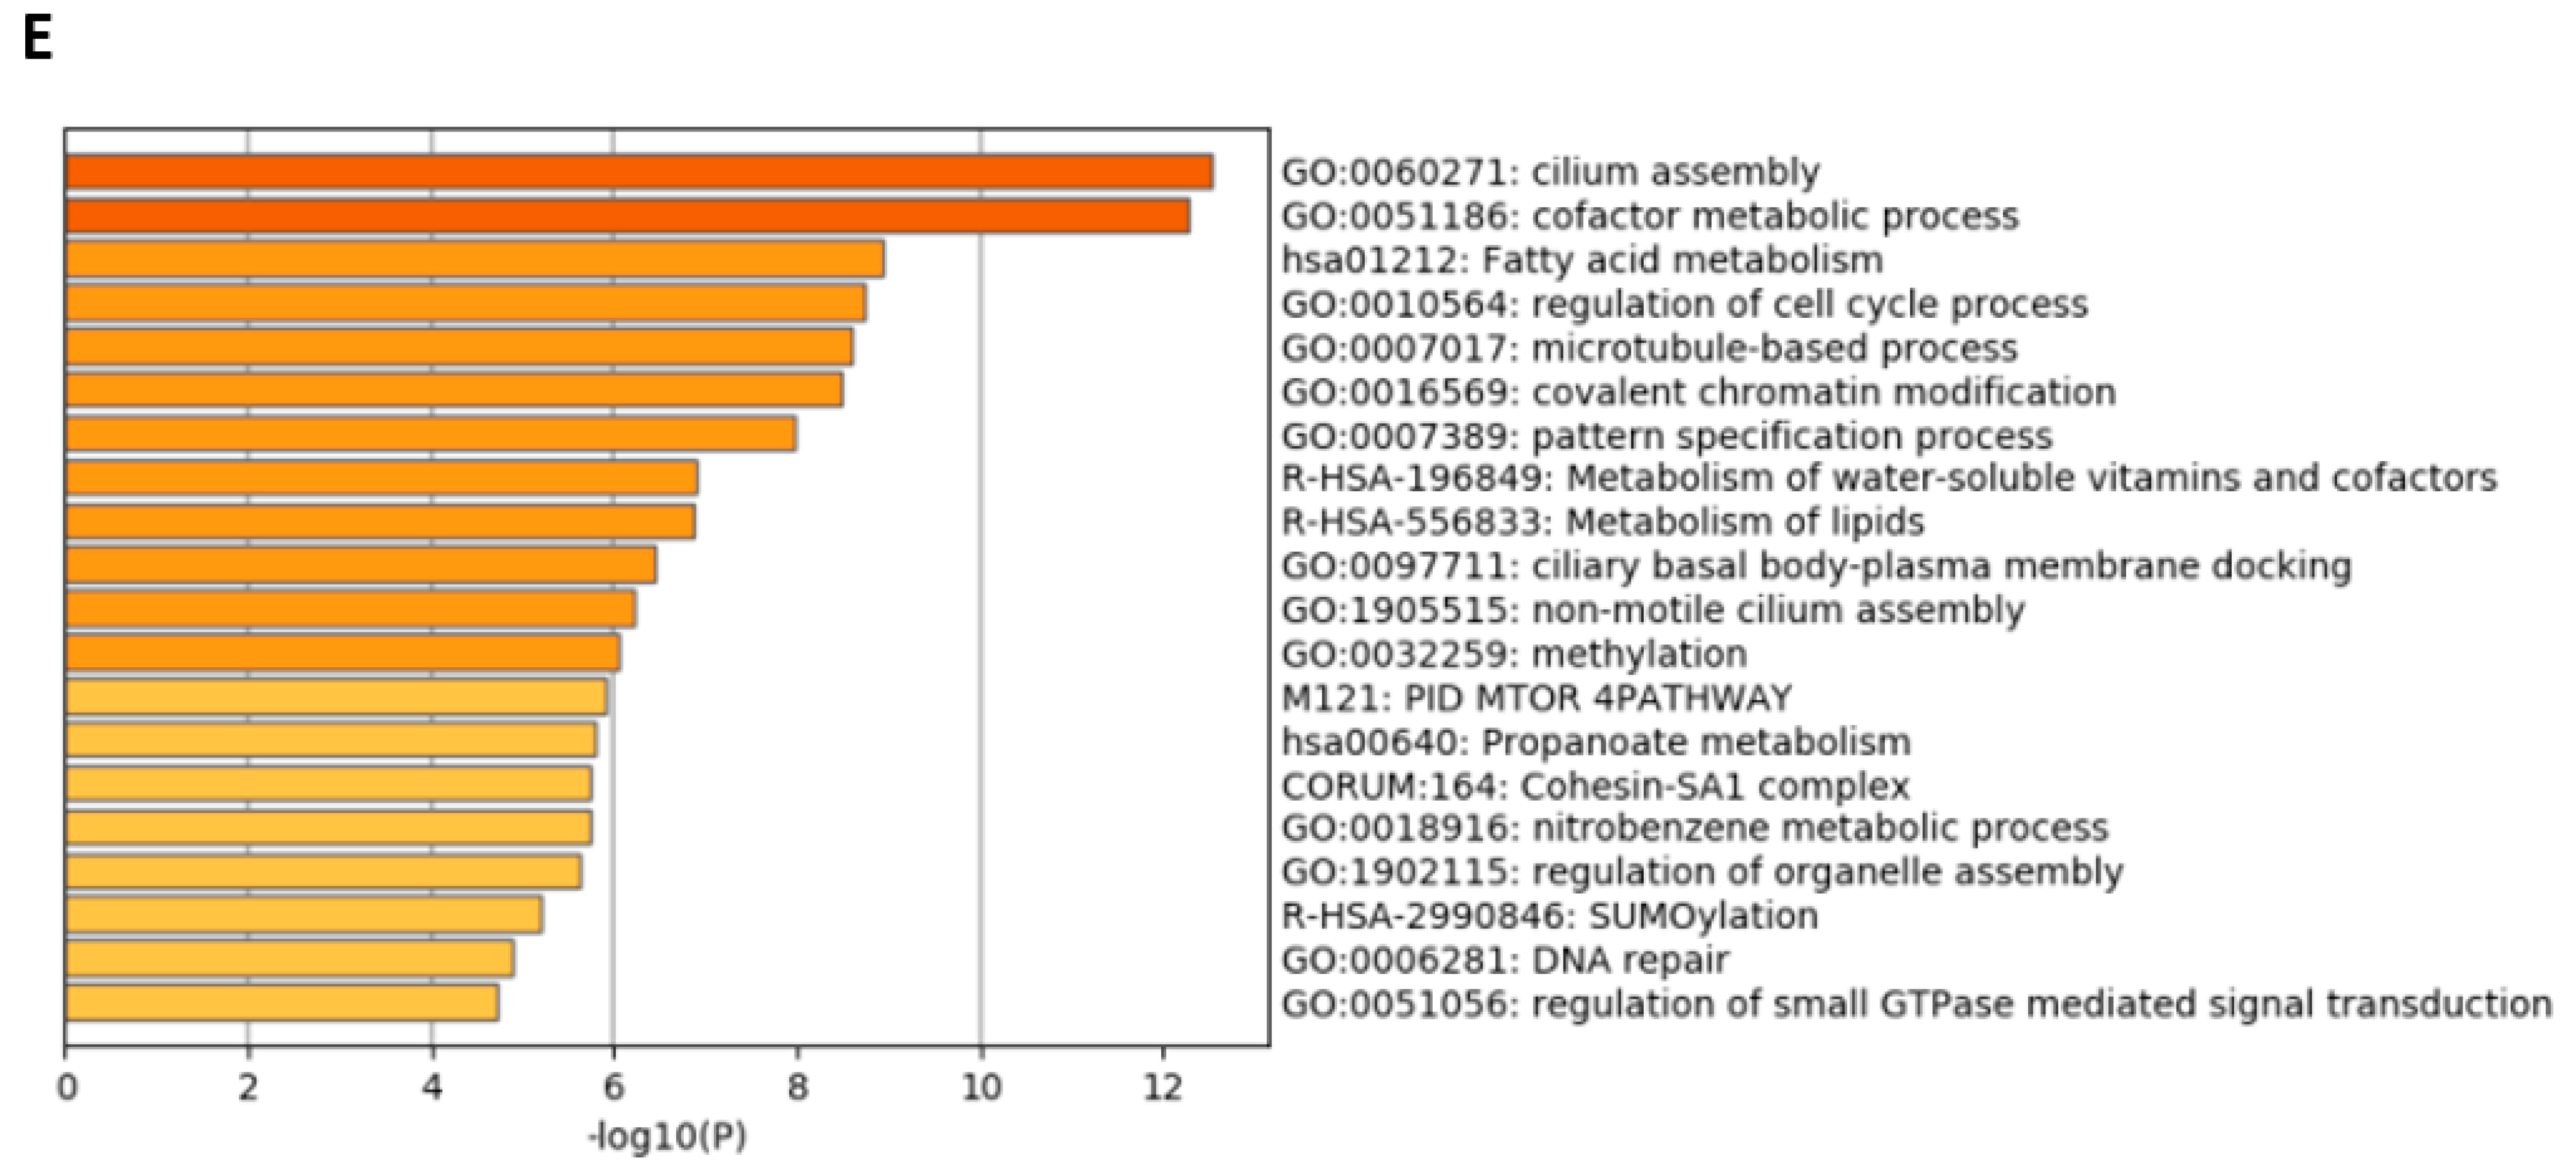
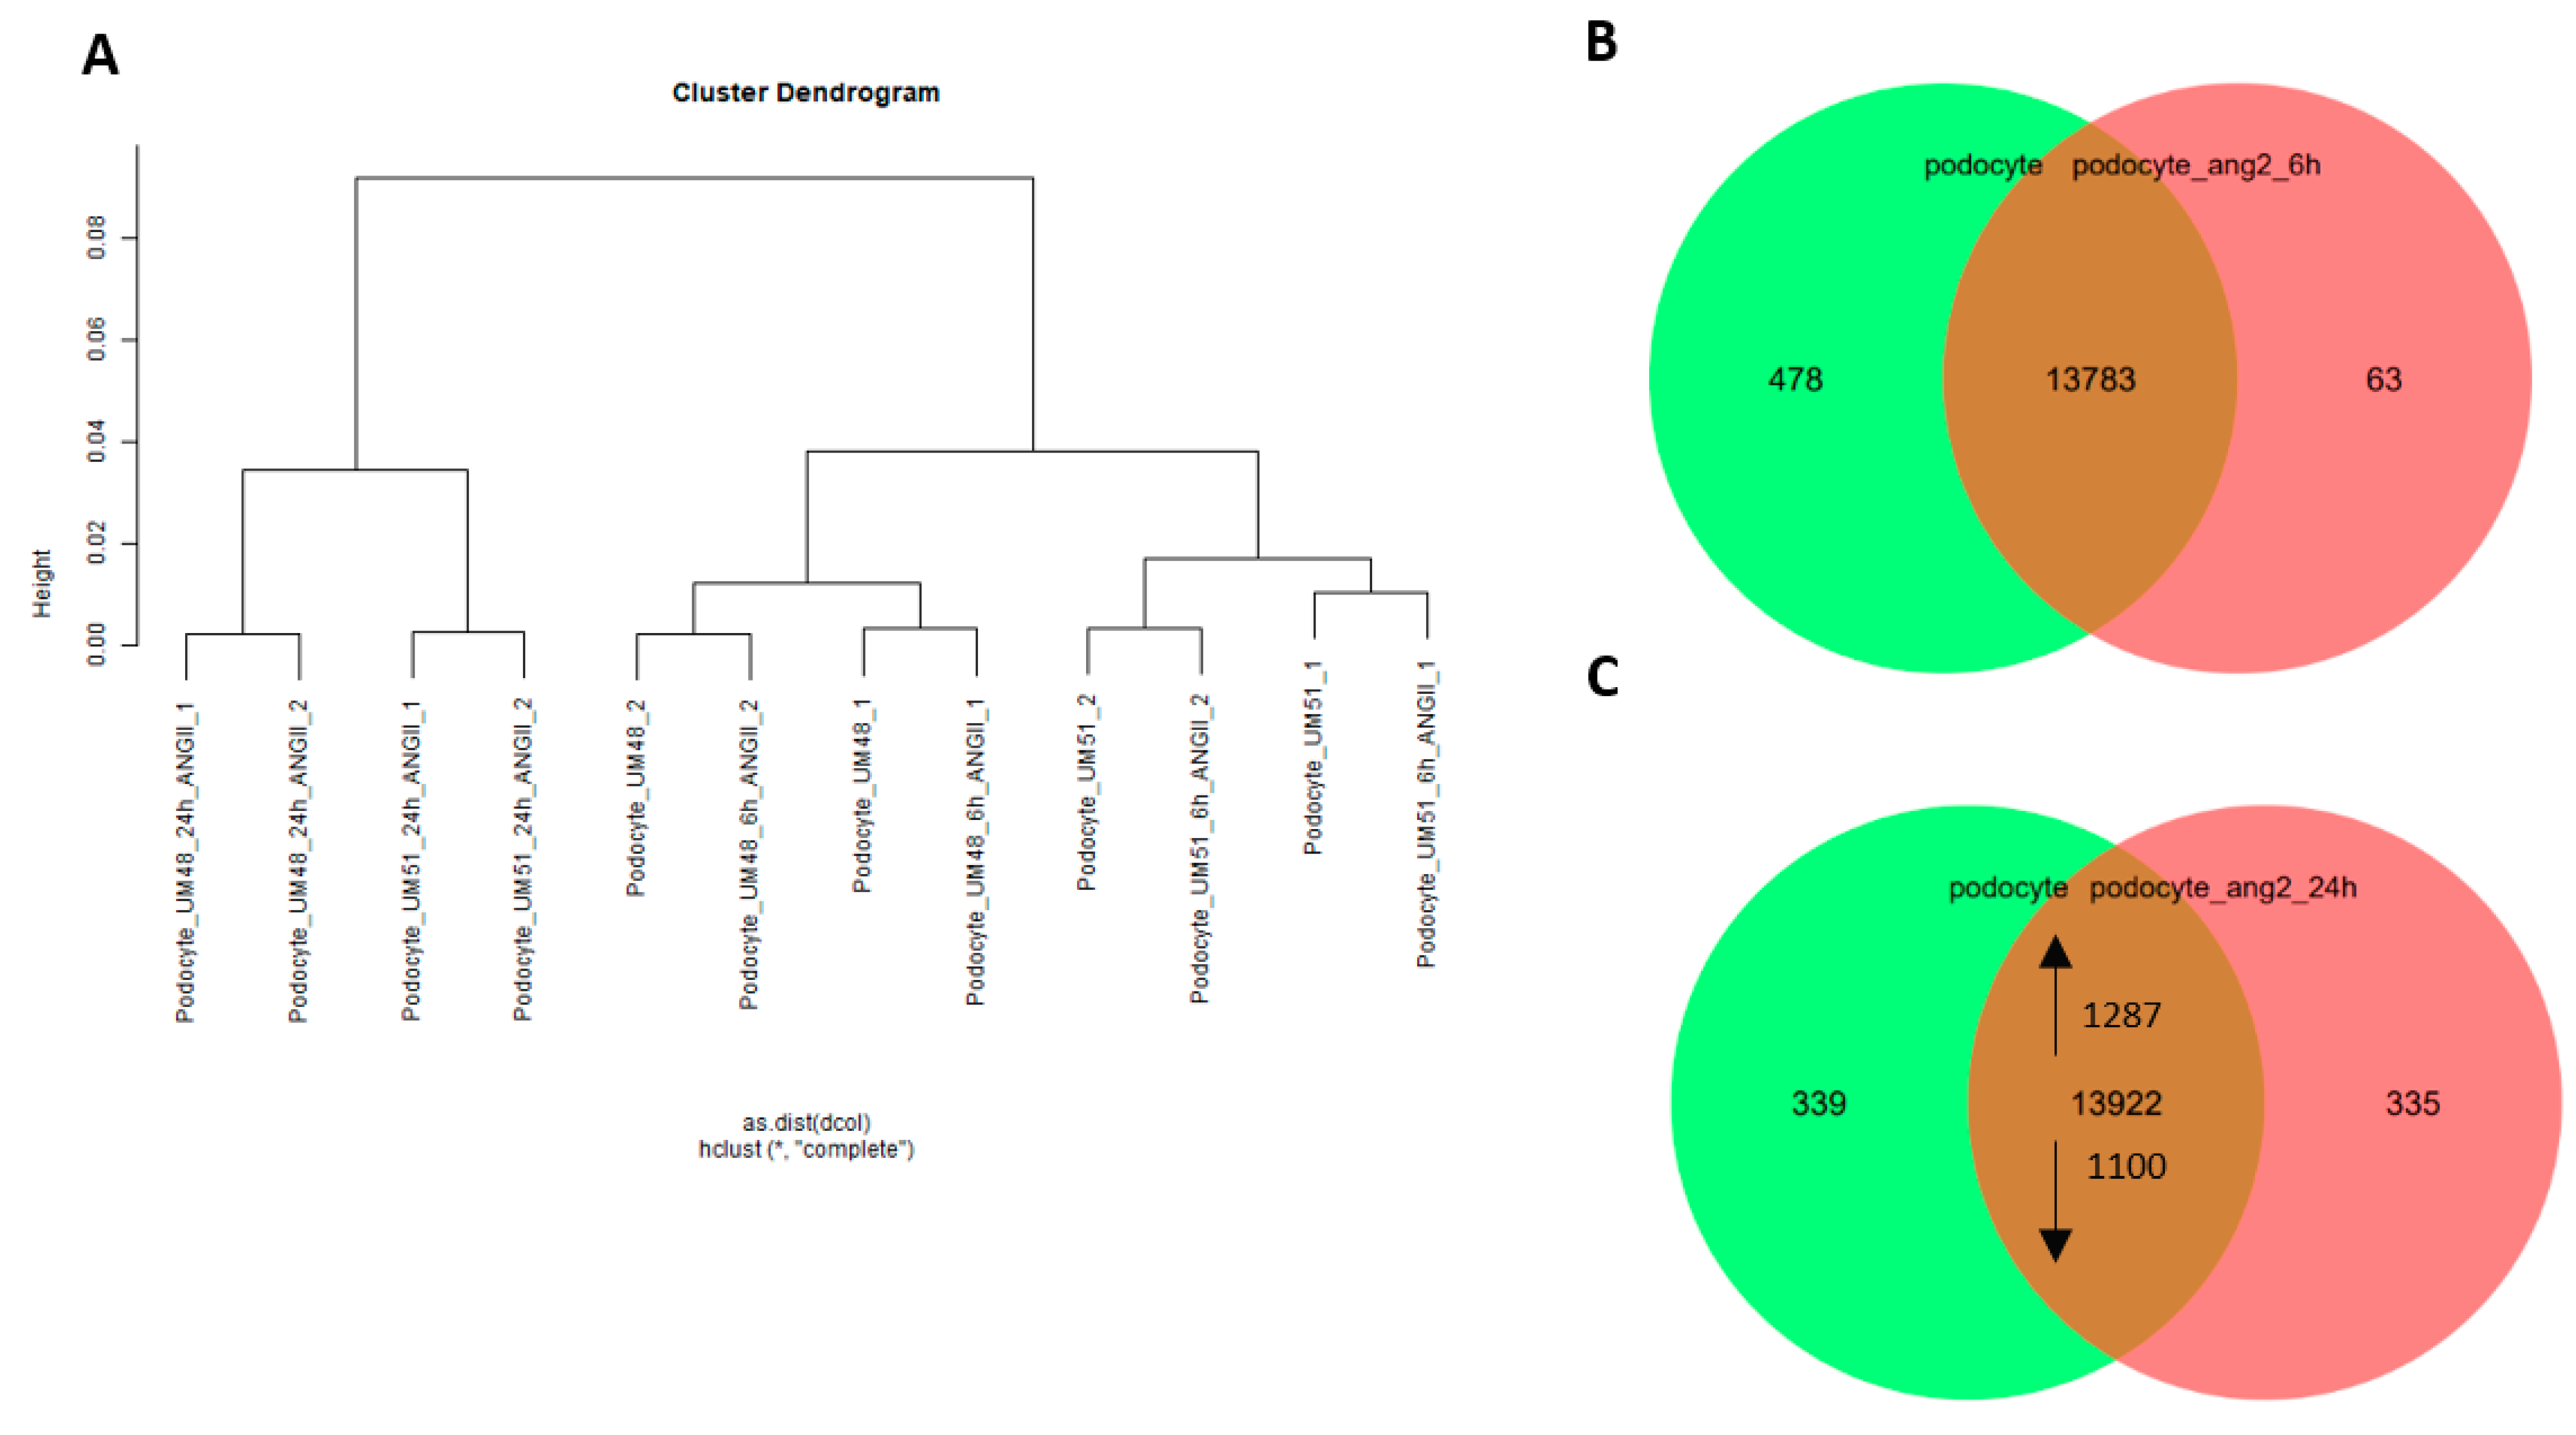
3.4. Effects of Angiotensin II on the Transcriptome and Secretome of Urine-Derived Podocytes
4. Discussion
Supplementary Materials
Author Contributions
Funding
Institutional Review Board Statement
Informed Consent Statement
Data Availability Statement
Acknowledgments
Conflicts of Interest
References
- Greka, A.; Mundel, P. Cell biology and pathology of podocytes. Annu. Rev. Physiol. 2012, 74, 299–323. [Google Scholar] [CrossRef] [PubMed] [Green Version]
- Critchley, D.R. Focal adhesions—The cytoskeletal connection. Curr. Opin. Cell Biol. 2000, 12, 133–139. [Google Scholar] [CrossRef] [PubMed]
- El-Husseini, A.E.; Kwasnicka, D.; Yamada, T.; Hirohashi, S.; Vincent, S.R. BERP, a novel ring finger protein, binds to alpha-actinin-4. Biochem. Biophys. Res. Commun. 2000, 267, 906–911. [Google Scholar] [CrossRef] [PubMed]
- Kestilä, M.; Lenkkeri, U.; Männikkö, M.; Lamerdin, J.; McCready, P.; Putaala, H.; Ruotsalainen, V.; Morita, T.; Nissinen, M.; Herva, R.; et al. Positionally Cloned Gene for a Novel Glomerular Protein—Nephrin—Is Mutated in Congenital Nephrotic Syndrome. Mol. Cell 1998, 1, 575–582. [Google Scholar] [CrossRef] [PubMed]
- Boute, N.; Gribouval, O.; Roselli, S.; Benessy, F.; Lee, H.; Fuchshuber, A.; Dahan, K.; Gubler, M.C.; Niaudet, P.; Antignac, C. NPHS2, encoding the glomerular protein podocin, is mutated in autosomal recessive steroid-resistant nephrotic syndrome. Nat. Genet. 2000, 24, 349–354. [Google Scholar] [CrossRef] [PubMed]
- Tryggvason, K.; Pikkarainen, T.; Patrakka, J. Nck links nephrin to actin in kidney podocytes. Cell 2006, 125, 221–224. [Google Scholar] [CrossRef] [Green Version]
- Carey, R.M.; Whelton, P.K. Prevention, Detection, Evaluation, and Management of High Blood Pressure in Adults: Synopsis of the 2017 American College of Cardiology/American Heart Association Hypertension Guideline. Ann. Intern. Med. 2018, 168, 351–358. [Google Scholar] [CrossRef]
- Ito, M.; Oliverio, M.I.; Mannon, P.J.; Best, C.F.; Maeda, N.; Smithies, O.; Coffman, T.M. Regulation of blood pressure by the type 1A angiotensin II receptor gene. Proc. Natl. Acad. Sci. USA 1995, 92, 3521–3525. [Google Scholar] [CrossRef] [PubMed] [Green Version]
- Shanmugam, S.; Sandberg, K. Ontogeny of angiotensin II receptors. Cell Biol. Int. 1996, 20, 169–176. [Google Scholar] [CrossRef] [PubMed]
- Sharma, M.; Sharma, R.; Greene, A.S.; McCarthy, E.T.; Savin, V.J. Documentation of angiotensin II receptors in glomerular epithelial cells. Am. J. Physiol. 1998, 274, F623–F627. [Google Scholar] [CrossRef] [PubMed]
- Jia, J.; Ding, G.; Zhu, J.; Chen, C.; Liang, W.; Franki, N.; Singhal, P.C. Angiotensin II infusion induces nephrin expression changes and podocyte apoptosis. Am. J. Nephrol. 2008, 28, 500–507. [Google Scholar] [CrossRef] [PubMed]
- Liu, X.; Zhang, H.; Wang, Q.; Yu, K.; Wang, R.; Sun, J. Blockade of vascular endothelial growth factor-A/receptor 2 exhibits a protective effect on angiotensin-II stimulated podocytes. Mol. Med. Rep. 2015, 12, 4340–4345. [Google Scholar] [CrossRef] [PubMed]
- Rüster, C.; Wolf, G. Renin-angiotensin-aldosterone system and progression of renal disease. J. Am. Soc. Nephrol. 2006, 17, 2985–2991. [Google Scholar] [CrossRef] [PubMed]
- Ding, G.; Reddy, K.; Kapasi, A.A.; Franki, N.; Gibbons, N.; Kasinath, B.S.; Singhal, P.C. Angiotensin II induces apoptosis in rat glomerular epithelial cells. Am. J. Physiol. Ren. Physiol. 2002, 283, F173–F180. [Google Scholar] [CrossRef] [Green Version]
- Kriz, W.; Gretz, N.; Lemley, K.V. Progression of glomerular diseases: Is the podocyte the culprit? Kidney Int. 1998, 54, 687–697. [Google Scholar] [CrossRef] [Green Version]
- Fukuda, A.; Wickman, L.T.; Venkatareddy, M.P.; Sato, Y.; Chowdhury, M.A.; Wang, S.Q.; Shedden, K.A.; Dysko, R.C.; Wiggins, J.E.; Wiggins, R.C. Angiotensin II-dependent persistent podocyte loss from destabilized glomeruli causes progression of end stage kidney disease. Kidney Int. 2012, 81, 40–55. [Google Scholar] [CrossRef] [PubMed] [Green Version]
- Hidaka, T.; Suzuki, Y.; Yamashita, M.; Shibata, T.; Tanaka, Y.; Horikoshi, S.; Tomino, Y. Amelioration of crescentic glomerulonephritis by RhoA kinase inhibitor, Fasudil, through podocyte protection and prevention of leukocyte migration. Am. J. Pathol. 2008, 172, 603–614. [Google Scholar] [CrossRef] [Green Version]
- Bariéty, J.; Bruneval, P.; Meyrier, A.; Mandet, C.; Hill, G.; Jacquot, C. Podocyte involvement in human immune crescentic glomerulonephritis. Kidney Int. 2005, 68, 1109–1119. [Google Scholar] [CrossRef] [Green Version]
- Morioka, Y.; Koike, H.; Ikezumi, Y.; Ito, Y.; Oyanagi, A.; Gejyo, F.; Shimizu, F.; Kawachi, H. Podocyte injuries exacerbate mesangial proliferative glomerulonephritis. Kidney Int. 2001, 60, 2192–2204. [Google Scholar] [CrossRef] [Green Version]
- Saleem, M.A.; O’Hare, M.J.; Reiser, J.; Coward, R.J.; Inward, C.D.; Farren, T.; Xing, C.Y.; Ni, L.; Mathieson, P.W.; Mundel, P. A conditionally immortalized human podocyte cell line demonstrating nephrin and podocin expression. J. Am. Soc. Nephrol. 2002, 13, 630–638. [Google Scholar] [PubMed]
- Srivastava, T.; Sharma, M.; Yew, K.-H.; Sharma, R.; Duncan, R.S.; Saleem, M.A.; McCarthy, E.T.; Kats, A.; Cudmore, P.A.; Alon, U.S.; et al. LPS and PAN-induced podocyte injury in an in vitro model of minimal change disease: Changes in TLR profile. J. Cell Commun. Signal. 2013, 7, 49–60. [Google Scholar] [CrossRef] [PubMed] [Green Version]
- Yang, Y.; Yang, Q.; Yang, J.; Ma, Y.; Ding, G. Angiotensin II induces cholesterol accumulation and injury in podocytes. Sci. Rep. 2017, 7, 10672. [Google Scholar] [CrossRef] [PubMed] [Green Version]
- Musah, S.; Dimitrakakis, N.; Camacho, D.M.; Church, G.M.; Ingber, D.E. Directed differentiation of human induced pluripotent stem cells into mature kidney podocytes and establishment of a Glomerulus Chip. Nat. Protoc. 2018, 13, 1662–1685. [Google Scholar] [CrossRef]
- Freedman, B.S.; Brooks, C.R.; Lam, A.Q.; Fu, H.; Morizane, R.; Agrawal, V.; Saad, A.F.; Li, M.K.; Hughes, M.R.; Werff, R.V.; et al. Modelling kidney disease with CRISPR-mutant kidney organoids derived from human pluripotent epiblast spheroids. Nat. Commun. 2015, 6, 8715. [Google Scholar] [CrossRef] [PubMed] [Green Version]
- Sharmin, S.; Taguchi, A.; Kaku, Y.; Yoshimura, Y.; Ohmori, T.; Sakuma, T.; Mukoyama, M.; Yamamoto, T.; Kurihara, H.; Nishinakamura, R. Human Induced Pluripotent Stem Cell-Derived Podocytes Mature into Vascularized Glomeruli upon Experimental Transplantation. J. Am. Soc. Nephrol. 2016, 27, 1778–1791. [Google Scholar] [CrossRef] [PubMed] [Green Version]
- Taguchi, A.; Kaku, Y.; Ohmori, T.; Sharmin, S.; Ogawa, M.; Sasaki, H.; Nishinakamura, R. Redefining the in vivo origin of metanephric nephron progenitors enables generation of complex kidney structures from pluripotent stem cells. Cell Stem Cell 2014, 14, 53–67. [Google Scholar] [CrossRef] [PubMed] [Green Version]
- Takasato, M.; Er, P.X.; Chiu, H.S.; Maier, B.; Baillie, G.J.; Ferguson, C.; Parton, R.G.; Wolvetang, E.J.; Roost, M.S.; Chuva de Sousa Lopes, S.M.; et al. Kidney organoids from human iPS cells contain multiple lineages and model human nephrogenesis. Nature 2015, 526, 564–568. [Google Scholar] [CrossRef] [PubMed]
- Rahman, M.S.; Wruck, W.; Spitzhorn, L.-S.; Nguyen, L.; Bohndorf, M.; Martins, S.; Asar, F.; Ncube, A.; Erichsen, L.; Graffmann, N.; et al. The FGF, TGFβ and WNT axis Modulate Self-renewal of Human SIX2+ Urine Derived Renal Progenitor Cells. Sci. Rep. 2020, 10, 739. [Google Scholar] [CrossRef] [PubMed] [Green Version]
- Schmittgen, T.D.; Livak, K.J. Analyzing real-time PCR data by the comparative C(T) method. Nat. Protoc. 2008, 3, 1101–1108. [Google Scholar] [CrossRef] [PubMed]
- Santourlidis, S.; Trompeter, H.-I.; Weinhold, S.; Eisermann, B.; Meyer, K.L.; Wernet, P.; Uhrberg, M. Crucial role of DNA methylation in determination of clonally distributed killer cell Ig-like receptor expression patterns in NK cells. J. Immunol. 2002, 169, 4253–4261. [Google Scholar] [CrossRef] [PubMed] [Green Version]
- Zhou, Y.; Zhou, B.; Pache, L.; Chang, M.; Khodabakhshi, A.H.; Tanaseichuk, O.; Benner, C.; Chanda, S.K. Metascape provides a biologist-oriented resource for the analysis of systems-level datasets. Nat. Commun. 2019, 10, 1523. [Google Scholar] [CrossRef] [PubMed]
- Schneider, C.A.; Rasband, W.S.; Eliceiri, K.W. NIH Image to ImageJ: 25 years of image analysis. Nat. Methods 2012, 9, 671–675. [Google Scholar] [CrossRef] [PubMed]
- Gentleman, R.C.; Carey, V.J.; Bates, D.M.; Bolstad, B.; Dettling, M.; Dudoit, S.; Ellis, B.; Gautier, L.; Ge, Y.; Gentry, J.; et al. Bioconductor: Open software development for computational biology and bioinformatics. Genome Biol. 2004, 5, R80. [Google Scholar] [CrossRef] [Green Version]
- Du, P.; Kibbe, W.A.; Lin, S.M. lumi: A pipeline for processing Illumina microarray. Bioinformatics 2008, 24, 1547–1548. [Google Scholar] [CrossRef] [Green Version]
- Graffmann, N.; Ring, S.; Kawala, M.-A.; Wruck, W.; Ncube, A.; Trompeter, H.-I.; Adjaye, J. Modeling Nonalcoholic Fatty Liver Disease with Human Pluripotent Stem Cell-Derived Immature Hepatocyte-Like Cells Reveals Activation of PLIN2 and Confirms Regulatory Functions of Peroxisome Proliferator-Activated Receptor Alpha. Stem Cells Dev. 2016, 25, 1119–1133. [Google Scholar] [CrossRef] [Green Version]
- Kanehisa, M.; Furumichi, M.; Tanabe, M.; Sato, Y.; Morishima, K. KEGG: New perspectives on genomes, pathways, diseases and drugs. Nucleic Acids Res. 2017, 45, D353–D361. [Google Scholar] [CrossRef] [Green Version]
- Carvalho, B.S.; Irizarry, R.A. A framework for oligonucleotide microarray preprocessing. Bioinformatics 2010, 26, 2363–2367. [Google Scholar] [CrossRef]
- Gassmann, M.; Grenacher, B.; Rohde, B.; Vogel, J. Quantifying Western blots: Pitfalls of densitometry. Electrophoresis 2009, 30, 1845–1855. [Google Scholar] [CrossRef]
- Miller, R.G. Beyond Anova: Basics of Applied Statistics, 1st ed.; Chapman & Hall: London, UK, 1997; ISBN 9780412070112. [Google Scholar]
- Stegbauer, J.; Coffman, T.M. New insights into angiotensin receptor actions: From blood pressure to aging. Curr. Opin. Nephrol. Hypertens. 2011, 20, 84–88. [Google Scholar] [CrossRef] [Green Version]
- Kaschina, E.; Unger, T. Angiotensin AT1/AT2 receptors: Regulation, signalling and function. Blood Press. 2003, 12, 70–88. [Google Scholar] [CrossRef]
- Ronconi, E.; Sagrinati, C.; Angelotti, M.L.; Lazzeri, E.; Mazzinghi, B.; Ballerini, L.; Parente, E.; Becherucci, F.; Gacci, M.; Carini, M.; et al. Regeneration of glomerular podocytes by human renal progenitors. J. Am. Soc. Nephrol. 2009, 20, 322–332. [Google Scholar] [CrossRef] [PubMed] [Green Version]
- Katsuyama, K.; Fujinaka, H.; Yamamoto, K.; Nameta, M.; Yaoita, E.; Yoshida, Y.; Tomizawa, S.; Uchiyama, M.; Yamamoto, T. Expression of the chemokine fractalkine (FKN/CX3CL1) by podocytes in normal and proteinuric rat kidney glomerulus. Nephron Exp. Nephrol. 2009, 113, e45–e56. [Google Scholar] [CrossRef] [PubMed]
- Miao, J.; Fan, Q.; Cui, Q.; Zhang, H.; Chen, L.; Wang, S.; Guan, N.; Guan, Y.; Ding, J. Newly identified cytoskeletal components are associated with dynamic changes of podocyte foot processes. Nephrol. Dial. Transpl. 2009, 24, 3297–3305. [Google Scholar] [CrossRef] [Green Version]
- Nistala, R.; Habibi, J.; Aroor, A.; Sowers, J.R.; Hayden, M.R.; Meuth, A.; Knight, W.; Hancock, T.; Klein, T.; DeMarco, V.G.; et al. DPP4 inhibition attenuates filtration barrier injury and oxidant stress in the zucker obese rat. Obesity 2014, 22, 2172–2179. [Google Scholar] [CrossRef] [Green Version]
- Saito, A.; Miyauchi, N.; Hashimoto, T.; Karasawa, T.; Han, G.D.; Kayaba, M.; Sumi, T.; Tomita, M.; Ikezumi, Y.; Suzuki, K.; et al. Neurexin-1, a presynaptic adhesion molecule, localizes at the slit diaphragm of the glomerular podocytes in kidneys. Am. J. Physiol. Regul. Integr. Comp. Physiol. 2011, 300, R340-8. [Google Scholar] [CrossRef] [Green Version]
- Endlich, N.; Lange, T.; Kuhn, J.; Klemm, P.; Kotb, A.M.; Siegerist, F.; Kindt, F.; Lindenmeyer, M.T.; Cohen, C.D.; Kuss, A.W.; et al. BDNF: mRNA expression in urine cells of patients with chronic kidney disease and its role in kidney function. J. Cell. Mol. Med. 2018, 22, 5265–5277. [Google Scholar] [CrossRef]
- Gutwein, P.; Abdel-Bakky, M.S.; Schramme, A.; Doberstein, K.; Kämpfer-Kolb, N.; Amann, K.; Hauser, I.A.; Obermüller, N.; Bartel, C.; Abdel-Aziz, A.-A.H.; et al. CXCL16 is expressed in podocytes and acts as a scavenger receptor for oxidized low-density lipoprotein. Am. J. Pathol. 2009, 174, 2061–2072. [Google Scholar] [CrossRef] [Green Version]
- Li, Z.; Chen, H.; Zhong, F.; Zhang, W.; Lee, K.; He, J.C. Expression of Glutamate Receptor Subtype 3 Is Epigenetically Regulated in Podocytes under Diabetic Conditions. Kidney Dis. 2019, 5, 34–42. [Google Scholar] [CrossRef]
- Eitner, F.; Ostendorf, T.; Kretzler, M.; Cohen, C.D.; Eriksson, U.; Gröne, H.-J.; Floege, J. PDGF-C expression in the developing and normal adult human kidney and in glomerular diseases. J. Am. Soc. Nephrol. 2003, 14, 1145–1153. [Google Scholar] [CrossRef] [Green Version]
- Rastaldi, M.P.; Armelloni, S.; Berra, S.; Calvaresi, N.; Corbelli, A.; Giardino, L.A.; Li, M.; Wang, G.Q.; Fornasieri, A.; Villa, A.; et al. Glomerular podocytes contain neuron-like functional synaptic vesicles. FASEB J. 2006, 20, 976–978. [Google Scholar] [CrossRef]
- Müller-Deile, J.; Worthmann, K.; Saleem, M.; Tossidou, I.; Haller, H.; Schiffer, M. The balance of autocrine VEGF-A and VEGF-C determines podocyte survival. Am. J. Physiol. Ren. Physiol. 2009, 297, F1656–F1667. [Google Scholar] [CrossRef]
- Reidy, K.; Tufro, A. Semaphorins in kidney development and disease: Modulators of ureteric bud branching, vascular morphogenesis, and podocyte-endothelial crosstalk. Pediatr. Nephrol. 2011, 26, 1407–1412. [Google Scholar] [CrossRef] [PubMed] [Green Version]
- Reidy, K.J.; Villegas, G.; Teichman, J.; Veron, D.; Shen, W.; Jimenez, J.; Thomas, D.; Tufro, A. Semaphorin3a regulates endothelial cell number and podocyte differentiation during glomerular development. Development 2009, 136, 3979–3989. [Google Scholar] [CrossRef] [PubMed] [Green Version]
- Saxén, L.; Sariola, H. Early organogenesis of the kidney. Pediatr. Nephrol. 1987, 1, 385–392. [Google Scholar] [CrossRef] [PubMed]
- Naim, E.; Bernstein, A.; Bertram, J.F.; Caruana, G. Mutagenesis of the epithelial polarity gene, discs large 1, perturbs nephrogenesis in the developing mouse kidney. Kidney Int. 2005, 68, 955–965. [Google Scholar] [CrossRef] [PubMed] [Green Version]
- Smeets, B.; Uhlig, S.; Fuss, A.; Mooren, F.; Wetzels, J.F.M.; Floege, J.; Moeller, M.J. Tracing the origin of glomerular extracapillary lesions from parietal epithelial cells. J. Am. Soc. Nephrol. 2009, 20, 2604–2615. [Google Scholar] [CrossRef] [Green Version]
- Appel, D.; Kershaw, D.B.; Smeets, B.; Yuan, G.; Fuss, A.; Frye, B.; Elger, M.; Kriz, W.; Floege, J.; Moeller, M.J. Recruitment of podocytes from glomerular parietal epithelial cells. J. Am. Soc. Nephrol. 2009, 20, 333–343. [Google Scholar] [CrossRef] [Green Version]
- Hay, E.D.; Zuk, A. Transformations between epithelium and mesenchyme: Normal, pathological, and experimentally induced. Am. J. Kidney Dis. 1995, 26, 678–690. [Google Scholar] [CrossRef]
- Strippoli, R.; Loureiro, J.; Moreno, V.; Benedicto, I.; Pérez Lozano, M.L.; Barreiro, O.; Pellinen, T.; Minguet, S.; Foronda, M.; Osteso, M.T.; et al. Caveolin-1 deficiency induces a MEK-ERK1/2-Snail-1-dependent epithelial-mesenchymal transition and fibrosis during peritoneal dialysis. EMBO Mol. Med. 2015, 7, 102–123. [Google Scholar] [CrossRef]
- Yang, J.; Weinberg, R.A. Epithelial-mesenchymal transition: At the crossroads of development and tumor metastasis. Dev. Cell 2008, 14, 818–829. [Google Scholar] [CrossRef] [Green Version]
- Berdasco, M.; Esteller, M. Aberrant epigenetic landscape in cancer: How cellular identity goes awry. Dev. Cell 2010, 19, 698–711. [Google Scholar] [CrossRef] [PubMed] [Green Version]
- Jair, K.-W.; Bachman, K.E.; Suzuki, H.; Ting, A.H.; Rhee, I.; Yen, R.-W.C.; Baylin, S.B.; Schuebel, K.E. De novo CpG island methylation in human cancer cells. Cancer Res. 2006, 66, 682–692. [Google Scholar] [CrossRef] [PubMed] [Green Version]
- Tahiliani, M.; Koh, K.P.; Shen, Y.; Pastor, W.A.; Bandukwala, H.; Brudno, Y.; Agarwal, S.; Iyer, L.M.; Liu, D.R.; Aravind, L.; et al. Conversion of 5-methylcytosine to 5-hydroxymethylcytosine in mammalian DNA by MLL partner TET1. Science 2009, 324, 930–935. [Google Scholar] [CrossRef] [PubMed] [Green Version]
- Ito, S.; D’Alessio, A.C.; Taranova, O.V.; Hong, K.; Sowers, L.C.; Zhang, Y. Role of Tet proteins in 5mC to 5hmC conversion, ES-cell self-renewal and inner cell mass specification. Nature 2010, 466, 1129–1133. [Google Scholar] [CrossRef] [Green Version]
- Klutstein, M.; Nejman, D.; Greenfield, R.; Cedar, H. DNA Methylation in Cancer and Aging. Cancer Res. 2016, 76, 3446–3450. [Google Scholar] [CrossRef] [Green Version]
- Shen, X.; Liu, Y.; Hsu, Y.-J.; Fujiwara, Y.; Kim, J.; Mao, X.; Yuan, G.-C.; Orkin, S.H. EZH1 mediates methylation on histone H3 lysine 27 and complements EZH2 in maintaining stem cell identity and executing pluripotency. Mol. Cell 2008, 32, 491–502. [Google Scholar] [CrossRef] [Green Version]
- César-Razquin, A.; Snijder, B.; Frappier-Brinton, T.; Isserlin, R.; Gyimesi, G.; Bai, X.; Reithmeier, R.A.; Hepworth, D.; Hediger, M.A.; Edwards, A.M.; et al. A Call for Systematic Research on Solute Carriers. Cell 2015, 162, 478–487. [Google Scholar] [CrossRef] [Green Version]
- Patel, S.; Rauf, A.; Khan, H.; Abu-Izneid, T. Renin-angiotensin-aldosterone (RAAS): The ubiquitous system for homeostasis and pathologies. Biomed. Pharmacother. 2017, 94, 317–325. [Google Scholar] [CrossRef]
- Crowley, S.D.; Gurley, S.B.; Herrera, M.J.; Ruiz, P.; Griffiths, R.; Kumar, A.P.; Kim, H.-S.; Smithies, O.; Le, T.H.; Coffman, T.M. Angiotensin II causes hypertension and cardiac hypertrophy through its receptors in the kidney. Proc. Natl. Acad. Sci. USA 2006, 103, 17985–17990. [Google Scholar] [CrossRef] [Green Version]
- Barreto-Chaves, M.L.; Mello-Aires, M. Effect of luminal angiotensin II and ANP on early and late cortical distal tubule HCO3-reabsorption. Am. J. Physiol. 1996, 271, F977–F984. [Google Scholar] [CrossRef]
- Kwon, T.-H.; Nielsen, J.; Kim, Y.-H.; Knepper, M.A.; Frøkiaer, J.; Nielsen, S. Regulation of sodium transporters in the thick ascending limb of rat kidney: Response to angiotensin II. Am. J. Physiol. Ren. Physiol. 2003, 285, F152–F165. [Google Scholar] [CrossRef] [Green Version]
- Rocque, B.L.; Babayeva, S.; Li, J.; Leung, V.; Nezvitsky, L.; Cybulsky, A.V.; Gros, P.; Torban, E. Deficiency of the planar cell polarity protein Vangl2 in podocytes affects glomerular morphogenesis and increases susceptibility to injury. J. Am. Soc. Nephrol. 2015, 26, 576–586. [Google Scholar] [CrossRef] [PubMed] [Green Version]
- Tojo, A.; Tisher, C.C.; Madsen, K.M. Angiotensin II regulates H(+)-ATPase activity in rat cortical collecting duct. Am. J. Physiol. 1994, 267, F1045–F1051. [Google Scholar] [CrossRef] [PubMed]
- Xie, K.; Xu, C.; Zhang, M.; Wang, M.; Min, L.; Qian, C.; Wang, Q.; Ni, Z.; Mou, S.; Dai, H.; et al. Yes-associated protein regulates podocyte cell cycle re-entry and dedifferentiation in adriamycin-induced nephropathy. Cell Death Dis. 2019, 10, 915. [Google Scholar] [CrossRef]
- Wang, T.; Giebisch, G. Effects of angiotensin II on electrolyte transport in the early and late distal tubule in rat kidney. Am. J. Physiol. 1996, 271, F143–F149. [Google Scholar] [CrossRef]
- Faubert, P.F.; Chou, S.Y.; Porush, J.G. Regulation of papillary plasma flow by angiotensin II. Kidney Int. 1987, 32, 472–478. [Google Scholar] [CrossRef] [Green Version]
- Hall, J.E. Control of sodium excretion by angiotensin II: Intrarenal mechanisms and blood pressure regulation. Am. J. Physiol. 1986, 250, R960–R972. [Google Scholar] [CrossRef]
- Ruan, X.; Oliverio, M.I.; Coffman, T.M.; Arendshorst, W.J. Renal vascular reactivity in mice: AngII-induced vasoconstriction in AT1A receptor null mice. J. Am. Soc. Nephrol. 1999, 10, 2620–2630. [Google Scholar]
- Wang, C.T.; Zou, L.X.; Navar, L.G. Renal responses to AT1 blockade in angiotensin II-induced hypertensive rats. J. Am. Soc. Nephrol. 1997, 8, 535–542. [Google Scholar]
- Wang, C.T.; Chin, S.Y.; Navar, L.G. Impairment of pressure-natriuresis and renal autoregulation in ANG II-infused hypertensive rats. Am. J. Physiol. Ren. Physiol. 2000, 279, F319–F325. [Google Scholar] [CrossRef]
- Ames, M.K.; Atkins, C.E.; Pitt, B. The renin-angiotensin-aldosterone system and its suppression. J. Vet. Intern. Med. 2019, 33, 363–382. [Google Scholar] [CrossRef] [PubMed] [Green Version]
- Greka, A.; Mundel, P. Calcium regulates podocyte actin dynamics. Semin. Nephrol. 2012, 32, 319–326. [Google Scholar] [CrossRef] [PubMed] [Green Version]
- Hayashi, K.; Sasamura, H.; Nakamura, M.; Azegami, T.; Oguchi, H.; Sakamaki, Y.; Itoh, H. KLF4-dependent epigenetic remodeling modulates podocyte phenotypes and attenuates proteinuria. J. Clin. Investig. 2014, 124, 2523–2537. [Google Scholar] [CrossRef] [PubMed] [Green Version]
- He, W.; Kang, Y.S.; Dai, C.; Liu, Y. Blockade of Wnt/β-catenin signaling by paricalcitol ameliorates proteinuria and kidney injury. J. Am. Soc. Nephrol. 2011, 22, 90–103. [Google Scholar] [CrossRef]
- Liu, J.; Hou, W.; Guan, T.; Tang, L.; Zhu, X.; Li, Y.; Hou, S.; Zhang, J.; Chen, H.; Huang, Y. Slit2/Robo1 signaling is involved in angiogenesis of glomerular endothelial cells exposed to a diabetic-like environment. Angiogenesis 2018, 21, 237–249. [Google Scholar] [CrossRef]
- Sakurai, A.; Ono, H.; Ochi, A.; Matsuura, M.; Yoshimoto, S.; Kishi, S.; Murakami, T.; Tominaga, T.; Nagai, K.; Abe, H.; et al. Involvement of Elf3 on Smad3 activation-dependent injuries in podocytes and excretion of urinary exosome in diabetic nephropathy. PLoS ONE 2019, 14, e0216788. [Google Scholar] [CrossRef]
- Schwarz, A.; Möller-Hackbarth, K.; Ebarasi, L.; Unnersjö Jess, D.; Zambrano, S.; Blom, H.; Wernerson, A.; Lal, M.; Patrakka, J. Coro2b, a podocyte protein downregulated in human diabetic nephropathy, is involved in the development of protamine sulphate-induced foot process effacement. Sci. Rep. 2019, 9, 8888. [Google Scholar] [CrossRef] [Green Version]
- Brand, S.; Amann, K.; Schupp, N. Angiotensin II-induced hypertension dose-dependently leads to oxidative stress and DNA damage in mouse kidneys and hearts. J. Hypertens. 2013, 31, 333–344. [Google Scholar] [CrossRef]
- Fuchshofer, R.; Ullmann, S.; Zeilbeck, L.F.; Baumann, M.; Junglas, B.; Tamm, E.R. Connective tissue growth factor modulates podocyte actin cytoskeleton and extracellular matrix synthesis and is induced in podocytes upon injury. Histochem. Cell Biol. 2011, 136, 301–319. [Google Scholar] [CrossRef]
- Kang, M.-K.; Park, S.-H.; Kim, Y.-H.; Lee, E.-J.; Antika, L.D.; Kim, D.Y.; Choi, Y.-J.; Kang, Y.-H. Chrysin ameliorates podocyte injury and slit diaphragm protein loss via inhibition of the PERK-eIF2α-ATF-CHOP pathway in diabetic mice. Acta Pharmacol. Sin. 2017, 38, 1129–1140. [Google Scholar] [CrossRef]
- Qi, H.; Casalena, G.; Shi, S.; Yu, L.; Ebefors, K.; Sun, Y.; Zhang, W.; D’Agati, V.; Schlondorff, D.; Haraldsson, B.; et al. Glomerular Endothelial Mitochondrial Dysfunction Is Essential and Characteristic of Diabetic Kidney Disease Susceptibility. Diabetes 2017, 66, 763–778. [Google Scholar] [CrossRef] [PubMed] [Green Version]
- Zou, H.-H.; Yang, P.-P.; Huang, T.-L.; Zheng, X.-X.; Xu, G.-S. PLK2 Plays an Essential Role in High D-Glucose-Induced Apoptosis, ROS Generation and Inflammation in Podocytes. Sci. Rep. 2017, 7, 4261. [Google Scholar] [CrossRef] [PubMed] [Green Version]
- Stankewich, M.C.; Moeckel, G.W.; Ji, L.; Ardito, T.; Morrow, J.S. Isoforms of Spectrin and Ankyrin Reflect the Functional Topography of the Mouse Kidney. PLoS ONE 2016, 11, e0142687. [Google Scholar] [CrossRef] [Green Version]
- Fu, Y.; Wang, C.; Zhang, D.; Chu, X.; Zhang, Y.; Li, J. miR-15b-5p ameliorated high glucose-induced podocyte injury through repressing apoptosis, oxidative stress, and inflammatory responses by targeting Sema3A. J. Cell. Physiol. 2019, 234, 20869–20878. [Google Scholar] [CrossRef]
- Aggarwal, P.K.; Veron, D.; Thomas, D.B.; Siegel, D.; Moeckel, G.; Kashgarian, M.; Tufro, A. Semaphorin3a promotes advanced diabetic nephropathy. Diabetes 2015, 64, 1743–1759. [Google Scholar] [CrossRef] [Green Version]
- Brar, S.; Ye, F.; James, M.T.; Hemmelgarn, B.; Klarenbach, S.; Pannu, N. Association of Angiotensin-Converting Enzyme Inhibitor or Angiotensin Receptor Blocker Use with Outcomes After Acute Kidney Injury. JAMA Intern. Med. 2018, 178, 1681–1690. [Google Scholar]
- Molnar, M.Z.; Kalantar-Zadeh, K.; Lott, E.H.; Lu, J.L.; Malakauskas, S.M.; Ma, J.Z.; Quarles, D.L.; Kovesdy, C.P. Angiotensin-converting enzyme inhibitor, angiotensin receptor blocker use, and mortality in patients with chronic kidney disease. J. Am. Coll. Cardiol. 2014, 63, 650–658. [Google Scholar]
- Nakamura, T.; Ushiyama, C.; Suzuki, S.; Hara, M.; Shimada, N.; Sekizuka, K.; Ebihara, I.; Koide, H. Effects of angiotensin-converting enzyme inhibitor, angiotensin II receptor antagonist and calcium antagonist on urinary podocytes in patients with IgA nephropathy. Am. J. Nephrol. 2000, 20, 373–379. [Google Scholar] [CrossRef]
- Zandi-Nejad, K.; Eddy, A.A.; Glassock, R.J.; Brenner, B.M. Why is proteinuria an ominous biomarker of progressive kidney disease? Kidney Int. Suppl. 2004, 66, S76–S89. [Google Scholar]
- Lin, S.-L.; Chen, Y.-M.; Chiang, W.-C.; Wu, K.-D.; Tsai, T.-J. Effect of pentoxifylline in addition to losartan on proteinuria and GFR in CKD: A 12-month randomized trial. Am. J. Kidney Dis. 2008, 52, 464–474. [Google Scholar] [CrossRef]
- Horita, Y.; Tadokoro, M.; Taura, K.; Suyama, N.; Taguchi, T.; Miyazaki, M.; Kohno, S. Low-dose combination therapy with temocapril and losartan reduces proteinuria in normotensive patients with immunoglobulin a nephropathy. Hypertens. Res. 2004, 27, 963–970. [Google Scholar] [PubMed] [Green Version]
- Mavroeidi, V.; Petrakis, I.; Stylianou, K.; Katsarou, T.; Giannakakis, K.; Perakis, K.; Vardaki, E.; Stratigis, S.; Ganotakis, E.; Papavasiliou, S.; et al. Losartan affects glomerular AKT and mTOR phosphorylation in an experimental model of type 1 diabetic nephropathy. J. Histochem. Cytochem. 2013, 61, 433–443. [Google Scholar] [PubMed] [Green Version]
- Chi, X.; Hu, B.; Yu, S.Y.; Yin, L.; Meng, Y.; Wang, B.; Yang, J.; Lin, J.; Huang, D.; Chen, L. Losartan treating podocyte injury induced by Ang II via downregulation of TRPC6 in podocytes. J. Renin Angiotensin Aldosterone Syst. 2015, 16, 1118–1124. [Google Scholar]
- Yu, S.Y.; Qi, R.; Zhao, H. Losartan reverses glomerular podocytes injury induced by AngII via stabilizing the expression of GLUT1. Mol. Biol. Rep. 2013, 40, 6295–6301. [Google Scholar] [CrossRef]


Publisher’s Note: MDPI stays neutral with regard to jurisdictional claims in published maps and institutional affiliations. |
© 2022 by the authors. Licensee MDPI, Basel, Switzerland. This article is an open access article distributed under the terms and conditions of the Creative Commons Attribution (CC BY) license (https://creativecommons.org/licenses/by/4.0/).
Share and Cite
Erichsen, L.; Thimm, C.; Bohndorf, M.; Rahman, M.S.; Wruck, W.; Adjaye, J. Activation of the Renin–Angiotensin System Disrupts the Cytoskeletal Architecture of Human Urine-Derived Podocytes. Cells 2022, 11, 1095. https://doi.org/10.3390/cells11071095
Erichsen L, Thimm C, Bohndorf M, Rahman MS, Wruck W, Adjaye J. Activation of the Renin–Angiotensin System Disrupts the Cytoskeletal Architecture of Human Urine-Derived Podocytes. Cells. 2022; 11(7):1095. https://doi.org/10.3390/cells11071095
Chicago/Turabian StyleErichsen, Lars, Chantelle Thimm, Martina Bohndorf, Md Shaifur Rahman, Wasco Wruck, and James Adjaye. 2022. "Activation of the Renin–Angiotensin System Disrupts the Cytoskeletal Architecture of Human Urine-Derived Podocytes" Cells 11, no. 7: 1095. https://doi.org/10.3390/cells11071095