
In Vitro Erythropoiesis at Different pO2 Induces Adaptations That Are Independent of Prior Systemic Exposure to Hypoxia

 , , , , and
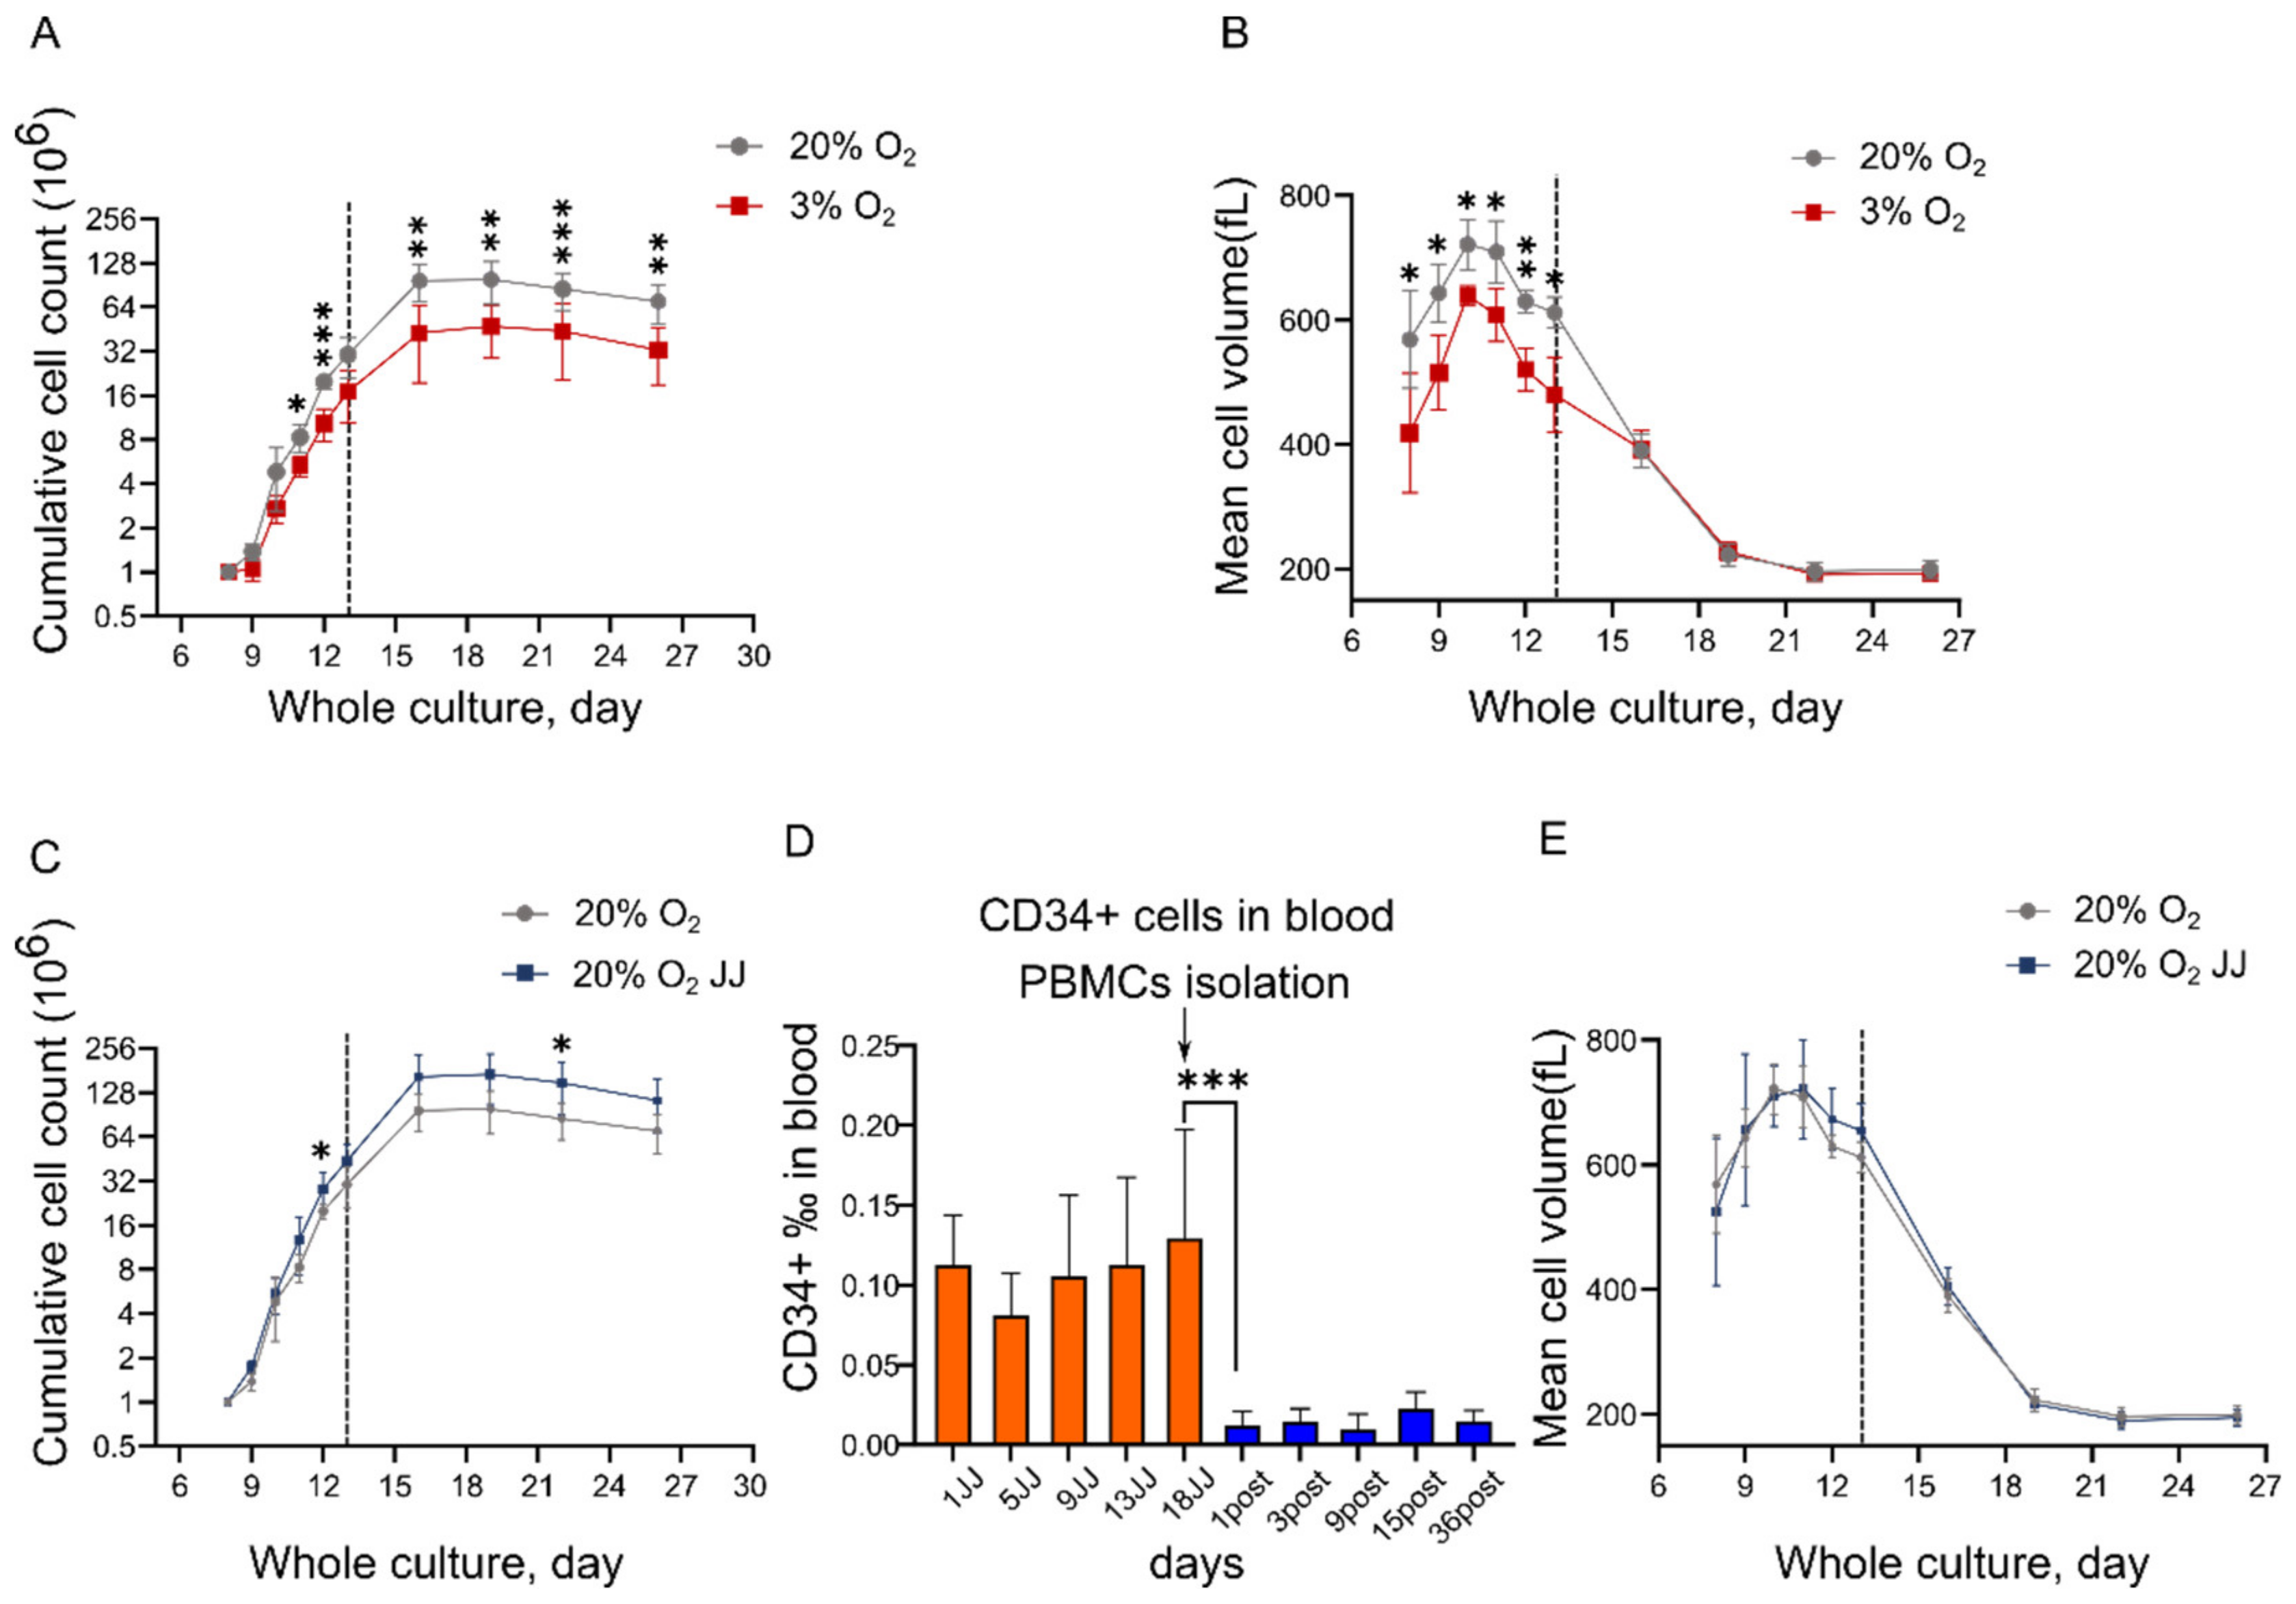
Abstract
:1. Introduction
2. Materials and Methods
2.1. Design of the Study
2.2. PBMC Isolation and Culture
2.3. Flow Cytometry
2.4. Cytospin
2.5. Metabolites and Ion Measurements
2.6. Spectrophotometry on Hemoglobin
2.7. HPLC
2.8. Deformability
2.9. Cell Fixation and 3D Confocal Imaging
2.10. Proteomics
2.10.1. Sample Preparation and Mass Spectrometry (MS) Analysis
2.10.2. MS Data Analysis
2.11. Statistical Analysis
3. Results
3.1. In Vitro Erythropoiesis at 3% O2 Leads to a Reduced Erythroid Yield and Cell Volume Compared to That at 20% O2
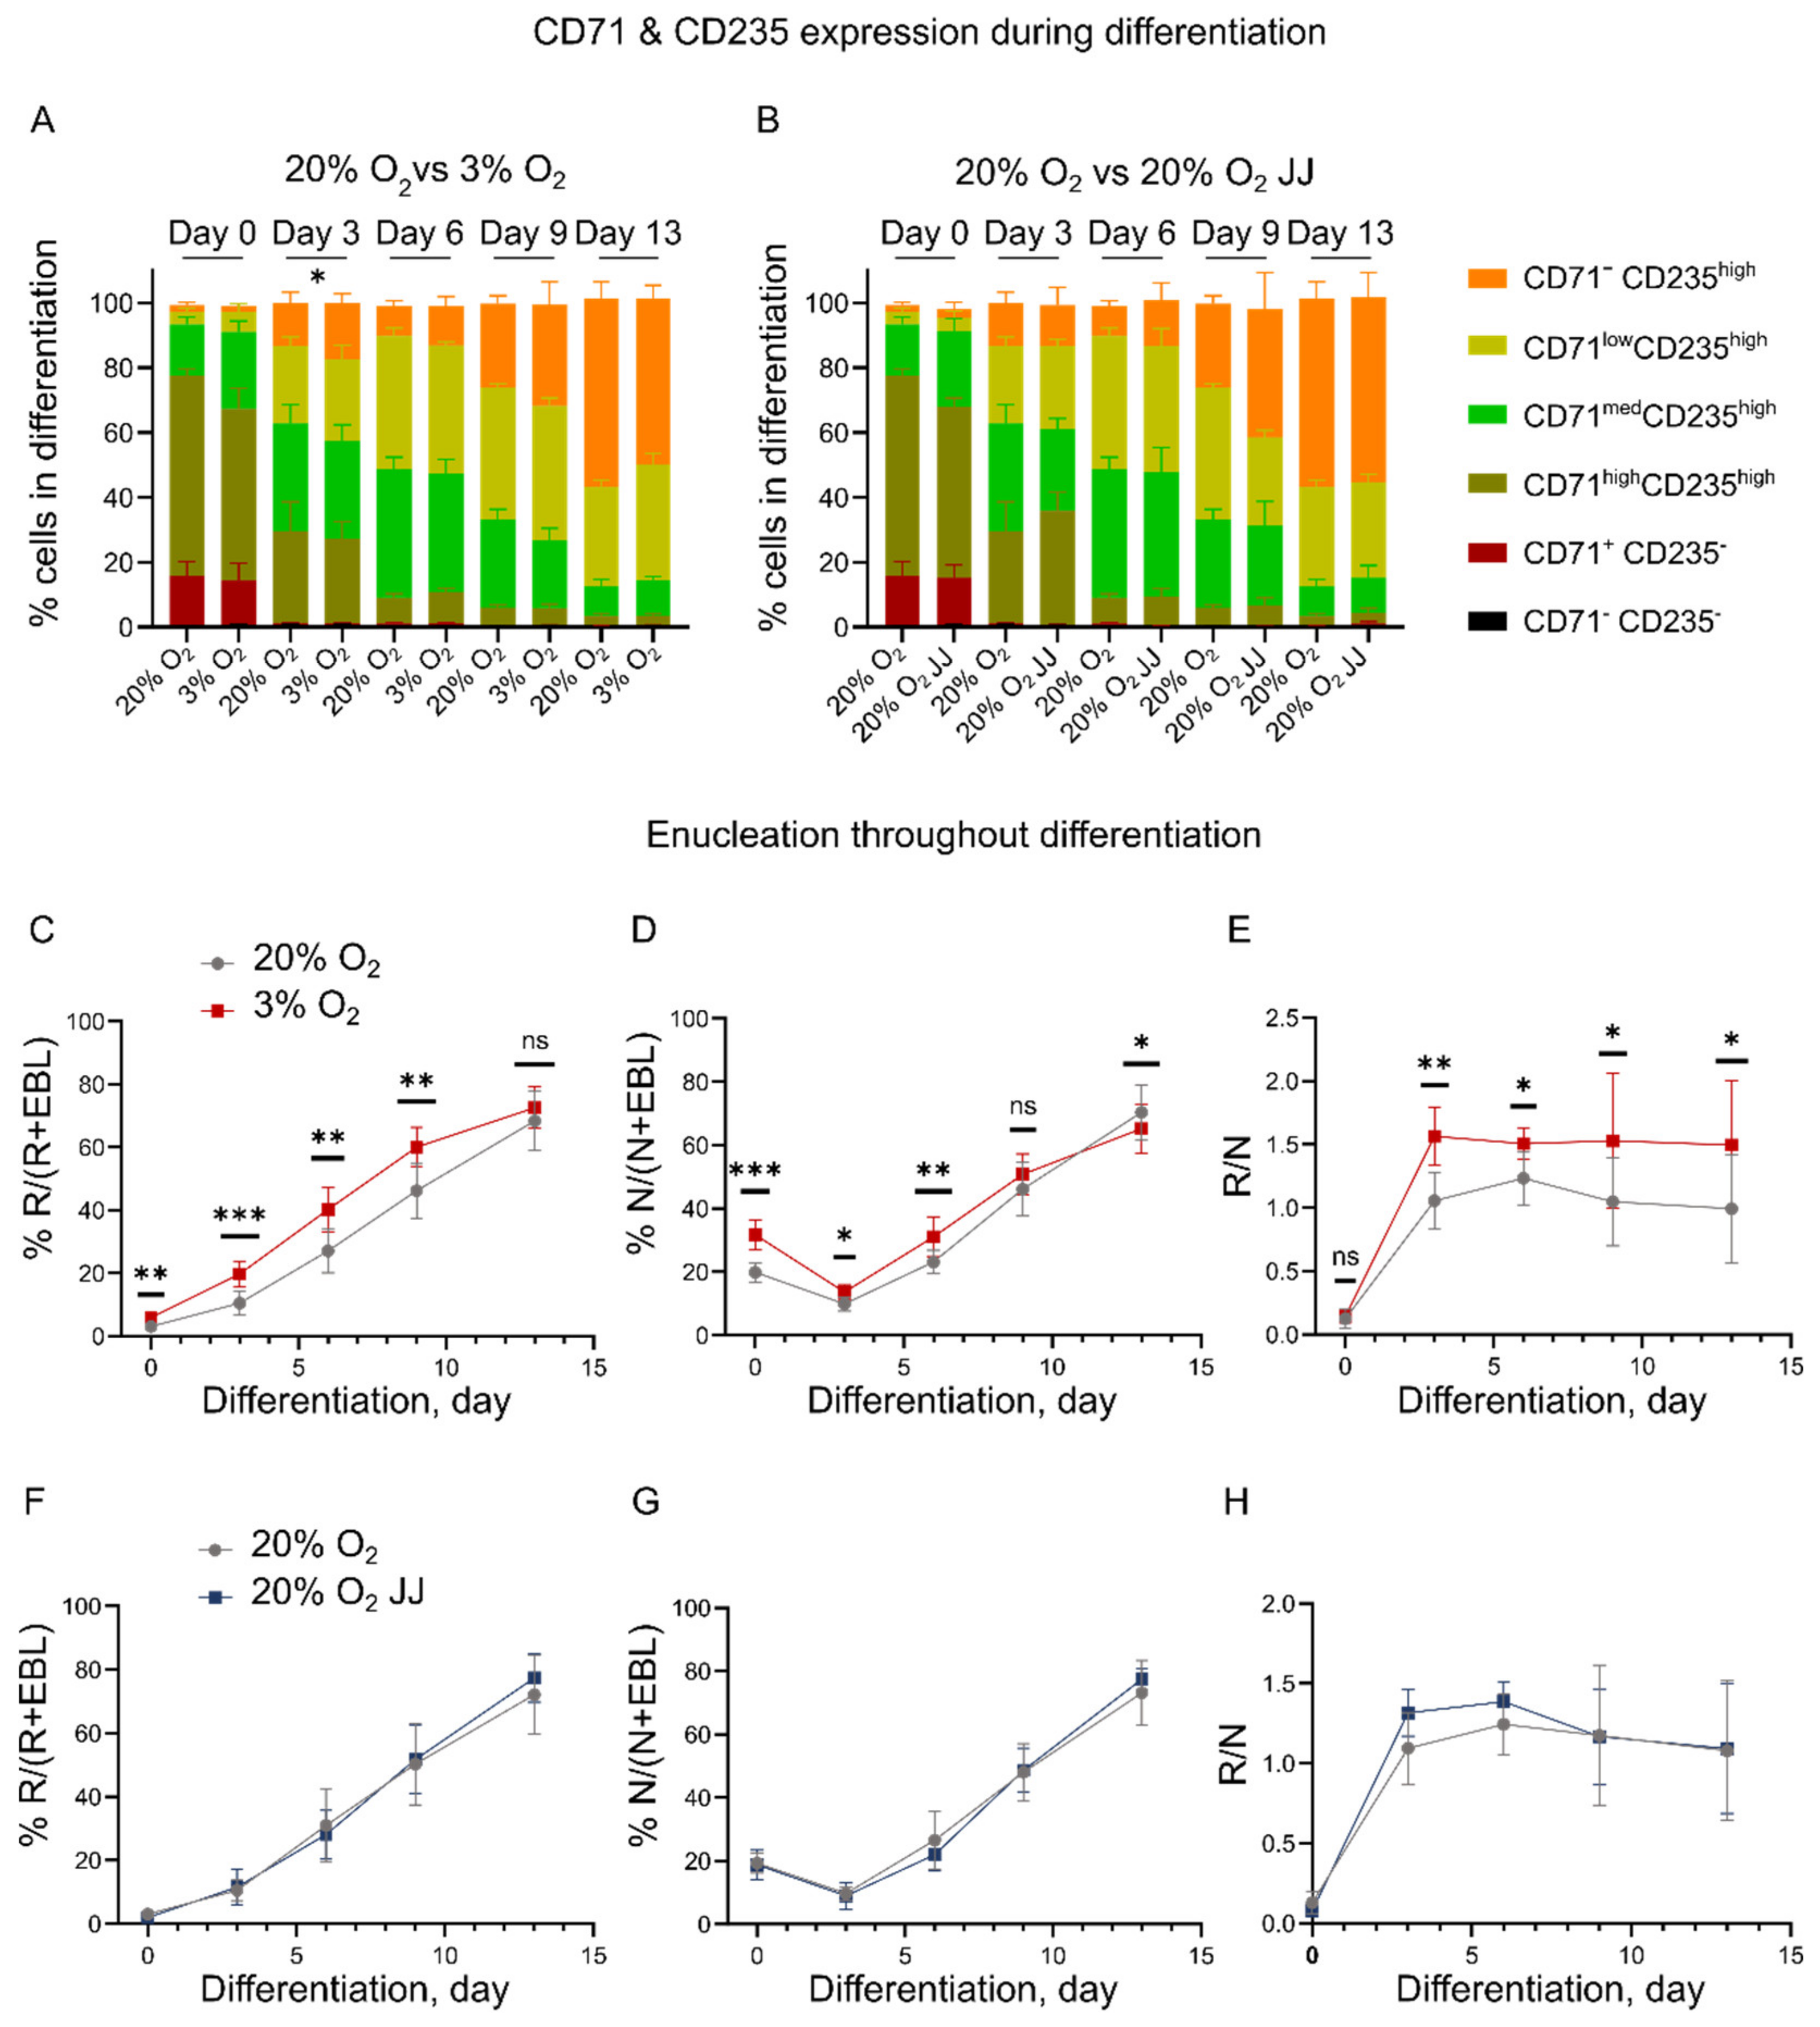
3.2. Erythroid Cultures at Three Percent O2 Show Accelerated Maturation
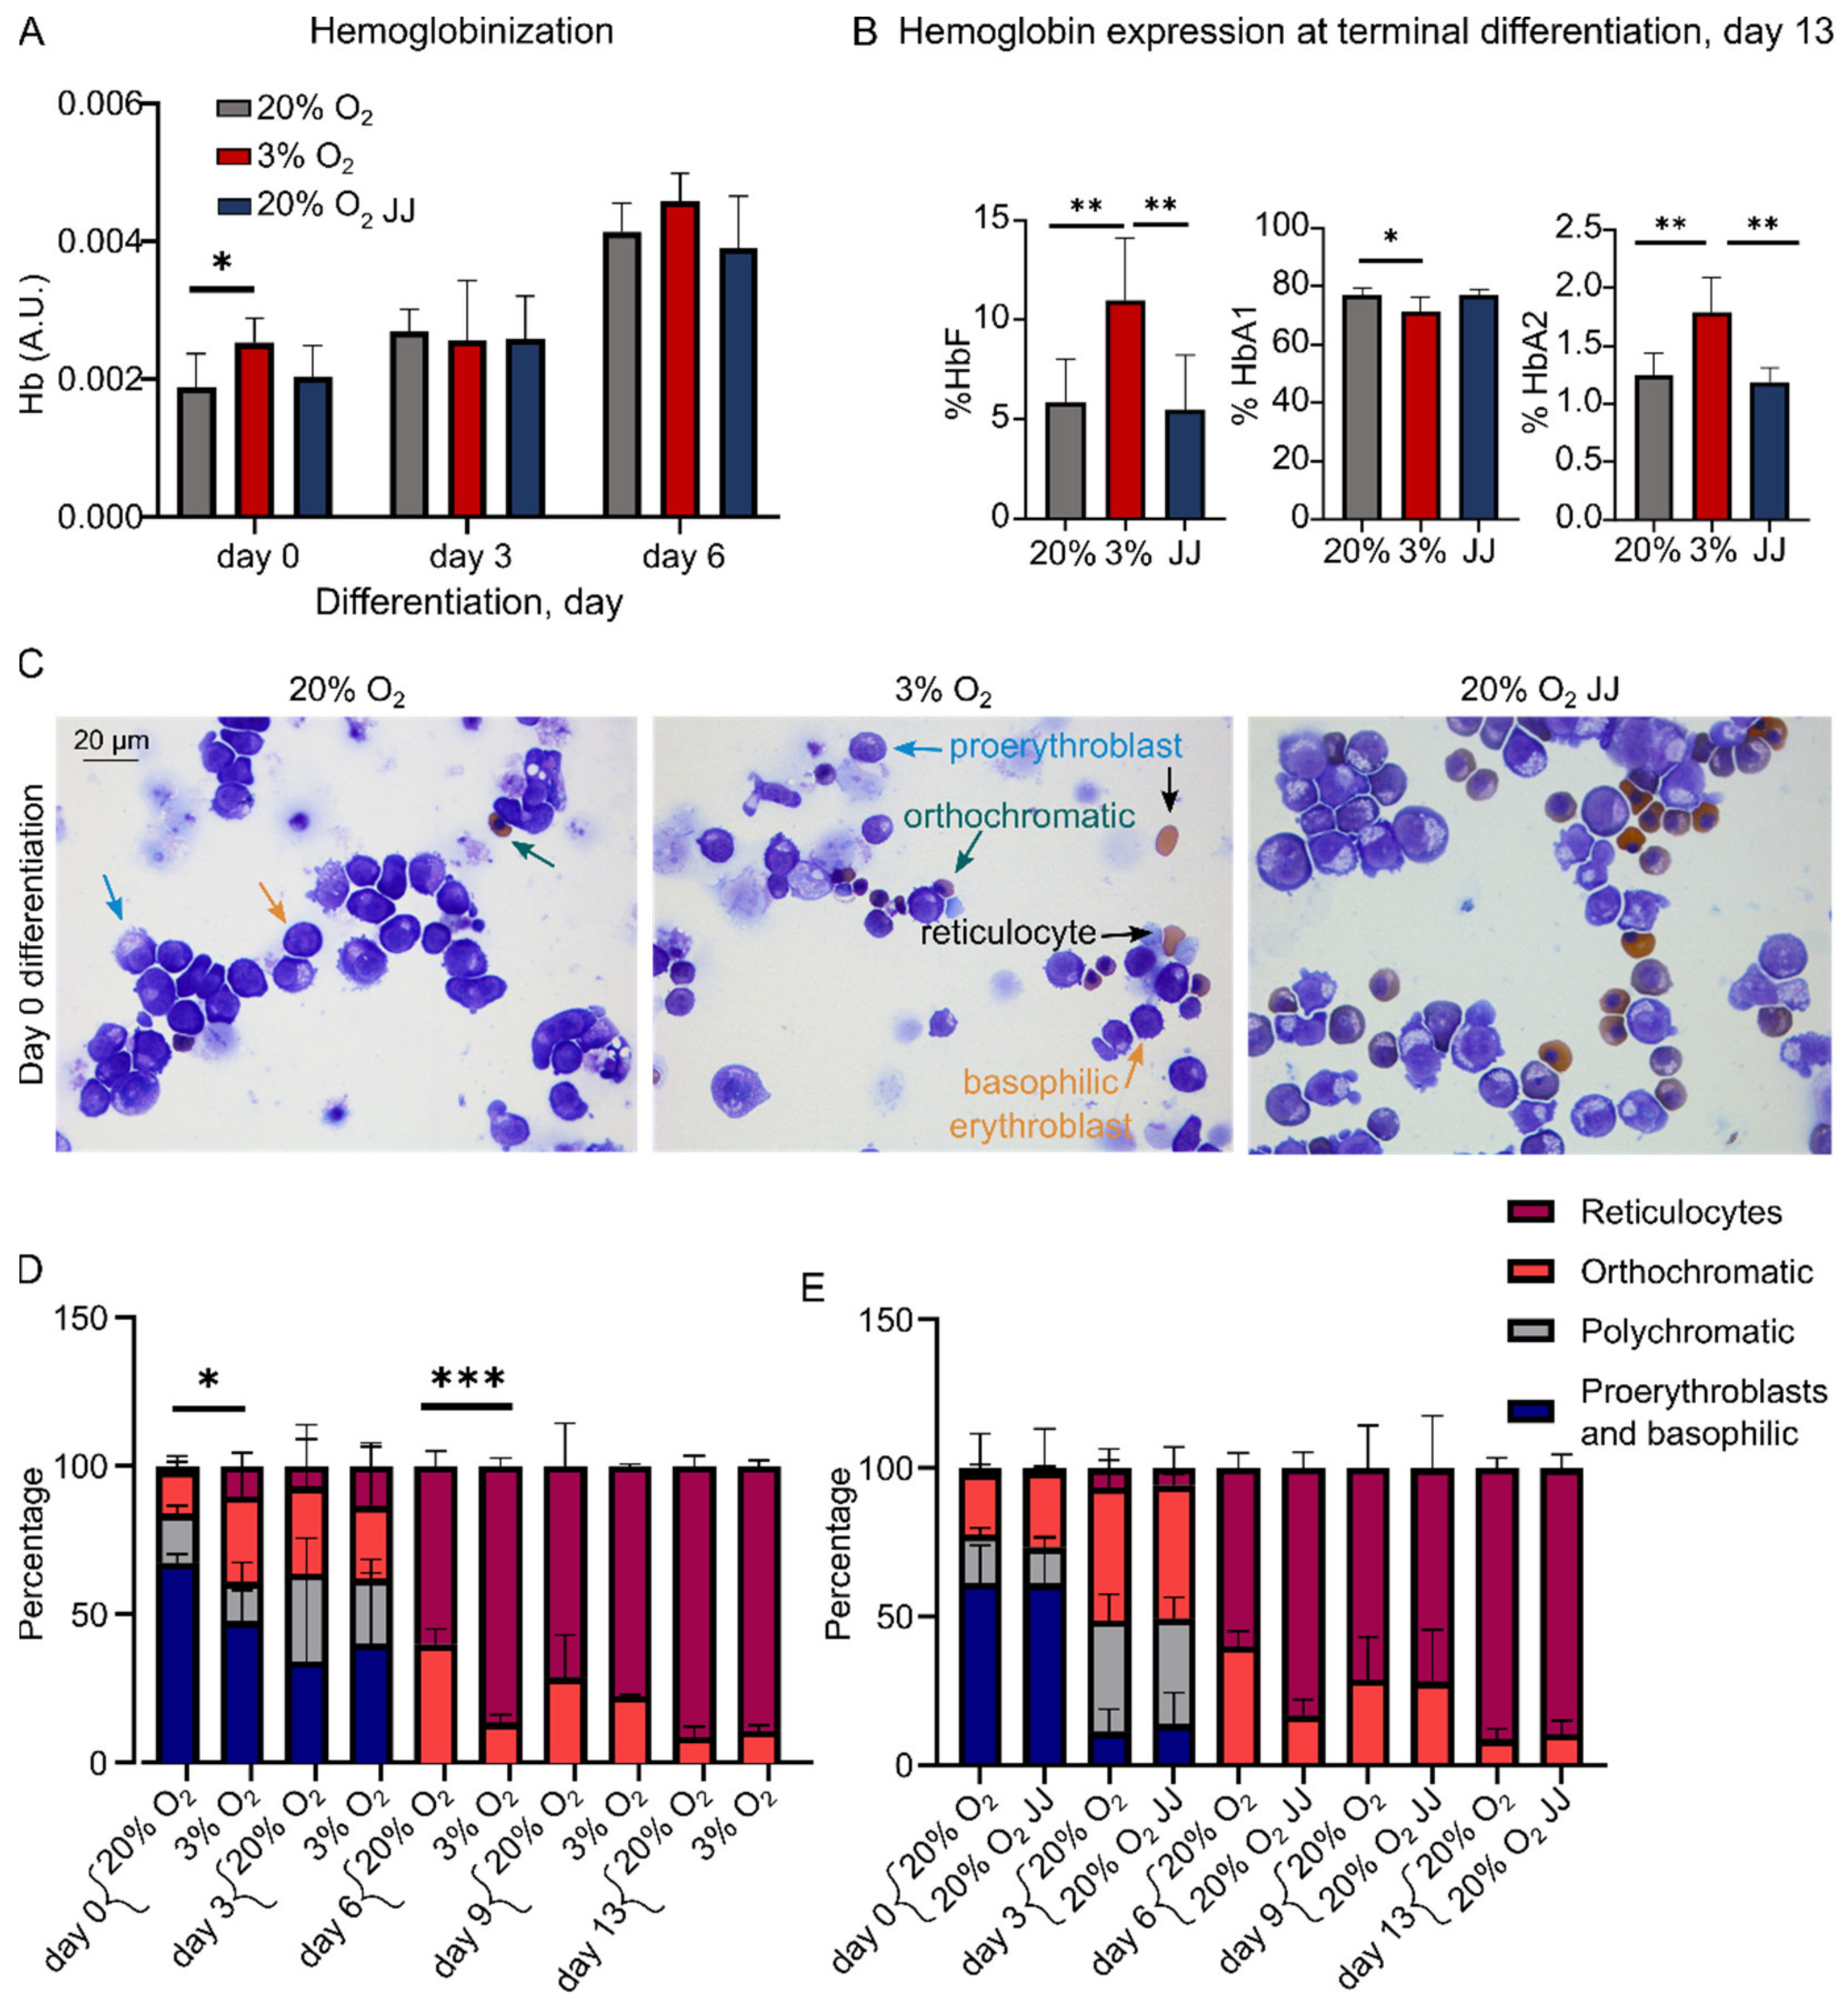
3.3. Hypoxia Accelerates Hemoglobinization during Cell Expansion with Increased HbF and HbA2 Expression in Differentiation
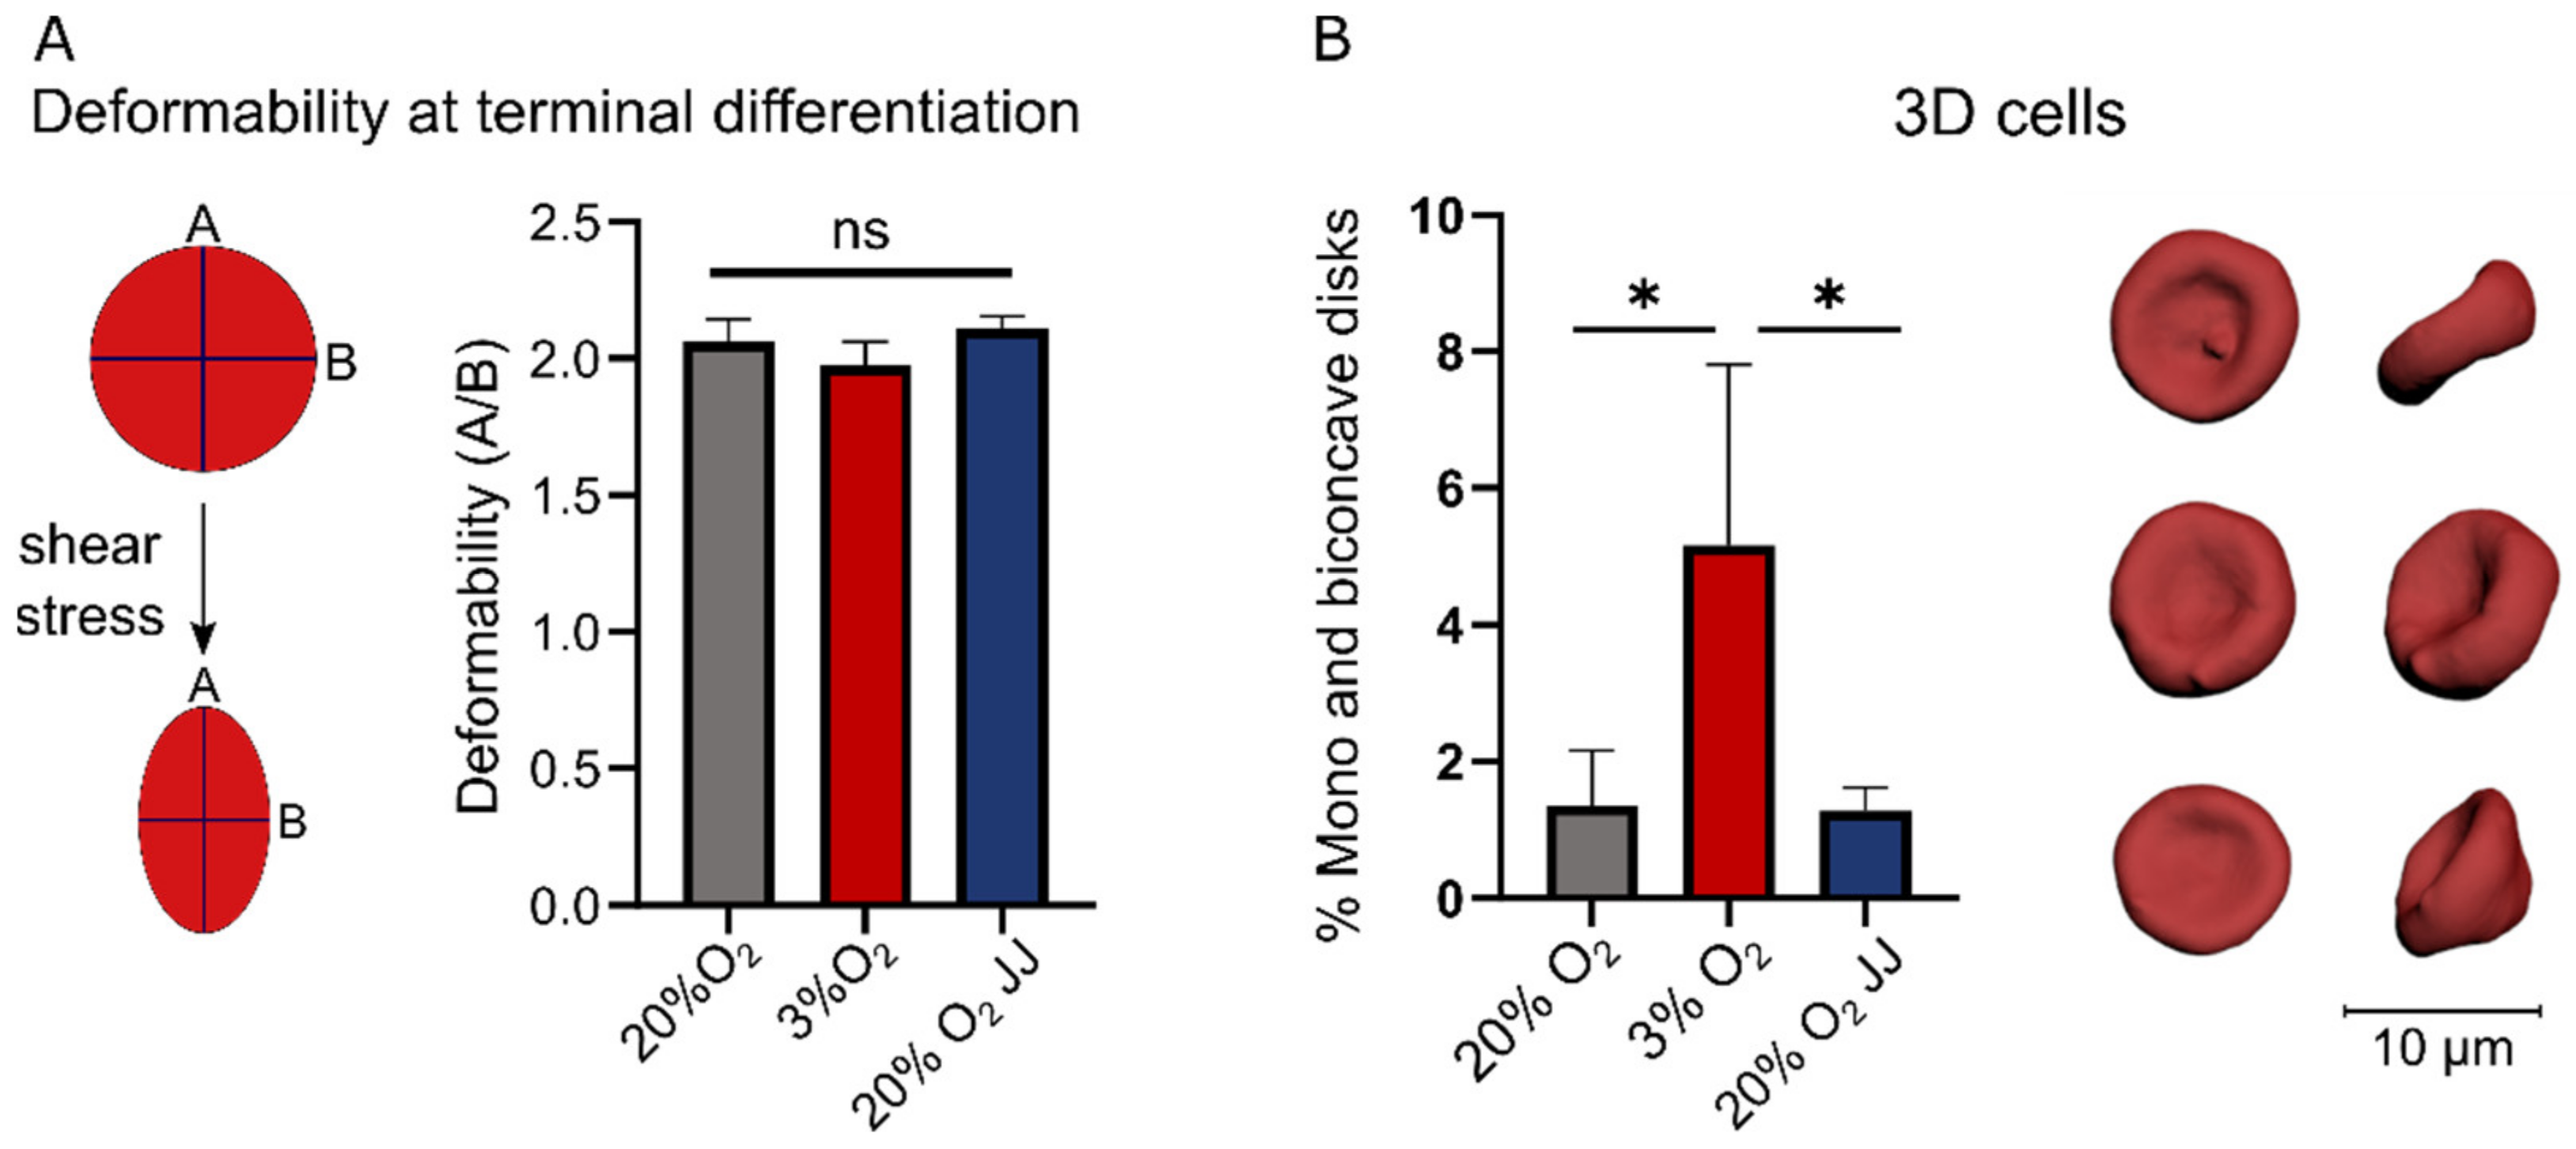
3.4. Deformability of In Vitro Reticulocytes Is Similar between 3% O2 or 20% O2 Cultures, but More Biconcave Cells Form at 3% O2
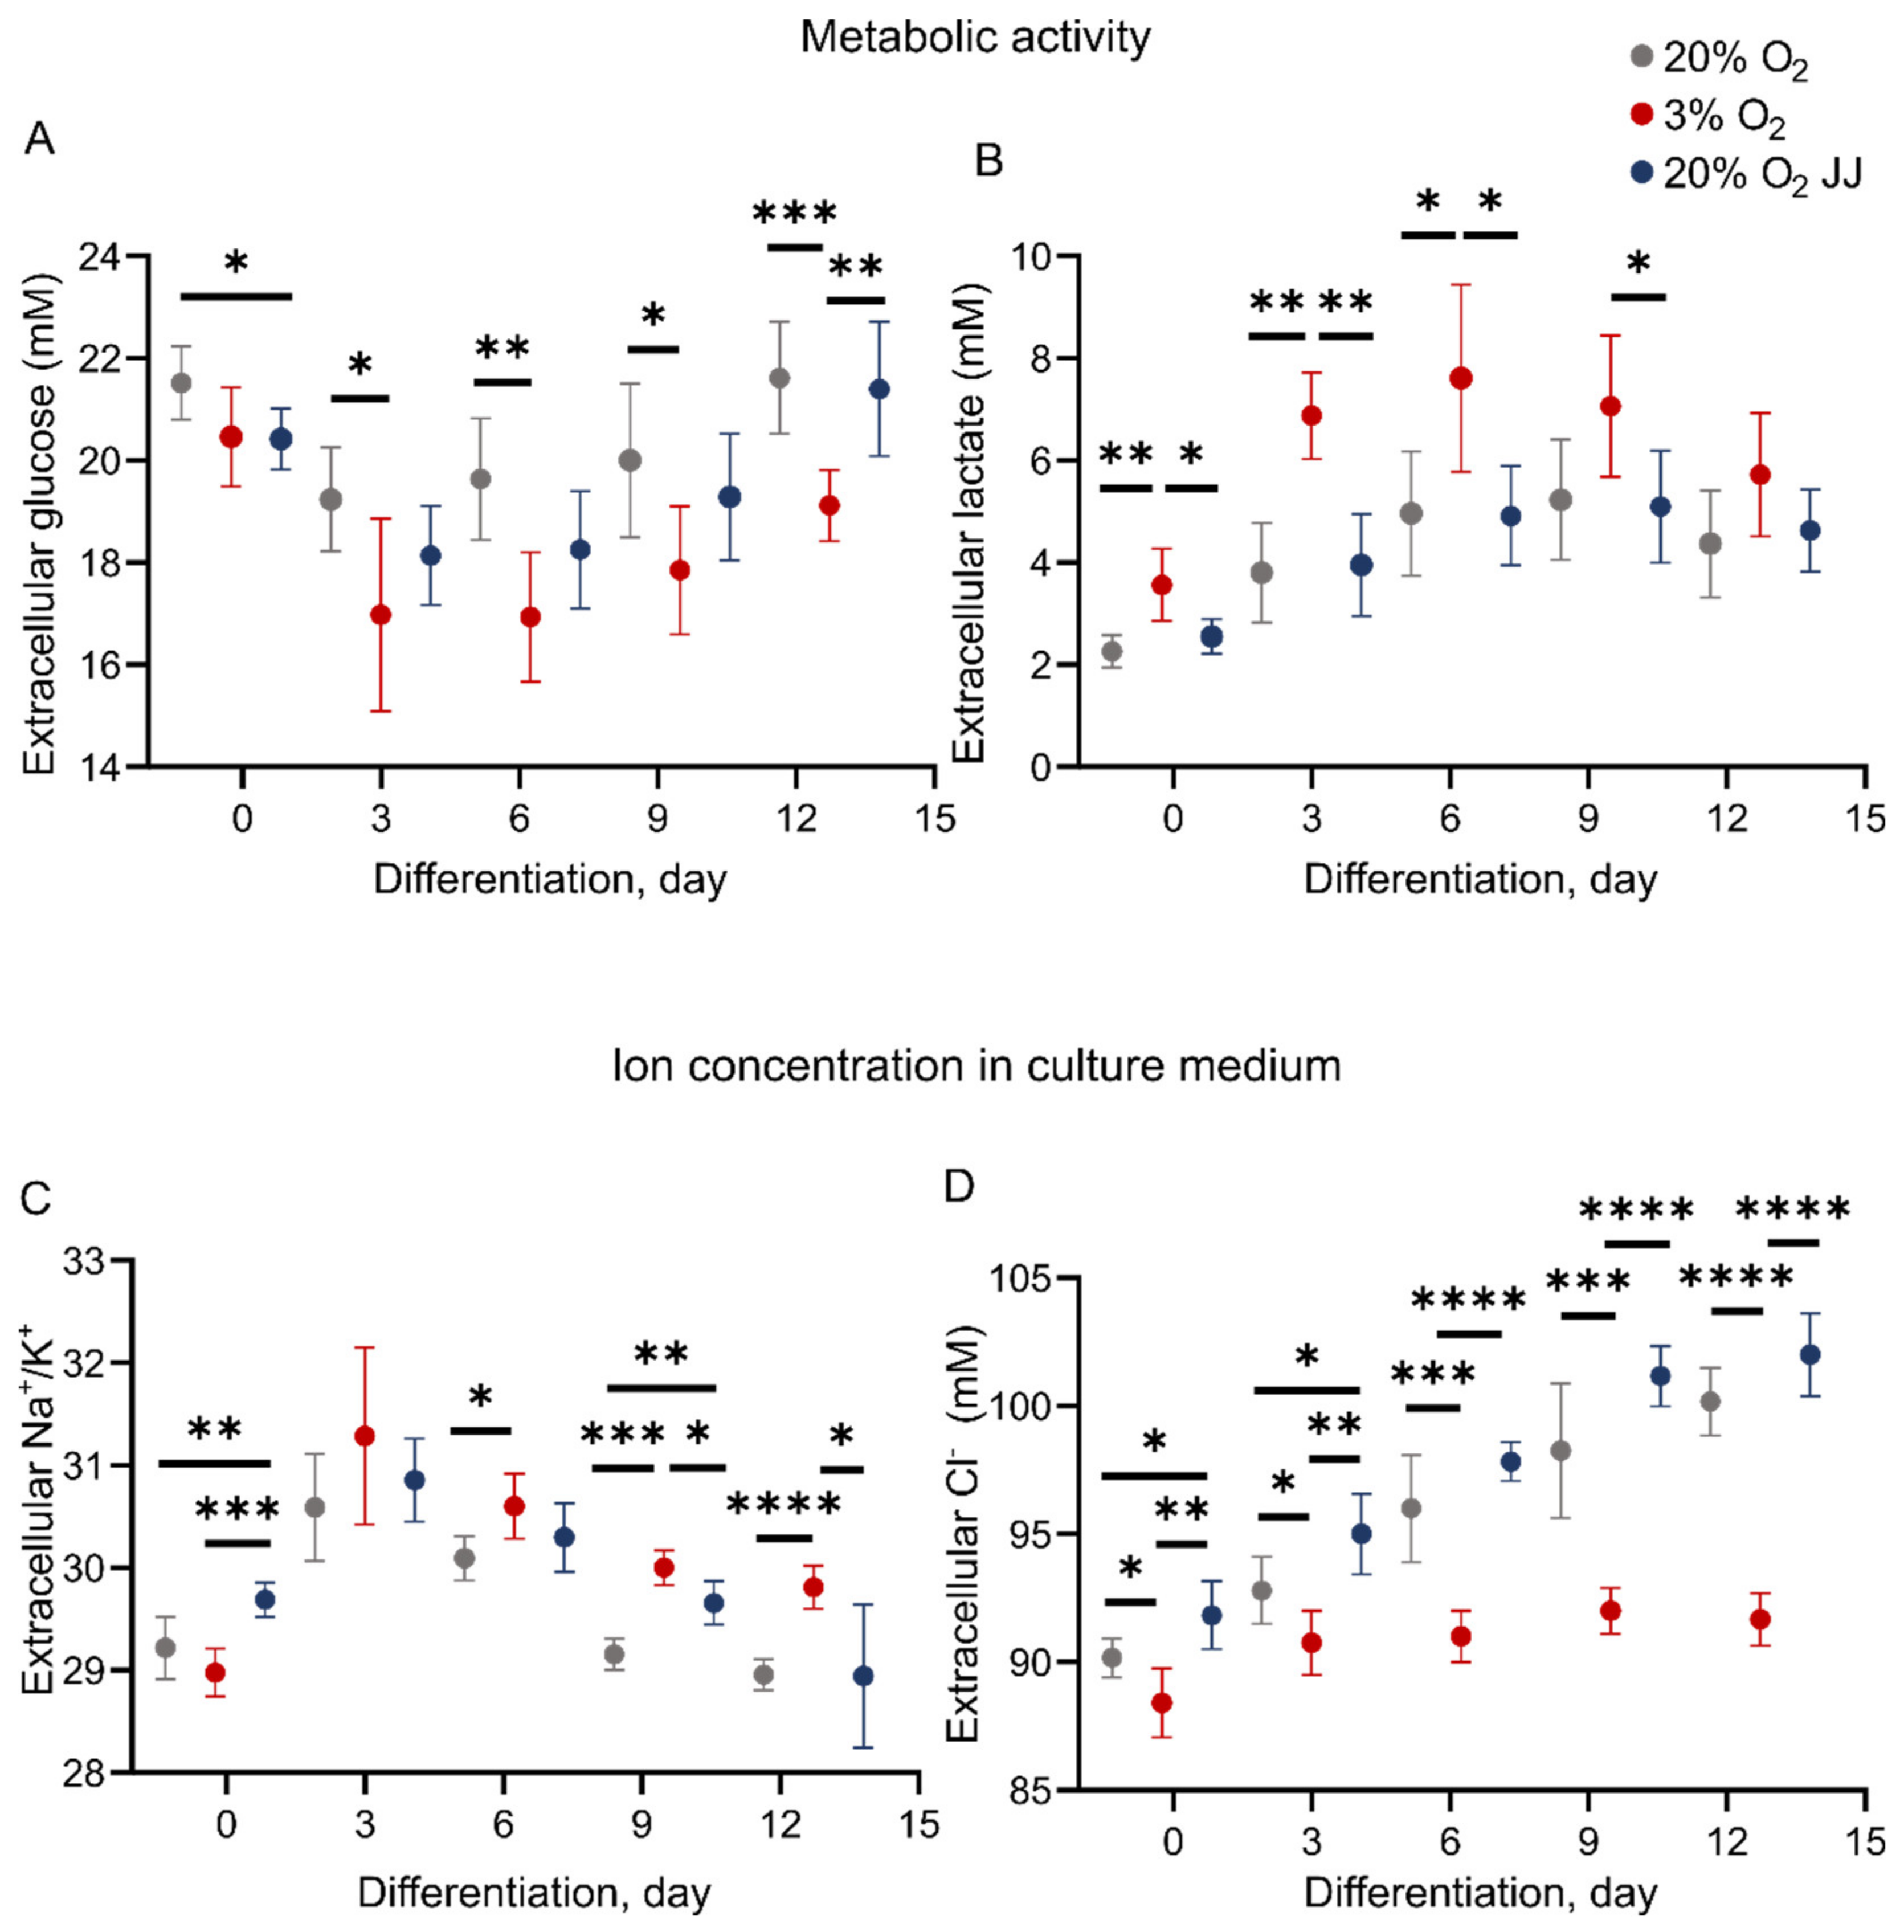
3.5. Metabolic Activity during In Vitro Erythropoiesis Is Changed between 3% and 20% O2 Conditions
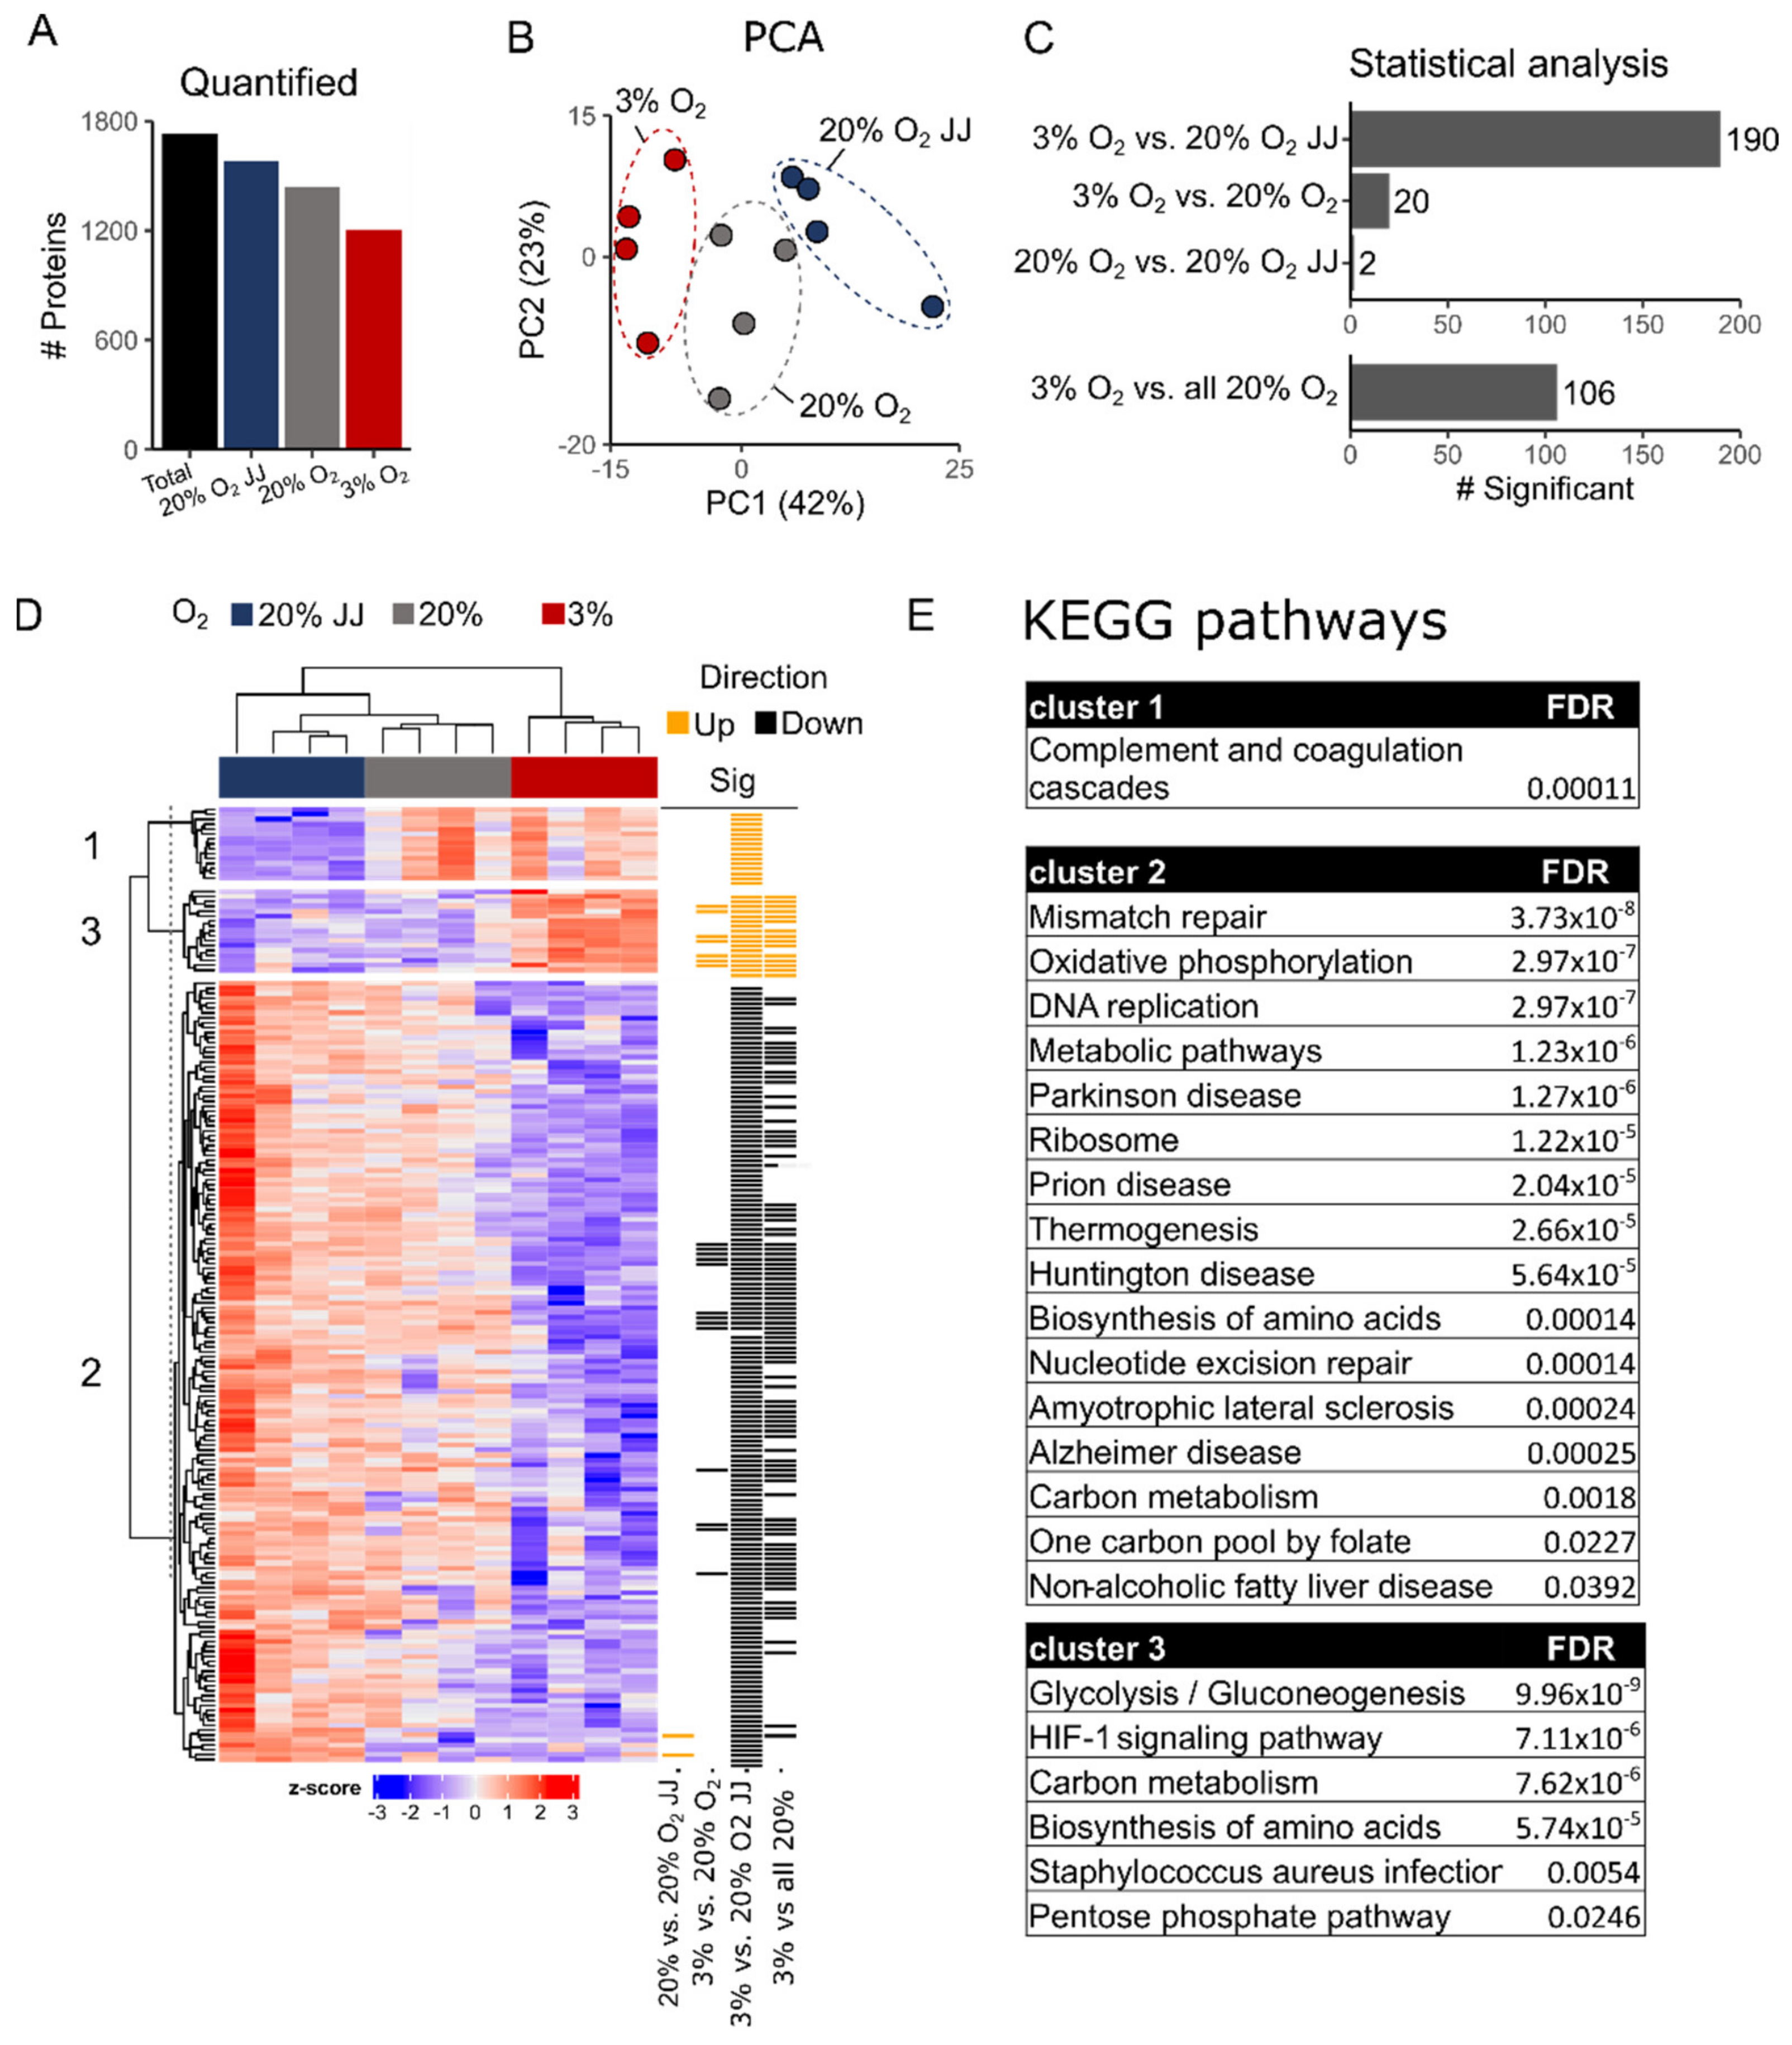
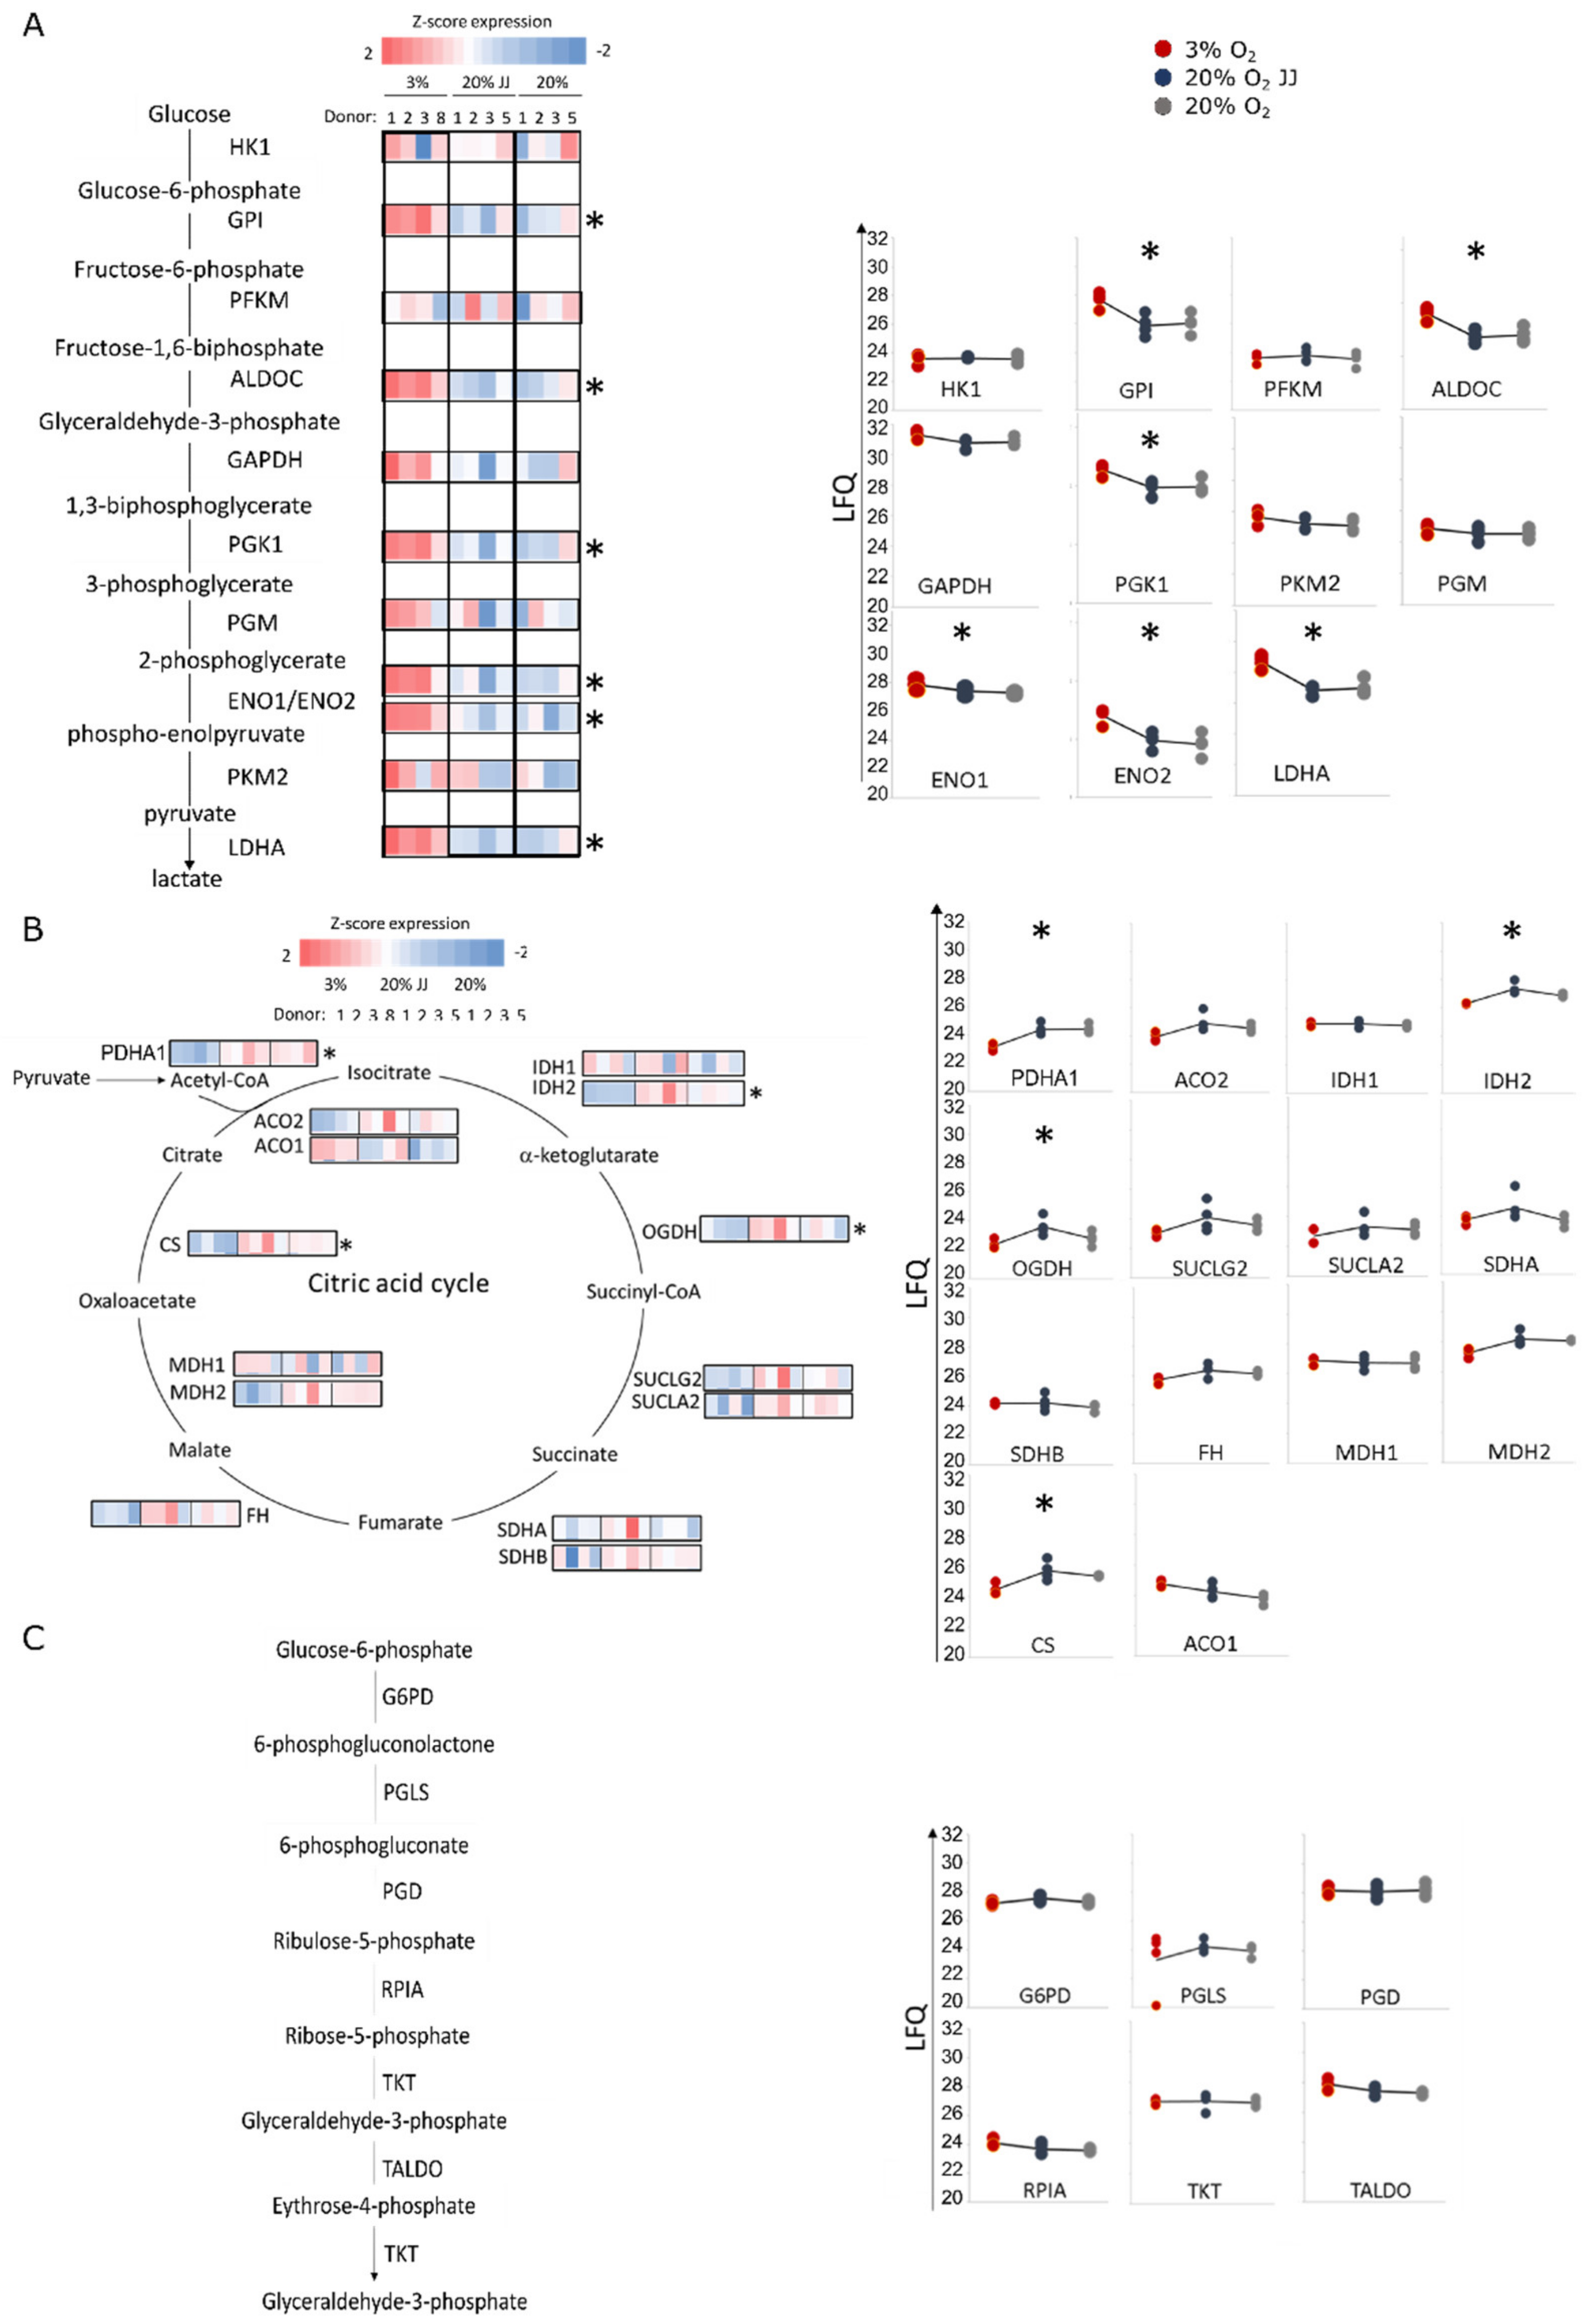
3.6. Proteomics on In Vitro Reticulocytes Reveals Metabolic Adjustments at Different O2 Concentrations
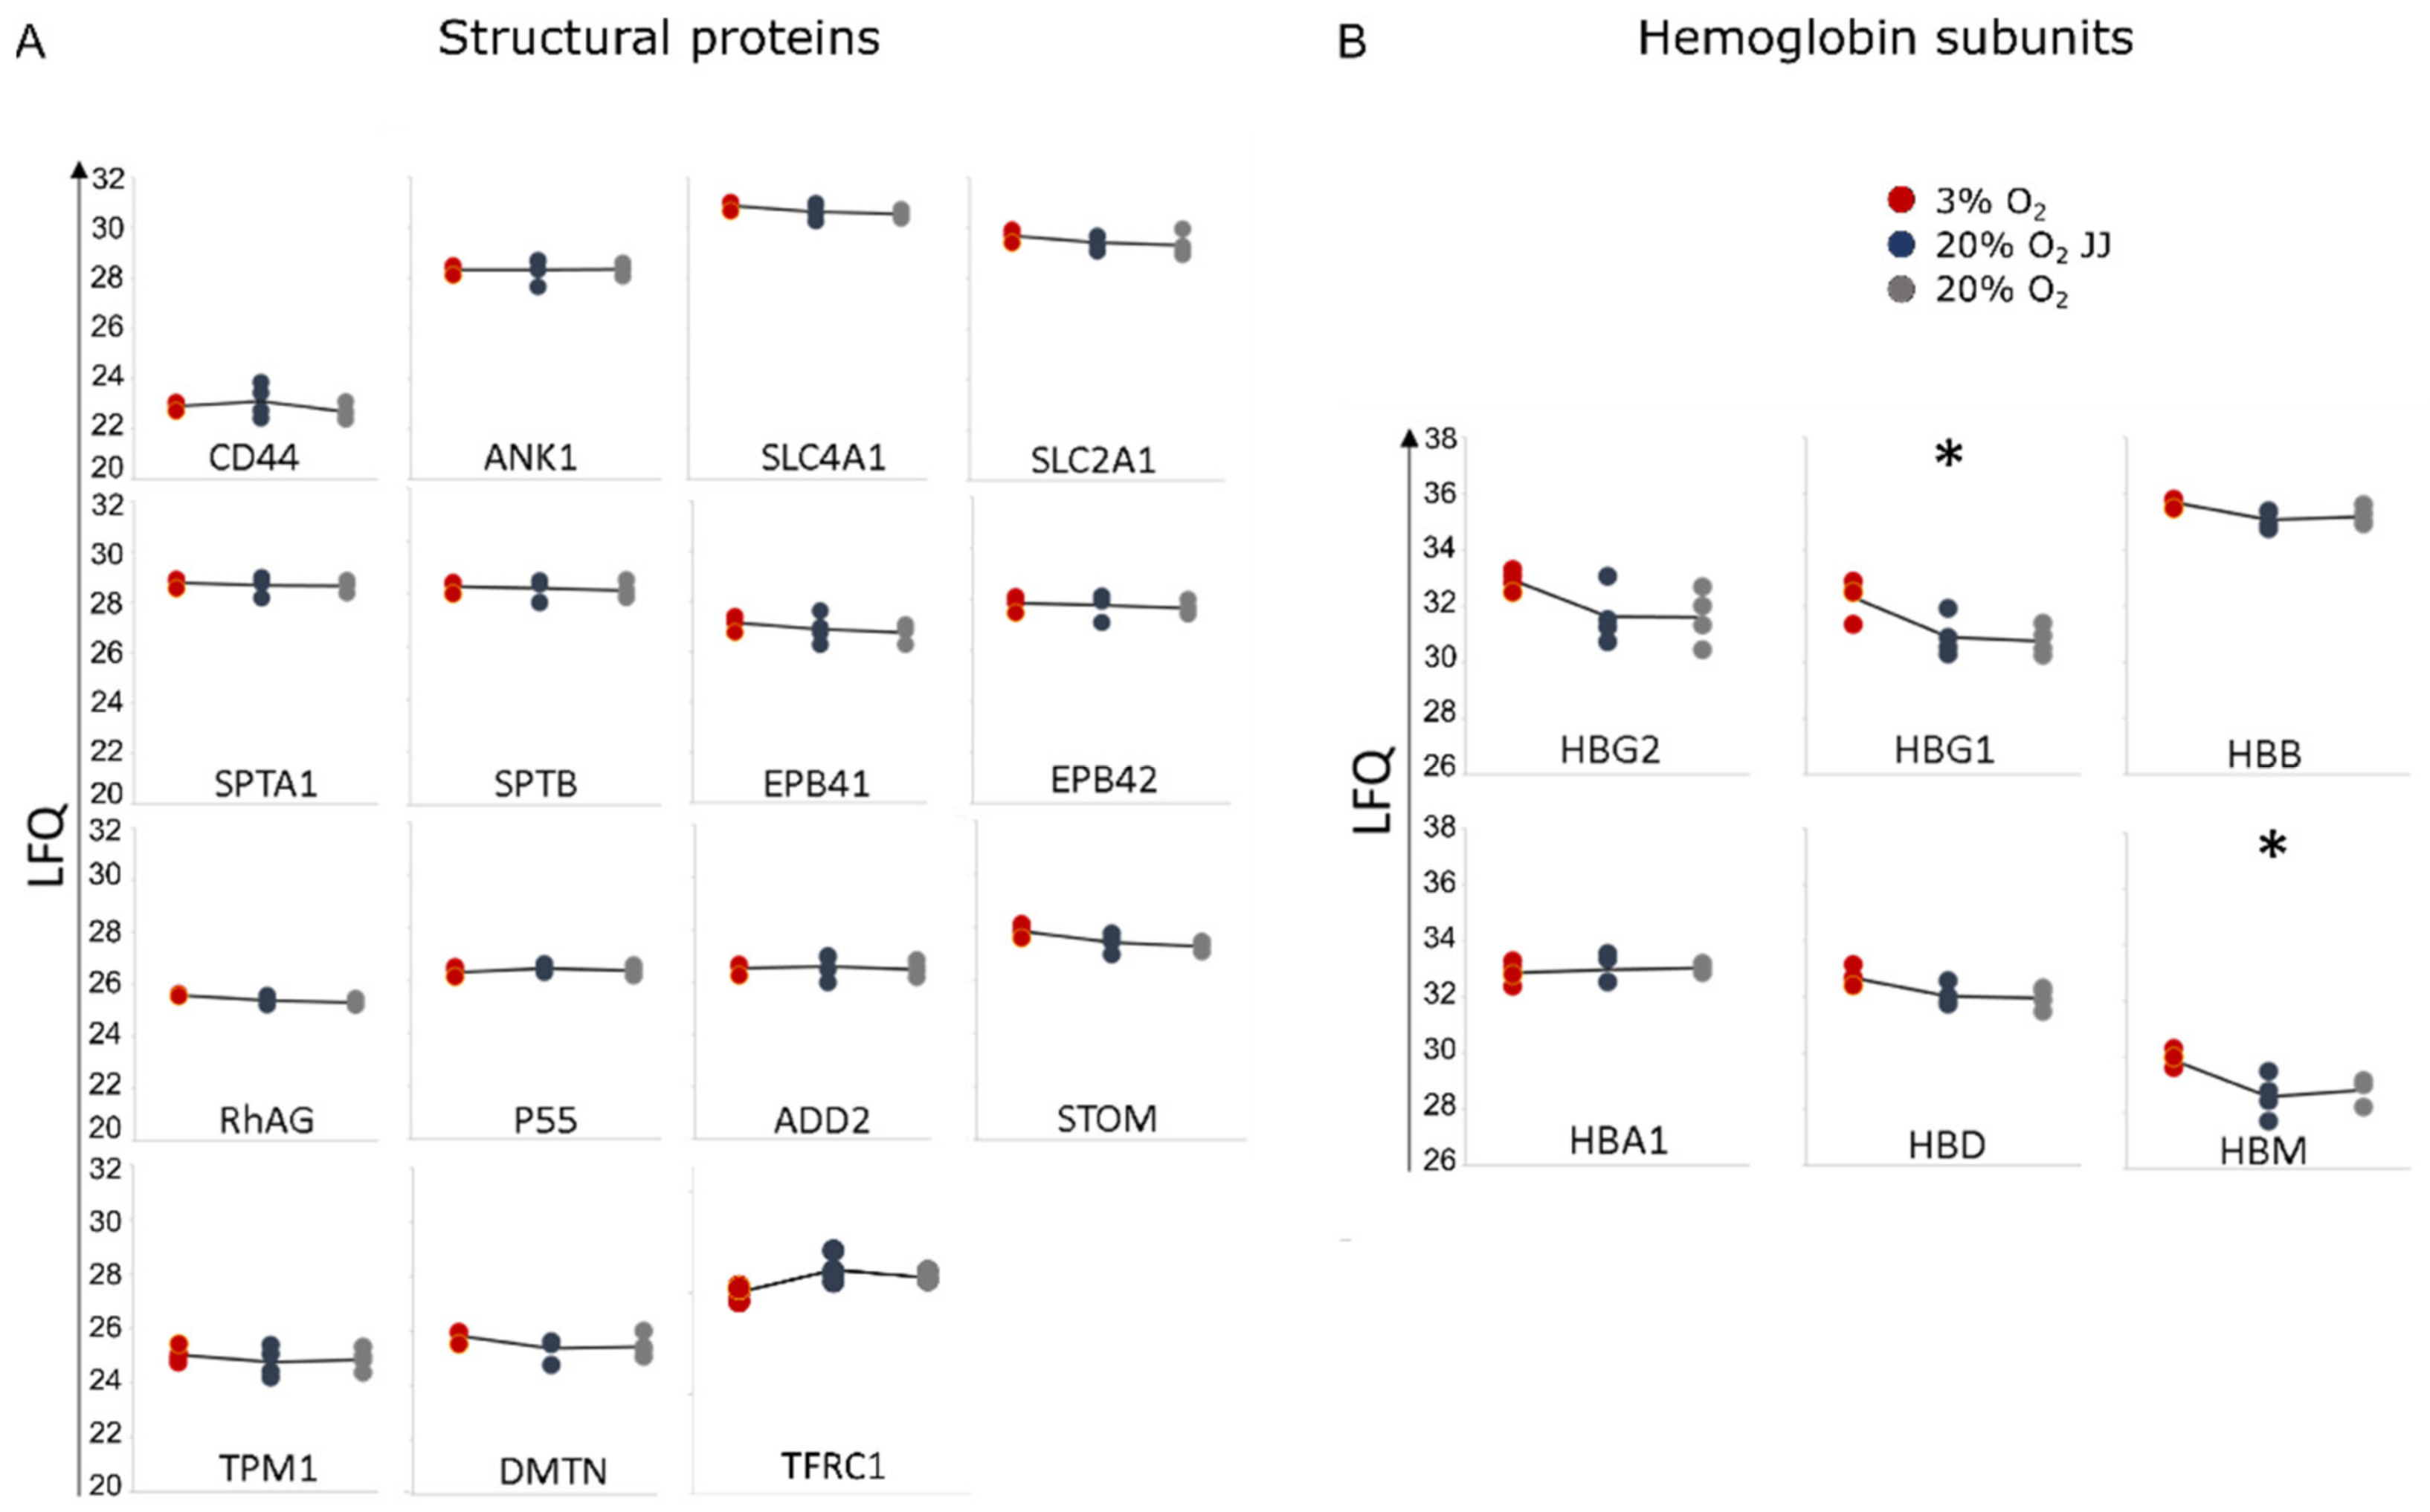
3.7. Proteins Involved in the Structural Integrity of Erythrocytes Are Unchanged between Cultures at Different O2 Percentages
4. Discussion
5. Conclusions
Supplementary Materials
Author Contributions
Funding
Institutional Review Board Statement
Informed Consent Statement
Data Availability Statement
Acknowledgments
Conflicts of Interest
References
- Spencer, J.A.; Ferraro, F.; Roussakis, E.; Klein, A.; Wu, J.; Runnels, J.M.; Zaher, W.; Mortensen, L.J.; Alt, C.; Turcotte, R.; et al. Direct Measurement of Local Oxygen Concentration in the Bone Marrow of Live Animals. Nature 2014, 508, 269–273. [Google Scholar] [CrossRef] [PubMed] [Green Version]
- Eckardt, K.U.; Boutellier, U.; Kurtz, A.; Schopen, M.; Koller, E.A.; Bauer, C. Rate of Erythropoietin Formation in Humans in Response to Acute Hypobaric Hypoxia. J. Appl. Physiol. 1989, 66, 1785–1788. [Google Scholar] [CrossRef] [PubMed]
- Mairbäurl, H. Neocytolysis: How to Get Rid of the Extra Erythrocytes Formed by Stress Erythropoiesis upon Descent from High Altitude. Front. Physiol. 2018, 9, 345. [Google Scholar] [CrossRef]
- Rice, L.; Ruiz, W.; Driscoll, T.; Whitley, C.E.; Tapia, R.; Hachey, D.L.; Gonzales, G.F.; Alfrey, C.P. Neocytolysis on Descent from Altitude: A Newly Recognized Mechanism for the Control of Red Cell Mass. Ann. Intern. Med. 2001, 134, 652–656. [Google Scholar] [CrossRef]
- Risso, A.; Ciana, A.; Achilli, C.; Antonutto, G.; Minetti, G. Neocytolysis: None, One or Many? A Reappraisal and Future Perspectives. Front. Physiol. 2014, 5, 54. [Google Scholar] [CrossRef] [Green Version]
- Alfrey, C.P.; Rice, L.; Udden, M.M.; Driscoll, T.B. Neocytolysis: Physiological down-Regulator of Red-Cell Mass. Lancet 1997, 349, 1389–1390. [Google Scholar] [CrossRef]
- Merino, C.F. Studies on Blood Formation and Desctruction in the Polycythemia of High Altitude. Blood 1950, 5, 1–31. [Google Scholar] [CrossRef]
- Risso, A.; Turello, M.; Biffoni, F.; Antonutto, G. Red Blood Cell Senescence and Neocytolysis in Humans after High Altitude Acclimatization. Blood Cells Mol. Dis. 2007, 38, 83–92. [Google Scholar] [CrossRef]
- Al-Faris, L.; Al-Humood, S.; Behbehani, F.; Sallam, H. Altered Expression Pattern of CD55 and CD59 on Red Blood Cells in Anemia of Chronic Kidney Disease. Med. Princ. Pract. 2017, 26, 516–522. [Google Scholar] [CrossRef] [Green Version]
- Trudel, G.; Shahin, N.; Ramsay, T.; Laneuville, O.; Louati, H. Hemolysis Contributes to Anemia during Long-Duration Space Flight. Nat. Med. 2022, 28, 59–62. [Google Scholar] [CrossRef]
- Klein, M.; Kaestner, L.; Bogdanova, A.Y.; Minetti, G.; Rudloff, S.; Lundby, C.; Makhro, A.; Seiler, E.; van Cromvoirt, A.; Fenk, S.; et al. Absence of Neocytolysis in Humans Returning from a 3-Week High-Altitude Sojourn. Acta Physiol. 2021, 232, e13647. [Google Scholar] [CrossRef] [PubMed]
- Rice, L.; Gunga, H.-C. Neocytolysis on Descending the Mountain and Ascending into Space. Acta Physiol. 2021, 232, e13676. [Google Scholar] [CrossRef] [PubMed]
- Recktenwald, S.M.; Kaestner, L.; Yu Bogdanova, A.; Minetti, G.; Klein, M.; Mairbäurl, H. “So Is Science …”1: No Evidence for Neocytolysis on Descending the Mountains (Response to Rice and Gunga). Acta Physiol. 2021, 233, e13709. [Google Scholar] [CrossRef] [PubMed]
- Song, J.; Christensen, R.D.; Thiagarajan, P.; Prchal, J.T. Does Neocytolysis Exist after Descent from High Altitude? Acta Physiol. 2021, 233, e13713. [Google Scholar] [CrossRef]
- Mairbäurl, H.; Kaestner, L.; Yu Bogdanova, A.; Klein, M.; Minetti, G. Of Mice and Men1: How to Achieve a Better Life with Lower Total Hb Mass after Returning from Hypoxia to Normoxia. (Response to Song and Colleagues). Acta Physiol. 2021, 233, e13720. [Google Scholar] [CrossRef]
- Guglielmo, A.; Angela, R. The Debate on Neocytolysis. Acta Physiol. 2022, 234, e13723. [Google Scholar] [CrossRef]
- Kaestner, L.; Klein, M.; Bogdanova, A.Y.; Minetti, G.; Rudloff, S.; Lundby, C.; Makhro, A.; Seiler, E.; van Cromvoirt, A.; Fenk, S.; et al. Neocytolisis: A space born concept of erythrocyte-removal falsified in the Swiss Alps. Flugmed. Trop. Reisemedizin-FTR 2021, 28, 232–236. [Google Scholar] [CrossRef]
- Heshusius, S.; Heideveld, E.; Burger, P.; Thiel-Valkhof, M.; Sellink, E.; Varga, E.; Ovchynnikova, E.; Visser, A.; Martens, J.H.A.; von Lindern, M.; et al. Large-Scale in Vitro Production of Red Blood Cells from Human Peripheral Blood Mononuclear Cells. Blood Adv. 2019, 3, 3337–3350. [Google Scholar] [CrossRef] [Green Version]
- Beug, H.; Doederlein, G.; Freudenstein, C.; Graf, T. Erythroblast Cell Lines Transformed by a Temperature-Sensitive Mutant of Avian Erythroblastosis Virus: A Model System to Study Erythroid Differentiation in Vitro. J. Cell. Physiol. 1982, 113, 195–207. [Google Scholar] [CrossRef]
- Bakker, W.J.; Blázquez-Domingo, M.; Kolbus, A.; Besooyen, J.; Steinlein, P.; Beug, H.; Coffer, P.J.; Löwenberg, B.; von Lindern, M.; van Dijk, T.B. FoxO3a Regulates Erythroid Differentiation and Induces BTG1, an Activator of Protein Arginine Methyl Transferase 1. J. Cell Biol. 2004, 164, 175–184. [Google Scholar] [CrossRef]
- Van Zwieten, R.; van Oirschot, B.A.; Veldthuis, M.; Dobbe, J.G.; Streekstra, G.J.; van Solinge, W.W.; Schutgens, R.E.G.; van Wijk, R. Partial Pyruvate Kinase Deficiency Aggravates the Phenotypic Expression of Band 3 Deficiency in a Family with Hereditary Spherocytosis. Am. J. Hematol. 2015, 90, E35–E39. [Google Scholar] [CrossRef] [PubMed]
- Dobbe, J.G.G.; Streekstra, G.J.; Hardeman, M.R.; Ince, C.; Grimbergen, C.A. Measurement of the Distribution of Red Blood Cell Deformability Using an Automated Rheoscope. Cytometry 2002, 50, 313–325. [Google Scholar] [CrossRef] [PubMed]
- Abay, A.; Simionato, G.; Chachanidze, R.; Bogdanova, A.; Hertz, L.; Bianchi, P.; van den Akker, E.; von Lindern, M.; Leonetti, M.; Minetti, G.; et al. Glutaraldehyde—A Subtle Tool in the Investigation of Healthy and Pathologic Red Blood Cells. Front. Physiol. 2019, 10, 514. [Google Scholar] [CrossRef] [PubMed]
- Simionato, G.; Hinkelmann, K.; Chachanidze, R.; Bianchi, P.; Fermo, E.; van Wijk, R.; Leonetti, M.; Wagner, C.; Kaestner, L.; Quint, S. Red Blood Cell Phenotyping from 3D Confocal Images Using Artificial Neural Networks. PLoS Comput. Biol. 2021, 17, e1008934. [Google Scholar] [CrossRef]
- Béguin, E.P.; Janssen, E.F.J.; Hoogenboezem, M.; Meijer, A.B.; Hoogendijk, A.J.; van den Biggelaar, M. Flow-Induced Reorganization of Laminin-Integrin Networks Within the Endothelial Basement Membrane Uncovered by Proteomics. Mol. Cell. Proteom. 2020, 19, 1179–1192. [Google Scholar] [CrossRef] [Green Version]
- Tyanova, S.; Temu, T.; Cox, J. The MaxQuant Computational Platform for Mass Spectrometry-Based Shotgun Proteomics. Nat. Protoc. 2016, 11, 2301–2319. [Google Scholar] [CrossRef]
- Huber, W.; Carey, V.J.; Gentleman, R.; Anders, S.; Carlson, M.; Carvalho, B.S.; Bravo, H.C.; Davis, S.; Gatto, L.; Girke, T.; et al. Orchestrating High-Throughput Genomic Analysis with Bioconductor. Nat. Methods 2015, 12, 115–121. [Google Scholar] [CrossRef]
- Ritchie, M.E.; Phipson, B.; Wu, D.; Hu, Y.; Law, C.W.; Shi, W.; Smyth, G.K. Limma Powers Differential Expression Analyses for RNA-Sequencing and Microarray Studies. Nucleic Acids Res. 2015, 43, e47. [Google Scholar] [CrossRef]
- Vizcaíno, J.A.; Deutsch, E.W.; Wang, R.; Csordas, A.; Reisinger, F.; Ríos, D.; Dianes, J.A.; Sun, Z.; Farrah, T.; Bandeira, N.; et al. ProteomeXchange Provides Globally Coordinated Proteomics Data Submission and Dissemination. Nat. Biotechnol. 2014, 32, 223–226. [Google Scholar] [CrossRef]
- Heideveld, E.; Masiello, F.; Marra, M.; Esteghamat, F.; Yağcı, N.; von Lindern, M.; Migliaccio, A.R.F.; van den Akker, E. CD14+ Cells from Peripheral Blood Positively Regulate Hematopoietic Stem and Progenitor Cell Survival Resulting in Increased Erythroid Yield. Haematologica 2015, 100, 1396–1406. [Google Scholar] [CrossRef] [Green Version]
- Nakahata, T.; Okumura, N. Cell Surface Antigen Expression in Human Erythroid Progenitors: Erythroid and Megakaryocytic Markers. Leuk. Lymphoma 1994, 13, 401–409. [Google Scholar] [CrossRef]
- Heshusius, S.; Grech, L.; Gillemans, N.; Brouwer, R.W.W.; den Dekker, X.T.; van IJcken, W.F.J.; Nota, B.; Felice, A.E.; van Dijk, T.B.; von Lindern, M.; et al. Epigenomic Analysis of KLF1 Haploinsufficiency in Primary Human Erythroblasts. Sci. Rep. 2022, 12, 336. [Google Scholar] [CrossRef] [PubMed]
- Sepp, M.; Sokolova, N.; Jugai, S.; Mandel, M.; Peterson, P.; Vendelin, M. Tight Coupling of Na+/K+-ATPase with Glycolysis Demonstrated in Permeabilized Rat Cardiomyocytes. PLoS ONE 2014, 9, e99413. [Google Scholar] [CrossRef] [PubMed] [Green Version]
- Van den Akker, E.; Satchwell, T.J.; Pellegrin, S.; Daniels, G.; Toye, A.M. The Majority of the in Vitro Erythroid Expansion Potential Resides in CD34−Cells, Outweighing the Contribution of CD34+ Cells and Significantly Increasing the Erythroblast Yield from Peripheral Blood Samples. Haematologica 2010, 95, 1594–1598. [Google Scholar] [CrossRef] [Green Version]
- Chasis, J.; Prenant, M.; Leung, A.; Mohandas, N. Membrane Assembly and Remodeling during Reticulocyte Maturation. Blood 1989, 74, 1112–1120. [Google Scholar] [CrossRef] [Green Version]
- Ovchynnikova, E.; Aglialoro, F.; Bentlage, A.E.H.; Vidarsson, G.; Salinas, N.D.; von Lindern, M.; Tolia, N.H.; van den Akker, E. DARC Extracellular Domain Remodeling in Maturating Reticulocytes Explains Plasmodium Vivax Tropism. Blood 2017, 130, 1441–1444. [Google Scholar] [CrossRef]
- Blanc, L.; Liu, J.; Vidal, M.; Chasis, J.A.; An, X.; Mohandas, N. The Water Channel Aquaporin-1 Partitions into Exosomes during Reticulocyte Maturation: Implication for the Regulation of Cell Volume. Blood 2009, 114, 3928–3934. [Google Scholar] [CrossRef] [Green Version]
- Moura, P.L.; Hawley, B.R.; Mankelow, T.J.; Griffiths, R.E.; Dobbe, J.G.G.; Streekstra, G.J.; Anstee, D.J.; Satchwell, T.J.; Toye, A.M. Non-Muscle Myosin II Drives Vesicle Loss during Human Reticulocyte Maturation. Haematologica 2018, 103, 1997–2007. [Google Scholar] [CrossRef] [Green Version]
- Klei, T.R.L.; Aglialoro, F.; Mul, F.P.J.; Tol, S.; Ligthart, P.C.; Seignette, I.M.; Geissler, J.; van den Akker, E.; van Bruggen, R. Differential Interaction between DARC and SDF-1 on Erythrocytes and Their Precursors. Sci. Rep. 2019, 9, 16245. [Google Scholar] [CrossRef] [Green Version]
- Serebrovskaya, T.V.; Nikolsky, I.S.; Nikolska, V.V.; Mallet, R.T.; Ishchuk, V.A. Intermittent Hypoxia Mobilizes Hematopoietic Progenitors and Augments Cellular and Humoral Elements of Innate Immunity in Adult Men. High Alt. Med. Biol. 2011, 12, 243–252. [Google Scholar] [CrossRef]
- Florentin, J.; Zhao, J.; Tai, Y.-Y.; Vasamsetti, S.B.; O’Neil, S.P.; Kumar, R.; Arunkumar, A.; Watson, A.; Sembrat, J.; Bullock, G.C.; et al. Interleukin-6 Mediates Neutrophil Mobilization from Bone Marrow in Pulmonary Hypertension. Cell. Mol. Immunol. 2021, 18, 374–384. [Google Scholar] [CrossRef] [PubMed]
- Durand, M.; Collombet, J.-M.; Frasca, S.; Sarilar, V.; Lataillade, J.-J.; Le Bousse-Kerdilès, M.-C.; Holy, X. Separate and Combined Effects of Hypobaric Hypoxia and Hindlimb Suspension on Skeletal Homeostasis and Hematopoiesis in Mice. Hypoxia 2019, 7, 41–52. [Google Scholar] [CrossRef] [PubMed] [Green Version]
- Duchene, J.; Novitzky-Basso, I.; Thiriot, A.; Casanova-Acebes, M.; Bianchini, M.; Etheridge, S.L.; Hub, E.; Nitz, K.; Artinger, K.; Eller, K.; et al. Atypical Chemokine Receptor 1 on Nucleated Erythroid Cells Regulates Hematopoiesis. Nat. Immunol. 2017, 18, 753–761. [Google Scholar] [CrossRef] [PubMed]
- Papayannopoulou, T.; Kalmantis, T.; Stamatoyannopoulos, G. Cellular Regulation of Hemoglobin Switching: Evidence for Inverse Relationship between Fetal Hemoglobin Synthesis and Degree of Maturity of Human Erythroid Cells. Proc. Natl. Acad. Sci. USA 1979, 76, 6420–6424. [Google Scholar] [CrossRef] [PubMed] [Green Version]
- Steinberg, M.H.; Rodgers, G.P. HbA2: Biology, Clinical Relevance and a Possible Target for Ameliorating Sickle Cell Disease. Br. J. Haematol. 2015, 170, 781–787. [Google Scholar] [CrossRef]
- Feng, R.; Mayuranathan, T.; Huang, P.; Doerfler, P.A.; Li, Y.; Yao, Y.; Zhang, J.; Palmer, L.E.; Xu, P.; Mayberry, K.; et al. Regulation of Fetal Hemoglobin Expression By the VHL-HIF1α Oxygen Sensing System. Blood 2021, 138, 574. [Google Scholar] [CrossRef]
- Daisy Narayan, A.; Ersek, A.; Campbell, T.A.; Colón, D.M.; Pixley, J.S.; Zanjani, E.D. The Effect of Hypoxia and Stem Cell Source on Haemoglobin Switching. Br. J. Haematol. 2005, 128, 562–570. [Google Scholar] [CrossRef]
- Pace, B.S.; White, G.L.; Dover, G.J.; Boosalis, M.S.; Faller, D.V.; Perrine, S.P. Short-Chain Fatty Acid Derivatives Induce Fetal Globin Expression and Erythropoiesis in Vivo. Blood 2002, 100, 4640–4648. [Google Scholar] [CrossRef]
- Hubbi, M.E.; Semenza, G.L. Regulation of Cell Proliferation by Hypoxia-Inducible Factors. Am. J. Physiol.-Cell Physiol. 2015, 309, C775–C782. [Google Scholar] [CrossRef] [Green Version]
- Lee, P.; Chandel, N.S.; Celeste Simon, M. Cellular Adaptation to Hypoxia through HIFs and Beyond. Nat. Rev. Mol. Cell Biol. 2020, 21, 268–283. [Google Scholar] [CrossRef]
- Lloyd, A.C. The Regulation of Cell Size. Cell 2013, 154, 1194–1205. [Google Scholar] [CrossRef] [Green Version]
- Semenza, G.L. HIF-1: Mediator of Physiological and Pathophysiological Responses to Hypoxia. J. Appl. Physiol. 2000, 88, 1474–1480. [Google Scholar] [CrossRef] [PubMed] [Green Version]
- Lockwood, S.Y.; Erkal, J.L.; Spence, D.M. Endothelium-Derived Nitric Oxide Production Is Increased by ATP Released from Red Blood Cells Incubated with Hydroxyurea. Nitric Oxide 2014, 38, 1–7. [Google Scholar] [CrossRef] [PubMed]
- Helms, C.C.; Gladwin, M.T.; Kim-Shapiro, D.B. Erythrocytes and Vascular Function: Oxygen and Nitric Oxide. Front. Physiol. 2018, 9, 125. [Google Scholar] [CrossRef] [Green Version]
- Sabirov, R.Z.; Okada, Y. ATP Release via Anion Channels. Purinergic Signal. 2005, 1, 311–328. [Google Scholar] [CrossRef] [Green Version]
- Grygorczyk, R.; Orlov, S.N. Effects of hypoxia on erythrocyte membrane properties—Implications for intravascular hemolysis and purinergic control of blood flow. Front. Physiol. 2017, 8, 1110. [Google Scholar] [CrossRef] [Green Version]
- Rogers, S.C.; Said, A.; Corcuera, D.; McLaughlin, D.; Kell, P.; Doctor, A. Hypoxia Limits Antioxidant Capacity in Red Blood Cells by Altering Glycolytic Pathway Dominance. FASEB J. 2009, 23, 3159–3170. [Google Scholar] [CrossRef] [Green Version]
- Place, T.L.; Domann, F.E.; Case, A.J. Limitations of Oxygen Delivery to Cells in Culture: An Underappreciated Problem in Basic and Translational Research. Free Radic. Biol. Med. 2017, 113, 311–322. [Google Scholar] [CrossRef]
- Szklarczyk, D.; Gable, A.L.; Nastou, K.C.; Lyon, D.; Kirsch, R.; Pyysalo, S.; Doncheva, N.T.; Legeay, M.; Fang, T.; Bork, P.; et al. The STRING database in 2021: Customizable protein–protein networks, and functional characterization of user-uploaded gene/measurement sets. Nucleic Acids Res. 2020, 49, D605–D612. [Google Scholar] [CrossRef]


Publisher’s Note: MDPI stays neutral with regard to jurisdictional claims in published maps and institutional affiliations. |
© 2022 by the authors. Licensee MDPI, Basel, Switzerland. This article is an open access article distributed under the terms and conditions of the Creative Commons Attribution (CC BY) license (https://creativecommons.org/licenses/by/4.0/).
Share and Cite
Simionato, G.; Rabe, A.; Gallego-Murillo, J.S.; van der Zwaan, C.; Hoogendijk, A.J.; van den Biggelaar, M.; Minetti, G.; Bogdanova, A.; Mairbäurl, H.; Wagner, C.; et al. In Vitro Erythropoiesis at Different pO2 Induces Adaptations That Are Independent of Prior Systemic Exposure to Hypoxia. Cells 2022, 11, 1082. https://doi.org/10.3390/cells11071082
Simionato G, Rabe A, Gallego-Murillo JS, van der Zwaan C, Hoogendijk AJ, van den Biggelaar M, Minetti G, Bogdanova A, Mairbäurl H, Wagner C, et al. In Vitro Erythropoiesis at Different pO2 Induces Adaptations That Are Independent of Prior Systemic Exposure to Hypoxia. Cells. 2022; 11(7):1082. https://doi.org/10.3390/cells11071082
Chicago/Turabian StyleSimionato, Greta, Antonia Rabe, Joan Sebastián Gallego-Murillo, Carmen van der Zwaan, Arie Johan Hoogendijk, Maartje van den Biggelaar, Giampaolo Minetti, Anna Bogdanova, Heimo Mairbäurl, Christian Wagner, and et al. 2022. "In Vitro Erythropoiesis at Different pO2 Induces Adaptations That Are Independent of Prior Systemic Exposure to Hypoxia" Cells 11, no. 7: 1082. https://doi.org/10.3390/cells11071082