
Protective Effects of Chaya against Mitochondrial and Synaptic Toxicities in the Type 2 Diabetes Mouse Model TallyHO

 , , and
Abstract
:1. Introduction
2. Materials and Methods
2.1. Animals
2.2. Chaya
2.3. Treatment of Animals
- Group 1—TH diabetic mice fed with chaya chow (diabetic experimental group)
- Group 2—TH diabetic mice fed with regular chow (diabetic control group)
- Group 3—SWR/J mice fed with regular chow (non-diabetic control group)
2.4. Quantitative Real-Time PCR (qRT-PCR)
2.5. Western Blotting Analysis
2.6. Immunostaining Analysis
2.7. Mitochondrial Functional Assays
2.8. Statistical Analysis
3. Results
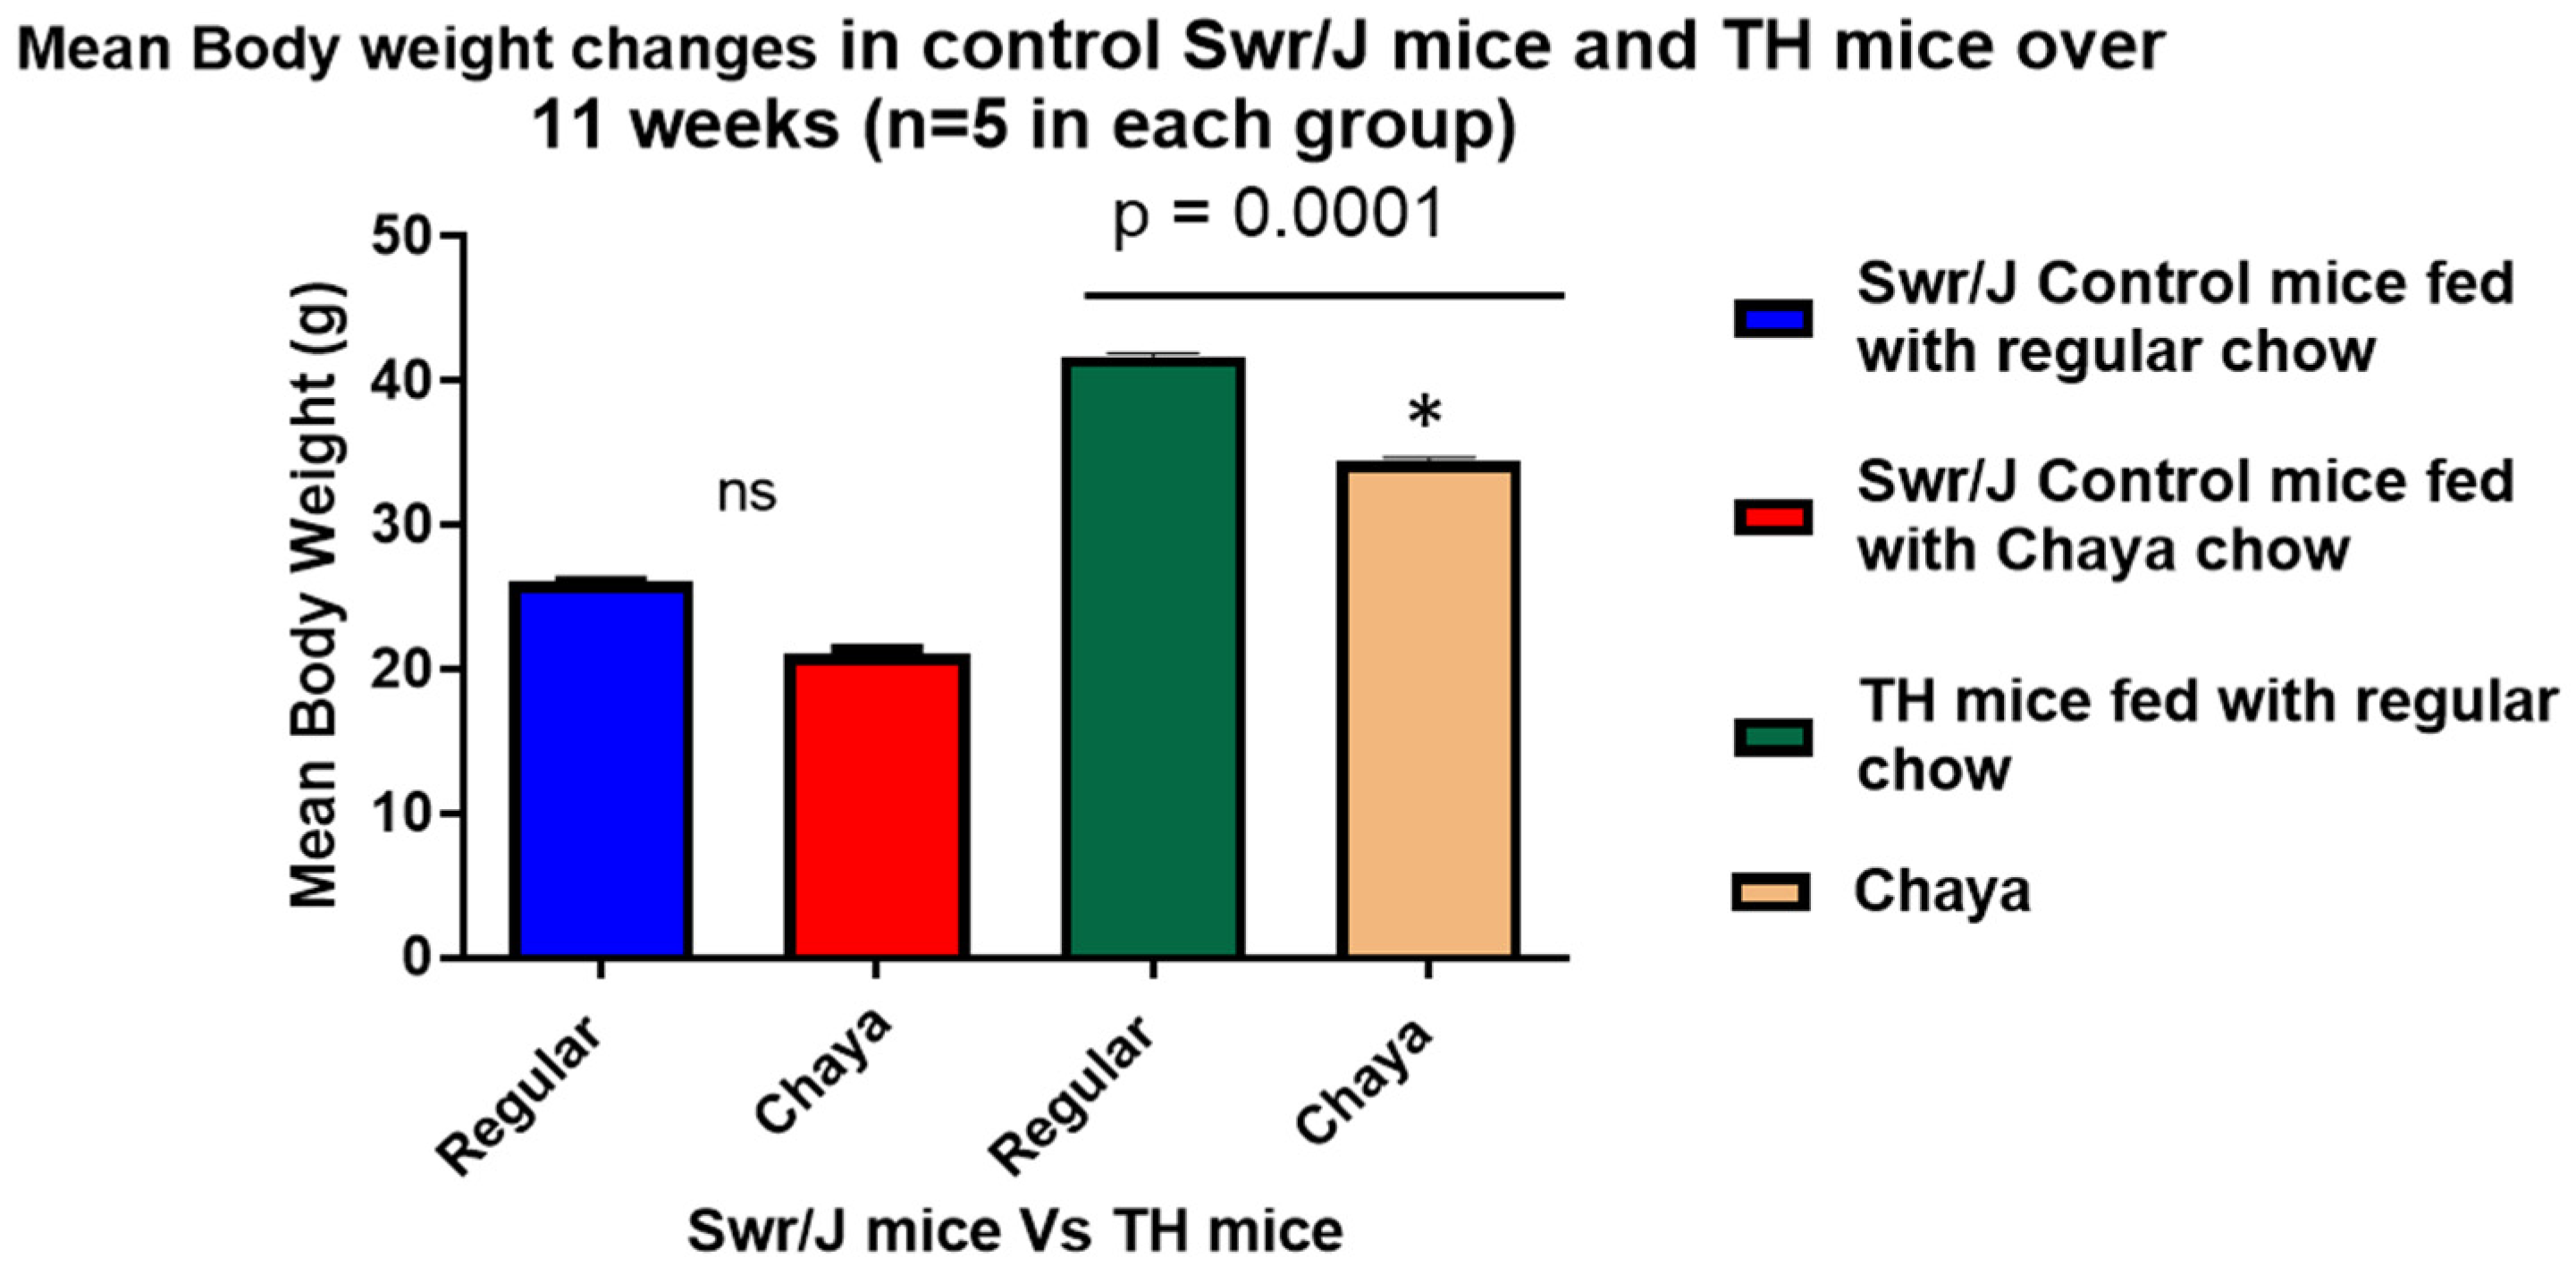
3.1. Hyperglycemia
3.2. mRNA Levels of Mitochondrial Dynamics, Biogenesis, Autophagy, Mitophagy, and Synaptic Genes
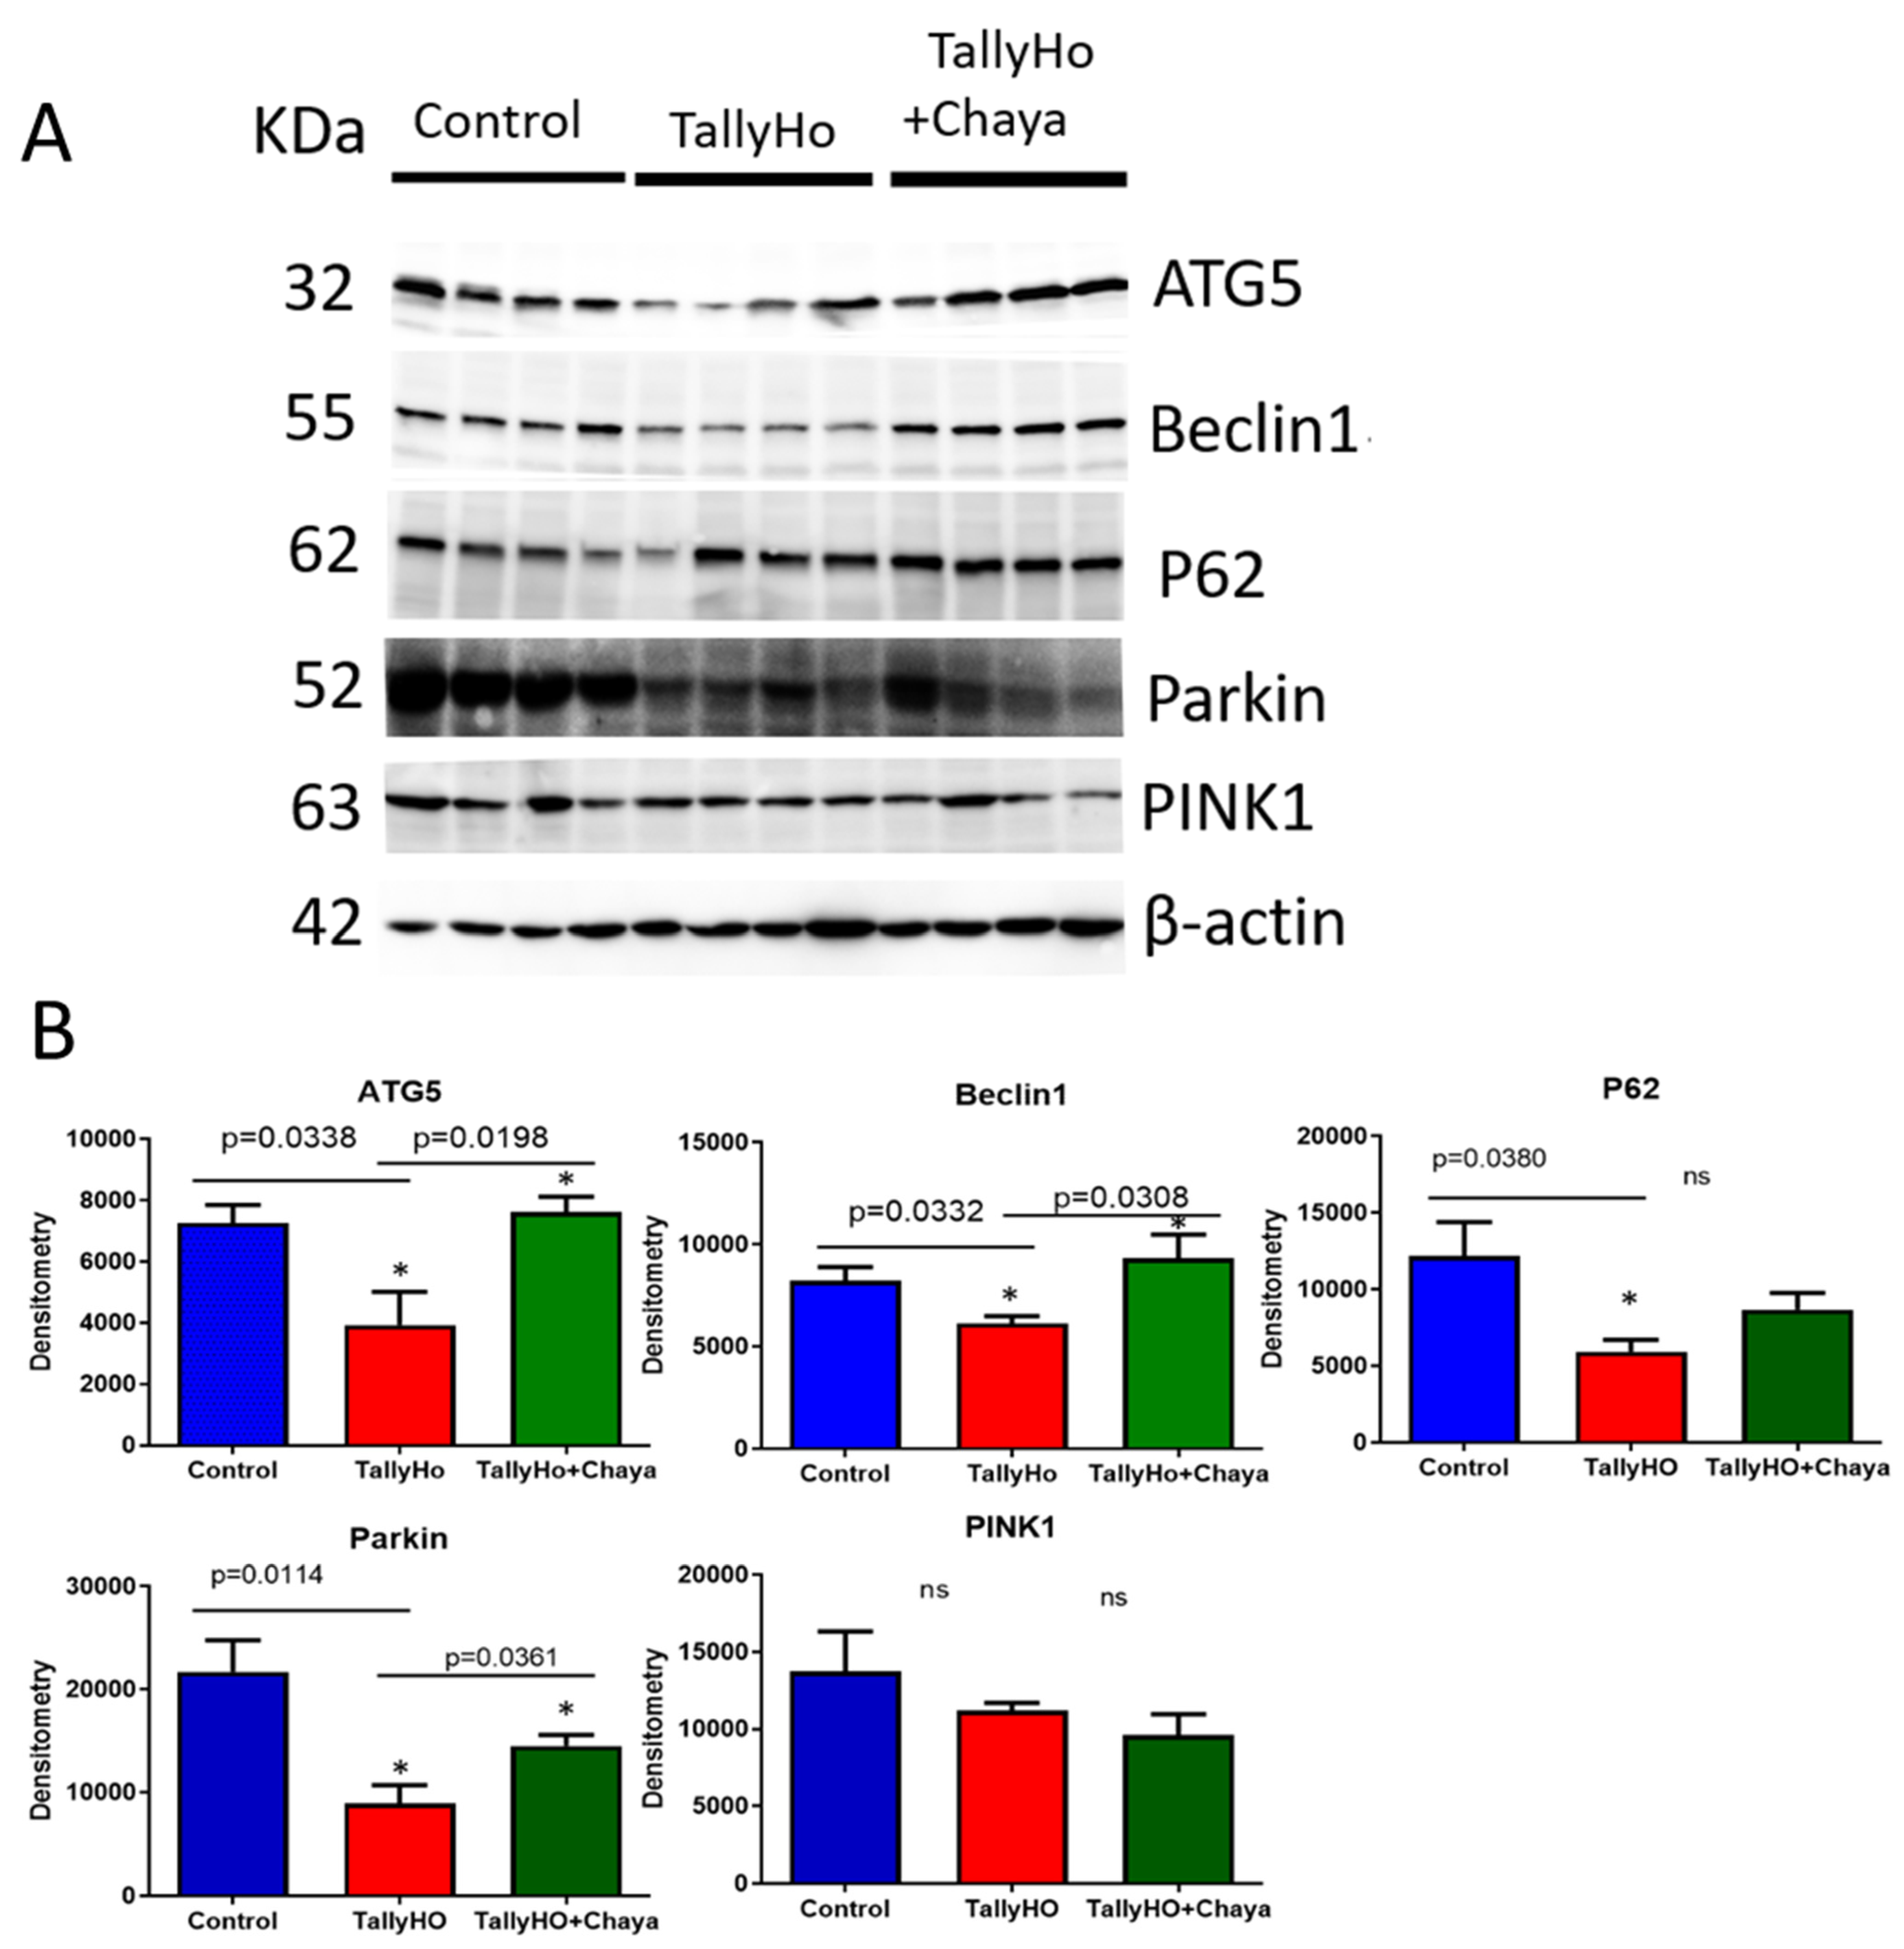
3.3. Immunoblotting Analysis
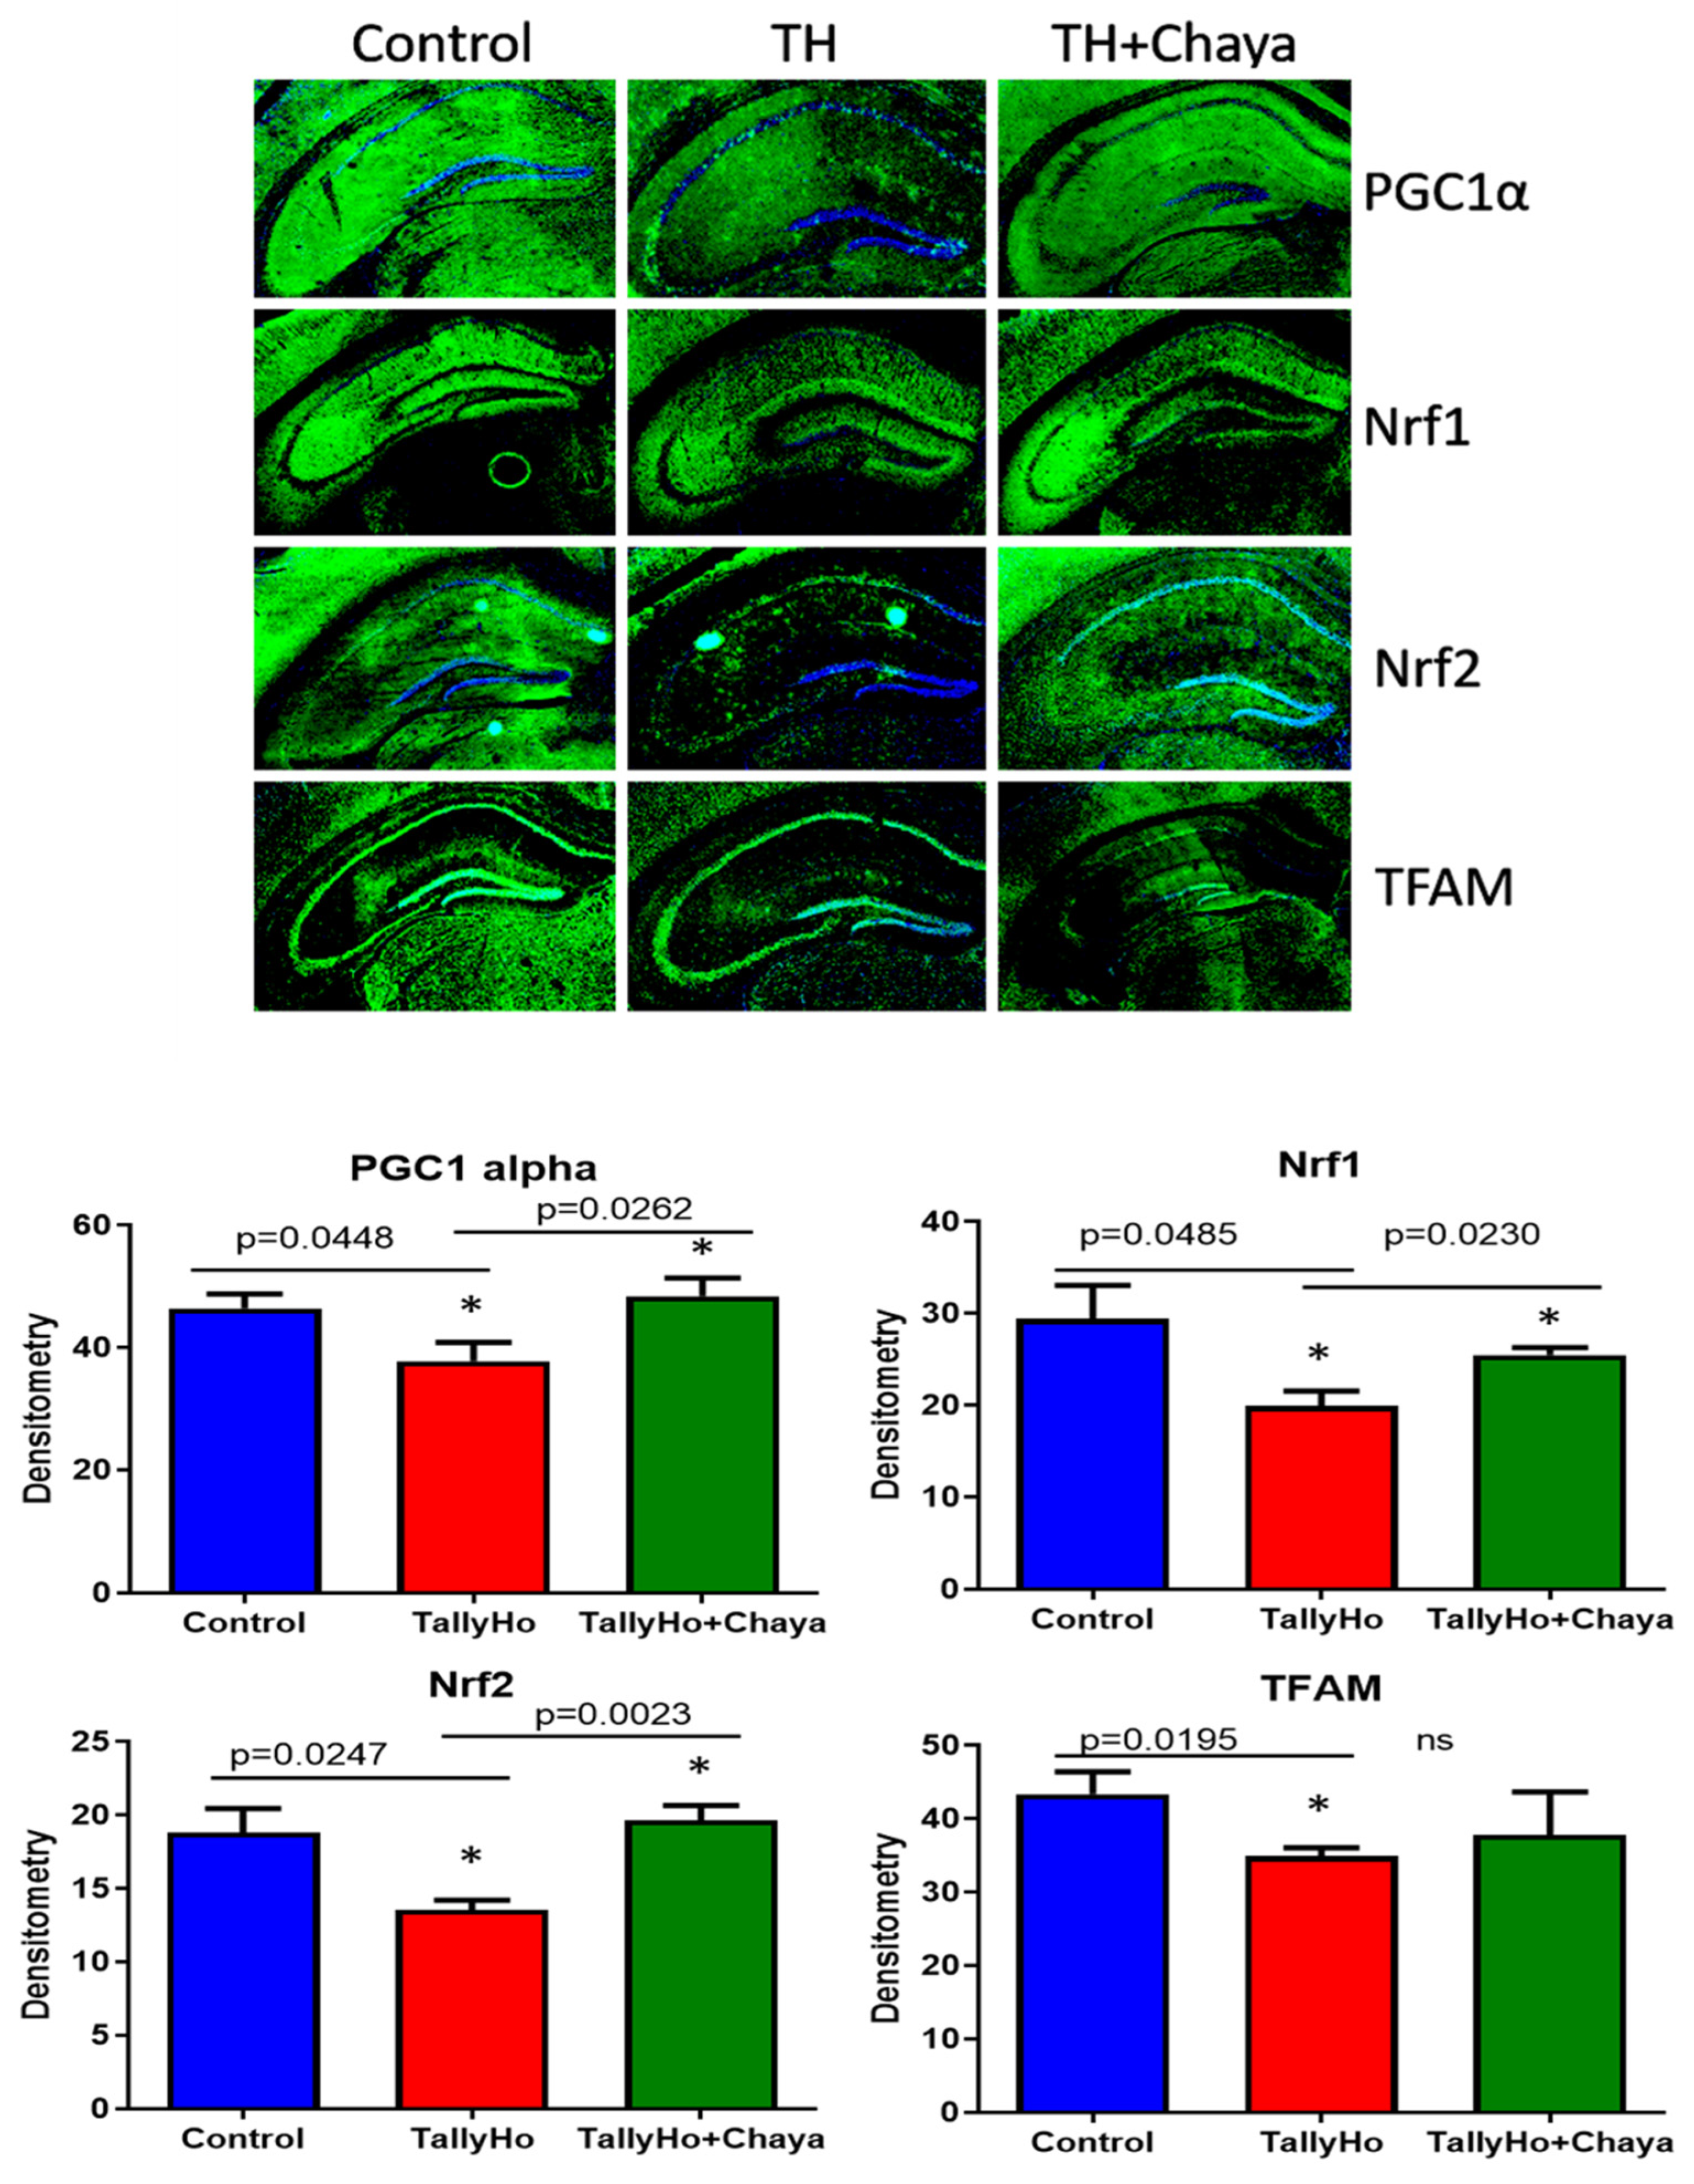
3.4. Immunofluorescence Analysis
3.5. Mitochondrial Functional Assays
4. Discussion
Author Contributions
Funding
Institutional Review Board Statement
Informed Consent Statement
Data Availability Statement
Acknowledgments
Conflicts of Interest
References
- Cersosimo, E.; Triplitt, C.; Solis-Herrera, C.; Mandarino, L.J.; DeFronzo, R.A. Pathogenesis of Type 2 Diabetes Mellitus. In Endotext; Feingold, K.R., Ed.; 2008. Available online: https://www.ncbi.nlm.nih.gov/sites/books/NBK279115/ (accessed on 15 December 2021).
- International Diabetes Federation. Diabetes Atlas 9th Edition. Available online: https://www.idf.org/e-library/epidemiology-research/diabetes-atlas.html (accessed on 10 February 2022).
- Salehi, B.; Ata, A.V.; Anil Kumar, N.; Sharopov, F.; Ramírez-Alarcón, K.; Ruiz-Ortega, A.; Abdulmajid Ayatollahi, S.; Tsouh Fokou, P.V.; Kobarfard, F.; Amiruddin Zakaria, Z.; et al. Antidiabetic Potential of Medicinal Plants and Their Active Components. Biomolecules 2019, 9, 551. [Google Scholar] [CrossRef] [Green Version]
- Oh, Y.S. Plant-Derived Compounds Targeting Pancreatic Beta Cells for the Treatment of Diabetes. Evid.-Based Complement. Altern. Med. 2015, 2015, 629863. [Google Scholar] [CrossRef] [PubMed] [Green Version]
- Ross-Ibarra, J.; Molina-Cruz, A. Ethnobotany of chaya Cnidoscolus aconitifolius ssp. aconitifolius Breckon): A Nutritious Maya Vegetable. Econ. Bot. 2002, 56, 350–365. [Google Scholar] [CrossRef]
- Kuti, J.O.; Torres, E.S. Potential nutritional and health benefits of tree spinach. In Progress in New Crops; Janick, J., Ed.; ASHS Press: Arlington, VA, USA, 1996; pp. 516–520. [Google Scholar]
- Bourbonnais-Spear, N.; Poissant, J.; Cal, V.; Arnason, J.T. Culturally Important Plants from Southern Belize: Domestication by Q’eqchi’ Maya Healers and Conservation. AMBIO J. Human. Environ. 2006, 35, 138–140. [Google Scholar] [CrossRef]
- Griffith, L.; Griffith, C. Let Them Eat Chaya: Cultural Revitalization through Culinary Offerings in Belize. Heritage 2021, 4, 1511–1525. [Google Scholar] [CrossRef]
- Diaz-Bolio, J. Chaya (Cnidoscolus chayamansa, Euphorbiaceae), a marvellous food. Tierra 1975, 30, 407–428. (In Spanish) [Google Scholar]
- Mordi, J.C. Antidiabetic Potential of the Aqueous Leaf Extract of Cnidoscolus aconitifolius on Streptozotocin (STZ) Induced Diabetes in Wistar Rat Hepatocytes. Curr. Res. J. Biol. Sci. 2012, 4, 164–167. [Google Scholar]
- Pillai, K.K.; Chidambaranathan, N.; Halith, M.M.; Jayaprakash, S.; Narayanan, N. Anti- Hyperglycemic Effect Of Alcoholic Extracts Of Cnidoscolus Chayamansa in Experimental Diabetes And Their Effects On Key Metabolic Enzymes Involved In Carbohydrate Metabolism. Int. J. Res. Pharm. Chem. 2012, 2, 179–187. [Google Scholar]
- Ramos-Gomez, M.; Figueroa-Pérez, M.G.; Guzman-Maldonado, H.; Loarca-Piña, G.; Mendoza, S.; Quezada-Tristán, T.; Reynoso-Camacho, R. Phytochemical Profile, Antioxidant Properties and Hypoglycemic Effect of Chaya (Cnidoscolus Chayamansa) in STZ-Induced Diabetic Rats. J. Food Biochem. 2017, 41, e12281. [Google Scholar] [CrossRef]
- Loarca-Piña, G.; Mendoza, S.; Ramos-Gómez, M.; Reynoso, R. Antioxidant, antimutagenic, and antidiabetic activities of edible leaves from Cnidoscolus chayamansa Mc. Vaugh. J. Food Sci. 2010, 75, H68–H72. [Google Scholar] [CrossRef]
- García-Rodríguez, R.V.; Gutiérrez-Rebolledo, G.A.; Méndez-Bolaina, E.; Sánchez-Medina, A.; Maldonado-Saavedra, O.; Domínguez-Ortiz, M.Á.; Vázquez-Hernández, M.; Muñoz-Muñiz, O.D.; Cruz-Sánchez, J.S. Cnidoscolus chayamansa Mc Vaugh, an important antioxidant, anti-inflammatory and cardioprotective plant used in Mexico. J. Ethnopharmacol. 2014, 151, 937–943. [Google Scholar] [CrossRef] [PubMed]
- Kim, J.H.; Saxton, A.M. The TALLYHO mouse as a model of human type 2 diabetes. Methods Mol. Biol. 2012, 933, 75–87. [Google Scholar] [PubMed]
- Ramasubramanian, B.; Reddy, P.H. Are TallyHo mice a true model for Type2 Diabetes and Alzheimer’s disease? J. Alzheimer’s Dis. 2019, 72, S81–S93. [Google Scholar] [CrossRef]
- Bhatti, J.S.; Tamarai, K.; Kandimalla, R.; Manczak, M.; Yin, X.; Ramasubramanian, B.; Sawant, N.; Pradeepkiran, J.A.; Vijayan, M.; Kumar, S.; et al. Protective effects of a mitochondria-targeted small peptide SS31 against hyperglycemia-induced mitochondrial abnormalities in the liver tissues of diabetic mice, Tallyho/JngJ mice. Mitochondrion 2021, 58, 49–58. [Google Scholar] [CrossRef] [PubMed]
- Kim, J.H.; Sen, S.; Avery, C.S.; Simpson, E.; Chandler, P.; Nishina, P.M.; Churchill, G.A.; Naggert, J.K. Genetic analysis of a new mouse model for non-insulin-dependent diabetes. Genomics 2001, 74, 273–286. [Google Scholar] [CrossRef] [PubMed]
- Joost, H.G.; Schurmann, A. The genetic basis of obesity-associated type 2 diabetes (diabesity) in polygenic mouse models. Mamm. Genome 2014, 25, 401–412. [Google Scholar] [CrossRef] [PubMed] [Green Version]
- Kim, J.H.; Stewart, T.P.; Soltani-Bejnood, M.; Wang, L.; Fortuna, J.M.; Mostafa, O.A.; Moustaid-Moussa, N.; Shoieb, A.M.; McEntee, M.F.; Wang, Y.; et al. Phenotypic characterization of polygenic type 2 diabetes in TALLYHO/JngJ mice. J. Endocrinol. 2006, 191, 437–446. [Google Scholar] [CrossRef] [Green Version]
- Sharma, A.N.; Elased, K.M.; Garrett, T.L.; Lucot, J.B. Neurobehavioral deficits in db/db diabetic mice. Physiol. Behav. 2010, 101, 381–388. [Google Scholar] [CrossRef] [Green Version]
- Wu, Y.; Ye, L.; Yuan, Y.; Jiang, T.; Guo, X.; Wang, Z.; Xu, K.; Xu, Z.; Liu, Y.; Zhong, X.; et al. Autophagy Activation is Associated with Neuroprotection in Diabetes-associated Cognitive Decline. Aging Dis. 2019, 10, 1233–1245. [Google Scholar] [CrossRef] [Green Version]
- Sarmiento-Franco, L.; McNab, J.M.; Pearson, R.A.; Belmar-Casso, R. Performance of broilers fed on diets containing different amounts of chaya (Cnidoscolus aconitifolius) leaf meal. Trop. Anim. Health Prod. 2002, 34, 257–269. [Google Scholar] [CrossRef]
- Manczak, M.; Kandimalla, R.; Fry, D.; Sesaki, H.; Reddy, P.H. Protective effects of reduced dynamin-related protein 1 against amyloid beta-induced mitochondrial dysfunction and synaptic damage in Alzheimer’s disease. Hum. Mol. Genet. 2016, 25, 5148–5166. [Google Scholar] [CrossRef] [PubMed] [Green Version]
- Bhatti, J.S.; Thamarai, K.; Kandimalla, R.; Manczak, M.; Yin, X.; Kumar, S.; Vijayan, M.; Reddy, P.H. Mitochondria-Targeted Small Peptide, SS31 Ameliorates Diabetes Induced Mitochondrial Dynamics in Male TallyHO/JngJ Mice. Mol. Neurobiol. 2021, 58, 795–808. [Google Scholar] [CrossRef] [PubMed]
- Tamarai, K.; Bhatti, J.S.; Reddy, P.H. Molecular and cellular bases of diabetes: Focus on type 2 diabetes mouse model-TallyHo. Biochim. Biophys. Acta Mol. Basis Dis. 2019, 1865, 2276–2284. [Google Scholar] [CrossRef] [PubMed]
- Potenza, M.A.; Sgarra, L.; Desantis, V.; Nacci, C.; Montagnani, M. Diabetes and Alzheimer’s Disease: Might Mitochondrial Dysfunction Help Deciphering the Common Path? Antioxidants 2021, 10, 1257. [Google Scholar] [CrossRef] [PubMed]
- Ke, Y.D.; Delerue, F.; Gladbach, A.; Götz, J.; Ittner, L.M. Experimental diabetes mellitus exacerbates tau pathology in a transgenic mouse model of Alzheimer’s disease. PLoS ONE 2009, 4, e7917. [Google Scholar] [CrossRef] [Green Version]


| Gene | DNA Sequence (5-3) | PCR Product Size |
|---|---|---|
| Mitochondrial Dynamics Genes | ||
| Drp1 | Forward Primer ATGCCAGCAAGTCCACAGAA | 86 |
| Reverse Primer TGTTCTCGGGCAGACAGTTT | ||
| Fis1 | Forward Primer CAAAGAGGAACAGCGGGACT | 95 |
| Reverse Primer ACAGCCCTCGCACATACTTT | ||
| Mfn1 | Forward Primer GCAGACAGCACATGGAGAGA | 83 |
| Reverse Primer GATCCGATTCCGAGCTTCCG | ||
| Mfn2 | Forward Primer TGCACCGCCATATAGAGGAAG | 78 |
| Reverse Primer TCTGCAGTGAACTGGCAATG | ||
| Opa1 | Forward Primer ACCTTGCCAGTTTAGCTCCC | 82 |
| Reverse Primer TTGGGACCTGCAGTGAAGAA | ||
| Mitochondrial Biogenesis Genes | 83 | |
| PGC1α | Forward Primer GCAGTCGCAACATGCTCAAG | |
| Reverse Primer GGGAACCCTTGGGGTCATTT | ||
| NRF1 | Forward Primer AGAAACGGAAACGGCCTCAT | 96 |
| Reverse Primer CATCCAACGTGGCTCTGAGT | ||
| NRF2 | Forward Primer ATGGAGCAAGTTTGGCAGGA | 96 |
| Reverse Primer GCTGGGAACAGCGGTAGTAT | ||
| TFAM | Forward Primer TCCACAGAACAGCTACCCAA | 84 |
| Reverse primer CCACAGGGCTGCAATTTTCC | ||
| Reverse Primer AGACGGTTGTTGATTAGGCGT | ||
| Autophagy/Mitophagy Genes | ||
| ATG5 | Forward Primer TCCATCCAAGGATGCGGTTG | 95 |
| Reverse Primer TCTGCATTTCGTTGATCACTTGAC | ||
| PINK1 | Forward Primer CCATCGGGATCTCAAGTCCG | 70 |
| Reverse Primer GATCACTAGCCAGGGACAGC | ||
| TERT | Forward Primer GCAAGGTGGTGTCTGCTAGT | 100 |
| Reverse Primer AGCTTGCCGTATTTCCCCAA | ||
| Synaptic Genes | ||
| Synaptophysin | Forward Primer CTGCGTTAAAGGGGGCACTA | 81 |
| Reverse Primer ACAGCCACGGTGACAAAGAA | ||
| PSD95 | Forward Primer CTTCATCCTTGCTGGGGGTC | 90 |
| Reverse Primer TTGCGGAGGTCAACACCATT | ||
| Housekeeping Genes | ||
| β-actin | Forward Primer AGAAGCTGTGCTATGTTGCTCTA | 91 |
| Reverse Primer TCAGGCAGCTCATAGCTCTTC | ||
| GAPDH | Forward Primer TTCCCGTTCAGCTCTGGG | 59 |
| Reverse Primer CCCTGCATCCACTGGTGC |
| Markers | Primary Antibody (Species and Dilution) | Supplier | Secondary Antibody (Species and Dilution) | Purchased from Company, City, and State |
|---|---|---|---|---|
| β-Actin | Mouse monoclonal 1:1000 | Sigma–Aldrich, St Luis, MO | Sheep Anti-mouse HRP 1:10,000 | GE Healthcare Amersham, Piscataway, NJ |
| Drp1 | Rabbit polyclonal 1:500 | Novus Biological, Littleton, CO | Donkey Anti-rabbit HRP 1:10,000 | GE Healthcare Amersham, Piscataway, NJ |
| Mfn1 | Rabbit polyclonal 1:400 | Novus Biological, Littleton, CO | Donkey Anti-rabbit HRP 1:10,000 | GE Healthcare Amersham, Piscataway, NJ |
| Fis1 | Rabbit polyclonal 1:500 | Protein Tech Group, Inc., Chicago, IL | Donkey Anti-rabbit HRP 1:10,000 | GE Healthcare Amersham, Piscataway, NJ |
| Opa1 | Rabbit polyclonal 1:400 | Novus Biological, Littleton, CO | Donkey Anti-rabbit HRP 1:10,000 | GE Healthcare Amersham, Piscataway, NJ |
| Nrf1 | Rabbit polyclonal 1:400 | Cell Signalling Technology, Danvers, MA | Donkey Anti-rabbit HRP 1:10,000 | GE Healthcare Amersham, Piscataway, NJ |
| MAP2 | Rabbit monoclonal 1:600 | Invitrogen, Waltham, MA | Donkey Anti-rabbit HRP 1:10,000 | GE Healthcare Amersham, Piscataway, NJ |
| ATG5 | Rabbit polyclonal 1:400 | Novus Biological, Littleton, CO | Donkey Anti-rabbit HRP 1:10,000 | GE Healthcare Amersham, Piscataway, NJ |
| Beclin1 | Rabbit polyclonal 1:400 | Novus Biological, Littleton, CO | Donkey Anti-rabbit HRP 1:10,000 | GE Healthcare Amersham, Piscataway, NJ |
| TFAM | Rabbit polyclonal 1:400 | Novus Biological, Littleton, CO | Donkey Anti-rabbit HRP 1:10,000 | GE Healthcare Amersham, Piscataway, NJ |
| PGC 1α | Rabbit polyclonal 1:3000 | Novus Biological, Littleton, CO | Donkey Anti-rabbit HRP 1:10,000 | GE Healthcare Amersham, Piscataway, NJ |
| Synapto physin | Rabbit polyclonal 1:3000 | Novus Biological, Littleton, CO | Donkey Anti-rabbit HRP 1:10,000 | GE Healthcare Amersham, Piscataway, NJ |
| PSD95 | Rabbit polyclonal 1:400 | Cell Signalling Technology, Danvers, MA | Donkey Anti-rabbit HRP 1:10,000 | GE Healthcare Amersham, Piscataway, NJ |
| PARKIN | Mouse monoclonal 1:600 | Novus Biological, Littleton, CO | Donkey Anti-rabbit HRP 1:10,000 | GE Healthcare Amersham, Piscataway, NJ |
| PINK1 | Rabbit polyclonal 1:400 | Novus Biological, Littleton, CO | Donkey Anti-rabbit HRP 1:10,000 | GE Healthcare Amersham, Piscataway, NJ |
| SQSTM1/P62 | Rabbit polyclonal 1:1000 | Cell Signalling Technology, Danvers, MA | Donkey Anti-rabbit HRP 1:10,000 | GE Healthcare Amersham, Piscataway, NJ |
| Markers | Primary Antibody (Species and Dilution) | Supplier | Secondary Antibody (Species and Dilution) | Purchased from Company, City, and State |
|---|---|---|---|---|
| Drp1 | Rabbit polyclonal 1:100 | Novus Biological, Littleton, CO | Donkey anti-rabbit IgG Alexa Fluor 488 | Thermo Fisher Scientific, Waltham, MA |
| Fis1 | Rabbit polyclonal 1:100 | Protein Tech Group, Inc., Chicago, IL | Donkey anti-rabbit IgG Alexa Fluor 488 | Thermo Fisher Scientific, Waltham, MA |
| Opa1 | Rabbit polyclonal 1:100 | Novus Biological, Littleton, CO | Donkey anti-rabbit IgG Alexa Fluor 488 | Thermo Fisher Scientific, Waltham, MA |
| Mfn1 | Rabbit polyclonal 1:100 | Novus Biological, Littleton, CO | Donkey anti-rabbit IgG Alexa Fluor 488 | Thermo Fisher Scientific, Waltham, MA |
| Mfn 2 | Rabbit polyclonal 1:100 | Novus Biological, Littleton, CO | Donkey anti-rabbit IgG Alexa Fluor 488 | Thermo Fisher Scientific, Waltham, MA |
| PGC 1α | Rabbit polyclonal 1:100 | Novus Biological, Littleton, CO | Donkey anti-rabbit IgG Alexa Fluor 488 | Thermo Fisher Scientific, Waltham, MA |
| Nrf1 | Rabbit polyclonal 1:100 | Cell Signalling Technology, Danvers, MA | Donkey anti-rabbit IgG Alexa Fluor 488 | Thermo Fisher Scientific, Waltham, MA |
| Nrf2 | Rabbit polyclonal 1:100 | Cell Signalling Technology, Danvers, MA | Donkey anti-rabbit IgG Alexa Fluor 488 | Thermo Fisher Scientific, Waltham, MA |
| TFAM | Rabbit polyclonal 1:100 | Novus Biological, Littleton, CO | Donkey anti-rabbit IgG Alexa Fluor 488 | Thermo Fisher Scientific, Waltham, MA |
| PARKIN | Mouse monoclonal 1:100 | Novus Biological, Littleton, CO | Donkey anti-rabbit IgG Alexa Fluor 488 | Thermo Fisher Scientific, Waltham, MA |
| PINK1 | Rabbit polyclonal 1:100 | Novus Biological, Littleton, CO | Donkey anti-rabbit IgG Alexa Fluor 488 | Thermo Fisher Scientific, Waltham, MA |
| Synapto physin | Rabbit polyclonal 1:100 | Novus Biological, Littleton, CO | Donkey anti-rabbit IgG Alexa Fluor 488 | Thermo Fisher Scientific, Waltham, MA |
| PSD95 | Rabbit polyclonal 1:100 | Cell Signalling Technology, Danvers, MA | Donkey anti-rabbit IgG Alexa Fluor 488 | Thermo Fisher Scientific, Waltham, MA |
| MAP2 | Rabbit polyclonal 1:100 | Invitrogen, Waltham, MA | Goat anti-mouse IgG Alexa Fluor 594 | Thermo Fisher Scientific, Waltham, MA |
| Biological Pathways | Genes | mRNA Fold Change TallyHO vs. Control | mRNA Fold Change Chaya vs. TallyHO |
|---|---|---|---|
| Mitochondrial structure | DRP1 | 5.7 | −0.78 |
| FIS1 | 6.7 | −0.75 | |
| MFN1 | −4.1 | 2.6 | |
| MFN2 | −4.5 | 2.4 | |
| OPA1 | −3.1 | 1.1 | |
| Biogenesis | NRF1 | −0.5 | 0.2 |
| NRF2 | −0.6 | 0.4 | |
| TFAM | −1.1 | 1.98 | |
| PGC1-α | −2.0 | 0.97 | |
| Autophagy | ATG5 | −3.1 | 3.9 |
| PINK1 | −4.6 | 8.7 | |
| Mitophagy | TERT | −4.1 | 3.4 |
| Synaptic | Synaptophysin | −4.0 | 2.5 |
| PSD95 | −3.7 | 3.4 |
Publisher’s Note: MDPI stays neutral with regard to jurisdictional claims in published maps and institutional affiliations. |
© 2022 by the authors. Licensee MDPI, Basel, Switzerland. This article is an open access article distributed under the terms and conditions of the Creative Commons Attribution (CC BY) license (https://creativecommons.org/licenses/by/4.0/).
Share and Cite
Ramasubramanian, B.; Griffith, C.; Hanson, M.; Bunquin, L.E.; Reddy, A.P.; Hegde, V.; Reddy, P.H. Protective Effects of Chaya against Mitochondrial and Synaptic Toxicities in the Type 2 Diabetes Mouse Model TallyHO. Cells 2022, 11, 744. https://doi.org/10.3390/cells11040744
Ramasubramanian B, Griffith C, Hanson M, Bunquin LE, Reddy AP, Hegde V, Reddy PH. Protective Effects of Chaya against Mitochondrial and Synaptic Toxicities in the Type 2 Diabetes Mouse Model TallyHO. Cells. 2022; 11(4):744. https://doi.org/10.3390/cells11040744
Chicago/Turabian StyleRamasubramanian, Bhagavathi, Cameron Griffith, Madison Hanson, Lloyd E. Bunquin, Arubala P. Reddy, Vijay Hegde, and P. Hemachandra Reddy. 2022. "Protective Effects of Chaya against Mitochondrial and Synaptic Toxicities in the Type 2 Diabetes Mouse Model TallyHO" Cells 11, no. 4: 744. https://doi.org/10.3390/cells11040744