Article

Impact of β-Amyloids Induced Disruption of Ca2+ Homeostasis in a Simple Model of Neuronal Activity

by
Francisco Prista von Bonhorst
1,
David Gall
2 and
Geneviève Dupont
1,*
1
Unit of Theoretical Chronobiology, Faculté des Sciences (CP231), Université Libre de Bruxelles (ULB), 1050 Brussels, Belgium
2
Research Laboratory in Human Reproduction, Faculté de Médecine (CP636), Université Libre de Bruxelles (ULB), 1070 Brussels, Belgium
*
Author to whom correspondence should be addressed.
Cells 2022, 11(4), 615; https://doi.org/10.3390/cells11040615
Submission received: 26 November 2021 / Revised: 31 January 2022 / Accepted: 1 February 2022 / Published: 10 February 2022

Abstract

:
Alzheimer’s disease is characterized by a marked dysregulation of intracellular Ca2+ homeostasis. In particular, toxic β-amyloids (Aβ) perturb the activities of numerous Ca2+ transporters or channels. Because of the tight coupling between Ca2+ dynamics and the membrane electrical activity, such perturbations are also expected to affect neuronal excitability. We used mathematical modeling to systematically investigate the effects of changing the activities of the various targets of Aβ peptides reported in the literature on calcium dynamics and neuronal excitability. We found that the evolution of Ca2+ concentration just below the plasma membrane is regulated by the exchanges with the extracellular medium, and is practically independent from the Ca2+ exchanges with the endoplasmic reticulum. Thus, disruptions of Ca2+ homeostasis interfering with signaling do not affect the electrical properties of the neurons at the single cell level. In contrast, the model predicts that by affecting the activities of L-type Ca2+ channels or Ca2+-activated K+ channels, Aβ peptides promote neuronal hyperexcitability. On the contrary, they induce hypo-excitability when acting on the plasma membrane Ca2+ ATPases. Finally, the presence of pores of amyloids in the plasma membrane can induce hypo- or hyperexcitability, depending on the conditions. These modeling conclusions should help with analyzing experimental observations in which Aβ peptides interfere at several levels with Ca2+ signaling and neuronal activity.

1. Introduction

Ca2+ ions play a key role in intracellular signaling by controlling vital physiological processes such as secretion, gene expression, and apoptosis [1]. In neurons, they also act as a charge carrier. Thus, during neuronal activity, Ca2+ concentration and plasma membrane (PM) voltage changes are intimately related: Ca2+ entry through voltage gated Ca2+ channels can affect Ca2+ signaling, while voltage independent Ca2+ changes are able to alter PM excitability [2].
This dual role of Ca2+ as an ion involved in signaling and in neuronal activity is highly relevant for the understanding of the development of neurodegenerative diseases and, in particular, Alzheimer’s disease (AD). Together with the hyperphosphorylation of τ proteins and the accumulation of amyloid-β peptides (Aβ) inside neurons, the progression of AD is indeed characterized by a perturbation of intracellular Ca2+ homeostasis [3]. Ca2+ dysregulation associated with neurodegenerative diseases is multifactorial. Aβ can indeed affect Ca2+ exchanges with the extracellular medium and with internal Ca2+ stores [4]. These modifications result in an increase in cytosolic Ca2+. It is now widely accepted that disruption of ER calcium mediates the most significant signaling pathways that are associated with Alzheimer’s disease, and is a main driving force in the development of the disease [5,6,7]. Among many consequences, excessive Ca2+ increase can lead to apoptotic neuronal death. Ca2+ also stimulates the activity of γ-secretase, a key enzyme involved in the production of toxic Aβ peptides. Such a vicious circle between amyloids and Ca2+ has been proposed to play a key role in the progressive and irreversible character of the disease [4,8].
At the level of neuronal activity, extracellular plaques of Aβ peptides are reported to induce electrical hyperexcitability [9]. Such an excitatory effect relies on a network effect associated with the disruption of synaptic function [6], but similar observations have been found on cultured neurons [10] or in brain slices [11,12]. How Aβ peptides, Ca2+, and neuronal excitability are related to each other at the single cell level is not well understood and is difficult to assess experimentally. Intuitively, increases in Ca2+ are expected to be associated with a decrease in neuronal activity via the activation by Ca2+ of a hyperpolarizing K+ current mediated by SK or BK channels, which represent the major link between Ca2+ concentration and the electrical activity of the plasma membrane. The question thus arises as to how AD’s progression can be associated at the same time with the increase in intracellular Ca2+ that follows the calcium hypothesis of AD, and with an increase in neuronal electrical activity. Computational modeling is well suited to gain insight into this paradox, because it allows for individually assessing the consequence of Aβ peptides on their various targets. It can also predict their relative importance.
From a mathematical point of view, interactions between membrane electrical activity and Ca2+ signaling have been described in specific cell types, such as astrocytes [13,14], pancreatic cells [15,16], GnRH neurons [17] motoneurons [18], and cardiac cells [19,20]. To the best of our knowledge, there are, however, very few general computational models describing electrical activity and intracellular Ca2+ dynamics in a prototypical neuronal cell. An early generic model of a neuron shows that less current is necessary to generate an AP when Aβ peptides are considered to block the fast-activating potassium current [21]. In a previous study, we used a simple model of the electrical activity of granule cells, considering its interplay with membrane Ca2+ dynamics, to study the impact of tonic NMDA receptor activity on neuronal excitability [22]. Modeling could show that the constant Ca2+ influx induced by this tonic activity can lock previously active neurons in a hyperactive state. This result agrees with the observed hyperactivation of neurons in presence of Aβ-induced glutamate spill-over [23,24].
In the present study, we extend the same minimal model of granule cell electrical activity and membrane Ca2+ dynamics to consider a more accurate description of the evolution of intracellular Ca2+, including exchanges with the ER. The model involves three compartments: a fictious, sub-plasmalemmal shell that controls PM electrical activity, the cytosol, and the ER. It considers Ca2+ fluxes through the plasma membrane Ca2+ ATPase (PMCA), the sodium calcium exchanger (NCX), the sarco- or endoplasmic reticulum Ca2+ ATPase (SERCA) pumps, and the inositol 1,4,5-trisphosphate receptor (IP3) and ryanodine receptors (IP3R and RYR), grouped together in a single phenomenological flux. In this first approach, we indeed do not incorporate Ca2+ fluxes resulting from stimulation by IP3-inducing agonists. Our aim is to investigate how long-term alterations in Ca2+ fluxes modify the resting concentrations of Ca2+ in the different compartments and neuronal excitability. The model is then used to systematically investigate the various effects of Aβ peptides that have been reported in the literature. We found a strong independence between changes in cytosolic and subplasmalemmal Ca2+ concentrations, allowing cytosolic Ca2+ to vary without affecting neuronal excitability. In contrast, the latter is much affected by changes in subplasmalemmal Ca2+, with decreases in PMCA activity provoking neuronal hypo-excitability. Hyperexcitability is however predicted by the model when simulating the Aβ peptides reported changes in the L-type Ca2+ current [25] and the experimentally reported effect of Aβ peptides on Ca2+-sensitive K+ channels [26]. Lastly, an influx of Ca2+ flux through the pores of Aβ oligomers [27,28] can also increase the frequency of the simulated spikes. Altogether, the model helps understanding the apparent paradoxical dual role of Aβ peptides in increasing intracellular Ca2+ and provoking neuronal hyperexcitability. It also provides a simple description of intracellular Ca2+ dynamics and membrane excitability that can be further adapted to describe Ca2+ dysregulation in neurodegenerative diseases in a finely tuned manner.

2. Description of the Model

The core model used in this study is a previously proposed simple mathematical description of the electrical activity of cerebellar granule cells [2,29]. This model has been experimentally validated and can be seen as a good description of the electrical activity of a prototypical neuron. In the context of Alzheimer’s disease, we extended the model to consider tonic activity of NMDA receptors [22], which results from the Aβ-induced spill-over of glutamate [30].
The initial core model describes the evolution of the membrane voltage and Ca2+ concentration in a sub-plasmalemmal compartment that can be seen as a thin shell just below the plasma membrane (Ca). The currents included in the model, schematized in black in Figure 1, are a voltage-dependent Na+ current (INa(V)), a delayed rectifier K+ current (IK(V)), a high-threshold voltage dependent Ca2+ current (ICa(V)), a Ca2+-activated K+ current (IK(Ca)), and Iinj is the current injected into the cell that allows for studying its excitability properties. The mathematical expressions used for the currents, together with the evolution equations for the gating variables, are given in the Supplementary Material. Only one type of IK(Ca) current is considered explicitly. In reality, most excitable cells express both large-conductance (BK) and small-conductance (SK) calcium-activated potassium channels. The former is sensitive to Ca2+ only, while the latter is sensitive to both voltage and calcium. For simplicity, Equations (S7), (S18) and (S19) empirically describe the two types of channels. The equations and parameter values that govern the dynamics of opening/closing of the ion channels are the same as in the previous studies [2], and are given in Supplementary Material and Table 1. Temporal evolution of the membrane voltage is as follows:
C m d V d t = I N a V I K V I C a V I K C a + I I n j
where Cm is the cell capacitance. When active, the ICa(V) current mediates the entry of Ca2+ into the cell and hence leads to an increase in Ca2+ concentration in the sub-plasmalemmal compartment. Thus,
d C a d t = f I C a V 2 F V s h e l l β   C a
where f is the buffering capacity of the cytoplasm, F the Faraday constant, Vshell the volume of the sub-plasmalemmal compartment, and β is a first order rate constant that empirically gathers all the processes that remove Ca2+ from the shell.
Here, we extend the model to consider a cytosolic and an endoplasmic reticulum (ER) Ca2+ compartment, and to provide a more accurate description of the processes that remove Ca2+ out of the shell. Note that while the subplasmalemmal space represents a fictious compartment, the cytosol and ER correspond to real cellular spaces delimited by membranes. The model is schematized in Figure 1. From the sub-plasmalemmal compartment, Ca2+ is extruded towards the extracellular medium via an ATPase and via the Na+/Ca2+ exchanger (NCX). The rate of Ca2+ transport through the ATP-consuming plasma membrane Ca2+ ATPase (PMCA) is given by:
J P M C A = V P M C A C a 2 K P M C A 2 + C a 2
in which VPMCA and KPMCA stand for the maximal velocity and the half saturation constant of the PMCA, respectively. Note that export of Ca2+ by the PMCA is accompanied by a concomitant influx of H+ [31], in such a way that the activity of this pump does not influence the membrane voltage. The Na+/Ca2+ exchanger removes Ca2+ from the cytoplasm at the expense of Na+ entry, with a 1:3 stoichiometry. It is thus electrogenic. Following Gall et al. (1999) [16], we describe this current by
I N C X = g N C X C a 2 K N C X 2 + C a 2 V V N C X
where gNCX is the NCX conductance, KNCX the half saturation constant for NCX activation by Ca2+, and VNCX the resting potential for this channel calculated using resting Na+ and Ca2+ concentrations. This current is added (with a negative sign) to the right-hand side of Equation (1) and with the appropriate factors to the evolution equation for Ca (see below).
To introduce Ca2+ diffusion from the sub-membrane region to the cytosol, we constructed a compartmental model wherein the cytoplasm and the shell are assumed to be homogeneous compartments. In such an approach, the corresponding efflux of Ca2+ from the cytosol considers the Ca2+ diffusion coefficient and the respective volumes of the compartments. It can be written as:
J d i f f = γ C a C a c y t ,   with   γ = D h 2
where D stands for the effective Ca2+ diffusion in the cytosol and h for the distance between the shell and the cytoplasmic compartment. Thus, for a typical granule cell with a radius of ~4 μm, γ is around 0.001 ms−1 considering that D = 15 μm2s−1 [32]. It should be noted that this flux indirectly depends on the buffering capacity of the cytoplasm, because D decreases together with f.
Assuming that the volume of the shell is 1/10 of the volume of the cytosol, the corresponding change of Ca2+ concentration in the cytosol (Cacyt) is given by J d i f f / 9 .
The cytosolic compartment also exchanges Ca2+ with the ER, in which the Ca2+ concentration is much larger, around 500 μM. Ca2+ exchanges between these two compartments have been much studied, both experimentally and by modelling, because they can produce cytosolic Ca2+ oscillations [19,33]. It is known that relative changes in Ca2+ concentration are much smaller in the ER than in the cytoplasm. In the present study where only basal, non-stimulated Ca2+ release from the ER is simulated, we consider that the ER Ca2+ concentration remains constant [34,35] and fixed CaER at 500 μM [36]. Basal Ca2+ efflux from the ER is given by
J E R = k i n C a E R C a c y t
in which kin gathers basal ER Ca2+ release through the IP3R and the RyR, as well as unspecific leaks. The opposite flux, i.e., Ca2+ pumping from the cytosol to the ER, is mediated by the sarco- or endoplasmic reticulum Ca2+ ATPase (SERCA) and is modelled as
J S E R C A = V S E R C A C a c y t 2 K S E R C A 2 + C a c y t 2
in which VSERCA and KSERCA stand for the maximal velocity and the half saturation constant of SERCA, respectively.
When considering these additional processes, the core model originally described by Equations (1) and (2) takes the form:
C m d V d t = I N a V I K V I C a V I K C a I N C X + I I n j
d C a d t = f I C a V + 2 I N C X 2 F V s h e l l J P M C A J d i f f
d C a c y t d t = J d i f f 9 + k i n C a E R C a c y t J S E R C A
Together with the equations for the currents (Equations (S1)–(S4)) and for the fluxes (Equations (3)–(7)), the evolution Equations (8)–(10) define the model used throughout the whole study. The values of parameters are given in Table 1, unless indicated in the figure legends. Numerical integration and bifurcation diagrams have been obtained using XPPAUT and its AUTO package [37]. The code is available on github (https://github.com/genedupont/amyloids, accessed on 26 November 2021).

3. Results

3.1. Model Behavior in the Absence of Aβ Peptides

We first checked if the extended model described in Section 2 provides an adequate description of the neuronal activity in unperturbed conditions [2,29]. For a sufficiently large value of the injected current, Iinj, the model displays repetitive action potentials (Figure 2A), which are accompanied by periodic variations of the Ca2+ concentration in the sub-plasmalemmal compartment (Ca, Figure 2B). These changes in Ca are due to the Ca2+ entry through the voltage sensitive Ca2+ channels ( I C a V )   and extrusion from this compartment via three mechanisms. The most significant is the PMCA (Figure 2C), with a flux that reaches ~6 μMms−1. The current mediated by NCX reaches, at most, −5 pA (Figure 2D), which corresponds to a Ca2+ flux of about 0.1 μMms−1. These values are in the order of experimental observations [38]. The third mechanism by which Ca2+ leaves the sub-plasmalemmal Ca2+ compartment is diffusion into the cytoplasm. This term oscillates between 5 × 10⁻⁷ and 2.6 × 10⁻⁶ μMs−1. Such modest fluxes are due to the small value of γ (Equation (5)), which reflect the slow diffusion of Ca2+ in the cytoplasm because of buffering. Because sub-plasmalemmal Ca2+ is mainly removed by the PMCA, when the cell is electrically active the Ca2+ concentration in the cytoplasm remains practically constant at 40 nM. This value of Cacyt is determined by the exchanges with the ER.
The bifurcation diagram (Figure 2E) of the extended model resembles that of the original model. After a threshold value of injected current, the stable steady state (plain black line) loses its stability and action potentials (red lines) develop. The Hopf bifurcation is sub-critical, but the zone of coexistence between the stable steady state and the stable limit cycle is very limited [22]. Ca2+ diffusion potentially affects the firing threshold of the injected current (Figure 2F). When diffusion is fast, Iinj at the bifurcation point decreases. Indeed, Ca2+ entering the cell is removed more efficiently, reducing the activation of the K(Ca) current. Membrane polarization is therefore attenuated, which decreases the value of the depolarizing current that must be injected to initiate an action potential.
The model described in Section 2 provides a simple and realistic description of neuronal and Ca2+ dynamics. In the following, we use this model to investigate how changes in Ca2+ dynamics influence neuronal excitability. In particular, we focus on how known targets of Aβ peptides modify (1) the threshold value of injected current triggering repetitive action potentials, i.e., the value of Iinj at the bifurcation point, and (2) the frequency of repetitive APs. A decrease of the threshold value of Iinj or an increase in frequency from the control situation (Figure 2E) will be interpreted as neuronal hyperexcitability.

3.2. Aβ Peptides Induced Changes in the Rates of Ca2+ Pumps and Pores
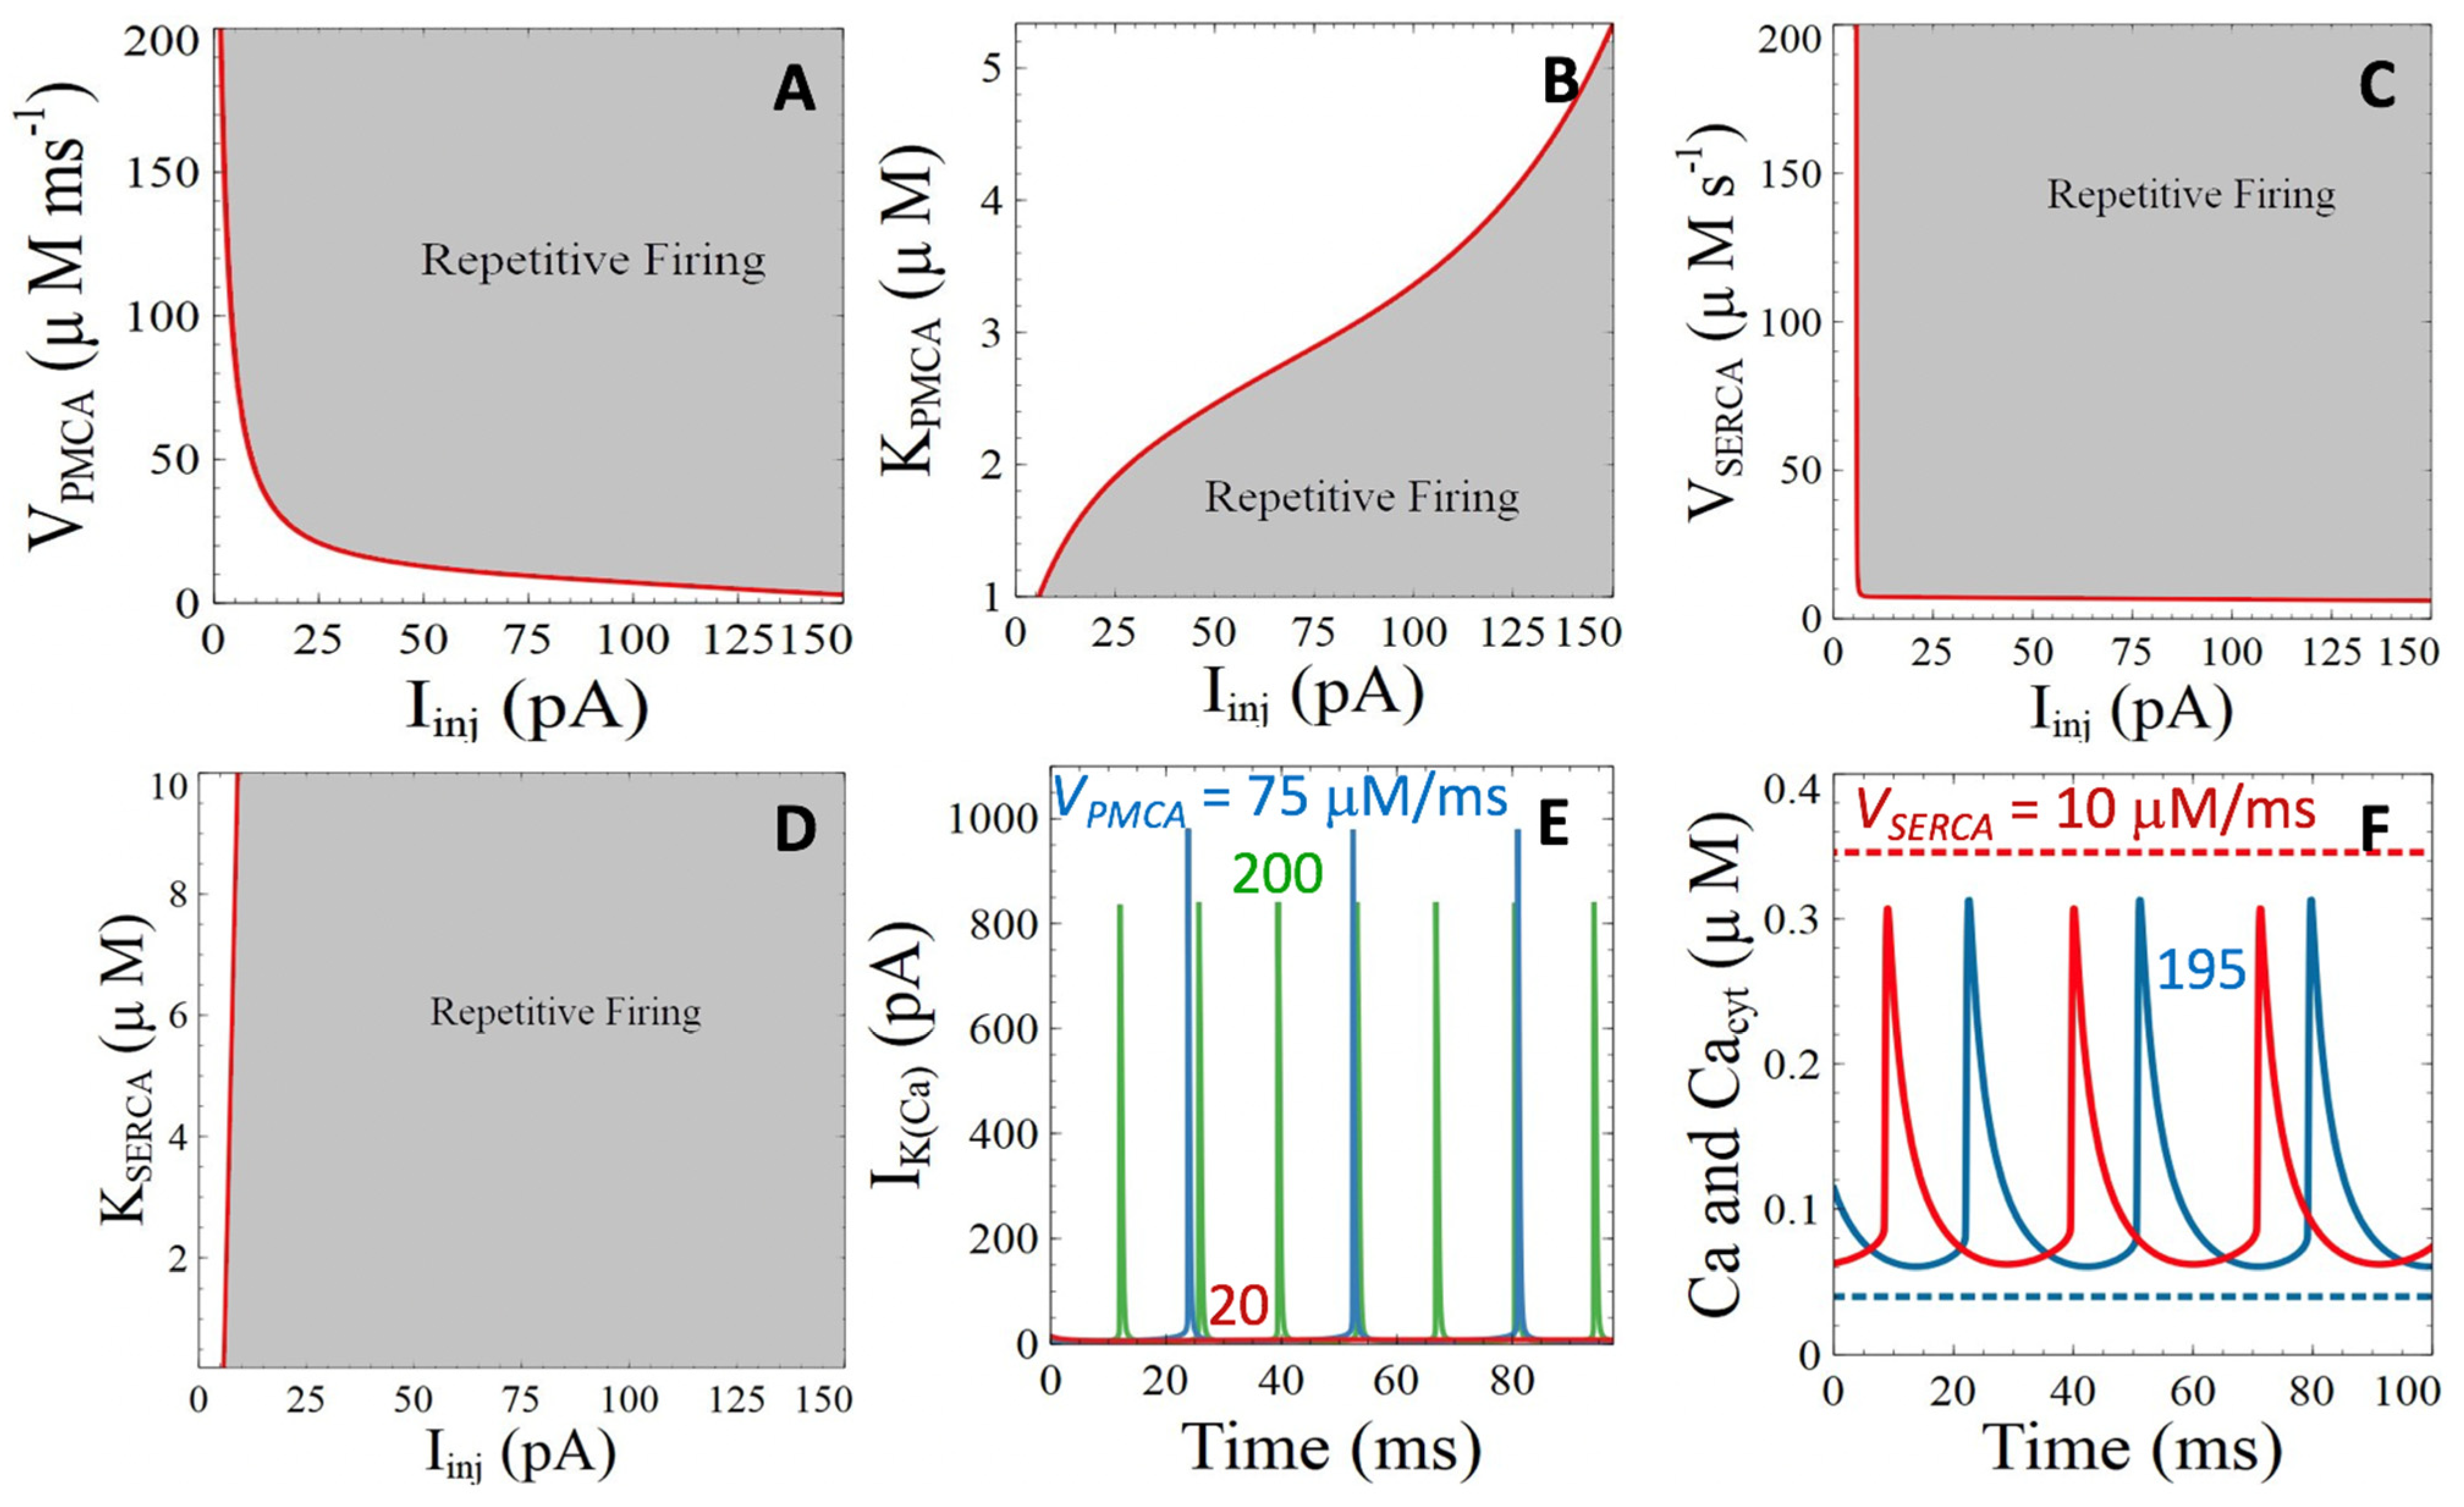
3.2.1. Ca2+ ATPases

PMCA are dysregulated in AD in an Aβ-dependent manner [39]. The potential influence of this dysregulation deserves investigation, as we have seen in the previous section that active pumping of Ca2+ out of the cell by the PMCA plays the most important role in the extrusion of Ca2+ from the sub-plasmalemmal space (Figure 2). Thus, changes in the kinetic parameters of the PMCA are expected to have a strong influence on the sub-membrane Ca2+ dynamics and hence on neuronal activity. A decrease in the maximal rate of the PMCA (VPMCA) indeed provokes an increase in the amplitude of the current that must be injected to initiate neuronal firing (Figure 3A). Simulations indicate that the increase of IK(Ca) with decreasing PMCA activity is responsible for the observed change in Iinj at the bifurcation point. Figure 3E shows that the IK(Ca) current gets larger when VPMCA decreases. Below a threshold value (red line in Figure 3A), action potentials disappear. Changing the half saturation constant of the PMCA from its default value (KPMCA = 1 μM) also affects the domain of repetitive firing (Figure 3B), although in a less abrupt manner.
The strong influence of PMCA on electrical activity contrasts with the lack of effect of changing the kinetic parameters of the SERCA visible in Figure 3C,D. It can be seen that the value of the injected current leading to repetitive action potentials is not influenced by the values of VSERCA and KSERCA. Although changing these parameters modifies the level of Ca2+ in the cytoplasm, the influence of this change on sub-plasmalemmal Ca2+, and hence on electrical activity, is nearly nil, as shown in Figure 3F. Thus, changes in the activity of PMCA and SERCA pumps have a strong influence on the concentrations of Ca2+ in the sub-plasmalemmal compartment and in the bulk of the cytosol, respectively. These changes are however not transmitted to the other compartment because the transport of Ca2+ by active pumping by far exceeds diffusion. It should be kept in mind that the average cytosolic Ca2+ concentration, which corresponds to (Ca+9Cac)/10, is influenced in both cases. As far as neuronal activity is concerned, excitability decreases together with the activity of the PMCA’s, while it is not influenced by the SERCAs.

3.2.2. Ryanodine Receptor- and IP3 Receptor-Mediated Basal Release of ER Ca2+

In neurons, Ca2+ is released from the ER via ryanodine and IP3 receptors and there is compelling evidence that Aβ peptides mobilize internal Ca2+ via these two receptors [40]. Moreover, it has been shown that the injection of Aβ42 oligomers stimulates the production of IP3 [41]. Thereby, Aβ peptides not only exacerbate stimulus-induced cytosolic Ca2+ responses, but also provoke a sustained increase in the basal rate of ER Ca2+ release that can be modeled by an increase in the value of parameter kin that appears in Equation (6). Bifurcation analysis of the influence of this parameter (Figure 4A) indicates that it does not affect the PM membrane electrical activity up to a point where cytosolic Ca2+ concentration becomes so high that the cell can only be electrically silent. However, this situation is not appropriately represented by the present model, which does not take the Ca2+-induced Ca2+ release regulation of these two receptors into account. For more modest changes in kin, the conclusions are qualitatively the same as for the SERCA pumps, pointing to an independence between cytoplasmic Ca2+ changes on one hand and sub-plasmalemmal Ca2+ and electrical activity on the other hand. That the increase in cytosolic Ca2+ does barely not affect sub-membrane Ca2+ is visible in Figure 4A,B.
Simulations thus predict that an increase in the rate of basal Ca2+ release from the ER does not change the levels of Ca2+ in the subplasmalemmal space, and thus also not neuronal excitability.

3.2.3. Pores of β-Amyloids in the Plasma Membrane

Aβ peptides can form Ca2+ permeable pores in the PM [28,41]. We investigated the effect of such pores in the model defined in Section 2 by considering the following rate of Ca2+ entry in the sub-plasmalemmal compartment:
J A b e t a = V A b e t a 1 1 + e V q 1 / q 2
which reflects a passive, electrogenic flux [42]. VAbeta, the maximal rate of Ca2+ entry through the pores, reflects both the single pore permeability and the number of pores in the PM. q1 and q2 characterize the voltage-dependence of Ca2+ entry through the pores. It reproduces a steep decrease of the flux of positively charged Ca2+ ions through the pores when the membrane voltage increases.
The evolution equations for sub-plasmalemmal Ca2+ and membrane voltage are modified to consider this flux, i.e.,
d C a d t = f I C a V + 2 I N C X 2 F V s h e l l J P M C A + J A b e t a J d i f f
C m d V d t = I N a V I K V I C a V I K C a I N C X + I I n j + 2 F V S h e l l   J A b e t a
where F stands for the Faraday constant and Vshell for the volume of the sub-plasmalemmal compartment, as defined above.
Simulations of the model predict that for increasing values of VAbeta, larger currents must be injected to induce a repetitive action potential (Figure 5A). Again, this is due to the increase in subplasmalemmal Ca2+ concentration (Figure 5B) that stimulates the Ca2+-dependent K+ current, which hyperpolarizes the cell. Ca2+ concentration in the cytosol is not affected (dashed lines in Figure 5B). These consequences of the presence of pores of amyloids in the plasma membrane are qualitatively similar to the Aβ peptides induced reduction of PMCA activity. However, these two targets differ by the fact that a flux of Ca2+ through the pores induces a change in membrane voltage (Equation (13)), while PMCAs are electroneutral [31]. This difference is responsible for the possible increase in the frequency of repetitive AP’s with VAbeta (Figure 5C) that is not observed upon PMCA inhibition. Thus, although the presence of pores increases the threshold value of current that must be injected to induce neuronal repetitive firing, once active, the frequency is higher in the presence of Aβ peptide pores. As expected intuitively, the spiking frequency increases faster with VAbeta if the conductance of the Ca2+-activated K+ channels decreases (compare blue and red curve in Figure 5C). When VAbeta is very large, the shape of the action potential is modified drastically and irregular spiking occurs (Figure 5D).
Thus, ions permeable pore of Aβ peptides provoke an increase in sub-plasmalemmal Ca2+. Because this influx is associated with PM depolarization, it can lead to an increase in spiking frequency for moderate values of the conductance of the K(Ca) channels. However, the threshold value of injected current is not affected by the pores.

3.3. Aβ Peptides Induced Changes in Voltage-Sensitive Ca2+ Currents

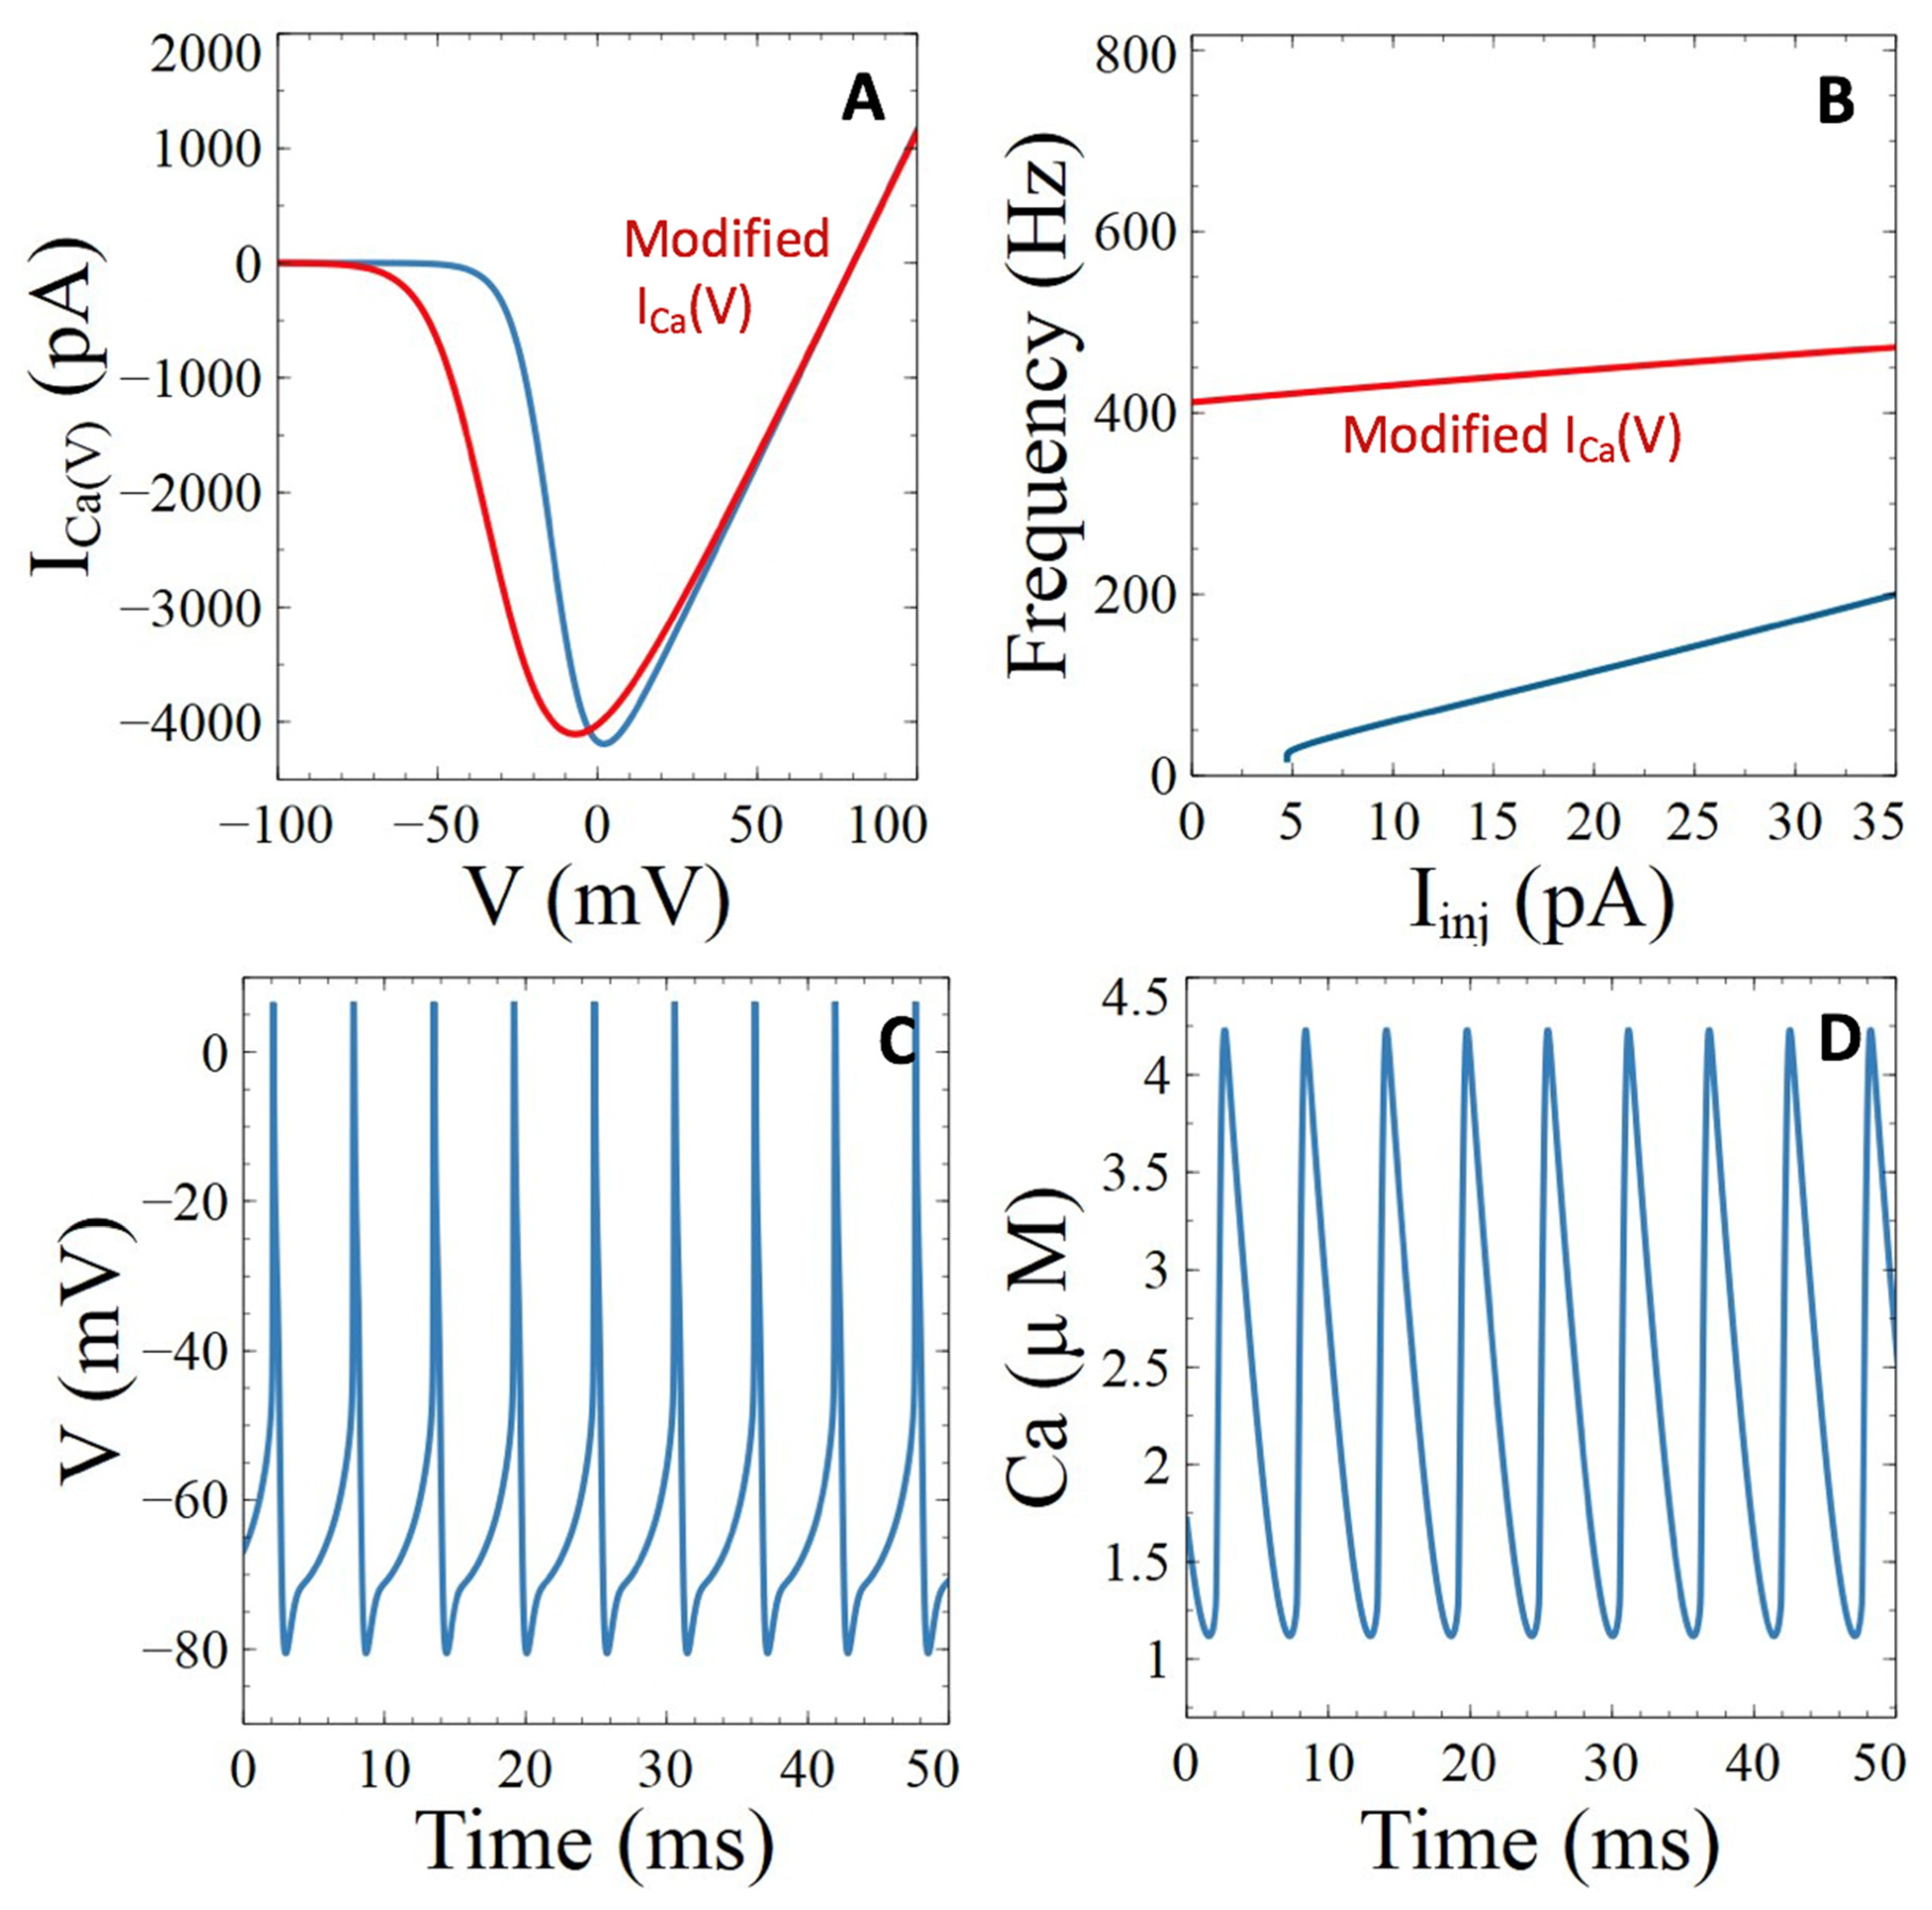
3.3.1. Voltage-Gated Ca2+ Channels

The L-type Ca2+ channel has attracted much attention in the field of Alzheimer’s disease. Over-activation of these channels by Aβ peptides has been observed in rat cultured cortical and hippocampal neurons [43]. Injection of Aβ peptides upregulates L-type Ca2+ channels in rat hippocampal neurons [25], a phenomenon that is also observed in AD transgenic mice [44]. In particular, the maximal activation of these channels is changed from 0 to about −15 mV in the presence of Aβ [45]. Such a change can be modelled by modifying the values of parameters in the activation and inactivation functions of the L-type Ca2+ current, noted αs and βs in Equations (S18) and (S19). When considering
α S = 150 1 + e x p 0.072 V 5
and
β S = 0.1 V + 8.9 V e x p 0.02 V + 8.9 1
instead of the default function defined by Equations (S18) and (S19), the maximal current indeed corresponds to a ~−15 mV voltage, as shown in Figure 6A.
Simulations indicate that repetitive APs occur in the absence of injected current with these modified values of parameters for the L-type channel (Figure 6B). Moreover, for a given value of Iinj, the frequency of action potentials is larger than in the control situation. As can be seen in Figure 6C, APs become significantly broader, which results in high levels of Ca2+ in the sub-plasmalemmal compartment (Figure 6D). As for the preceding Aβ peptides targets, these changes do not significantly affect the Ca2+ level in the bulk of the cytoplasm, because most of this Ca2+ is extruded to the extracellular medium by the PMCA and the NCX (not shown).
Thus, Aβ peptides induced up-regulation of the L-type Ca2+ channel results into marked neuronal hyperexcitability. This is reflected by an increase in both the firing frequency and the propensity of the cell to become electrically active. It also significantly raises the concentration of the sub-plasmalemmal Ca2+ during activity.

3.3.2. Ca2+-Sensitive Potassium Channels

The activity of the Ca2+-sensitive potassium channels has also been shown to be modified by the presence of Aβ peptides [26]. In mouse neurons, intracellular injection of these amyloids suppresses BK channels [46]. The same effect can be observed in cortical pyramidal cells from 3xTg mice [47]. More indirectly, Sosulina et al. (2020) [11] observed an increased intrinsic excitability of CA1 neurons in the absence of synaptic changes in hippocampal slices from a rat model of AD at the early stages following Aβ deposition. Because of the simultaneous decrease in the resting membrane potential and increase in AP half-width, this increase in intrinsic excitability was hypothesized to originate from a decrease in the activity of the K(Ca) channels.
In agreement with these observations, a decrease in the conductance of the K(Ca) channels provokes a marked decrease in the threshold value of current that must be injected to induce repetitive firing (Figure 7A). As visible in Figure 5C, the frequency of repetitive APs decreases if K(Ca) channels are less active, because they have a marked hyperpolarizing effect that delays the onset of the next spike. The minimal value of voltage between two spikes indeed decreases with the value of gK(Ca) (Figure 7B). Simulations also show that the half-width of APs increases with decreasing values of gK(Ca) (Figure 7B), as observed in the neurons where these channels are down-regulated by Aβ peptides.
Thus, a reduction in the conductance of K(Ca) points to electrical hyperexcitability at all levels: reduction of the threshold current intensity required to induce repetitive AP’s, and an increase in the frequency and broadening of the AP’s.

4. Discussion

Mathematical modeling provides a unique tool to derive insight into the possible molecular mechanisms that may be relevant in AD. We therefore used a modeling approach to systematically investigate the various effects of Aβ peptides on calcium dynamics and neuronal excitability. We extended a previously proposed mathematical description of the electrical activity of cerebellar granule cells [2] to propose a generic minimal model of neuronal and calcium dynamics. To take spatial heterogeneity into account, we considered a compartmental model, which is a standard approach that is largely used to model Ca2+ microdomains, for example [19].
Our simulations point to a clear decoupling between the evolution of Ca2+ concentration just below the PM and in the bulk of the cytosol. Indeed, Ca2+ changes in the sub-plasmalemmal compartment are governed by Ca2+ exchanges with the extracellular medium that occur with a much larger rate than passive diffusion from and to the bulk of the cytosol. On the other hand, these changes have a moderate influence on the Ca2+ concentration in the much larger cytosolic space. In indirect agreement with this independence between sub-plasmalemmal and bulk cytosolic Ca2+, Yao et al. (2020) [48] reported that limiting RYR open time does not have a major effect on the afterhyperpolarization current in hippocampal CA1 neurons, which agrees with the lack of effect of raising the bulk cytoplasmic Ca2+ on the activity of a Ca2+-dependent voltage gated channel located in the PM. In the context of AD, the decoupling between membrane and bulk cytosolic Ca2+ observed in the simulations suggests that disruptions of Ca2+ homeostasis that interfere with signaling and promote the progression of the disease are unrelated from changes in the electrical properties of the neurons. It should be kept in mind, however, that this conclusion only holds at the single cell level. At the network level, Ca2+ could affect electrical activity because AD-related synaptic loss may be partly due to Ca2+ dysregulations [49].
As a direct consequence of the decoupling between sub-PM and bulk cytosolic Ca2+, our results predict that the reported modifications induced by Aβ peptides on the activities of transporters affecting deep cytosolic Ca2+ have no impact on neuronal excitability in the absence of the ER-Ca2+ mobilizing agonist. The fact that we considered conditions corresponding to the absence of stimulation of IP3 or RyR receptors is in contrast with the approaches followed by Latulippe et al. [13] and Liu et al. [14]. In the two studies, devoted to electrically non-excitable cells, a homogeneous model was considered to analyze the impact of Aβ peptides on Ca2+ dynamics. They concluded that amyloids affect the existence, frequency, and shape of agonist induced Ca2+ oscillations. The latter conclusion is significant in view of the observation that Aβ oligomers can stimulate IP3 production [41], a point that is not investigated in our present study. The impact of this effect of amyloids on the changes in cytosolic Ca2+ and consequently on mitochondrial metabolism has also been investigated by modelling [35].
In contrast, when Aβ peptides affect Ca2+ fluxes across the PM, they have a significant influence on the membrane neuronal activity in the model. It was shown that Aβ peptides bind to the catalytic site of the PMCA, which corresponds to an increase in the value of KPMCA appearing in Equation (3). As shown in Figure 3B, this induces a reduction of neuronal excitability in the model. Aβ peptides also tend to increase sub-membrane Ca2+ by forming pores in the PM. In the model, they have rather mixed consequences on neuronal activity (Figure 4). On the one hand, they increase the threshold value of current that must be injected in the neuron to induce repetitive action potential. On the other hand, they can provoke an increase in the spiking frequency. While the latter observation is associated with hyperexcitability, the former is associated with hypo-excitability. These apparently opposite consequences can be ascribed to the fact that the entry of Ca2+ through the pores stimulates the hyperpolarizing K(Ca) current, but also depolarizes the cell membrane. Indeed, hyperexcitability is more pronounced when decreasing the conductance of the K(Ca) channel. In addition, if Ca2+ influx through the pores is very large, aberrant spiking in the form of complex neuronal activity can also be observed in the model. As a perspective, it would be interesting to test if the same simulated behaviors can be recovered when considering a stochastic Markov model validated against experimental data [28] to describe the dynamics of pore opening and closing. Finally, the reported changes in the activities of L-type Ca2+ channels and Ca2+-sensitive K+ channels in the presence of Aβ peptides clearly point to hyperexcitability when considered in the model. These results are in agreement with the numerous studies reporting neuronal hyperexcitability in the presence of Aβ peptides. In particular, limiting the open time duration of RYR2 in the hippocampal CA1 neurons of an AD mouse model upregulates the surface expression of the K(Ca) channel and prevents electrical hyperactivity, but does not directly modulate the activity of the K(Ca) channels [48]. Altogether, our simulation results indicate that the reported consequences of Aβ peptides induced modifications of Ca2+ fluxes or Ca2+-regulated currents have qualitatively different outcomes. However, it should be noted that although Aβ peptides are most of the time associated with neuronal hyperexcitability, some studies however report opposite consequences [50,51].
The seemingly contradictory effects of Aβ peptides reported in this study may also be due to the limitations of the proposed model. For example, it does not consider the specificities of the various neuronal cell types. Additionally, we considered one target of Aβ peptides at a time, which is important to dissect the pathological consequences of the oligomers of amyloids, but does not correspond to a realistic situation. Because they are limited to a single neuron, simulations do not include network effects, which play a crucial role in the cognitive defects related to the disease [52]. It is clear that simplified modelling, such as the one performed here, does not provide a faithful view of the complexity of calcium signaling and neuronal activity corresponding to an in vivo situation. However, it allows for drawing some simple and unambiguous conclusions, which can help analyzing experimental observations when considered from a larger perspective.

Supplementary Materials

The following are available online at https://www.mdpi.com/article/10.3390/cells11040615/s1, Additional equations of the model.

Author Contributions

F.P.v.B., D.G. and G.D. conceived the study. F.P.v.B. developed the code and run the simulations. F.P.v.B. and G.D. analyzed and interpreted the results. G.D. wrote the manuscript, with the help of D.G. All authors have read and agreed to the published version of the manuscript.

Funding

G.D. is Research Director at the Belgian FRS-FNRS. D.G. is Associate Professor at the Université Libre de Bruxelles. This work was supported by the program Actions de Recherche Concertée (ARC2020-2025) launched by the Division of Scientific Research, Ministry of Science and Education, French community of Belgium.

Informed Consent Statement

Not applicable.

Data Availability Statement

The code of the model is available at https://github.com/genedupont/amyloids (accessed on 26 November 2021).

Conflicts of Interest

The authors declare no conflict of interest.

References

  1. Berridge, M.J.; Bootman, M.D.; Lipp, P. Calcium—A life and death signal. Nature 1998, 395, 645–648. [Google Scholar] [CrossRef] [PubMed]
  2. Gall, D.; Roussel, C.; Susa, I.; D’Angelo, E.; Rossi, P.; Bearzatto, B. Altered neuronal excitability in cerebellar granule cells of mice lacking calretinin. J. Neurosci. 2003, 23, 9320–9327. [Google Scholar] [CrossRef] [Green Version]
  3. Alzheimer’s Association Calcium Hypothesis Workgroup. Calcium hypothesis of Alzheimer’s disease and brain aging: A framework for integrating new evidence into a comprehensive theory of pathogenesis. Alzheimer’s Dement. 2017, 13, 178–182. [Google Scholar] [CrossRef]
  4. Berridge, M.J. Calcium hypothesis of Alzheimer’s disease. Pflug. Arch. 2010, 459, 441–449. [Google Scholar] [CrossRef]
  5. LaFerla, F. Calcium dyshomeostasis and intracellular signalling in Alzheimer’s disease. Nat. Rev. Neurosci. 2012, 3, 862–872. [Google Scholar] [CrossRef]
  6. McDaid, J.; Mustaly-Kalimi, S.; Stutzmann, G. Ca2+ dyshomeostasis disrupts neuronal and synaptic function in Alzheimer’s disease. Cells 2020, 9, 2655. [Google Scholar] [CrossRef] [PubMed]
  7. Schrank, S.; Barrington, N.; Stutzmann, G. Calcium-handling defects and neurodegenerative disease. Cold Spring Harb. Perspect. Biol. 2020, 21, a035212. [Google Scholar] [CrossRef] [PubMed]
  8. De Caluwé, J.; Dupont, G. The progression towards Alzheimer’s disease described as a bistable switch arising from the positive loop between amyloids and Ca2+. J. Theor. Biol. 2013, 331, 12–18. [Google Scholar] [CrossRef]
  9. Busche, M.A.; Eichhoff, G.; Adelsberger, H.; Abramowski, D.; Wiederhold, K.H.; Haass, C.; Staufenbiel, M.; Konnerth, A.; Garaschuk, O. Clusters of hyperactive neurons near amyloid plaques in a mouse model of Alzheimer’s disease. Science 2002, 321, 1686–1689. [Google Scholar] [CrossRef] [Green Version]
  10. Blanchard, B.; Thomas, V.; Ingram, V. Mechanism of membrane depolarization caused by the Alzheimer Aβ1-42 peptide. Biochem. Biophys. Res. Commun. 2002, 293, 1197–1203. [Google Scholar] [CrossRef]
  11. Sosulina, L.; Mittag, M.; Geis, H.-R.; Hoffman, K.; Klyubin, I.; Qi, Y.; Steffen, J.; Friedrichs, D.; Henneberg, N.; Fuhrman, F.; et al. Hippocampal hyperactivity in a rat model of Alzheimer’s disease. J. Neurochem. 2021, 157, 2128–2144. [Google Scholar] [CrossRef] [PubMed]
  12. Tamagnini, F.; Scullion, S.; Brown, J.; Randall, A. Intrinsic excitability changes induced by acute treatment of hippocampal CA1 pyramidal neurons with exogenous amyloid βpeptide. Hippocampus 2015, 25, 786–797. [Google Scholar] [CrossRef] [PubMed] [Green Version]
  13. Latulippe, J.; Lotito, D.; Murby, D. A mathematical model for the effects of amyloid beta on intracellular calcium. PLoS ONE 2018, 13, e0202503. [Google Scholar] [CrossRef] [Green Version]
  14. Liu, L.; Goa, H.; Zaikin, A.; Chen, S. Unraveling Aβ-mediated multi-pathway calcium dynamics in astrocytes: Implications for Alzheimer’s disease treatment from simulations. Front. Physiol. 2021, 12, 767892. [Google Scholar] [CrossRef] [PubMed]
  15. Felix-Martinez, G.; Godinez-Fernandez, J. Mathematical models of electrical activity of the pancreatic beta-cell: A physiological review. Islets 2014, 6, e949195. [Google Scholar] [CrossRef] [PubMed] [Green Version]
  16. Gall, D.; Gromada, J.; Susa, I.; Rorsman, P.; Herchuelz, A.; Bokvist, K. Significance of Na/Ca exchange for Ca2+ buffering and electrical activity in mouse pancreatic β-cells. Biophys. J. 1999, 79, 2018–2028. [Google Scholar] [CrossRef] [Green Version]
  17. Fletcher, P.; Li, Y.X. An integrated model of electrical spiking, bursting, and calcium oscillations in GnRH neurons. Biophys. J. 2009, 96, 4514–4524. [Google Scholar] [CrossRef] [PubMed] [Green Version]
  18. Wada, K.; Sakaguchi, Y. Repetitive firing in a model motoneuron: Inhibitory effect of a Ca2+-activated potassium conductance on the slope of the frequency-current relationship. Neurosci. Res. 2007, 57, 259–267. [Google Scholar] [CrossRef] [PubMed]
  19. Dupont, G.; Falcke, M.; Kirk, V.; Sneyd, J. Models of Calcium Signalling; Springer: New York, NY, USA, 2016. [Google Scholar]
  20. Rasmusson, R.; Clark, J.; Giles, W.; Robinson, K.; Clark, R.; Shibata, E.; Campbell, D. A mathematical model of electrophysiological activiy in a bulfrog atrial cell. Am. J. Physiol. 1990, 259, H370–H389. [Google Scholar]
  21. Good, T.; Murphy, R. Effect of β-amyloid block of the fast-inactivating K+ channel on intracellular Ca2+ and excitability in a modeled neuron. Proc. Natl. Acad. Sci. USA 1996, 93, 15130–15135. [Google Scholar] [CrossRef] [Green Version]
  22. Gall, D.; Dupont, G. Tonic activation of extrasynaptic NMD—A receptors decreases intrinsic excitability and promotes bistability in a model of neuronal activity. Int. J. Mol. Sci. 2019, 21, 206. [Google Scholar] [CrossRef] [Green Version]
  23. Talantova, M.; Sanz-Blasco, S.; Zhang, X.; Xia, P.; Akhtar, M.; Okamoto, S.; Dziewczapolski, G.; Nakamura, T.; Cao, G.; Pratt, A.; et al. Ab induces astrocytic glutamate release, extrasynaptic NMDA receptor activation, and synaptic loss. Proc. Natl. Acad. Sci. USA 2013, 110, E2518–E2527. [Google Scholar] [CrossRef] [PubMed] [Green Version]
  24. Zott, B.; Simon, M.; Hong, W.; Unger, F.; Chen-Engerer, H.-J.; Frosch, M.; Sakmann, B.; Walsh, D.; Konnerth, A. A vicious cycle of β-amyloid-dependent neuronal hyperactivation. Science 2019, 365, 559–565. [Google Scholar] [CrossRef]
  25. Kim, S.; Rhim, H. Effects of amyloid peptides on voltage-gated L-type CaV1.2 and Cav1.3 Ca2+ channels. Mol. Cells 2011, 32, 289–294. [Google Scholar] [CrossRef] [Green Version]
  26. Wang, L.; Kang, H.; Li, Y.; Shui, Y.; Yamamoto, R.; Sugai, T.; Kato, N. Cognitive recovery by chronic activation of the large-conductance calcium-activated potassium channel in a mouse model of Alzheimer’s disease. Neuropharmacolgy 2015, 92, 8–15. [Google Scholar] [CrossRef] [PubMed]
  27. Demuro, A.; Mina, E.; Kayed, R.; Milton, S.; Parker, I.; Glabe, C. Calcium dysregulation and membrane disruption as ubiquitous neurotoxic mechanism of soluble amyloid oligomers. J. Biol. Chem. 2005, 280, 17294–17300. [Google Scholar] [CrossRef] [PubMed] [Green Version]
  28. Ullah, G.; Demuro, A.; Parker, I.; Pearson, J. Analyzing and modeling the kinetics of amyloid beta pores associated with Alzheimer’s disease pathology. PLoS ONE 2015, 10, e0137357. [Google Scholar] [CrossRef] [PubMed]
  29. Roussel, C.; Erneux, T.; Schiffmann, S.; Gall, D. Modulation of neuronal excitability by intracellular calcium buffering: From spiking to bursting. Cell Calcium 2016, 39, 455–466. [Google Scholar] [CrossRef] [PubMed]
  30. Bicca, M.; Figueiredo, C.; Piermartiri, T.; Meotti, F.; Bouzon, Z.; Tasca, C.; Medeiros, R.; Calixto, J. The selective and competitive N-methyl-D-aspartate receptor antagonist, (-)-6-phosphonomethyl-deca-hydroisoquinoline-”-carboxylic acid, prevents synaptic toxicity induced by amyloid-β in mice. Neuroscience 2011, 192, 631–641. [Google Scholar] [CrossRef] [PubMed]
  31. Thomas, R.C. The plasma membrane Ca2+ ATPase (PMCA) of neurones is electroneutral and exchanges 2H+ for each Ca2+ or Ba2+ ion extruded. J. Physiol. 2009, 587, 315–327. [Google Scholar] [CrossRef] [PubMed] [Green Version]
  32. Allbritton, N.; Meyer, T.; Stryer, L. Range of messenger action of calcium ion and inositol 1,4,5-trisphosphate. Science 1992, 258, 1812–1815. [Google Scholar] [CrossRef] [PubMed]
  33. Berridge, M.J. Calcium oscillations. J. Biol. Chem. 1990, 265, 9583–9586. [Google Scholar] [CrossRef]
  34. Sun, C.H.; Wacquier, B.; Aguilar, D.; Carayol, N.; Denis, K.; Boucherie, S. The Shigella type III effector IpgD recodes Ca2+ signals during invasion of epithelia cells. EMBO J. 2017, 36, 2567–2580. [Google Scholar] [CrossRef] [PubMed]
  35. Toglia, P.; Cheung, K.; Mak, D.; Ullah, G. Impaired mitochondrial function due to familial Alzheimer’s disease-causing presenilins mutants via Ca2+ disruptions. Cell Calcium 2016, 59, 240–250. [Google Scholar] [CrossRef] [PubMed] [Green Version]
  36. Chatton, J.Y.; Liu, H.; Stucki, J.W. Simultaneous measurements of Ca2+ in the intracellular stores and the cytosol of hepatocytes during hormone induced Ca2+ oscillations. FEBS Lett. 1995, 368, 165–168. [Google Scholar] [CrossRef] [Green Version]
  37. Ermentrout, B. Simulating, Analyzing and Animating Dynamical Systems: A Guide to XPPAUT for Researchers and Students; SIAM: Philadelphia, PA, USA, 2002. [Google Scholar]
  38. Duman, J.; Chen, L.; Hille, B. Calcium transport mechanisms of PC12 cells. J. Gen. Physiol. 2008, 131, 307–323. [Google Scholar] [CrossRef] [PubMed] [Green Version]
  39. Berrocal, M.; Marcos, D.; Sepulveda, M.; Perez, M.; Avila, J.; Mata, A. Altered Ca2+ dependence of synaptosomal plasma membrane Ca2+-ATPase in human brain affected by Alzheimer’s disease. FASEB J. 2009, 23, 1826–1834. [Google Scholar] [CrossRef]
  40. Chami, M.; Checler, F. Alteration of the endoplasmic reticulum (ER) calcium signaling molecular components in Alzheimer’s disease. Cells 2020, 9, 2577. [Google Scholar] [CrossRef] [PubMed]
  41. Demuro, A.; Parker, I. Cytotoxicity of intracellular Aβ42 amyloid oligomers involves Ca2+ release from the endoplasmic reticulum by stimulated production of inositol trisphosphate. J. Neurosci. 2013, 33, 3824–3833. [Google Scholar] [CrossRef] [Green Version]
  42. Wacquier, B.; Combettes, L.; Dupont, G. Dual dynamics of mitochondrial permeability transition pore opening. Sci. Rep. 2020, 10, 3924. [Google Scholar] [CrossRef] [Green Version]
  43. Ueda, K.; Shinohara, S.; Yagami, T.; Asakura, K.; Kawasaki, K. Amyloid beta protein potentiates Ca2+ influx through L-type voltage-sensitive Ca2+ channels: A possible involvement of free radicals. J. Neurochem. 1997, 68, 265–271. [Google Scholar]
  44. Willis, M.; Kaufmann, W.; Wietzorrek, G.; Hutter-Paier, B.; Moosmang, S.; Humpel, C. L-type calcium channel CaV 1.2 in transgenic mice overexpressing human AbetaPP751 with the London (V717l) and Swedish (K670M/N671L) mutations. J. Alzheimers Dis. 2010, 20, 1167–1180. [Google Scholar]
  45. Ishii, M.; Hiller, A.; Pham, L.; McGuire, M.J.; Iadecola, C.; Wang, G. Amyloid-beta modulates low-threshold activated voltage-gated L-Type calcium channels of arcuate neuropeptide Y neurons leading to calcium dysregulation and hypothalamic dysfunction. J. Neurosci. 2019, 39, 8816–8825. [Google Scholar] [CrossRef] [PubMed]
  46. Yamamoto, K.; Ueta, Y.; Wang, L.; Yamamoto, R.; Inoue, N.; Inokuchi, K. Suppression of a neocortical potassium channel activity by intracellular amyloid-beta and its rescue with Homer1a. J. Neurosci. 2011, 31, 11100–11109. [Google Scholar] [CrossRef] [PubMed] [Green Version]
  47. Yamamoto, K.; Yamamoto, R.; Kato, N. Amyloid β and amyloid precursor protein synergistically suppress large-conductance calcium-activated potassium channel in cortical neurons. Front. Aging Neurosci. 2021, 13, 660319. [Google Scholar] [CrossRef]
  48. Yao, J.; Sun, B.; Institoris, A.; Zhan, X.; Guo, W. Limiting RYR2 open time prevents Alzheimer’s disease-related neuronal hyperactivity and memory loss but not β-amyloid accumulation. Cell Rep. 2020, 32, 108169. [Google Scholar] [CrossRef] [PubMed]
  49. Chakroborty, S.; Hill, E.; Christian, D.; Helfrich, R.; Riley, S. Reduced presynaptic vesicle stores mediate cellular and network plasticity defects in an early-stage mouse model of Alzheimer’s disease. Mol. Neurodegener. 2019, 14, 7. [Google Scholar] [CrossRef] [PubMed] [Green Version]
  50. Gavello, D.; Calorio, C.; Franchino, C.; Cesano, F.; Carabelli, V.; Carbone, E.; Marcantoni, A. Early alterations of hippocampal neuronal firing induced by Abeta42. Cereb. Cortex 2018, 28, 433–446. [Google Scholar] [CrossRef]
  51. Kaczorowski, C.; Sametsky, E.; Shah, S.; Vassar, R.; Disterhoft, J.F. Mechanisms underlying basal and learning-related intrinsic excitability in a mouse model of Alzheimer’s disease. Neurobiol. Aging 2011, 32, 1452–1465. [Google Scholar] [CrossRef] [Green Version]
  52. Briggs, C.; Chakroborty, S.; Stutzmann, G.E. Emerging pathways driving early synaptic pathology in Alzheimer’s disease. Biochem. Biophys. Res. Commun. 2017, 483, 988–997. [Google Scholar] [CrossRef] [PubMed] [Green Version]
Figure 1. Schematic representation of the simple, general model of neuronal activity and Ca2+ dynamics in the absence of IP3-generating agonist. The currents that directly govern membrane electrical activity are represented in the black square and correspond to high-voltage gated calcium channels (Ca(V)), calcium-activated potassium channels (K(Ca)), voltage-dependent sodium channels (Na(V)), delayed rectifier potassium channels (K(V)), and the sodium–calcium exchanger (NCX). Except for the latter, the formulation of all these currents is taken directly from Gall et al., 2003. In the present study, we consider three Ca2+ compartments, corresponding to the sub-plasmalemmal space, the bulk of the cytosol, and the ER. When active, the voltage-gated calcium channels transport Ca2+ in the sub-plasmalemmal space. From this compartment, Ca2+ is transported outside the cell via PMCA and NCX. Exchanges between the cytosol and ER are mediated by the SERCA and the IP3R and RyR that are gathered in a JER flux because we do not consider the situation in which the cell would be stimulated by an IP3- or NAADP-generating agonist.
Cells 11 00615 g001
Figure 2. Analysis of the behavior of the model in the absence of perturbation by Aβ peptides. (A) Evolution of voltage in the absence of the injected current (red line) or when IInj = 20 pA (blue line). (B) Evolution of the Ca2+ concentration in the subplasmalemmal compartment in the absence of the injected current (red line) or when IInj = 20 pA (blue line). (C) Ca2+ fluxes through the PMCA in the absence of injected current (red line) or when IInj = 20 pA (blue line). (D) Ca2+ fluxes through the NCX in the absence of injected current (red line) or when IInj = 20 pA (blue line). (E) Bifurcation diagram showing the steady state solutions of the model for increasing values of Iinj. Plain and dashed curves correspond to stable and unstable situations, respectively. Black curves indicate steady states and red ones, oscillatory solutions, with the high and low curves showing the maximal and minimal values of membrane voltage reached during repetitive action potentials. (F) Two-parameter bifurcation diagram showing the zone of stability of the steady state (in white) and of the oscillatory solutions (in grey) in the (Iinj, γ) plane. Thus, a faster diffusion of Ca2+ in the cytosol decreases the threshold value of current that must be injected into the cell to induce electrical activity.
Cells 11 00615 g002
Figure 3. Simulations of the impacts of Aβ peptides induced perturbations of PMCA’s and SERCA’s on neuronal activity and Ca2+ dynamics. (A,B) Two parameter bifurcation diagrams showing the zone of existence of neuronal activity when changing the maximal rate (A) or the half-saturation constant (B) of the PMCA. (C,D) Two parameter bifurcation diagrams showing the zone of existence of neuronal activity when changing the maximal rate (C) or the half-saturation constant (D) of the SERCA. (E) Temporal evolution of IK(Ca) for IInj = 5.83 pA and VPMCA = 20 μMms−1 (red curve), 75 μMms−1 (blue curve) and 200 μMms−1 (green curve). (F) Temporal evolution of the Ca2+ concentrations for IInj = 5.83 pA when changing the maximal rate of the SERCA. Plain lines correspond to Ca2+ concentrations in the subplasmalemmal space for VSERCA = 10 μMms−1 (blue curve) and 195 μMms−1 (purple curve), showing the lack of influence of the SERCA pump activity on Ca2+ concentration just below the plasma membrane during electrical activity. Corresponding values of the Ca2+ concentration in the bulk of the cytoplasm are indicated by dashed lines (red curve, VSERCA = 10 μMms−1; blue curve, VSERCA = 195 μMms−1).
Cells 11 00615 g003
Figure 4. Simulations of the impacts of Aβ peptides induced perturbations of the basal rate of Ca2+ release from the ER on neuronal activity and Ca2+ dynamics. (A) Two parameter bifurcation diagram showing the zone of existence of neuronal activity when changing the rate constant of Ca2+ release from the ER. (B) Temporal evolution of the Ca2+ concentrations for IInj = 20 pA when changing the rate constant kin. Plain lines correspond to Ca2+ concentrations in the subplasmalemmal space for kin = 0.15 ms−1 (green curve), 0.015 ms−1 (blue curve), and 0.0015 ms−1 (red curve). Corresponding values of the Ca2+ concentration in the bulk of the cytoplasm are indicated by dashed lines.
Cells 11 00615 g004
Figure 5. Simulations of the impacts of the presence of pores of Aβ peptides in the plasma membrane on neuronal activity and Ca2+ dynamics. (A) Two parameter bifurcation diagram showing the zone of existence of neuronal activity when changing the rate constant of Ca2+ entry through the pores. (B) Temporal evolution of the Ca2+ concentrations for IInj = 20 pA and gKCa = 30 nS in the absence (blue curve) or presence (red curve, VAbeta = 2 μMms−1) of pores of Aβ peptides. Plain lines indicate Ca2+ concentration in the subplasmalemmal compartment and dashed ones in the bulk of the cytosol. (C) Relation between the frequency of action potentials and the value of VAbeta for IInj = 20 pA and gKCa = 40 (red curve) or 30 nS (blue curve). (D) Irregular electrical activity occurring for large values of VAbeta. IInj = 20 pA, VAbeta = 20, and gKCa = 30 nS.
Cells 11 00615 g005
Figure 6. Simulations of the impacts of Aβ peptide induced perturbations of the voltage-gated Ca2+ channels on neuronal activity and Ca2+ dynamics. (A) Changes in the values of parameters involved in the activation and deactivation of the voltage gated Ca2+ channel, as described in Equations (14) and (15), allows for reproducing the Aβ peptide induced shift in the voltage dependency described by Ishii et al. (2019) [45]. The blue and red curves correspond to the default and modified values of parameters, respectively. Curves have been obtained by solving Equations (14), (15), (S7), (S18) and (S19) at steady state. (B) Comparison of the frequency vs. injected current relations for the default (blue) and modified values of parameters of the voltage-gated Ca2+ channel. (C,D) Temporal evolution of membrane voltage and subplasmalemmal Ca2+ concentrations for IInj = 20 pA with the values of parameters corresponding to the voltage gated Ca2+ channel modified by the presence of Aβ peptides.
Cells 11 00615 g006
Figure 7. Simulations of the impacts of Aβ peptide induced perturbations of the Ca2+ -activated K+ channels on neuronal activity and Ca2+ dynamics. (A) Two parameter bifurcation diagram showing the zone of existence of neuronal activity when changing the conductance of the the Ca2+ activated K+ channels. (B) Simulated evolution of membrane voltage for Iinj = 20 pA and gKCa = 15 (red), 56.5 (blue), 80 (green), and 100 nS (purple).
Cells 11 00615 g007
Table 1. List of the parameters of the model. Values indicated have been used for all figures, except if mentioned in the legend. Parameters associated with the dynamics of the currents are given directly in the equations listed in the Supplementary Material.
Parameter NameParameter MeaningValue
C m Membrane capacity3.14 pF
V shell Volume of the shell 26.378   μ m 3
FFaraday constant 96.485   C   mol 1
fCalcium buffering capacity of the cytoplasm0.01
I inj Injected Current[0.150] pA
k in Rate   constant   of   unstimulated   C a 2 + release from the ER 0.015   ms 1
Ca ER ER   Ca 2 + concentration 500   μ M
γShell-Cytoplasm Diffusion Coefficient 0.001   ms 1
V Na + Equilibrium   Potential   for   Na + ions55 mV
V K + Equilibrium   Potential   for   K +   ions−90 mV
V Ca 2 + Equilibrium   Potential   for   C a 2 + ions80 mV
V NCX Equilibrium Potential for the NCX channel−20 mV
g Na + Conductance   of   the   voltage-gated   Na + channel172 nS
g K + Conductance   of   the   voltage-gated   K + channel28 nS
g Ca 2 + Conductance   of   the   voltage-gated   Ca 2 + channel58 nS
g K Ca 2 + Conductance   of   the   K + activated   Ca 2 + channel56.5 nS
K NCX Half saturation constant of the NCX channel 1   μ M
K PMCA Half saturation constant of the PMCA 1   μ M
K SERCA Half saturation constant of the SERCA 0.2   μ M
V PMCA Maximal velocity of the PMCA 75   μ M   ms 1
V SERCA Maximal velocity of the SERCA 195   μ M   ms 1
V Abeta Maximal   rate   of   Ca 2 + release through pores of Aβ peptides 0   μ M   ms 1
q 1 Voltage   dependence   of   Ca 2 + entry through the pores of Aβ peptides−30 mV
q 2 Voltage   dependence   of   Ca 2 + entry through the pores of Aβ peptides23 mV
Publisher’s Note: MDPI stays neutral with regard to jurisdictional claims in published maps and institutional affiliations.

