
SARS-CoV-2 Pattern Provides a New Scoring System and Predicts the Prognosis and Immune Therapeutic Response in Glioma
 , , , , , , and
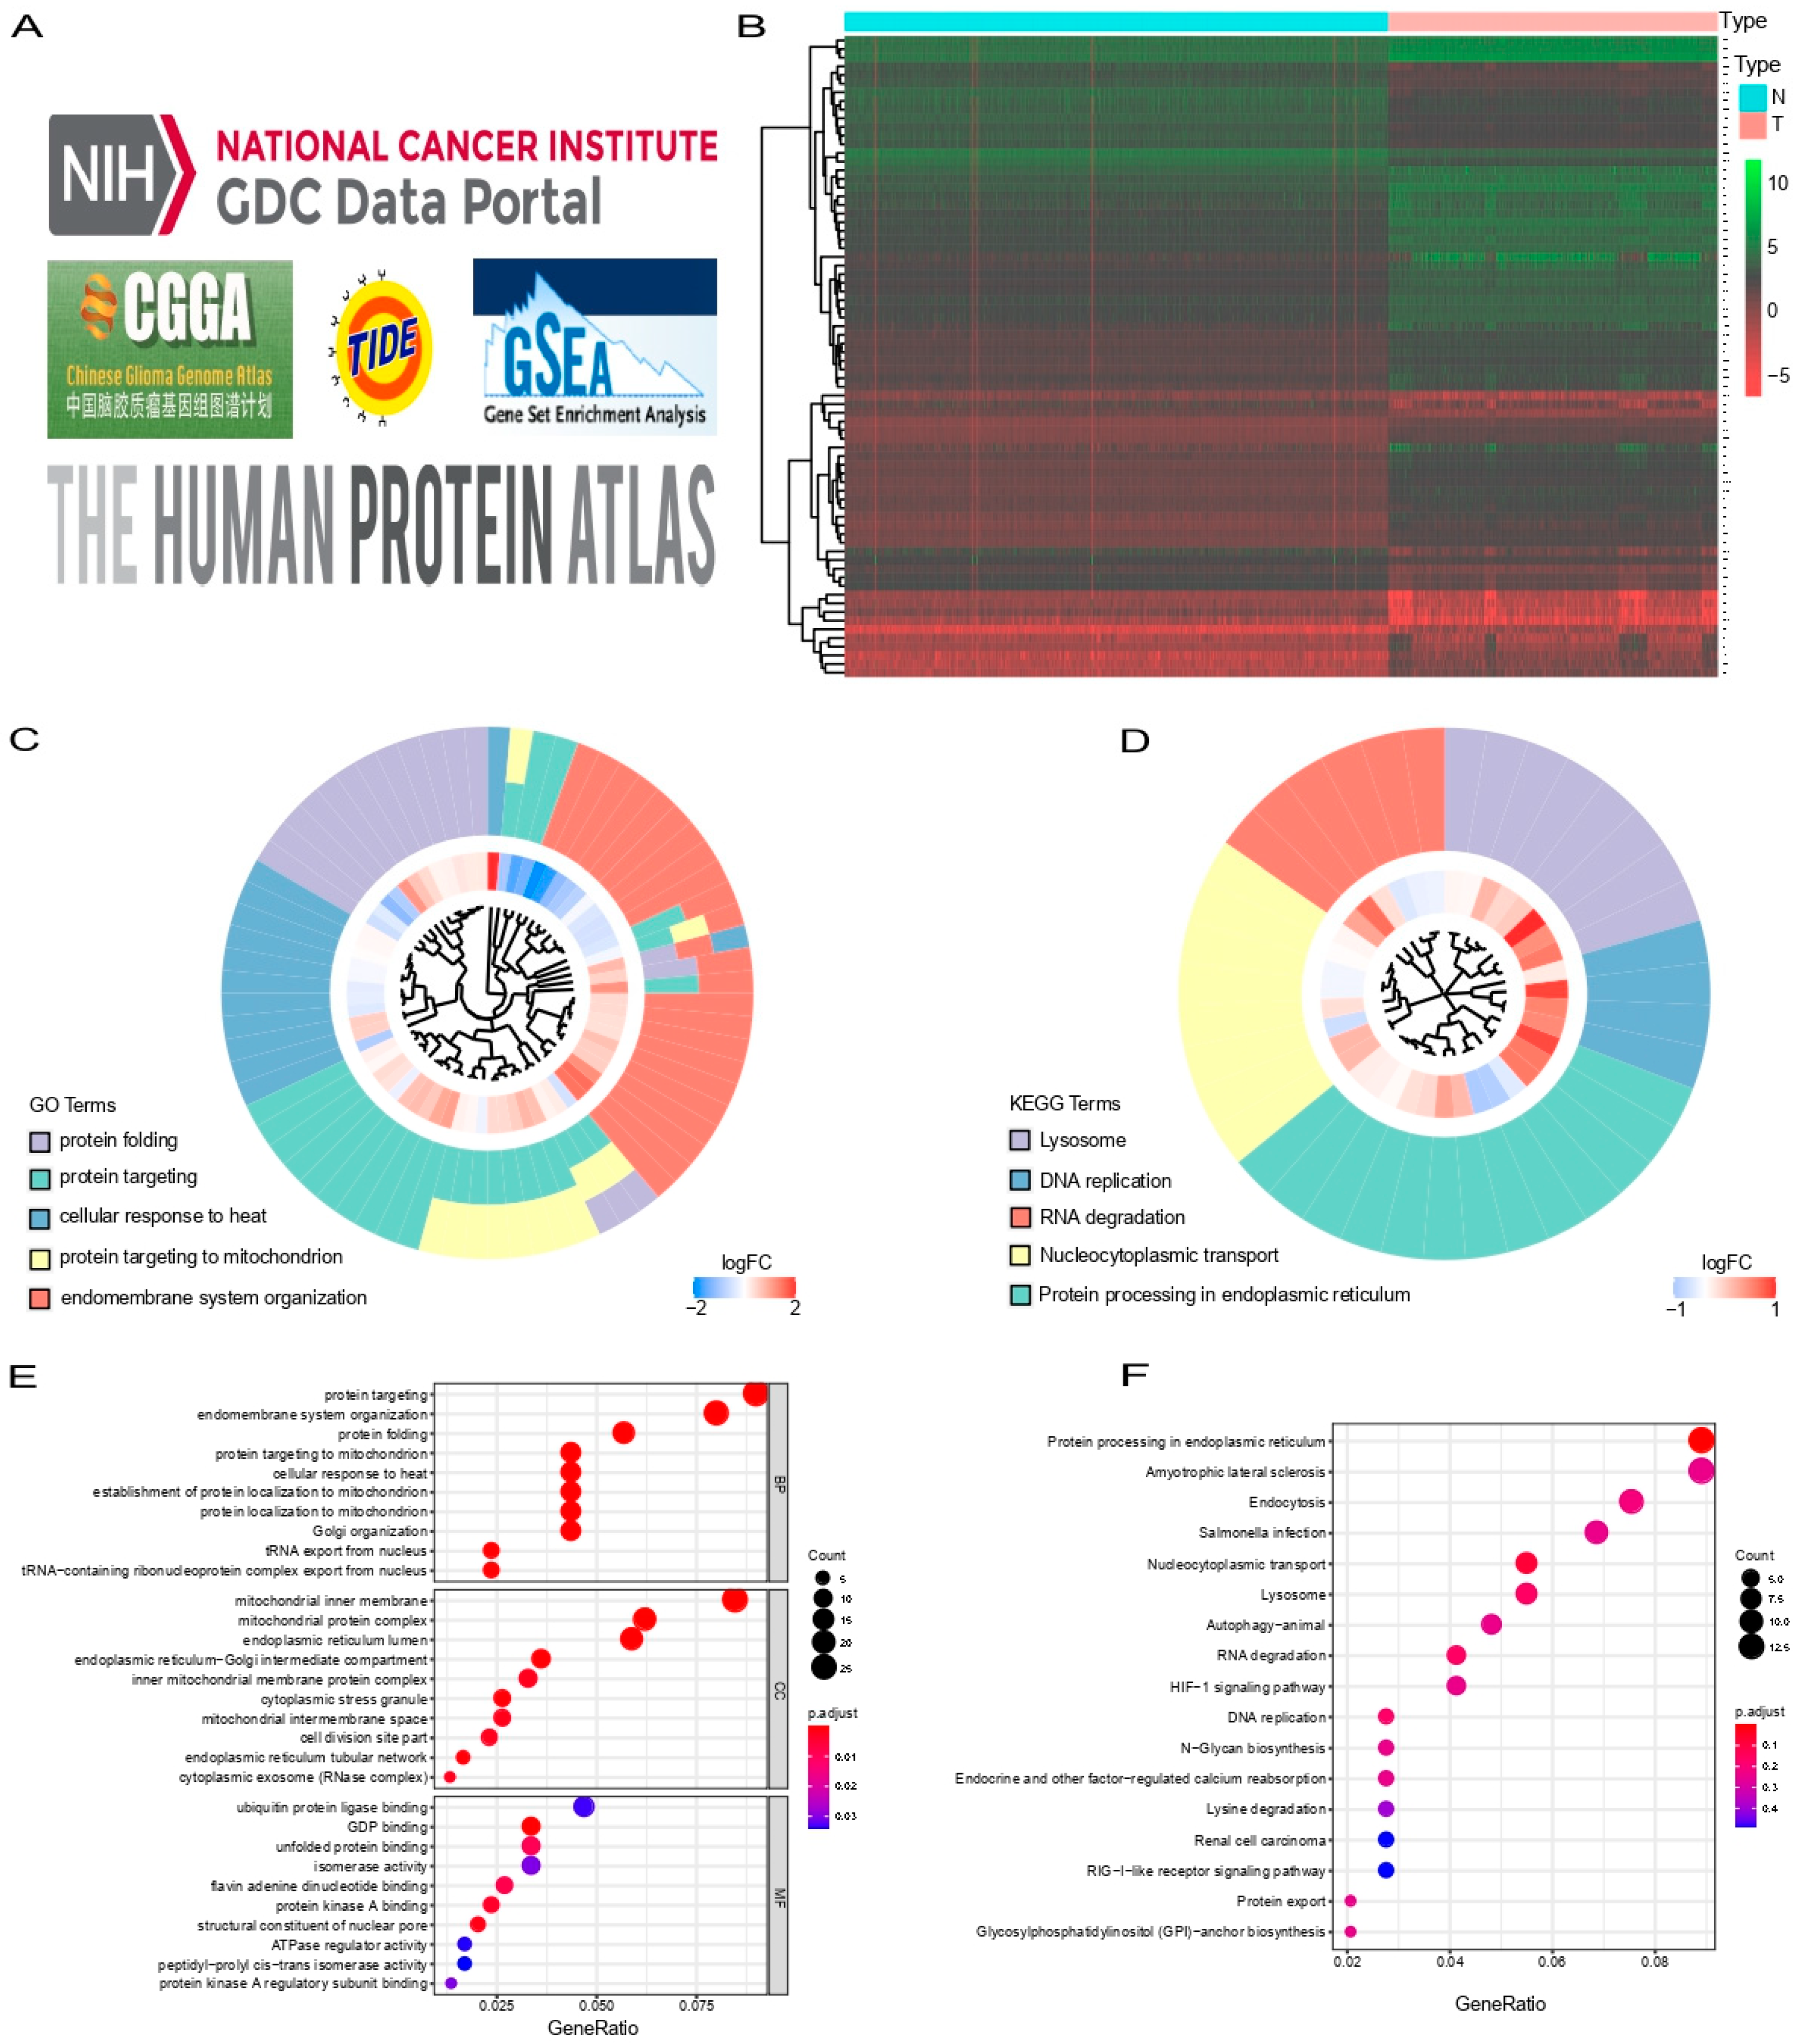
Abstract
:1. Introduction
2. Materials and Methods
2.1. Acquisition of Patient Data
2.2. Identification of SARS-CoV-2 Related Genes for Glioma in TCGA
2.3. Construction of the SARS-CoV-2 Related Risk Signature
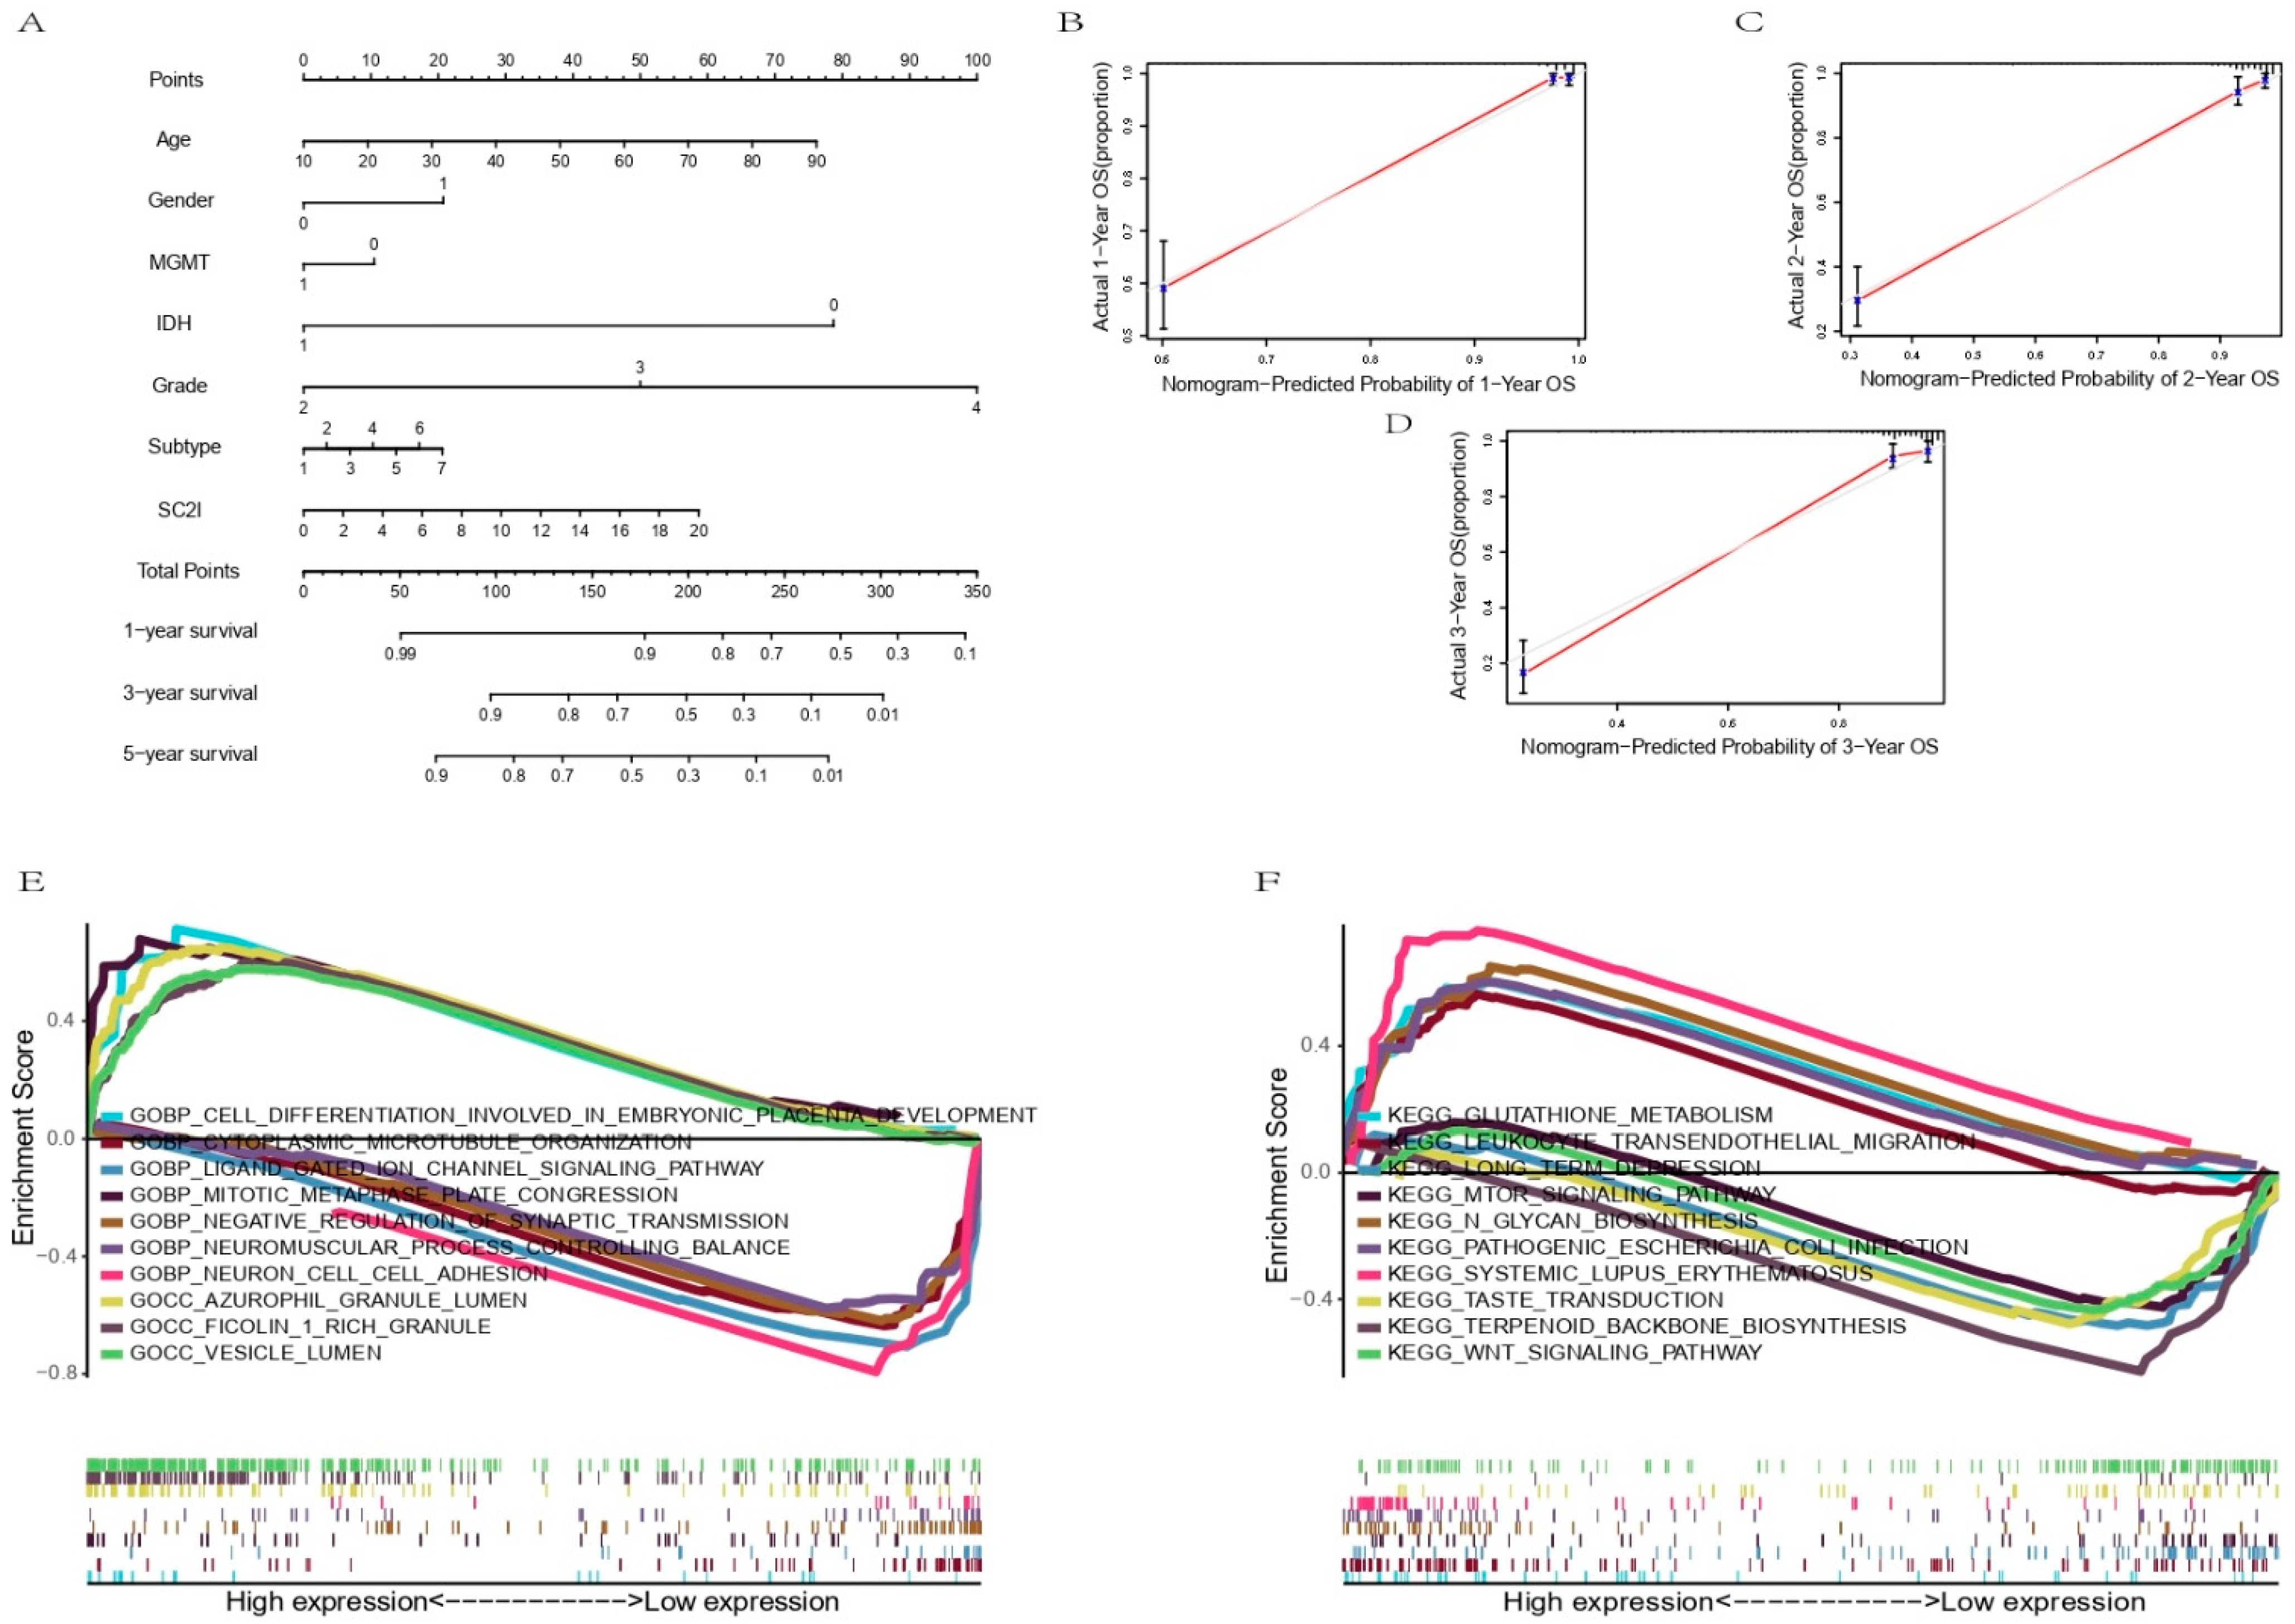
2.4. Construction and Evaluation of a Predictive Nomogram
2.5. Functional Enrichment Analysis
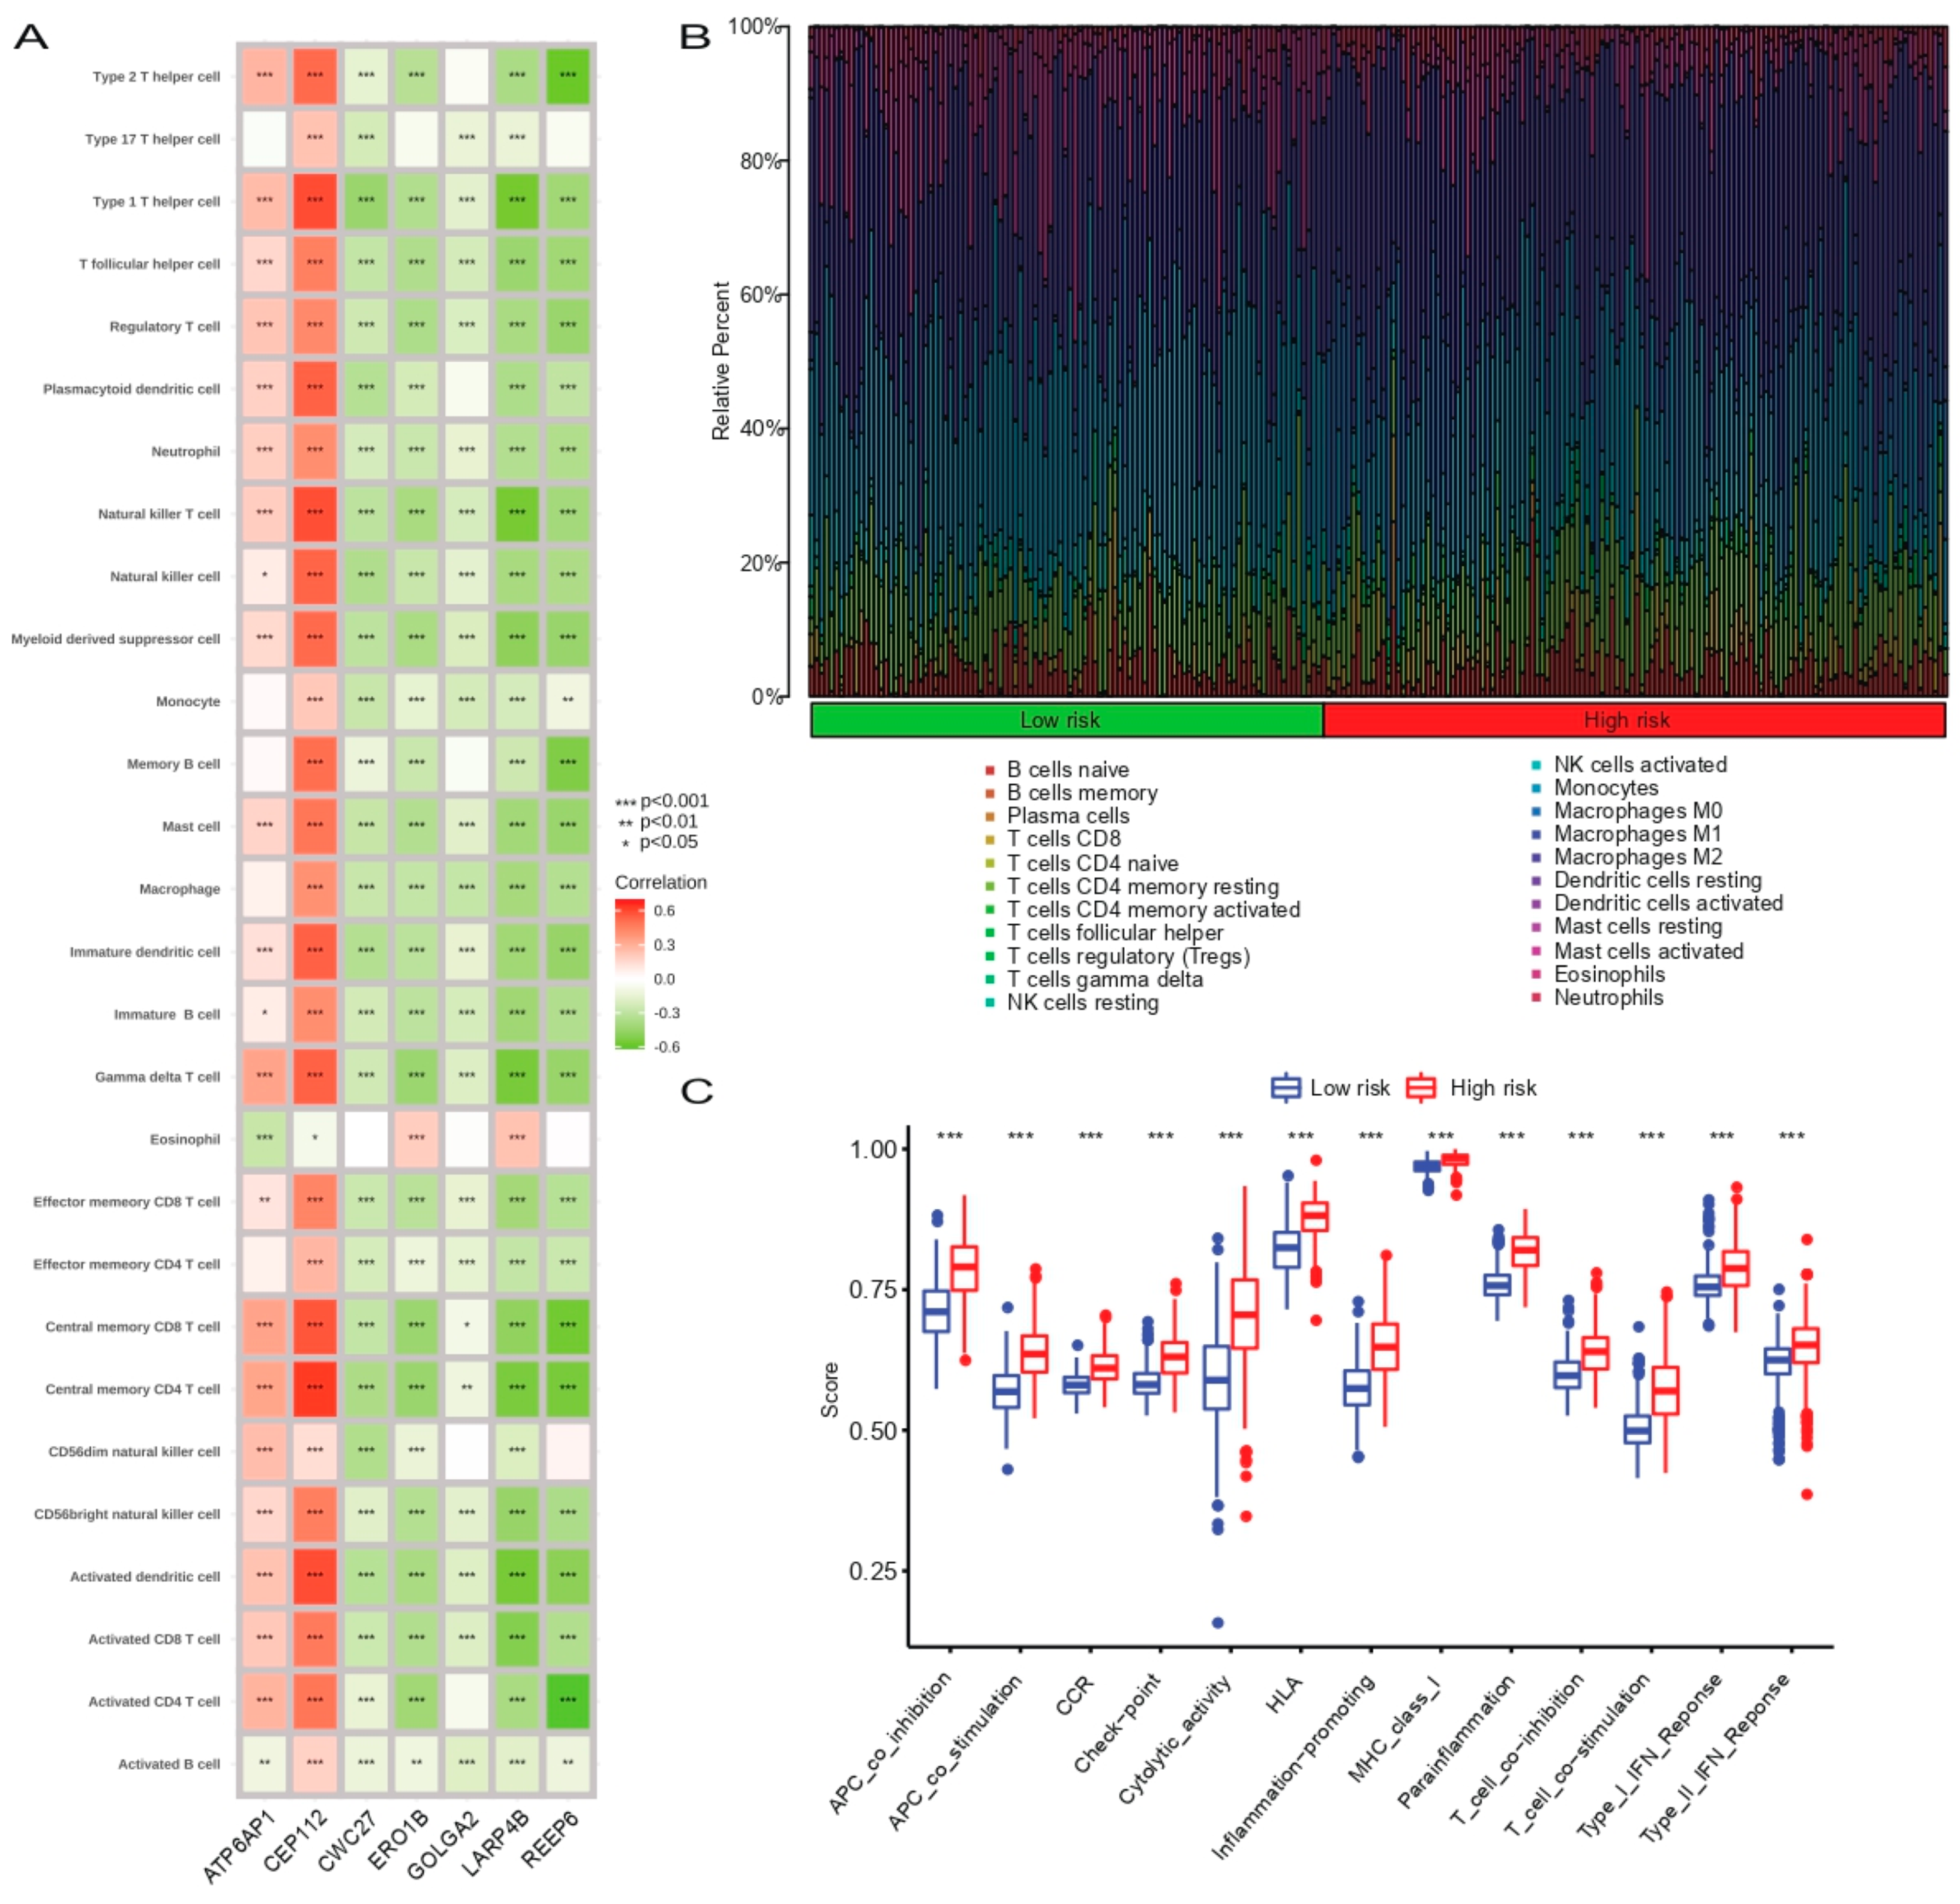
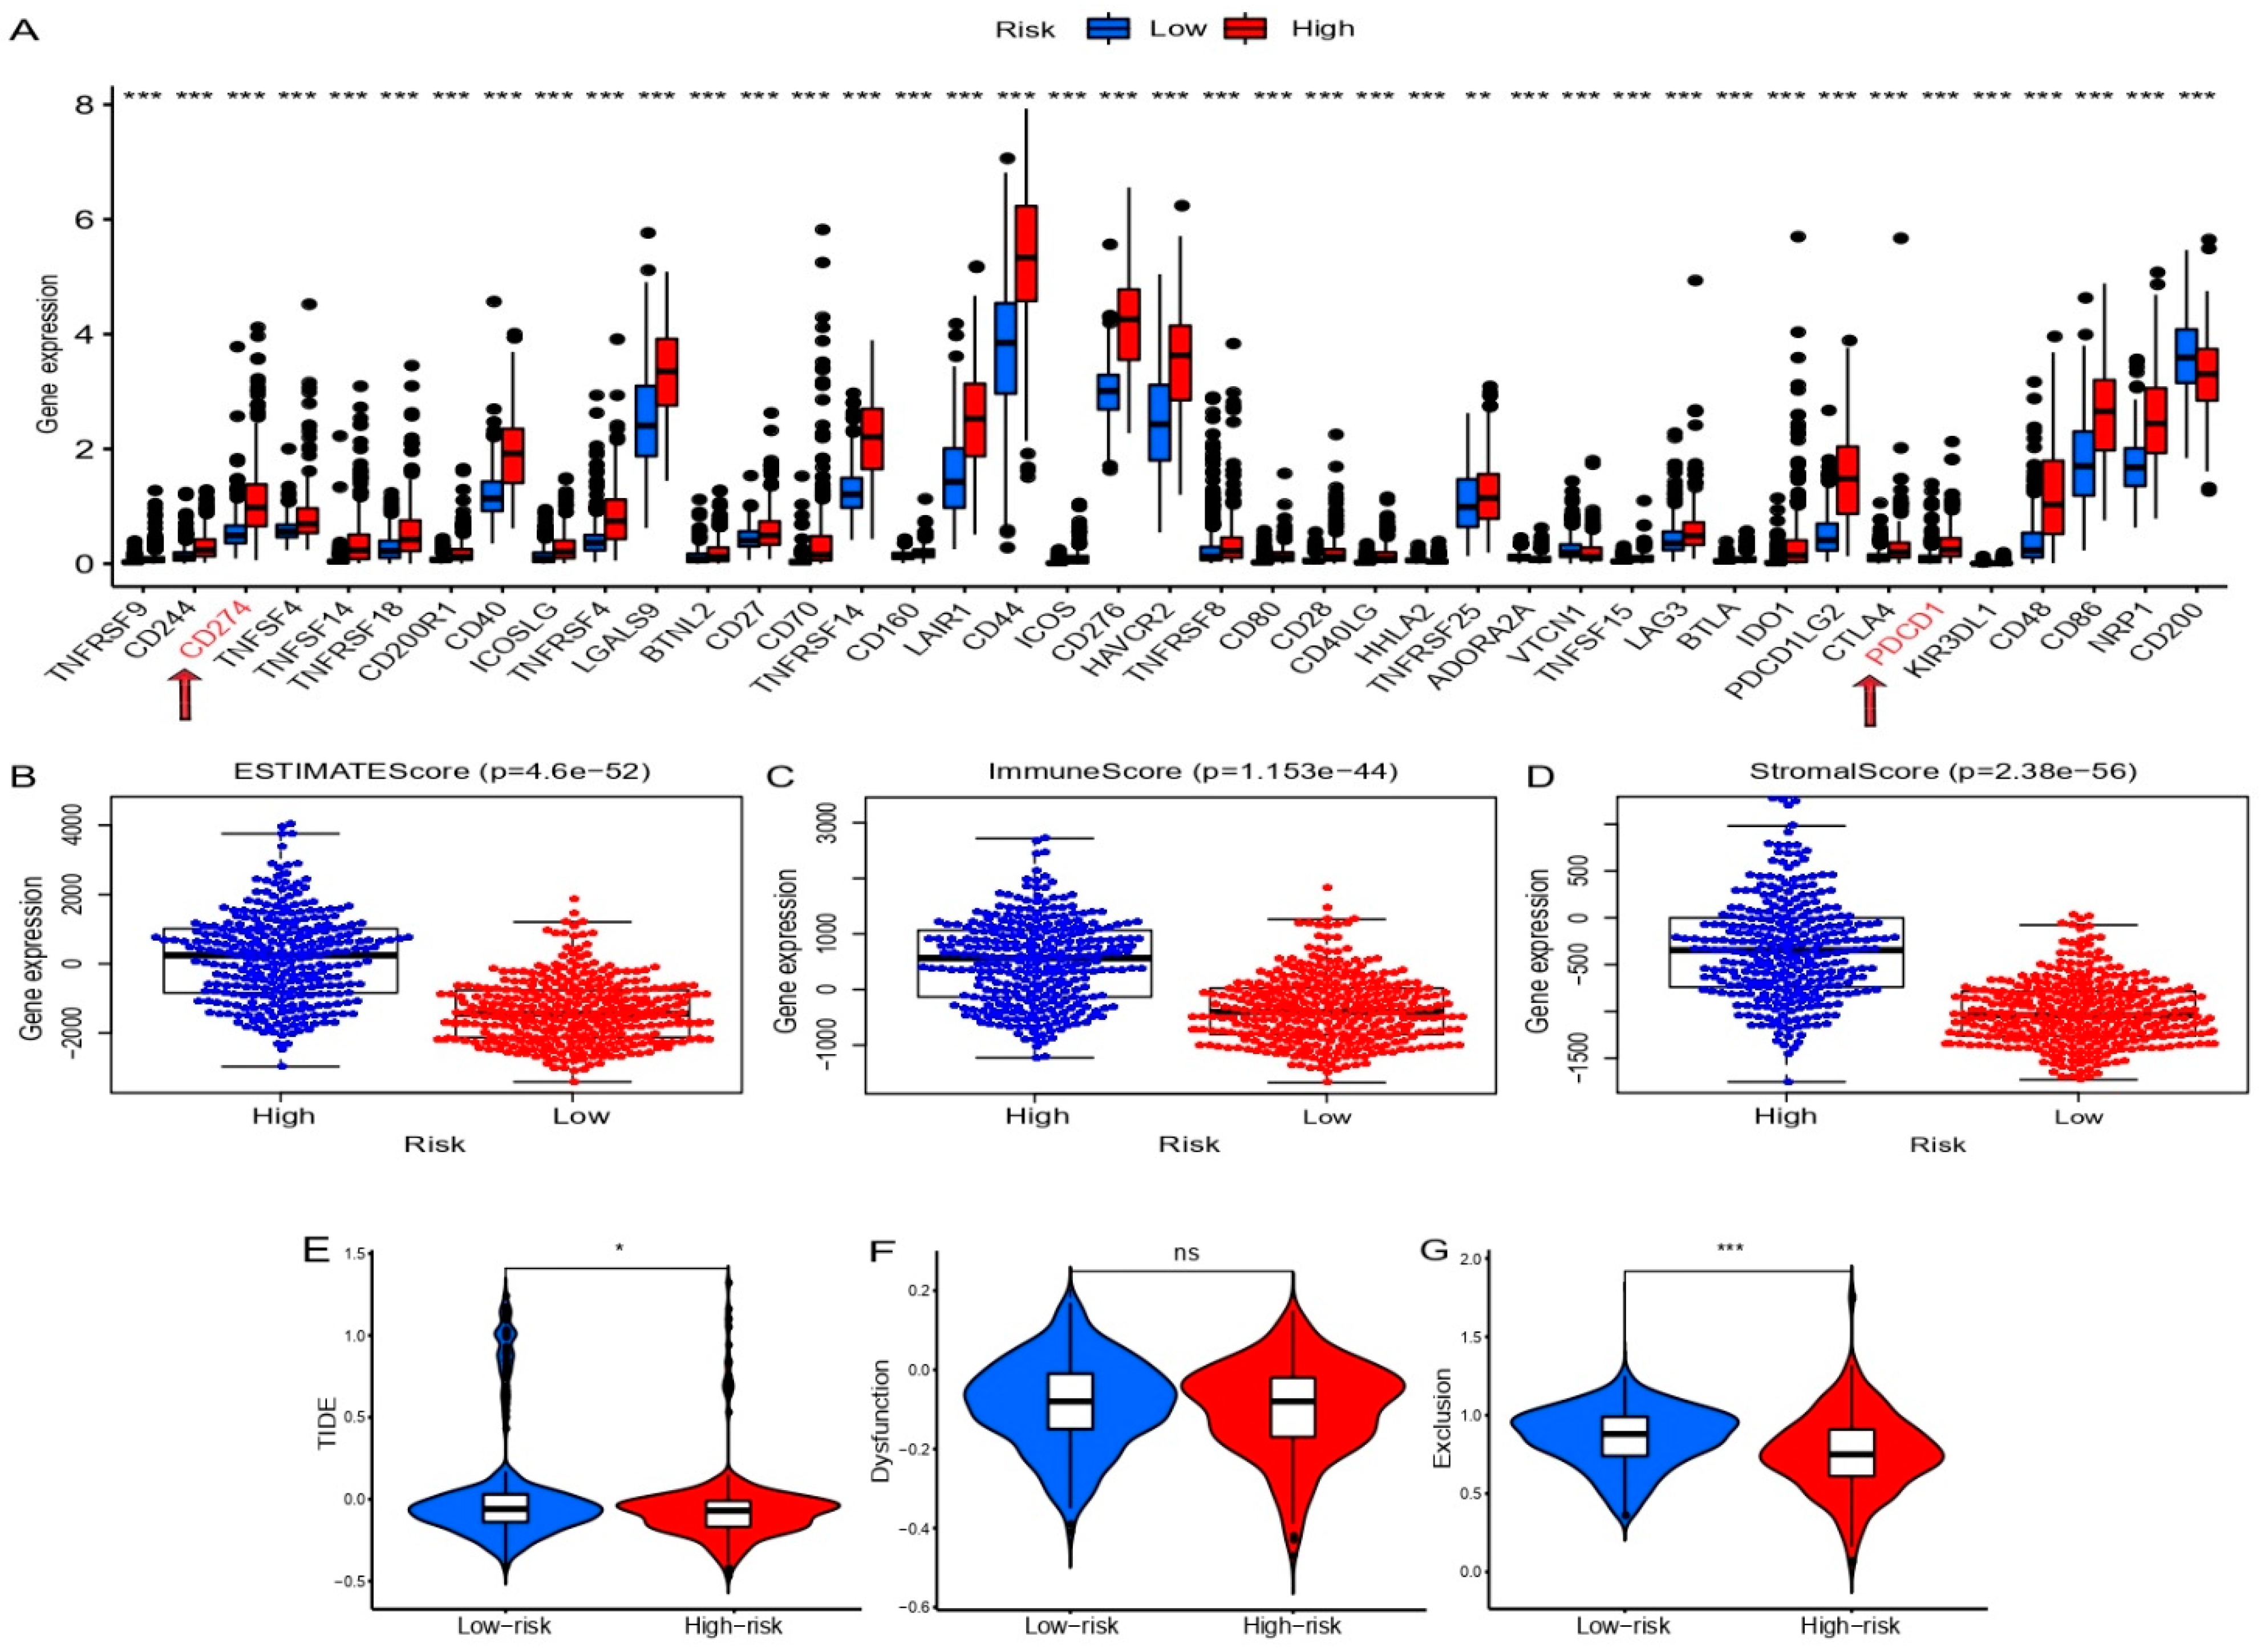
2.6. Evaluation of the Immune Landscape
2.7. Validation of SARS-CoV-2 Related Gene Signature in CGGA
2.8. Tissue Samples and Quantitative Real-Time Polymerase Chain Reaction (qRT-PCR)
2.9. Statistical Analysis
3. Results
3.1. Identification of Prognostic SARS-CoV-2 Related Differentially Expressed Genes in Glioma Patients
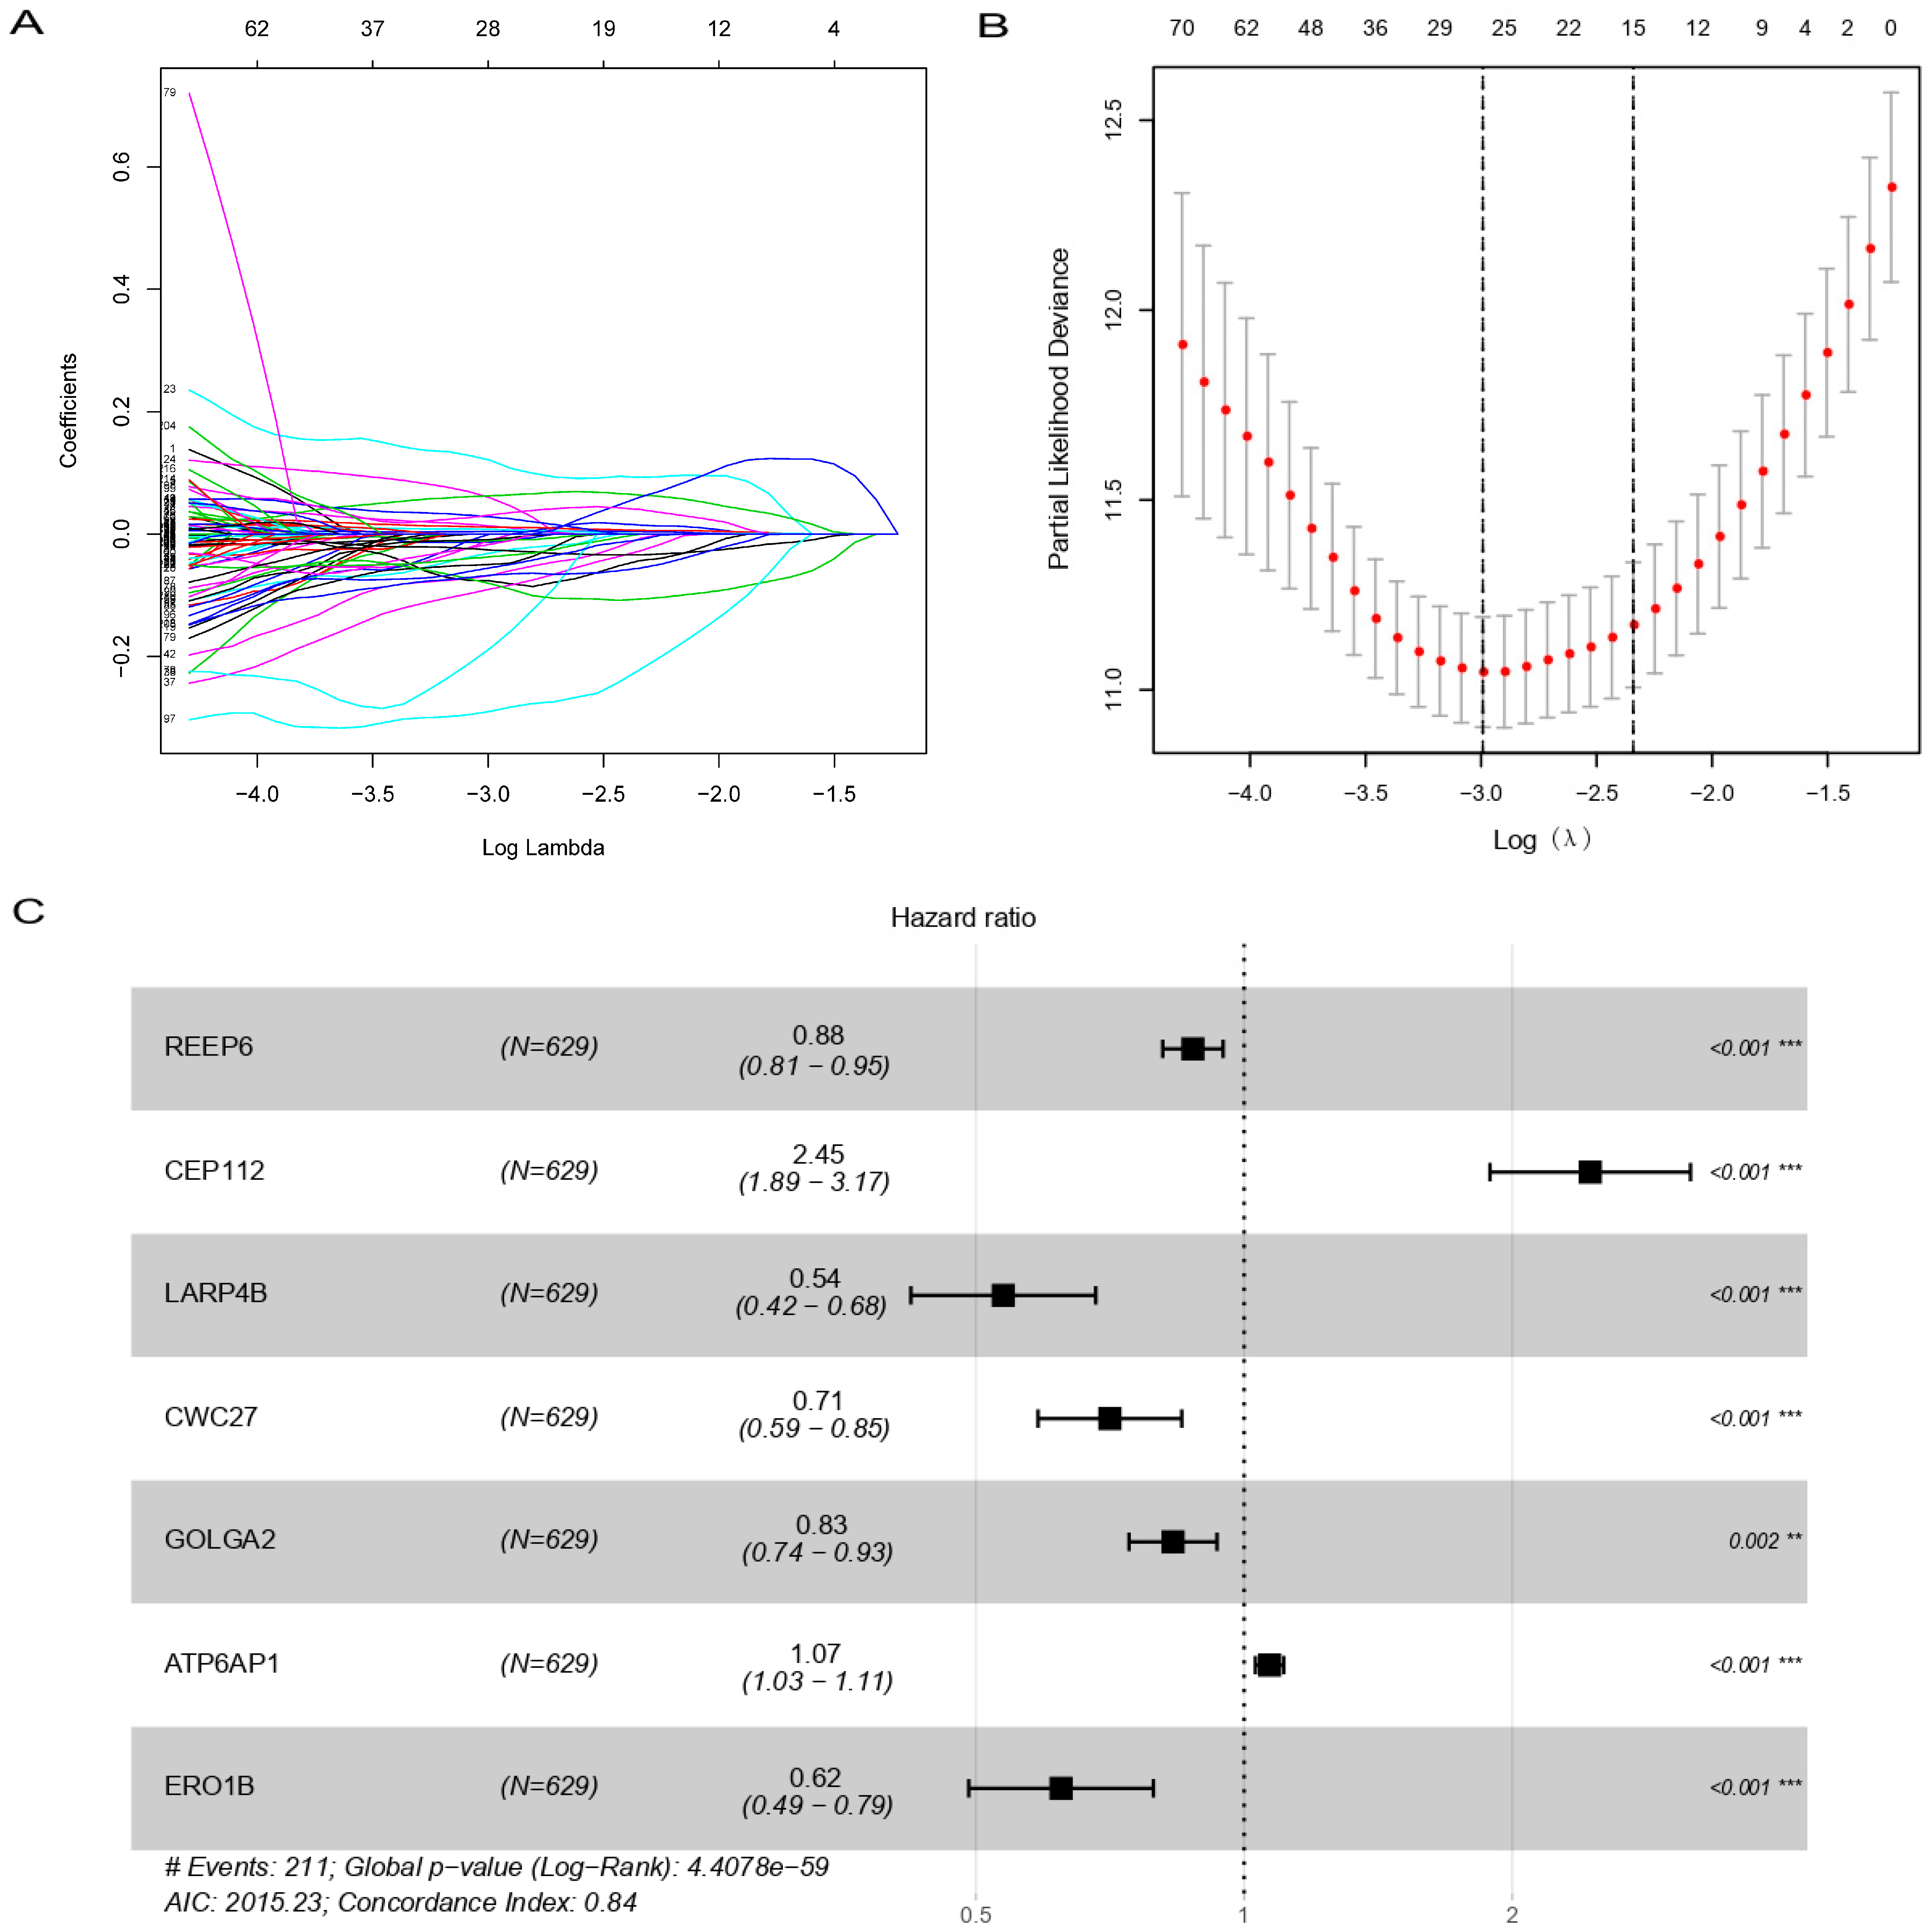
3.2. Construction of Prognostic SARS-CoV-2 Related Gene Signature
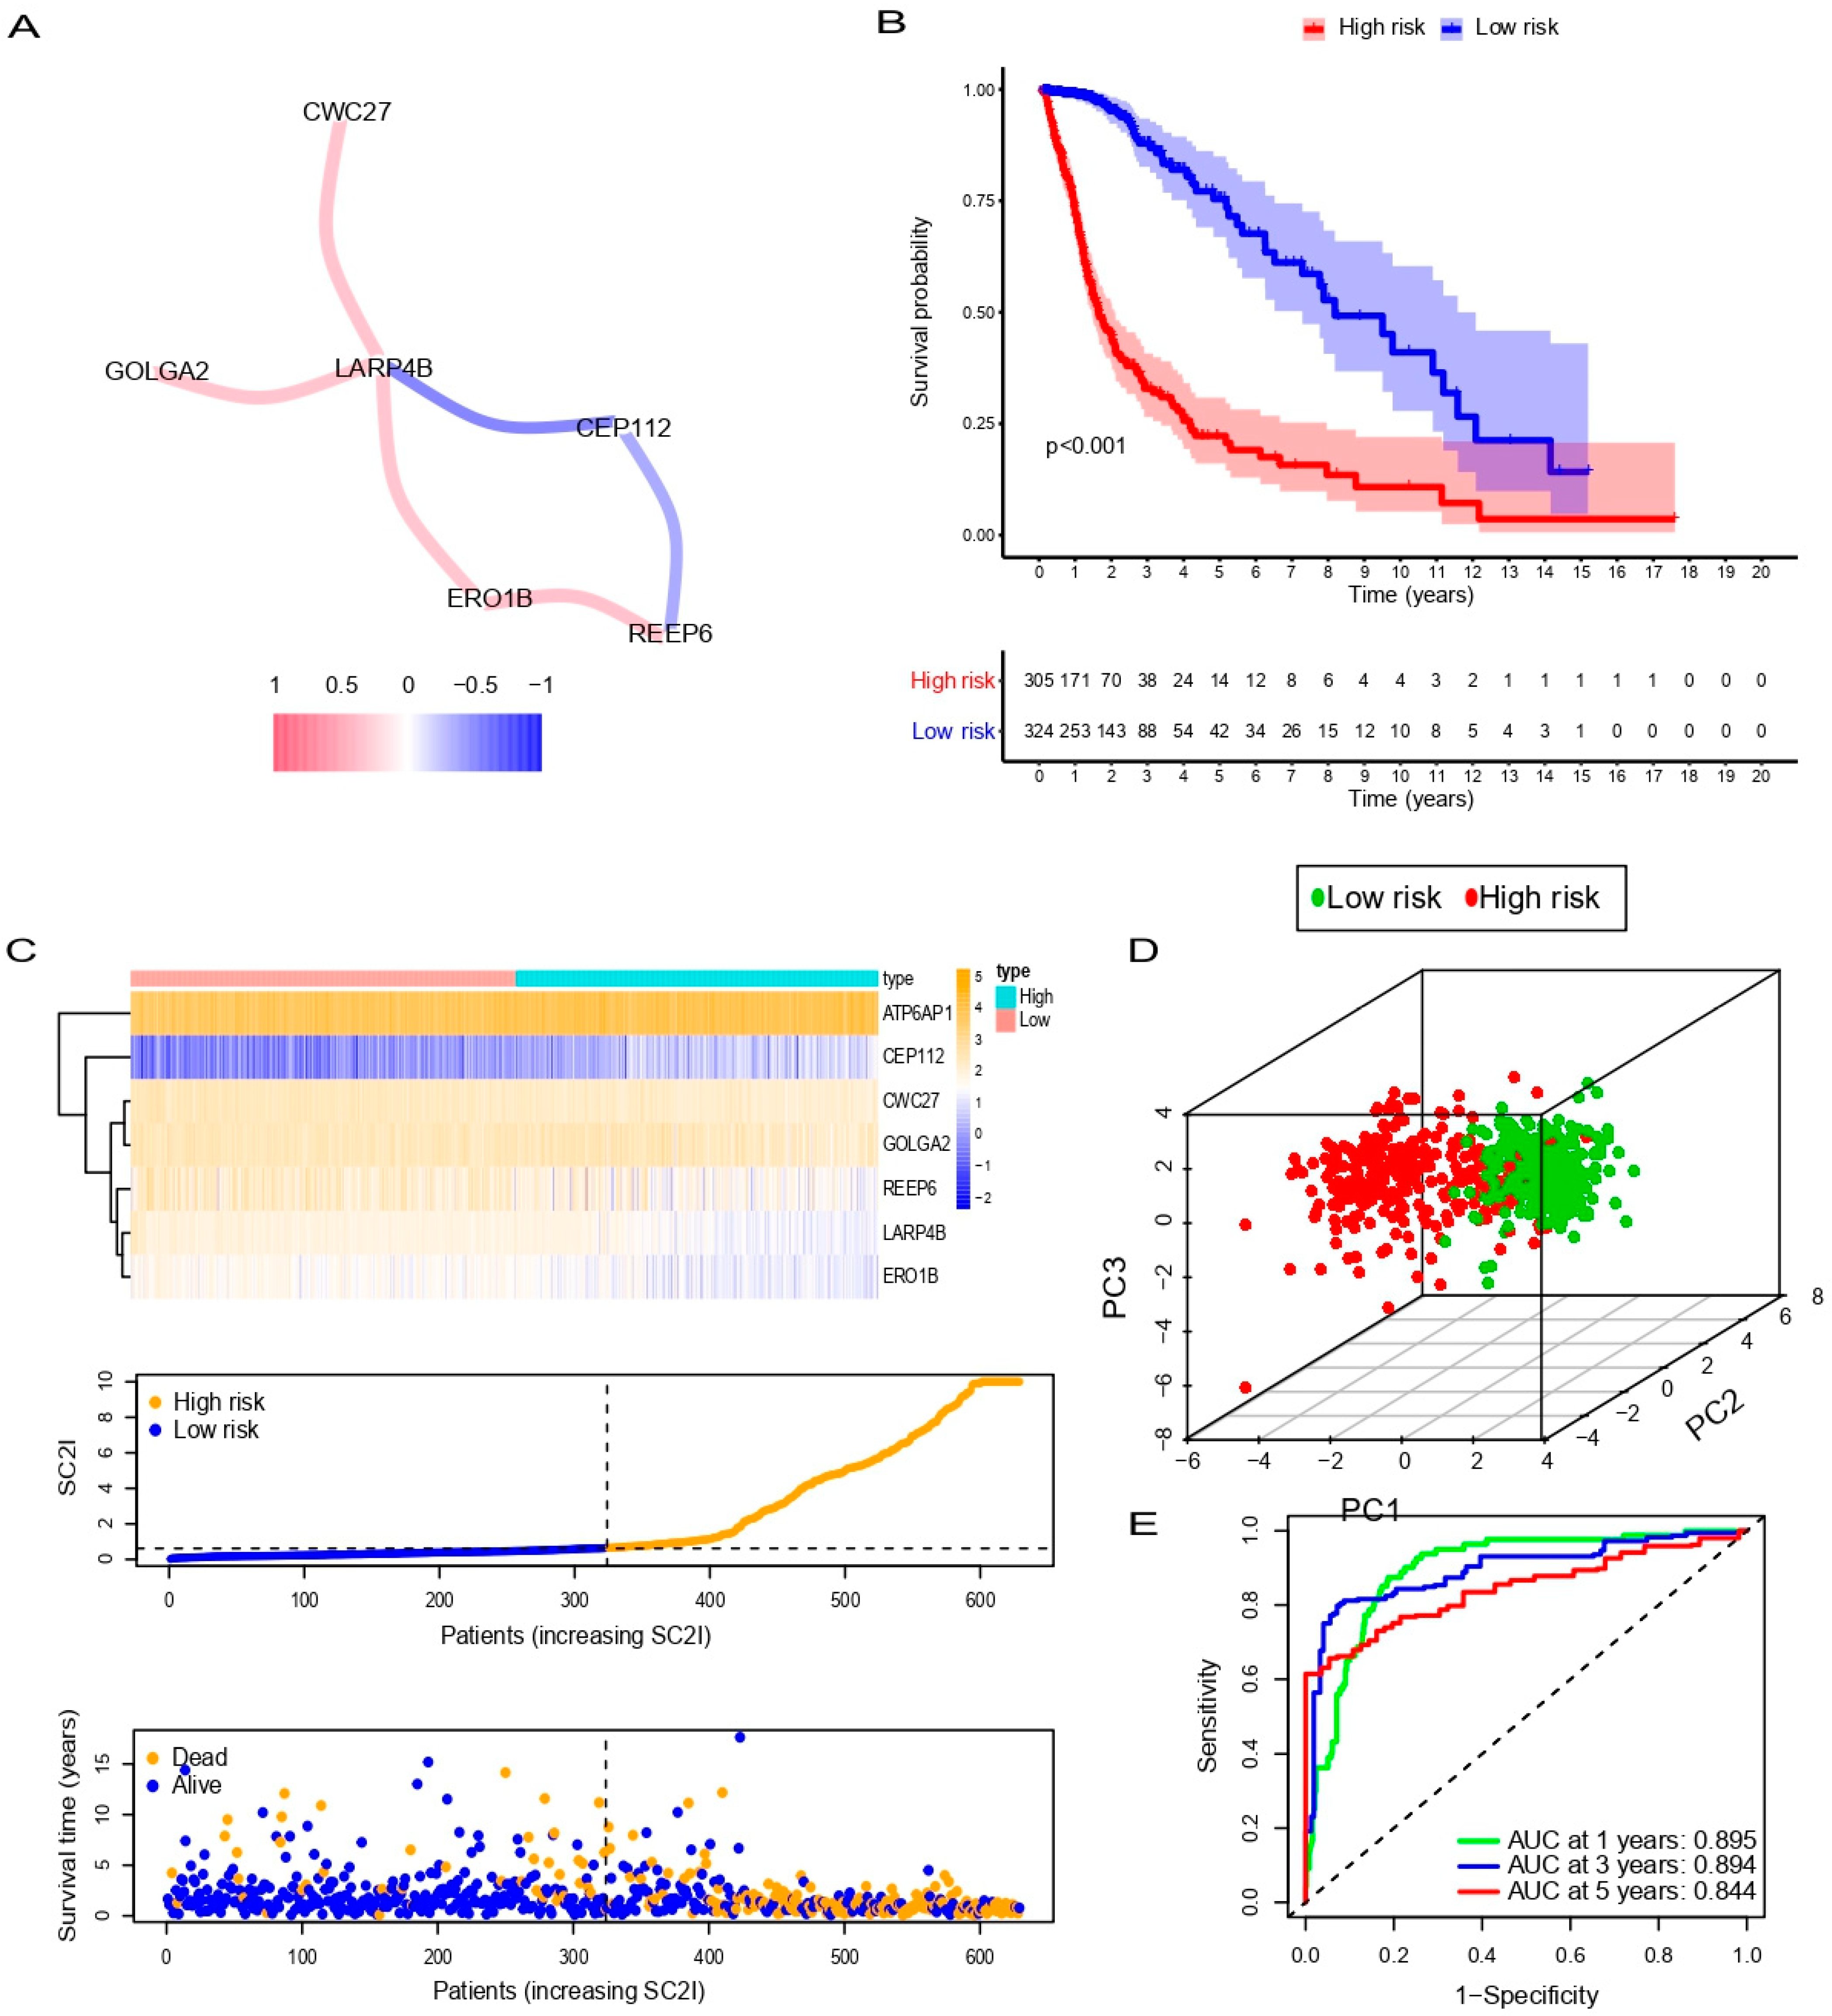
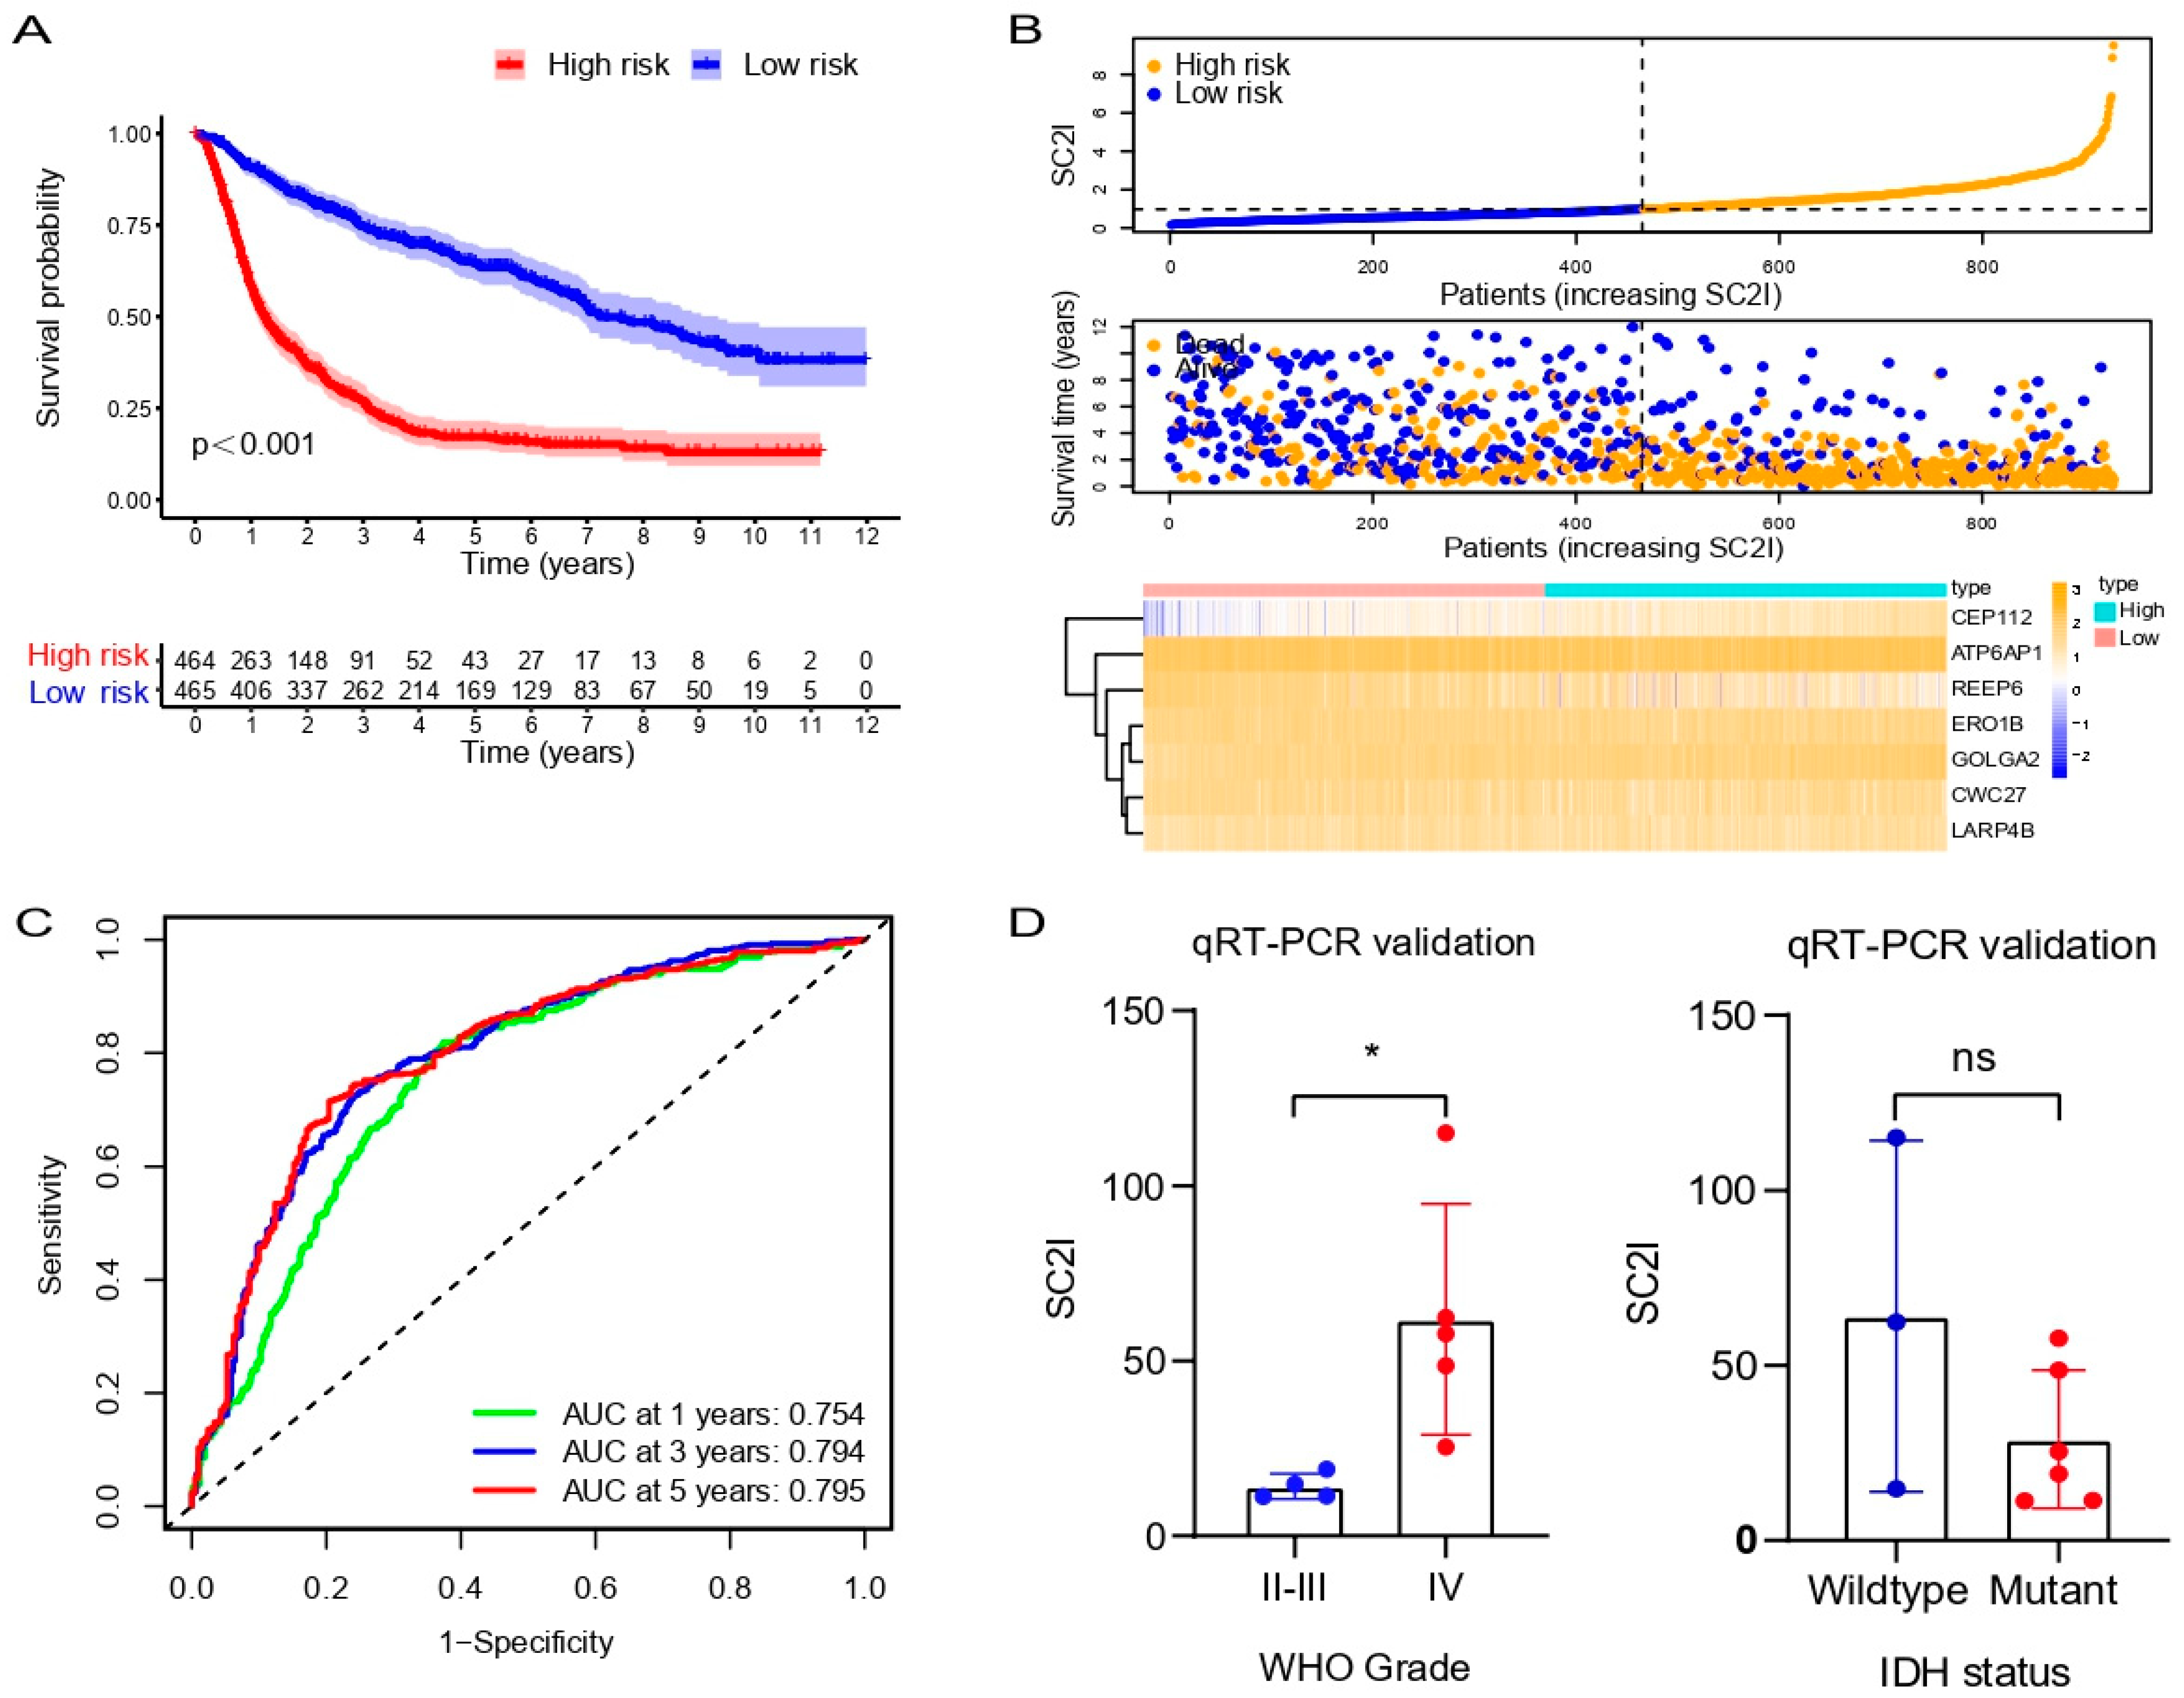
3.3. Evaluation of SC2I in TCGA
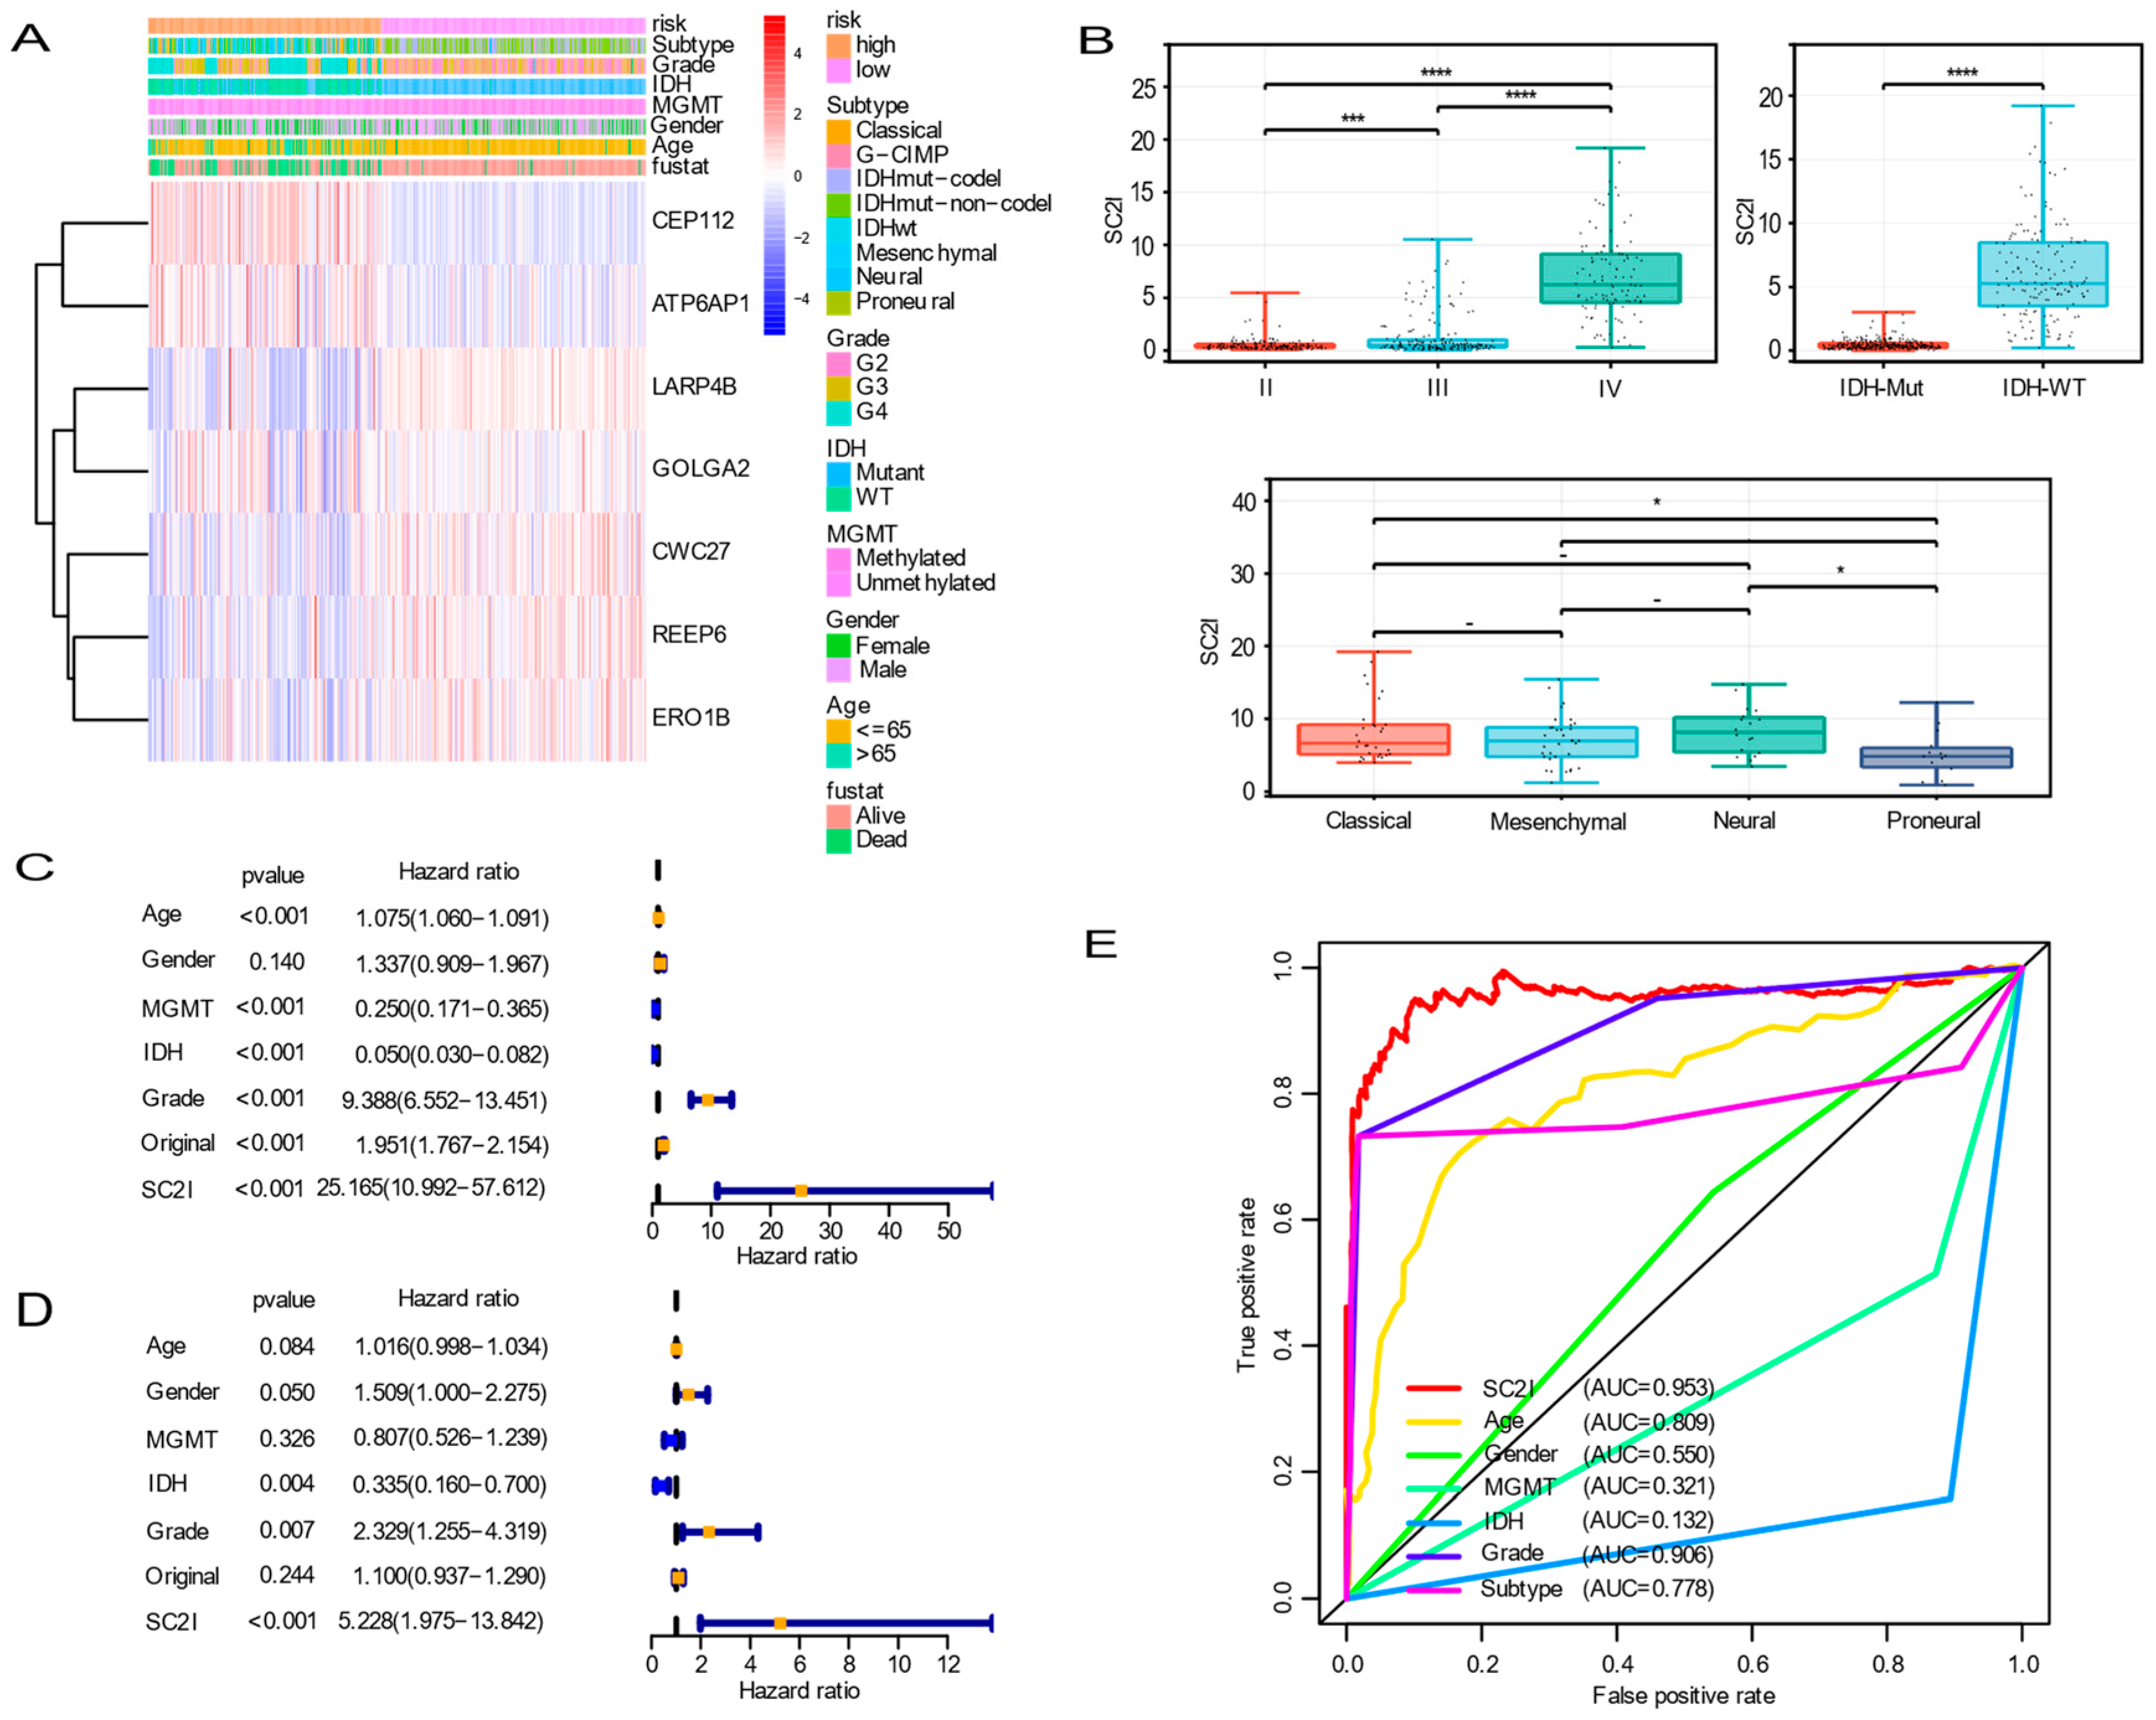
3.4. Independent Prognostic Value of OS
3.5. Establishment of a Nomogram Based on Independent Prognostic Factors for OS and Validation of Its Predictive Accuracy
3.6. Functional Enrichment Analysis
3.7. Correlation Analysis between Prognostic SCRGS and Immune Status of Glioma
3.8. Validation of the Prognostic Model in the CGGA Cohort
3.9. Validation of Prognostic Model in Glioma Samples
4. Discussion
5. Conclusions
Supplementary Materials
Author Contributions
Funding
Institutional Review Board Statement
Informed Consent Statement
Data Availability Statement
Acknowledgments
Conflicts of Interest
References
- Reifenberger, G.; Wirsching, H.-G.; Knobbe-Thomsen, C.B.; Weller, M. Advances in the molecular genetics of gliomas—Implications for classification and therapy. Nat. Rev. Clin. Oncol. 2017, 14, 434–452. [Google Scholar] [CrossRef] [PubMed]
- Zhao, Z.; Zhang, K.-N.; Wang, Q.; Li, G.; Zeng, F.; Zhang, Y.; Wu, F.; Chai, R.; Wang, Z.; Zhang, C.; et al. Chinese Glioma Genome Atlas (CGGA): A Comprehensive Resource with Functional Genomic Data from Chinese Glioma Patients. Genom. Proteom. Bioinform. 2021, 19, 1–12. [Google Scholar] [CrossRef] [PubMed]
- Lapointe, S.; Perry, A.; Butowski, N.A. Primary brain tumours in adults. Lancet 2018, 392, 432–446. [Google Scholar] [CrossRef]
- Louis, D.N.; Perry, A.; Reifenberger, G.; von Deimling, A.; Figarella-Branger, D.; Cavenee, W.K.; Ohgaki, H.; Wiestler, O.D.; Kleihues, P.; Ellison, D.W. The 2016 World Health Organization Classification of Tumors of the Central Nervous System: A summary. Acta Neuropathol. 2016, 131, 803–820. [Google Scholar] [CrossRef] [PubMed] [Green Version]
- Hu, H.; Mu, Q.; Bao, Z.; Chen, Y.; Liu, Y.; Chen, J.; Wang, K.; Wang, Z.; Nam, Y.; Jiang, B.; et al. Mutational Landscape of Secondary Glioblastoma Guides MET-Targeted Trial in Brain Tumor. Cell 2018, 175, 1665–1678.e18. [Google Scholar] [CrossRef] [PubMed] [Green Version]
- Ding, L.; Wang, Q.; Shen, M.; Sun, Y.; Zhang, X.; Huang, C.; Chen, J.; Li, R.; Duan, Y. Thermoresponsive nanocomposite gel for local drug delivery to suppress the growth of glioma by inducing autophagy. Autophagy 2017, 13, 1176–1190. [Google Scholar] [CrossRef] [PubMed]
- Safiabadi Tali, S.H.; LeBlanc, J.J.; Sadiq, Z.; Oyewunmi, O.D.; Camargo, C.; Nikpour, B.; Armanfard, N.; Sagan, S.M.; Jahanshahi-Anbuhi, S. Tools and Techniques for Severe Acute Respiratory Syndrome Coronavirus 2 (SARS-CoV-2)/COVID-19 Detection. Clin. Microbiol. Rev. 2021, 34, 3. [Google Scholar] [CrossRef]
- Kuderer, N.M.; Choueiri, T.K.; Shah, D.P.; Shyr, Y.; Rubinstein, S.M.; Rivera, D.R.; Shete, S.; Hsu, C.-Y.; Desai, A.; de Lima Lopes, G.; et al. Clinical impact of COVID-19 on patients with cancer (CCC19): A cohort study. Lancet 2020, 395, 1907–1918. [Google Scholar] [CrossRef]
- Grivas, P.; Khaki, A.R.; Wise-Draper, T.M.; French, B.; Hennessy, C.; Hsu, C.Y.; Shyr, Y.; Li, X.; Choueiri, T.K.; Painter, C.A.; et al. Association of clinical factors and recent anticancer therapy with COVID-19 severity among patients with cancer: A report from the COVID-19 and Cancer Consortium. Ann. Oncol. 2021, 32, 787–800. [Google Scholar] [CrossRef]
- Li, F.; Li, Y.-Y.; Liu, M.-J.; Fang, L.-Q.; Dean, N.E.; Wong, G.W.K.; Yang, X.-B.; Longini, I.; Halloran, M.E.; Wang, H.-J.; et al. Household transmission of SARS-CoV-2 and risk factors for susceptibility and infectivity in Wuhan: A retrospective observational study. Lancet Infect. Dis. 2021, 21, 617–628. [Google Scholar] [CrossRef]
- Lee, L.Y.W.; Cazier, J.-B.; Starkey, T.; Briggs, S.E.W.; Arnold, R.; Bisht, V.; Booth, S.; Campton, N.A.; Cheng, V.W.T.; Collins, G.; et al. COVID-19 prevalence and mortality in patients with cancer and the effect of primary tumour subtype and patient demographics: A prospective cohort study. Lancet Oncol. 2020, 21, 1309–1316. [Google Scholar] [CrossRef] [PubMed]
- Rugge, M.; Zorzi, M.; Guzzinati, S. SARS-CoV-2 infection in the Italian Veneto region: Adverse outcomes in patients with cancer. Nat. Cancer 2020, 1, 784–788. [Google Scholar] [CrossRef] [PubMed]
- Lal, A.; Erondu, N.A.; Heymann, D.L.; Gitahi, G.; Yates, R. Fragmented health systems in COVID-19: Rectifying the misalignment between global health security and universal health coverage. Lancet 2021, 397, 61–67. [Google Scholar] [CrossRef]
- Haldane, V.; De Foo, C.; Abdalla, S.M.; Jung, A.-S.; Tan, M.; Wu, S.; Chua, A.; Verma, M.; Shrestha, P.; Singh, S.; et al. Health systems resilience in managing the COVID-19 pandemic: Lessons from 28 countries. Nat. Med. 2021, 27, 964–980. [Google Scholar] [CrossRef] [PubMed]
- Wang, X.; Yang, G.; Wang, Q.; Zhao, Y.; Ding, K.; Ji, C.; Shi, Z.; Li, H.; Li, Y.; Li, S. C1R, CCL2, and TNFRSF1A Genes in Coronavirus Disease-COVID-19 Pathway Serve as Novel Molecular Biomarkers of GBM Prognosis and Immune Infiltration. Dis. Markers 2022, 2022, 8602068. [Google Scholar] [CrossRef]
- Chen, A.; Zhao, W.; Li, X.; Sun, G.; Ma, Z.; Peng, L.; Shi, Z.; Li, X.; Yan, J. Comprehensive Oncogenic Features of Coronavirus Receptors in Glioblastoma Multiforme. Front. Immunol. 2022, 13, 840785. [Google Scholar] [CrossRef]
- Tanzhu, G.; Li, N.; Li, Z.; Zhou, R.; Shen, L. Molecular Subtypes and Prognostic Signature of Pyroptosis-Related lncRNAs in Glioma Patients. Front. Oncol. 2022, 12, 779168. [Google Scholar] [CrossRef]
- Zhang, Q.; Guan, G.; Cheng, P.; Cheng, W.; Yang, L.; Wu, A. Characterization of an endoplasmic reticulum stress-related signature to evaluate immune featuRes. and predict prognosis in glioma. J. Cell Mol. Med. 2021, 25, 3870–3884. [Google Scholar] [CrossRef]
- Zheng, J.; Zhou, Z.; Qiu, Y.; Wang, M.; Yu, H.; Wu, Z.; Wang, X.; Jiang, X. A Prognostic Ferroptosis-Related lncRNAs Signature Associated with Immune Landscape and Radiotherapy Response in Glioma. Front. Cell Dev. Biol. 2021, 9, 675555. [Google Scholar] [CrossRef]
- Zhang, Y.; Zhang, C.; Yang, Y.; Wang, G.; Wang, Z.; Liu, J.; Zhang, L.; Yu, Y. Pyroptosis-Related Gene Signature Predicts Prognosis and Indicates Immune Microenvironment Infiltration in Glioma. Front. Cell Dev. Biol. 2022, 10, 862493. [Google Scholar] [CrossRef]
- Yoshihara, K.; Shahmoradgoli, M.; Martínez, E.; Vegesna, R.; Kim, H.; Torres-Garcia, W.; Treviño, V.; Shen, H.; Laird, P.W.; Levine, D.A.; et al. Inferring tumour purity and stromal and immune cell admixture from expression data. Nat. Commun. 2013, 4, 2612. [Google Scholar] [CrossRef] [PubMed] [Green Version]
- Binnewies, M.; Roberts, E.W.; Kersten, K.; Chan, V.; Fearon, D.F.; Merad, M.; Coussens, L.M.; Gabrilovich, D.I.; Ostrand-Rosenberg, S.; Hedrick, C.C.; et al. Understanding the tumor immune microenvironment (TIME) for effective therapy. Nat. Med. 2018, 24, 541–550. [Google Scholar] [CrossRef] [PubMed]
- Patel, S.A.; Minn, A.J. Combination Cancer Therapy with Immune Checkpoint Blockade: Mechanisms and Strategies. Immunity 2018, 48, 417–433. [Google Scholar] [CrossRef] [PubMed] [Green Version]
- Salmaninejad, A.; Valilou, S.F.; Shabgah, A.G.; Aslani, S.; Alimardani, M.; Pasdar, A.; Sahebkar, A. PD-1/PD-L1 pathway: Basic biology and role in cancer immunotherapy. J. Cell Physiol. 2019, 234, 16824–16837. [Google Scholar] [CrossRef]
- Urbán, N.; Blomfield, I.M.; Guillemot, F. Quiescence of Adult Mammalian Neural Stem Cells: A Highly Regulated Rest. Neuron 2019, 104, 834–848. [Google Scholar] [CrossRef]
- Fischer, I.; Dulin, J.N.; Lane, M.A. Transplanting neural progenitor cells to restore connectivity after spinal cord injury. Nat. Rev. Neurosci. 2020, 21, 366–383. [Google Scholar] [CrossRef]
- Wu, B.; Wang, W.; Wang, H.; Zou, Q.; Hu, B.; Ye, L.; Hu, Y.; Xie, Y.; Huang, N.; Lan, Q.; et al. Single-Cell Sequencing of Glioblastoma Reveals Central Nervous System Susceptibility to SARS-CoV-2. Front. Oncol. 2020, 10, 566599. [Google Scholar] [CrossRef]
- Dong, Q.; Li, Q.; Duan, L.; Wang, H.; Yan, Y.; Yin, H.; Niu, L.; Zhang, H.; Wang, B.; Yuan, G.; et al. Expressions and significances of CTSL, the target of COVID-19 on GBM. J. Cancer Res. Clin. Oncol. 2022, 148, 599–608. [Google Scholar] [CrossRef]
- Bielarz, V.; Willemart, K.; Avalosse, N.; De Swert, K.; Lotfi, R.; Lejeune, N.; Poulain, F.; Ninanne, N.; Gilloteaux, J.; Gillet, N.; et al. Susceptibility of neuroblastoma and glioblastoma cell lines to SARS-CoV-2 infection. Brain Res. 2021, 1758, 147344. [Google Scholar] [CrossRef]
- Khan, I.; Hatiboglu, M.A. Can COVID-19 induce glioma tumorogenesis through binding cell receptors? Med. Hypothes. 2020, 144, 110009. [Google Scholar] [CrossRef]
- Küspert, M.; Murakawa, Y.; Schäffler, K.; Vanselow, J.T.; Wolf, E.; Juranek, S.; Schlosser, A.; Landthaler, M.; Fischer, U. LARP4B is an AU-rich sequence associated factor that promotes mRNA accumulation and translation. RNA 2015, 21, 1294–1305. [Google Scholar] [CrossRef] [PubMed] [Green Version]
- Koso, H.; Yi, H.; Sheridan, P.; Miyano, S.; Ino, Y.; Todo, T.; Watanabe, S. Identification of RNA-Binding Protein LARP4B as a Tumor Suppressor in Glioma. Cancer Res. 2016, 76, 2254–2264. [Google Scholar] [CrossRef] [PubMed] [Green Version]
- Chen, Z.; Wu, H.; Yang, H.; Fan, Y.; Zhao, S.; Zhang, M. Identification and validation of RNA-binding protein-related gene signature revealed potential associations with immunosuppression and drug sensitivity in glioma. Cancer Med. 2021, 10, 7418–7439. [Google Scholar] [CrossRef] [PubMed]
- Jin, Y.; Wang, Z.; Xiang, K.; Zhu, Y.; Cheng, Y.; Cao, K.; Jiang, J. Comprehensive development and validation of gene signature for predicting survival in patients with glioblastoma. Front. Genet. 2022, 13, 900911. [Google Scholar] [CrossRef] [PubMed]
- Sun, X.; Liu, Y.; Huang, Z.; Xu, W.; Hu, W.; Yi, L.; Liu, Z.; Chan, H.; Zeng, J.; Liu, X.; et al. SARS-CoV-2 non-structural protein 6 triggers NLRP3-dependent pyroptosis by targeting ATP6AP1. Cell Death Differ. 2022, 29, 1240–1254. [Google Scholar] [CrossRef] [PubMed]
- Tvina, A.; Thomsen, A.; Palatnik, A. Prenatal and postnatal phenotype of a pathologic variant in the ATP6AP1 gene. Eur. J. Med. Genet. 2020, 63, 103881. [Google Scholar] [CrossRef]
- Jansen, E.J.R.; Timal, S.; Ryan, M.; Ashikov, A.; van Scherpenzeel, M.; Graham, L.A.; Mandel, H.; Hoischen, A.; Iancu, T.C.; Raymond, K.; et al. ATP6AP1 deficiency causes an immunodeficiency with hepatopathy, cognitive impairment and abnormal protein glycosylation. Nat. Commun. 2016, 7, 11600. [Google Scholar] [CrossRef]
- Dimitrov, B.; Himmelreich, N.; Hipgrave Ederveen, A.L.; Lüchtenborg, C.; Okun, J.G.; Breuer, M.; Hutter, A.-M.; Carl, M.; Guglielmi, L.; Hellwig, A.; et al. Cutis laxa, exocrine pancreatic insufficiency and altered cellular metabolomics as additional symptoms in a new patient with ATP6AP1-CDG. Mol. Genet. Metab. 2018, 123, 364–374. [Google Scholar] [CrossRef]
- Qi, C.; Lei, L.; Hu, J.; Wang, G.; Liu, J.; Ou, S. Identification of a five-gene signature deriving from the vacuolar ATPase (V-ATPase) sub-classifies gliomas and decides prognoses and immune microenvironment alterations. Cell Cycle 2022, 21, 1294–1315. [Google Scholar] [CrossRef]
- Panda, S.; Setia, M.; Kaur, N.; Shepal, V.; Arora, V.; Singh, D.K.; Mondal, A.; Teli, A.; Tathode, M.; Gajula, R.; et al. Noncoding RNA Ginir functions as an oncogene by associating with centrosomal proteins. PLoS Biol. 2018, 16, e2004204. [Google Scholar] [CrossRef]
- Brea-Fernández, A.J.; Cabanas, P.; Dacruz-Álvarez, D.; Caamaño, P.; Limeres, J.; Loidi, L. Expanding the clinical and molecular spectrum of the CWC27-related spliceosomopathy. J. Hum. Genet. 2019, 64, 1133–1136. [Google Scholar] [CrossRef] [PubMed]
- Wang, M.; Li, Z.; Chu, H.; Lv, Q.; Ye, D.; Ding, Q.; Xu, C.; Guo, J.; Du, M.; Chen, J.; et al. Genome-Wide Association Study of Bladder Cancer in a Chinese Cohort Reveals a New Susceptibility Locus at 5q12.3. Cancer Res. 2016, 76, 3277–3284. [Google Scholar] [CrossRef] [PubMed] [Green Version]
- Joachim, J.; Tooze, S.A. GABARAP activates ULK1 and traffics from the centrosome dependent on Golgi partners WAC and GOLGA2/GM130. Autophagy 2016, 12, 892–893. [Google Scholar] [CrossRef] [PubMed] [Green Version]
- Kotecha, U.; Mistri, M.; Shah, N.; Shah, P.S.; Gupta, V.A. Bi-allelic loss of function variants in GOLGA2 are associated with a complex neurological phenotype: Report of a second family. Clin. Genet. 2021, 100, 748–751. [Google Scholar] [CrossRef] [PubMed]
- Song, K.; Gras, C.; Capin, G.; Gimber, N.; Lehmann, M.; Mohd, S.; Puchkov, D.; Rödiger, M.; Wilhelmi, I.; Daumke, O.; et al. A SEPT1-based scaffold is required for Golgi integrity and function. J. Cell Sci. 2019, 132, jcs225557. [Google Scholar] [CrossRef] [PubMed] [Green Version]
- Chang, S.-H.; Hong, S.-H.; Jiang, H.-L.; Minai-Tehrani, A.; Yu, K.-N.; Lee, J.-H.; Kim, J.-E.; Shin, J.-Y.; Kang, B.; Park, S.; et al. GOLGA2/GM130, cis-Golgi matrix protein, is a novel target of anticancer gene therapy. Mol. Ther. 2012, 20, 2052–2063. [Google Scholar] [CrossRef] [Green Version]
- Zhao, J.; Yang, C.; Guo, S.; Wu, Y. GM130 regulates epithelial-to-mesenchymal transition and invasion of gastric cancer cells via snail. Int. J. Clin. Exp. Pathol. 2015, 8, 10784–10791. [Google Scholar]
- Awazawa, M.; Futami, T.; Sakada, M.; Kaneko, K.; Ohsugi, M.; Nakaya, K.; Terai, A.; Suzuki, R.; Koike, M.; Uchiyama, Y.; et al. Deregulation of pancreas-specific oxidoreductin ERO1β in the pathogenesis of diabetes mellitus. Mol. Cell Biol. 2014, 34, 1290–1299. [Google Scholar] [CrossRef] [Green Version]
- Dias-Gunasekara, S.; Gubbens, J.; van Lith, M.; Dunne, C.; Williams, J.A.G.; Kataky, R.; Scoones, D.; Lapthorn, A.; Bulleid, N.J.; Benham, A.M. Tissue-specific expression and dimerization of the endoplasmic reticulum oxidoreductase Ero1beta. J. Biol. Chem. 2005, 280, 33066–33075. [Google Scholar] [CrossRef] [Green Version]
- Asada, K.; Kobayashi, K.; Joutard, S.; Tubaki, M.; Takahashi, S.; Takasawa, K.; Komatsu, M.; Kaneko, S.; Sese, J.; Hamamoto, R. Uncovering Prognosis-Related Genes and Pathways by Multi-Omics Analysis in Lung Cancer. Biomolecules 2020, 10, 524. [Google Scholar] [CrossRef] [Green Version]
- Dai, J.; Reyimu, A.; Sun, A.; Duoji, Z.; Zhou, W.; Liang, S.; Hu, S.; Dai, W.; Xu, X. Establishment of prognostic risk model and drug sensitivity based on prognostic related genes of esophageal cancer. Sci. Rep. 2022, 12, 8008. [Google Scholar] [CrossRef] [PubMed]
- Björk, S.; Hurt, C.M.; Ho, V.K.; Angelotti, T. REEPs are membrane shaping adapter proteins that modulate specific g protein-coupled receptor trafficking by affecting ER cargo capacity. PLoS ONE 2013, 8, e76366. [Google Scholar] [CrossRef] [PubMed]


Publisher’s Note: MDPI stays neutral with regard to jurisdictional claims in published maps and institutional affiliations. |
© 2022 by the authors. Licensee MDPI, Basel, Switzerland. This article is an open access article distributed under the terms and conditions of the Creative Commons Attribution (CC BY) license (https://creativecommons.org/licenses/by/4.0/).
Share and Cite
Jiang, F.; Lu, D.-F.; Zhan, Z.; Yuan, G.-Q.; Liu, G.-J.; Gu, J.-Y.; Sun, X.-O.; Wang, Z. SARS-CoV-2 Pattern Provides a New Scoring System and Predicts the Prognosis and Immune Therapeutic Response in Glioma. Cells 2022, 11, 3997. https://doi.org/10.3390/cells11243997
Jiang F, Lu D-F, Zhan Z, Yuan G-Q, Liu G-J, Gu J-Y, Sun X-O, Wang Z. SARS-CoV-2 Pattern Provides a New Scoring System and Predicts the Prognosis and Immune Therapeutic Response in Glioma. Cells. 2022; 11(24):3997. https://doi.org/10.3390/cells11243997
Chicago/Turabian StyleJiang, Fan, Deng-Feng Lu, Zheng Zhan, Gui-Qiang Yuan, Guang-Jie Liu, Jing-Yu Gu, Xiao-Ou Sun, and Zhong Wang. 2022. "SARS-CoV-2 Pattern Provides a New Scoring System and Predicts the Prognosis and Immune Therapeutic Response in Glioma" Cells 11, no. 24: 3997. https://doi.org/10.3390/cells11243997