
Independent Responses of Photosynthesis and Plant Morphology to Alterations of PIF Proteins and Light-Dependent MicroRNA Contents in Arabidopsis thaliana pif Mutants Grown under Lights of Different Spectral Compositions
 , , ,
, , , 
Abstract
:1. Introduction
2. Materials and Methods
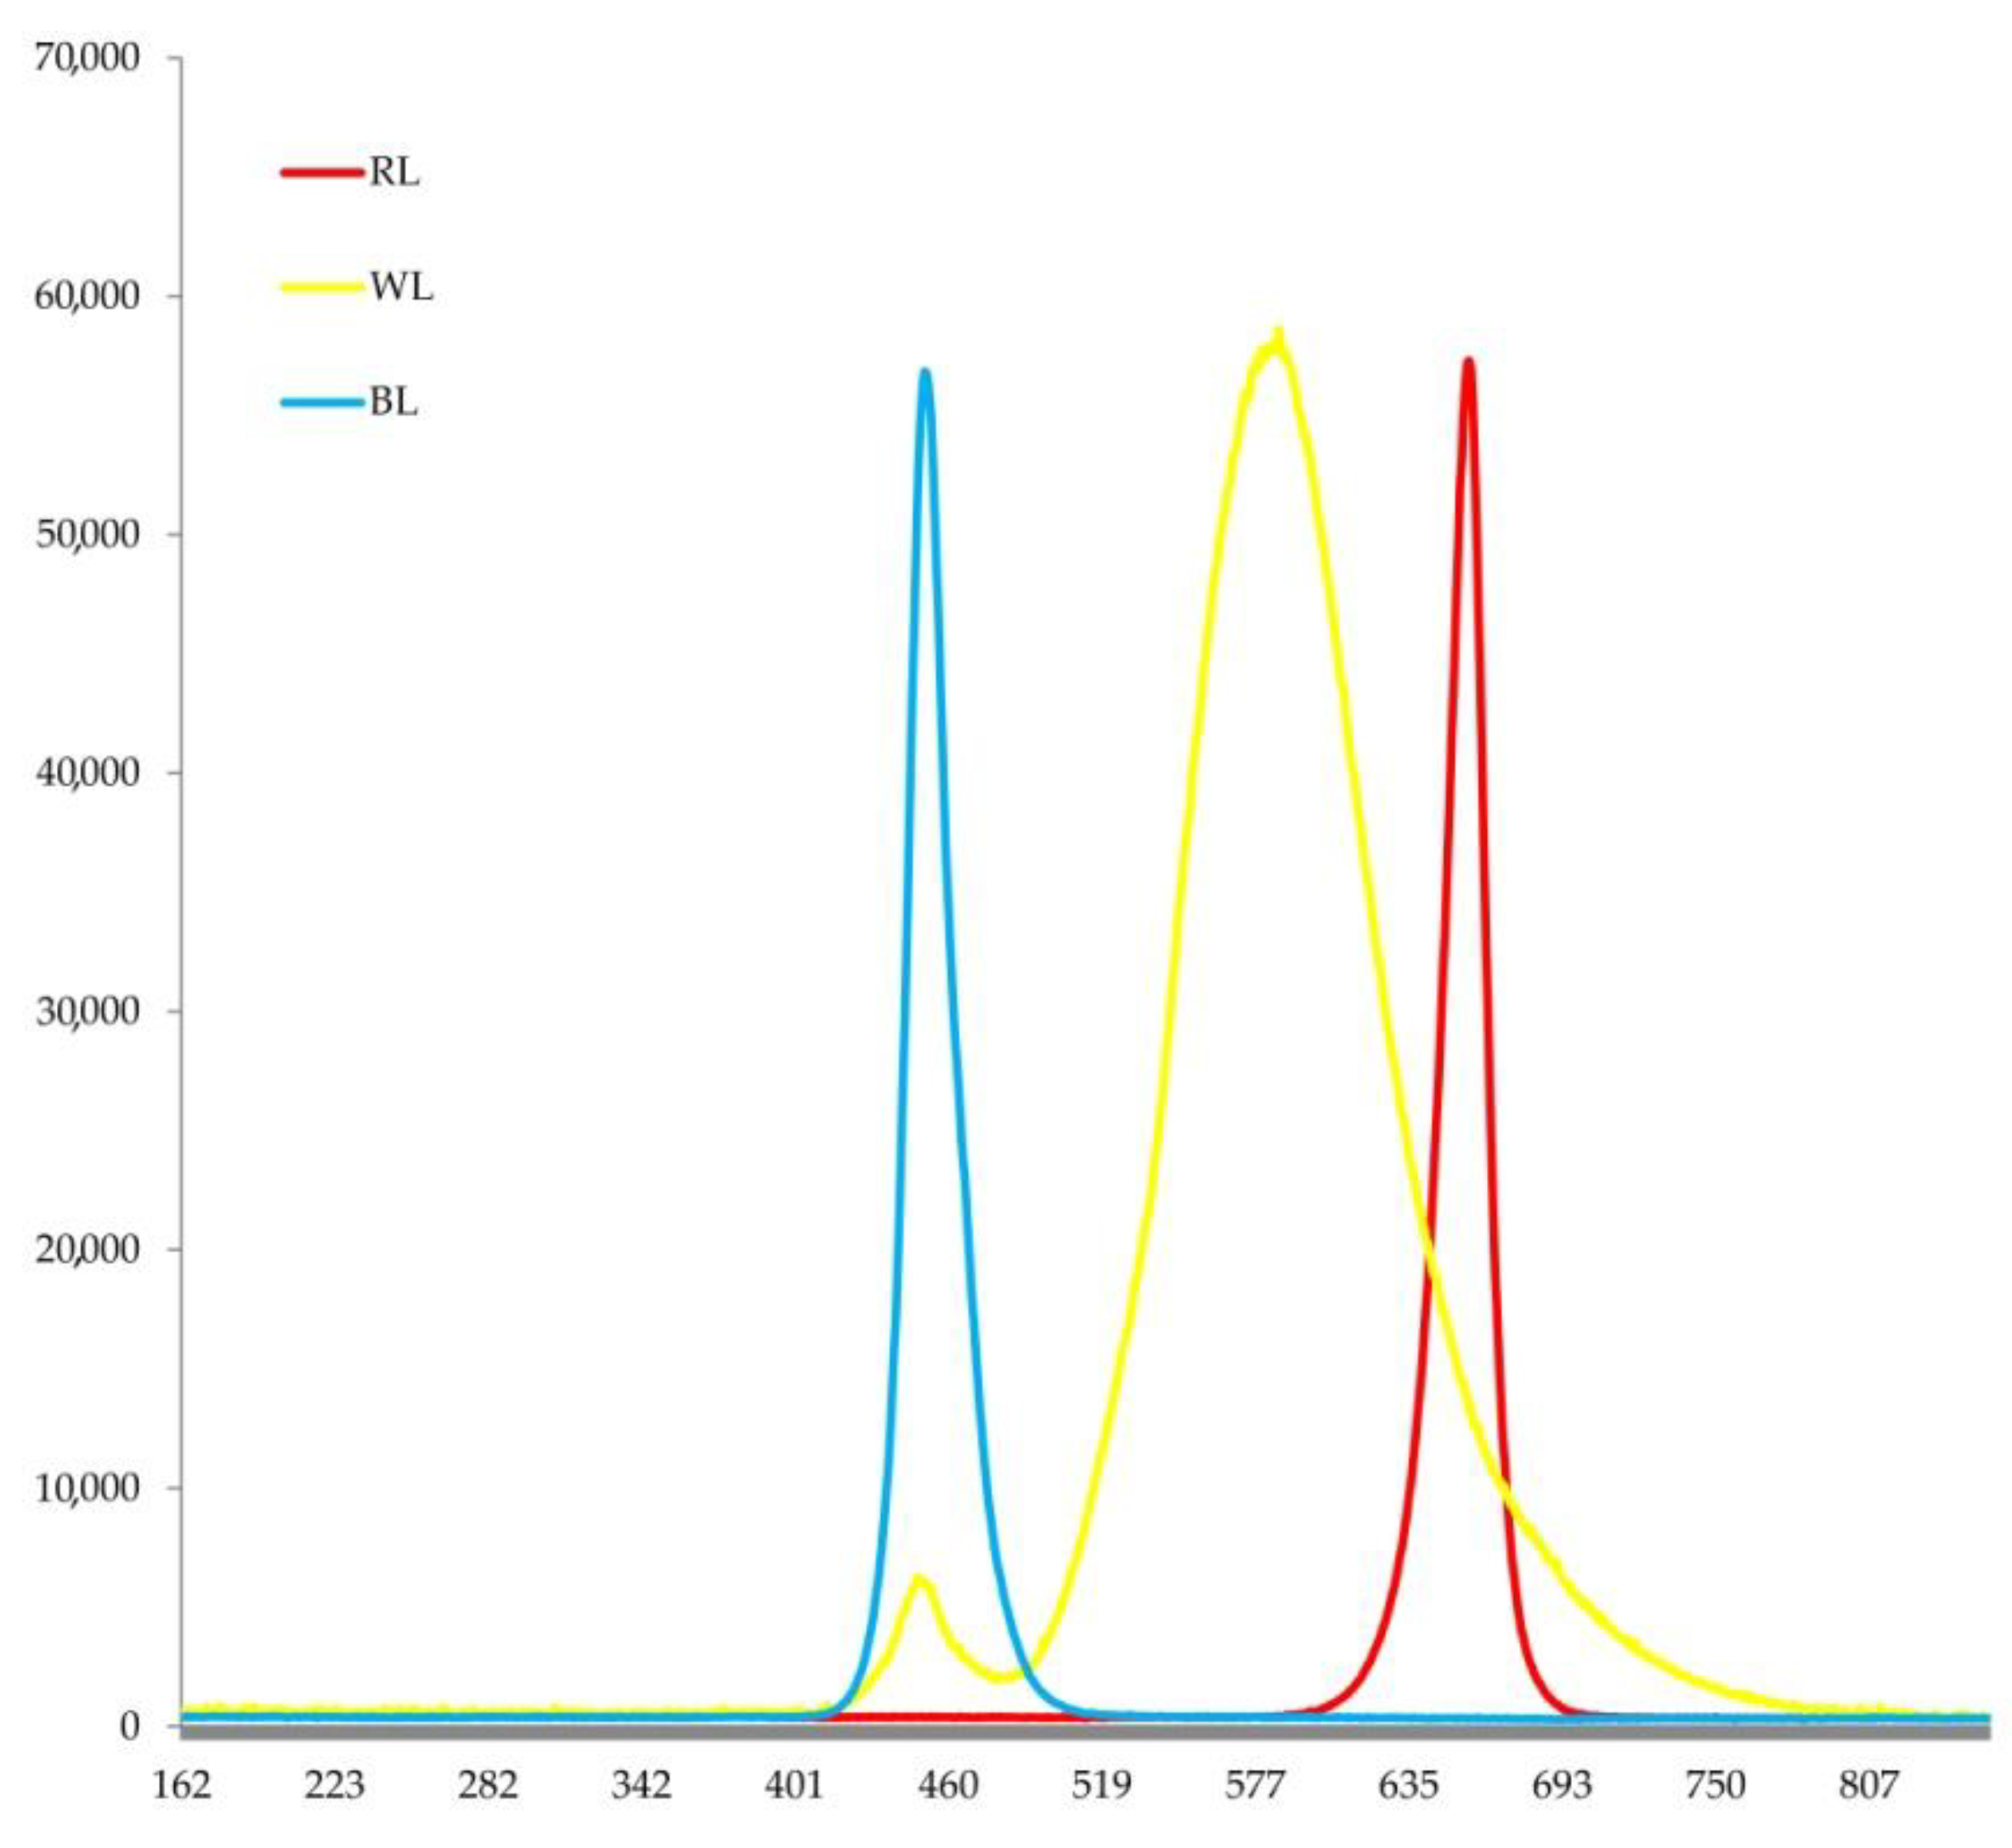
2.1. Plant Materials and Experimental Design
2.2. Measurements of CO2 Gas Exchange
2.3. Determination of Photochemical Activity
2.4. RNA and MicroRNA Extraction and qRT-PCR
2.5. Protein Extraction and Western Blotting
2.6. Statistics
3. Results
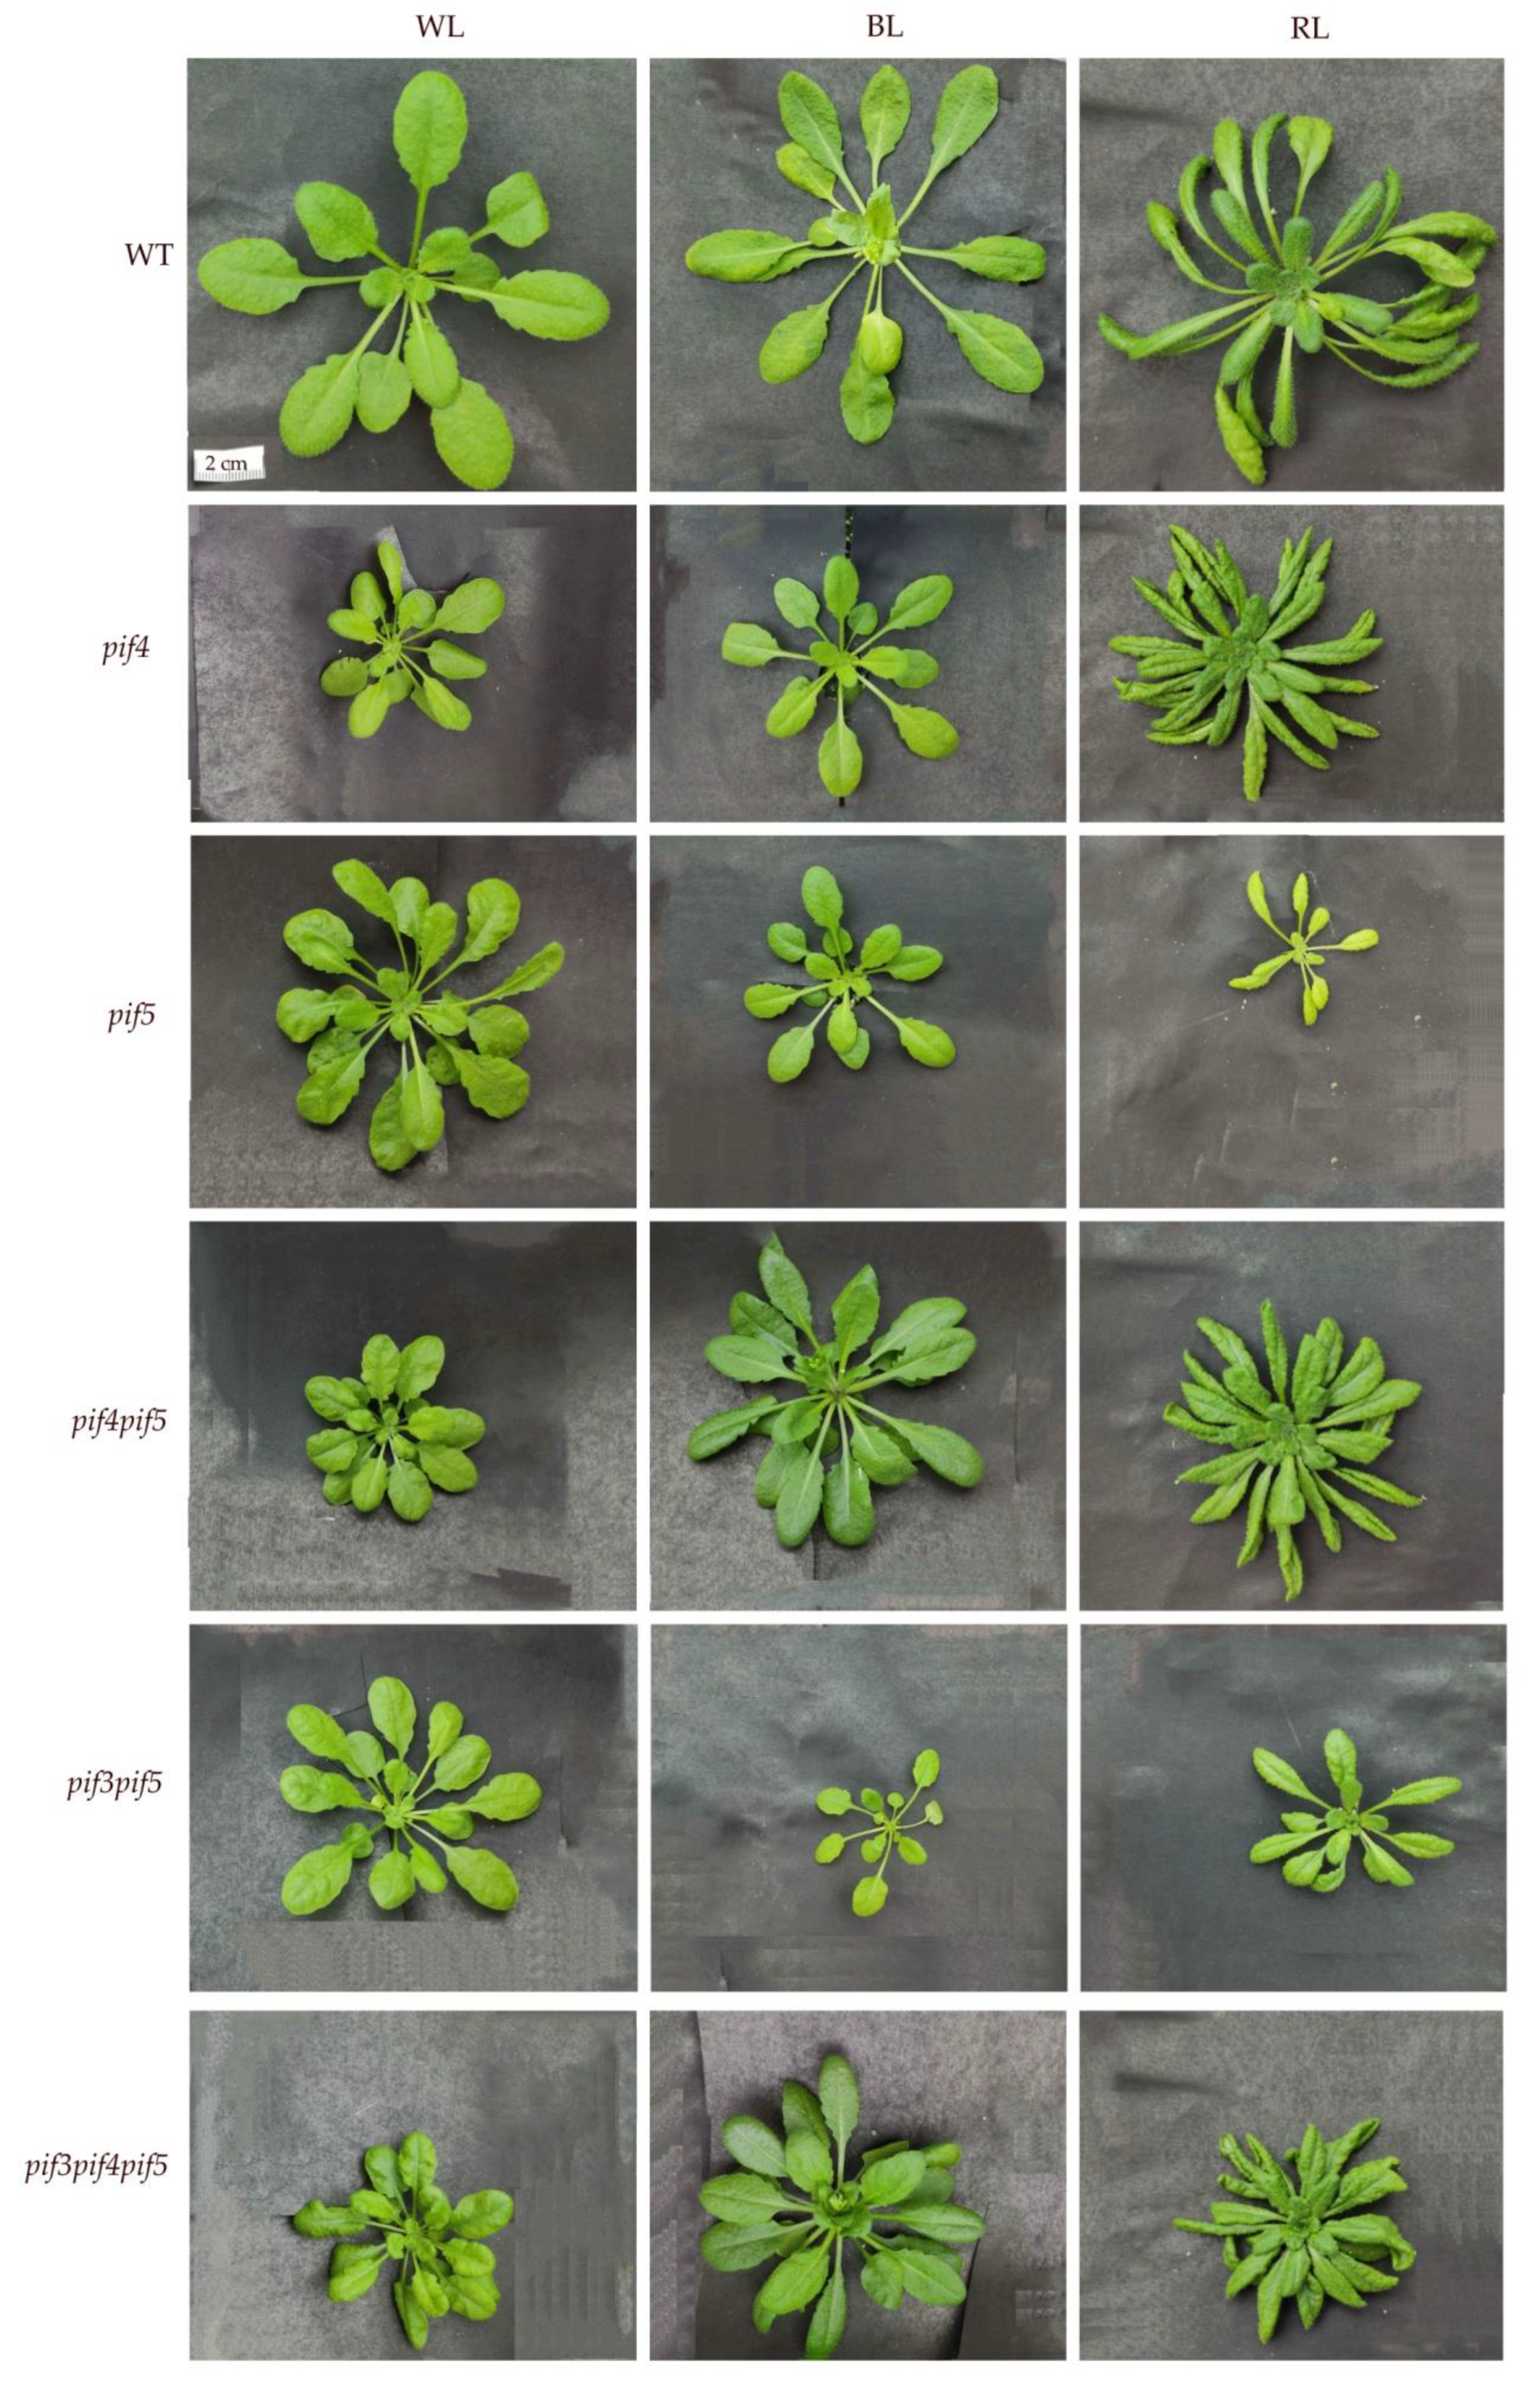
3.1. Morphology
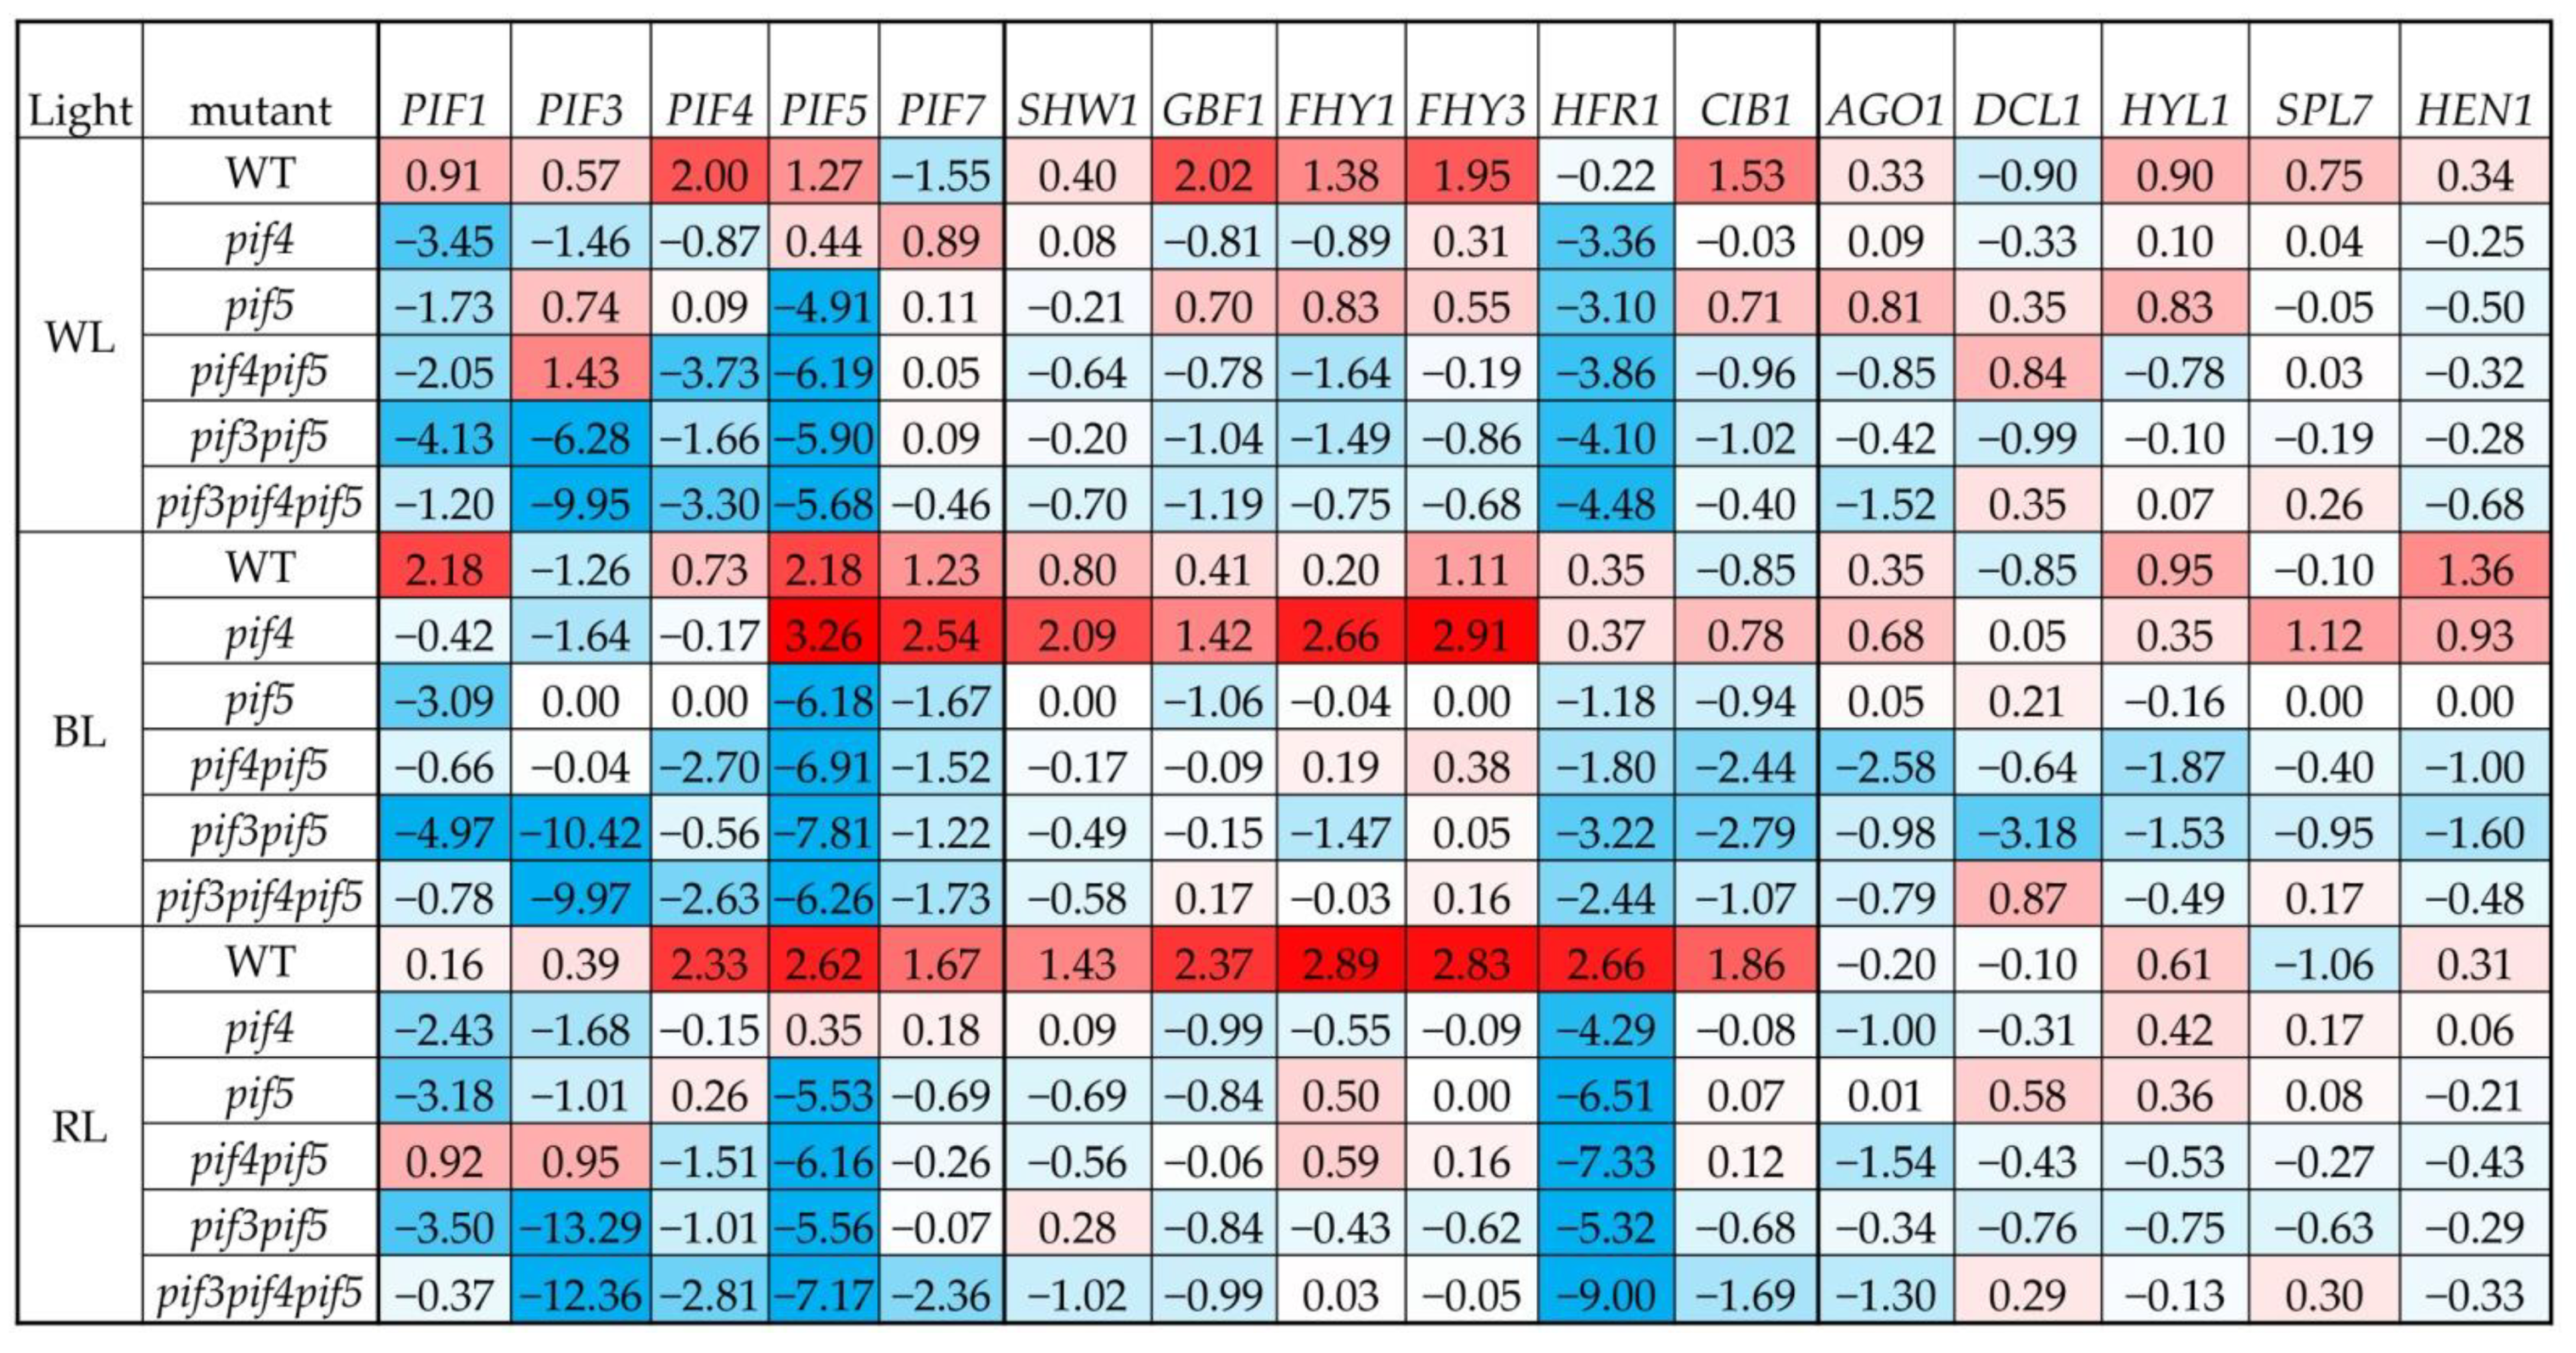
3.2. Gene Expression
3.2.1. PIF Gene Expression
3.2.2. Light Signalling TFs Expression
3.2.3. MicroRNA Processing Gene Expression
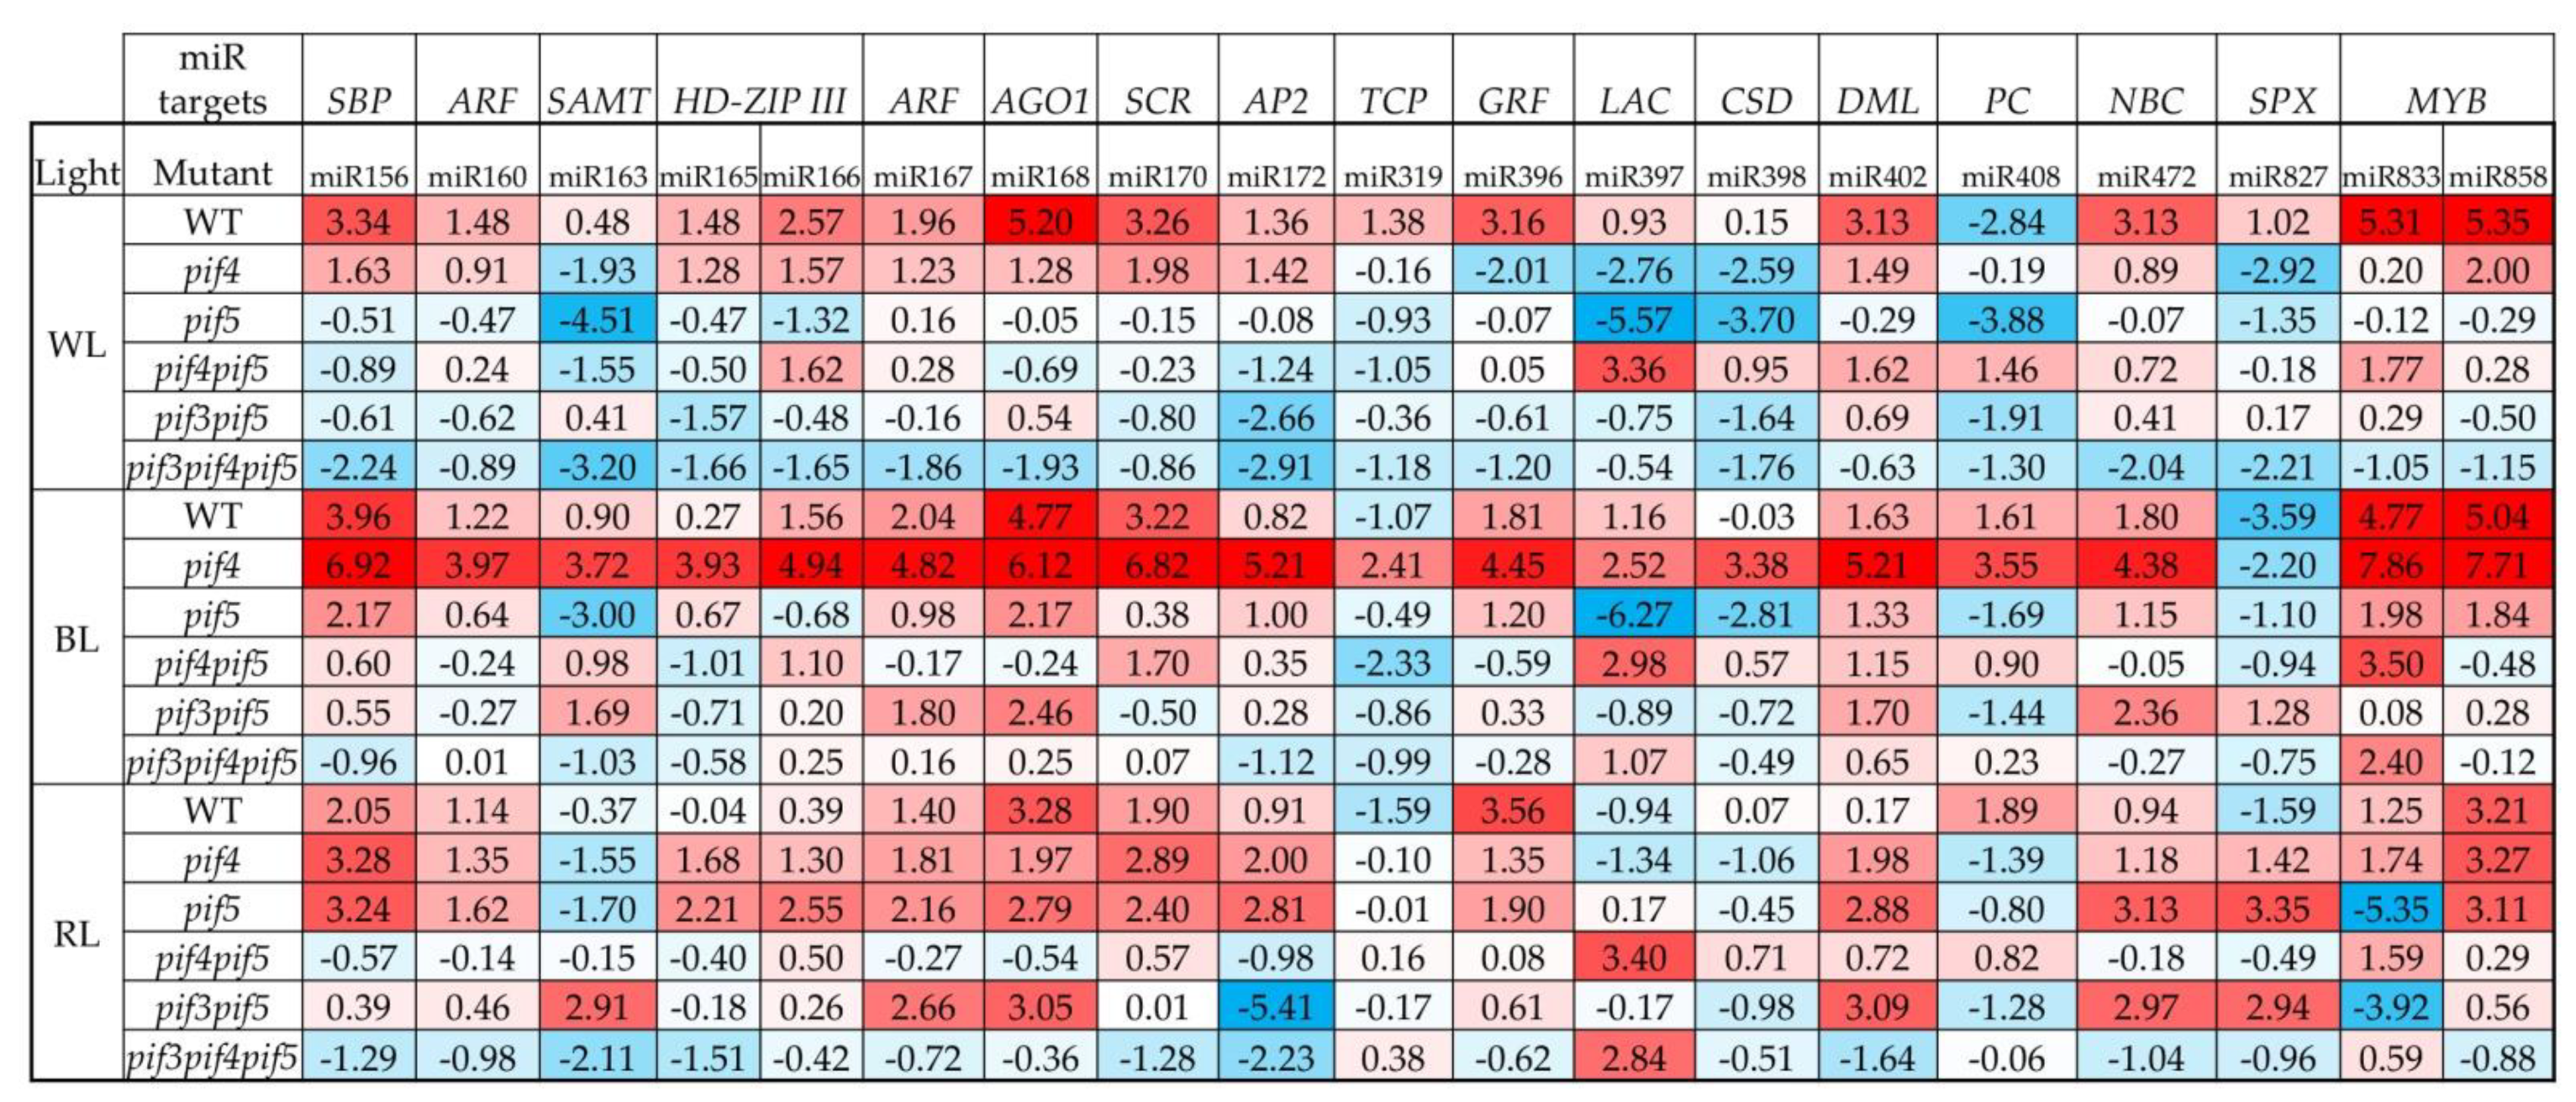
3.3. miRNA Expression
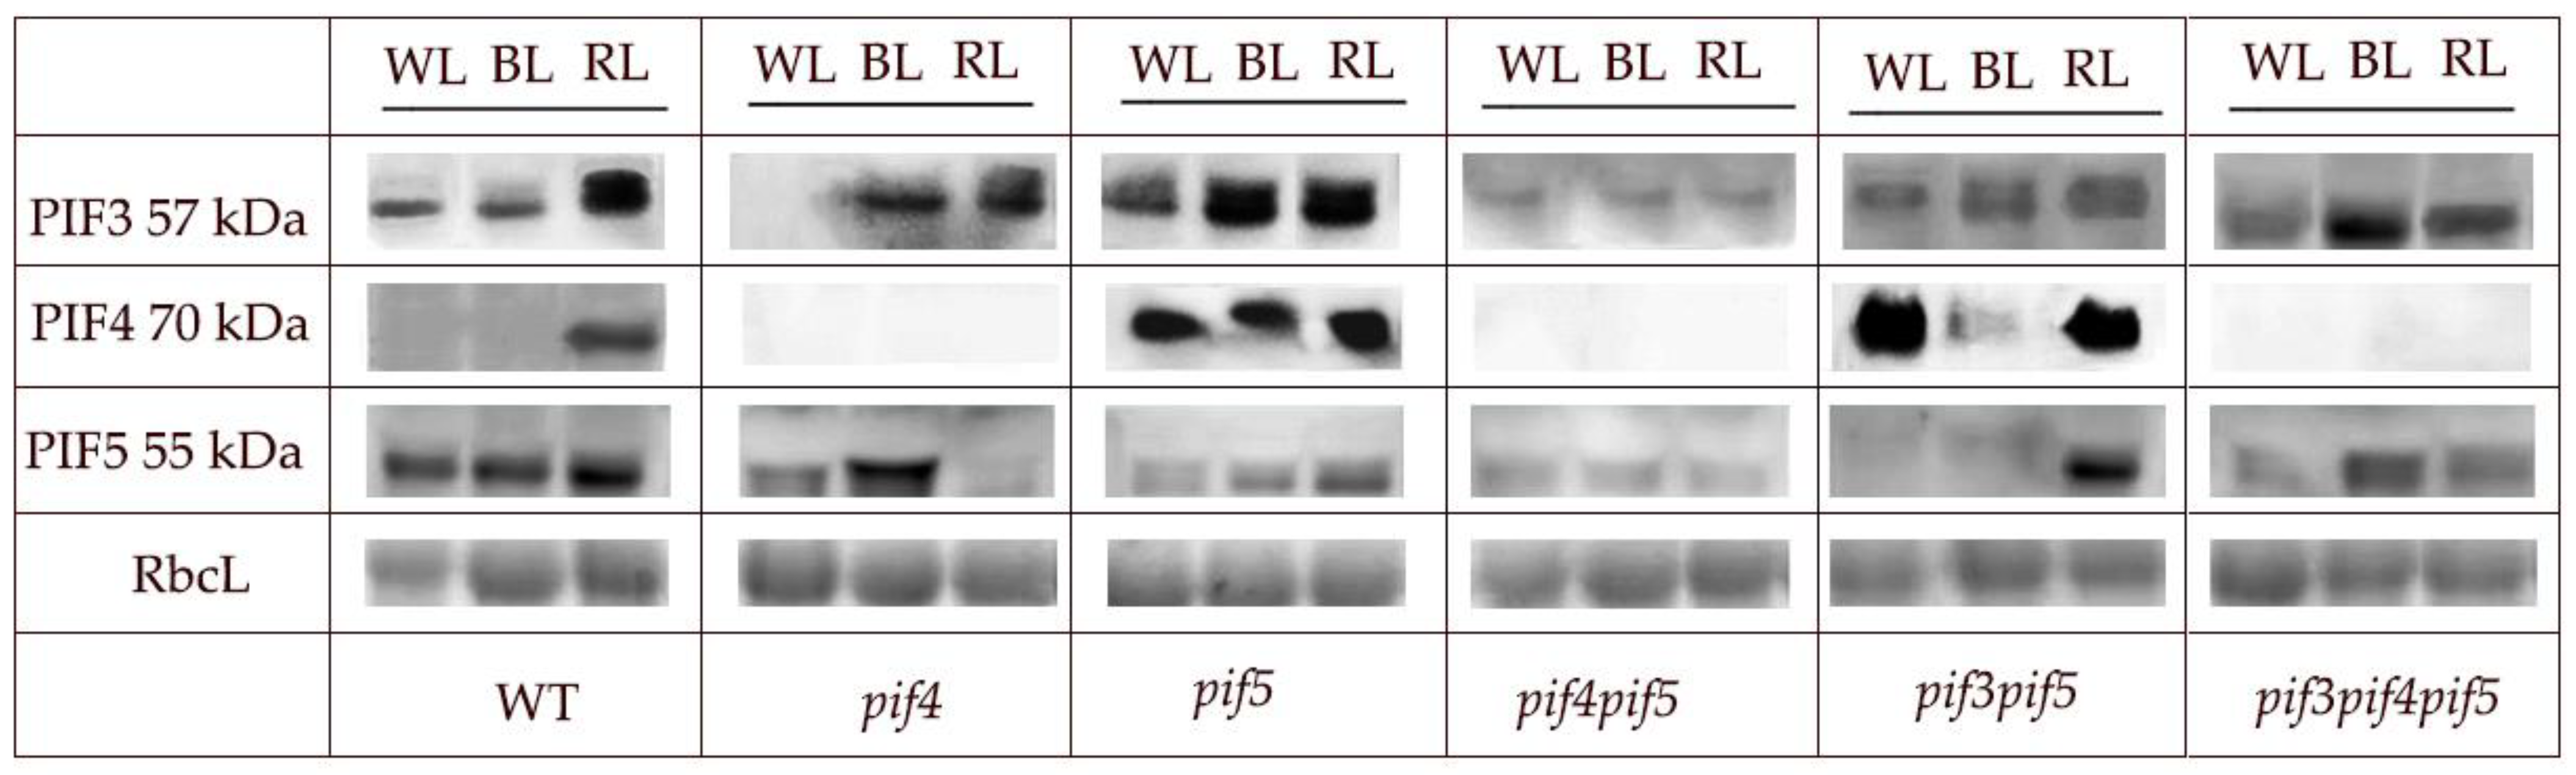
3.4. Western Blot of the Proteins PIF3, PIF4, and PIF5
3.5. Chlorophyll Fluorescence, Photosynthetic Rate, and Leaf Area
4. Discussion
4.1. Photosynthesis and Morphology
4.2. Main Differences in MicroRNA and TFs Expression
4.3. MicroRNA Processing Genes
5. Conclusions
Supplementary Materials
Author Contributions
Funding
Institutional Review Board Statement
Informed Consent Statement
Data Availability Statement
Conflicts of Interest
References
- Lin, M.-C.; Tsai, H.-L.; Lim, S.-L.; Jeng, S.-T.; Wu, S.-H. Unraveling Multifaceted Contributions of Small Regulatory RNAs to Photomorphogenic Development in Arabidopsis. BMC Genom. 2017, 18, 559. [Google Scholar] [CrossRef] [PubMed] [Green Version]
- Sánchez-Retuerta, C.; Suaréz-López, P.; Henriques, R. Under a New Light: Regulation of Light-Dependent Pathways by Non-Coding RNAs. Front. Plant Sci. 2018, 9, 962. [Google Scholar] [CrossRef] [PubMed] [Green Version]
- Pashkovskiy, P.; Kreslavski, V.; Khudyakova, A.; Kosobryukhov, A.; Kuznetsov, V.V.; Allakhverdiev, S. Influence of Phytochromes on MicroRNA Expression, Phenotype, and Photosynthetic Activity in A. thaliana Phy Mutants under Light with Different Spectral Composition. Photosynthetica 2022, 61, 1–10. [Google Scholar] [CrossRef]
- Sun, Z.; Li, M.; Zhou, Y.; Guo, T.; Liu, Y.; Zhang, H.; Fang, Y. Coordinated Regulation of Arabidopsis MicroRNA Biogenesis and Red Light Signaling through Dicer-like 1 and Phytochrome-Interacting Factor 4. PLoS Genet. 2018, 14, e1007247. [Google Scholar] [CrossRef] [PubMed] [Green Version]
- Huq, E.; Quail, P.H. PIF4, a Phytochrome-Interacting BHLH Factor, Functions as a Negative Regulator of Phytochrome B Signaling in Arabidopsis. EMBO J. 2002, 21, 2441–2450. [Google Scholar] [CrossRef] [Green Version]
- Jang, I.-C.; Henriques, R.; Seo, H.S.; Nagatani, A.; Chua, N.-H. Arabidopsis PHYTOCHROME INTERACTING FACTOR Proteins Promote Phytochrome B Polyubiquitination by COP1 E3 Ligase in the Nucleus. Plant Cell 2010, 22, 2370–2383. [Google Scholar] [CrossRef] [Green Version]
- Sorin, C.; Bussell, J.D.; Camus, I.; Ljung, K.; Kowalczyk, M.; Geiss, G.; McKhann, H.; Garcion, C.; Vaucheret, H.; Sandberg, G.; et al. Auxin and Light Control of Adventitious Rooting in Arabidopsis Require ARGONAUTE1. Plant Cell 2005, 17, 1343–1359. [Google Scholar] [CrossRef] [Green Version]
- Sun, W.; Xu, X.H.; Wu, X.; Wang, Y.; Lu, X.; Sun, H.; Xie, X. Genome-Wide Identification of MicroRNAs and Their Targets in Wild Type and PhyB Mutant Provides a Key Link between MicroRNAs and the PhyB-Mediated Light Signaling Pathway in Rice. Front. Plant Sci. 2015, 6, 372. [Google Scholar] [CrossRef] [PubMed] [Green Version]
- Sun, J.; Qi, L.; Li, Y.; Zhai, Q.; Li, C. PIF4 and PIF5 Transcription Factors Link Blue Light and Auxin to Regulate the Phototropic Response in Arabidopsis. Plant Cell 2013, 25, 2102–2114. [Google Scholar] [CrossRef] [Green Version]
- Zhou, X.; Wang, G.; Zhang, W. UV-B Responsive MicroRNA Genes in Arabidopsis thaliana. Mol. Syst. Biol. 2007, 3, 103. [Google Scholar] [CrossRef]
- Casati, P. Analysis of UV-B Regulated MiRNAs and Their Targets in Maize Leaves. Plant Signal. Behav. 2013, 8, e26758. [Google Scholar] [CrossRef] [PubMed] [Green Version]
- Casadevall, R.; Rodriguez, R.E.; Debernardi, J.M.; Palatnik, J.F.; Casati, P. Repression of Growth Regulating Factors by the MicroRNA396 Inhibits Cell Proliferation by UV-B Radiation in Arabidopsis Leaves. Plant Cell 2013, 25, 3570–3583. [Google Scholar] [CrossRef] [PubMed] [Green Version]
- Pashkovskiy, P.P.; Kartashov, A.V.; Zlobin, I.E.; Pogosyan, S.I.; Kuznetsov, V.V. Blue Light Alters MiR167 Expression and MicroRNA-Targeted Auxin Response Factor Genes in Arabidopsis thaliana Plants. Plant Physiol. Biochem. 2016, 104, 146–154. [Google Scholar] [CrossRef] [PubMed]
- Cui, L.-G.; Shan, J.-X.; Shi, M.; Gao, J.-P.; Lin, H.-X. The MiR156-SPL 9-DFR Pathway Coordinates the Relationship between Development and Abiotic Stress Tolerance in Plants. Plant J. 2014, 80, 1108–1117. [Google Scholar] [CrossRef]
- Zhou, B.; Fan, P.; Li, Y.; Yan, H.; Xu, Q. Exploring MiRNAs Involved in Blue/UV-A Light Response in Brassica Rapa Reveals Special Regulatory Mode during Seedling Development. BMC Plant Biol. 2016, 16, 111. [Google Scholar] [CrossRef] [Green Version]
- Wu, G.; Park, M.Y.; Conway, S.R.; Wang, J.-W.; Weigel, D.; Poethig, R.S. The Sequential Action of MiR156 and MiR172 Regulates Developmental Timing in Arabidopsis. Cell 2009, 138, 750–759. [Google Scholar] [CrossRef] [Green Version]
- Yant, L.; Mathieu, J.; Dinh, T.T.; Ott, F.; Lanz, C.; Wollmann, H.; Chen, X.; Schmid, M. Orchestration of the Floral Transition and Floral Development in Arabidopsis by the Bifunctional Transcription Factor APETALA2. Plant Cell 2010, 22, 2156–2170. [Google Scholar] [CrossRef] [Green Version]
- Gou, J.-Y.; Felippes, F.F.; Liu, C.-J.; Weigel, D.; Wang, J.-W. Negative Regulation of Anthocyanin Biosynthesis in Arabidopsis by a MiR156-Targeted SPL Transcription Factor. Plant Cell 2011, 23, 1512–1522. [Google Scholar] [CrossRef] [Green Version]
- Ma, D.; Li, X.; Guo, Y.; Chu, J.; Fang, S.; Yan, C.; Noel, J.P.; Liu, H. Cryptochrome 1 Interacts with PIF4 to Regulate High Temperature-Mediated Hypocotyl Elongation in Response to Blue Light. Proc. Natl. Acad. Sci. USA 2016, 113, 224–229. [Google Scholar] [CrossRef] [Green Version]
- Mishra, B.S.; Sharma, M.; Laxmi, A. Role of Sugar and Auxin Crosstalk in Plant Growth and Development. Physiol. Plant. 2022, 174, e13546. [Google Scholar] [CrossRef]
- Goltsev, V.N.; Kalaji, H.M.; Paunov, M.; Bąba, W.; Horaczek, T.; Mojski, J.; Kociel, H.; Allakhverdiev, S.I. Variable Chlorophyll Fluorescence and Its Use for Assessing Physiological Condition of Plant Photosynthetic Apparatus. Russ. J. Plant Physiol. 2016, 63, 869–893. [Google Scholar] [CrossRef]
- Kalaji, H.M.; Schansker, G.; Ladle, R.J.; Goltsev, V.; Bosa, K.; Allakhverdiev, S.I.; Brestic, M.; Bussotti, F.; Calatayud, A.; Dąbrowski, P. Frequently Asked Questions about in Vivo Chlorophyll Fluorescence: Practical Issues. Photosynth. Res. 2014, 122, 121–158. [Google Scholar] [CrossRef] [PubMed] [Green Version]
- Hornitschek, P.; Kohnen, M.V.; Lorrain, S.; Rougemont, J.; Ljung, K.; López-Vidriero, I.; Franco-Zorrilla, J.M.; Solano, R.; Trevisan, M.; Pradervand, S. Phytochrome Interacting Factors 4 and 5 Control Seedling Growth in Changing Light Conditions by Directly Controlling Auxin Signaling. Plant J. 2012, 71, 699–711. [Google Scholar] [CrossRef] [Green Version]
- Leivar, P.; Tepperman, J.M.; Cohn, M.M.; Monte, E.; Al-Sady, B.; Erickson, E.; Quail, P.H. Dynamic Antagonism between Phytochromes and PIF Family Basic Helix-Loop-Helix Factors Induces Selective Reciprocal Responses to Light and Shade in a Rapidly Responsive Transcriptional Network in Arabidopsis. Plant Cell 2012, 24, 1398–1419. [Google Scholar] [CrossRef] [PubMed] [Green Version]
- Leivar, P.; Monte, E. PIFs: Systems Integrators in Plant Development. Plant Cell 2014, 26, 56–78. [Google Scholar] [CrossRef] [PubMed] [Green Version]
- Siré, C.; Moreno, A.B.; Garcia-Chapa, M.; López-Moya, J.J.; San Segundo, B. Diurnal Oscillation in the Accumulation of Arabidopsis MicroRNAs, MiR167, MiR168, MiR171 and MiR398. FEBS Lett. 2009, 583, 1039–1044. [Google Scholar] [CrossRef] [PubMed] [Green Version]
- Leivar, P.; Quail, P.H. PIFs: Pivotal Components in a Cellular Signaling Hub. Trends Plant Sci. 2011, 16, 19–28. [Google Scholar] [CrossRef] [Green Version]
- Xie, Y.; Liu, Y.; Wang, H.; Ma, X.; Wang, B.; Wu, G.; Wang, H. Phytochrome-Interacting Factors Directly Suppress MIR156 Expression to Enhance Shade-Avoidance Syndrome in Arabidopsis. Nat. Commun. 2017, 8, 348. [Google Scholar] [CrossRef] [Green Version]
- Fryer, M.J.; Andrews, J.R.; Oxborough, K.; Blowers, D.A.; Baker, N.R. Relationship between CO2 Assimilation, Photosynthetic Electron Transport, and Active O2 Metabolism in Leaves of Maize in the Field during Periods of Low Temperature. Plant Physiol. 1998, 116, 571–580. [Google Scholar] [CrossRef] [Green Version]
- Ali, S.; Khan, N.; Xie, L. Molecular and Hormonal Regulation of Leaf Morphogenesis in Arabidopsis. Int. J. Mol. Sci. 2020, 21, 5132. [Google Scholar] [CrossRef]
- Yang, T.; Wang, Y.; Teotia, S.; Zhang, Z.; Tang, G. The Making of Leaves: How Small RNA Networks Modulate Leaf Development. Front. Plant Sci. 2018, 9, 824. [Google Scholar] [CrossRef] [PubMed] [Green Version]
- Song, Z.; Zhang, L.; Wang, Y.; Li, H.; Li, S.; Zhao, H.; Zhang, H. Constitutive Expression of MiR408 Improves Biomass and Seed Yield in Arabidopsis. Front. Plant Sci. 2018, 8, 2114. [Google Scholar] [CrossRef] [Green Version]
- Ma, C.; Chen, Q.; Wang, S.; Lers, A. Downregulation of GeBP-like α Factor by MiR827 Suggests Their Involvement in Senescence and Phosphate Homeostasis. BMC Biol. 2021, 19, 90. [Google Scholar] [CrossRef] [PubMed]
- Cho, S.K.; Chaabane, S.B.; Shah, P.; Poulsen, C.P.; Yang, S.W. COP1 E3 Ligase Protects HYL1 to Retain MicroRNA Biogenesis. Nat. Commun. 2014, 5, 5867. [Google Scholar] [CrossRef] [PubMed] [Green Version]
- Li, Y.; Varala, K.; Hudson, M.E. A Survey of the Small RNA Population during Far-Red Light-Induced Apical Hook Opening. Front. Plant Sci. 2014, 5, 156. [Google Scholar] [CrossRef] [PubMed]


| WL | WT | pif4 | pif5 | pif4pif5 | pif3pif5 | pif3pif4pif5 |
| DI0/RC | 0.53 ± 0.03 b | 0.56 ± 0.02 b | 0.76 ± 0.05 a | 0.59 ± 0.03 b | 0.59 ± 0.02 b | 0.51 ± 0.03 b |
| PIabs | 3.35 ± 0.32 ab | 3.35 ± 0.32 ab | 2.66 ± 0.14 b | 3.09 ± 0.21 ab | 3.23 ± 0.20 ab | 3.91 ± 0.31 a |
| Y(II) | 0.47 ± 0.02 a | 0.42 ± 0.02 ab | 0.40 ± 0.01 b | 0.45 ± 0.01 ab | 0.42 ± 0.03 ab | 0.43 ± 0.01 ab |
| NPQ | 0.69 ± 0.04 c | 0.97 ± 0.02 ab | 0.89 ± 0.03 b | 0.91 ± 0.01 b | 1.05 ± 0.02 a | 0.65 ± 0.02 c |
| Fv/Fm | 0.81 ± 0.03 a | 0.78 ± 0.02 a | 0.79 ± 0.02 a | 0.80 ± 0.01 a | 0.80 ± 0.01 a | 0.81 ± 0.02 a |
| Pmax, µmol CO2 m−2 s−1 | 6.63 ± 0.54 b | 5.73 ± 0.09 b | 10.5 ± 0.24 a | 10.16 ± 1.41 a | 4.36 ± 0.32 c | 10.26 ± 0.75 a |
| Leaf area, cm2 | 35.1 ± 2.3 a | 13.7 ± 2.8 c | 33.7 ± 1.4 a | 17.5 ± 3.2 c | 25.1 ± 1.9 b | 20.5 ± 2.7 bc |
| BL | WT | pif4 | pif5 | pif4pif5 | pif3pif5 | pif3pif4pif5 |
| DI0/RC | 0.44 ± 0.03 a | 0.43 ± 0.01 a | 0.47 ± 0.03 a | 0.43 ± 0.03 a | 0.49 ± 0.03 a | 0.47 ± 0.01 a |
| PIabs | 4.92 ± 0.39 a | 4.97 ± 0.29 a | 4.56 ± 0.43 a | 4.65 ± 0.34 a | 4.71 ± 0.18 a | 5.20 ± 0.30 a |
| Y(II) | 0.48 ± 0.03 a | 0.50 ± 0.01 a | 0.44 ± 0.02 a | 0.49 ± 0.03 a | 0.47 ± 0.01 a | 0.51 ± 0.02 a |
| NPQ | 0.79 ± 0.03 c | 0.85 ± 0.02 bc | 1.13 ± 0.04 a | 0.91 ± 0.03 b | 0.74 ± 0.03 c | 0.84 ± 0.03 bc |
| Fv/Fm | 0.81 ± 0.01 a | 0.81 ± 0.01 a | 0.82 ± 0.01 a | 0.81 ± 0.01 a | 0.81 ± 0.01 a | 0.82 ± 0.01 a |
| Pmax, µmol CO2 m−2 s−1 | 4.36 ± 0.44 c | 4.86 ± 0.20 c | 6.93 ± 0.53 b | 8.13 ± 0.23 a | 8.63 ± 0.20 a | 8.53 ± 0.33 a |
| Leaf area, cm2 | 39.4 ± 3.3 a | 17.7 ± 3.4 b | 14.9 ± 3.8 b | 36.3 ± 2.1 a | 6.3 ± 2.2 c | 37.1 ± 2.8 a |
| RL | WT | pif4 | pif5 | pif4pif5 | pif3pif5 | pif3pif4pif5 |
| DI0/RC | 0.46 ± 0.03 a | 0.46 ± 0.02 a | 0.48 ± 0.03 a | 0.52 ± 0.02 a | 0.51 ± 0.03 a | 0.49 ± 0.03 a |
| PIabs | 3.33 ± 0.37 a | 4.74 ± 0.46 a | 3.63 ± 0.34 a | 4.67 ± 0.38 a | 3.98 ± 0.35 a | 4.23 ± 0.32 a |
| Y(II) | 0.44 ± 0.01 b | 0.41 ± 0.04 b | 0.52 ± 0.01 a | 0.43 ± 0.01 b | 0.44 ± 0.03 ab | 0.45 ± 0.03 ab |
| NPQ | 0.74 ± 0.04 ab | 0.49 ± 0.02 c | 0.47 ± 0.04 c | 0.76 ± 0.02 ab | 0.63 ± 0.03 b | 0.83 ± 0.03 a |
| Fv/Fm | 0.80 ± 0.01 a | 0.81 ± 0.01 a | 0.79 ± 0.01 a | 0.81 ± 0.02 a | 0.8 0 ± 0.02 a | 0.82 ± 0.01 a |
| Pmax µmol CO2 m−2 s−1 | 8.03 ± 0.36 b | 6.6 ± 0.57 d | 9.06 ± 0.67 b | 8.3 ± 1.52 c | 7.73 ± 0.04 c | 12.66 ± 1.03 a |
| Leaf area, cm2 | 37.2 ± 3.8 a | 33.1 ± 3.4 a | 5.1 ± 3.2 d | 30.9 ± 3.8 a | 10.9 ± 2.7 c | 24.5 ± 2.8 b |
Publisher’s Note: MDPI stays neutral with regard to jurisdictional claims in published maps and institutional affiliations. |
© 2022 by the authors. Licensee MDPI, Basel, Switzerland. This article is an open access article distributed under the terms and conditions of the Creative Commons Attribution (CC BY) license (https://creativecommons.org/licenses/by/4.0/).
Share and Cite
Pashkovskiy, P.; Kreslavski, V.; Khudyakova, A.; Pojidaeva, E.S.; Kosobryukhov, A.; Kuznetsov, V.; Allakhverdiev, S.I. Independent Responses of Photosynthesis and Plant Morphology to Alterations of PIF Proteins and Light-Dependent MicroRNA Contents in Arabidopsis thaliana pif Mutants Grown under Lights of Different Spectral Compositions. Cells 2022, 11, 3981. https://doi.org/10.3390/cells11243981
Pashkovskiy P, Kreslavski V, Khudyakova A, Pojidaeva ES, Kosobryukhov A, Kuznetsov V, Allakhverdiev SI. Independent Responses of Photosynthesis and Plant Morphology to Alterations of PIF Proteins and Light-Dependent MicroRNA Contents in Arabidopsis thaliana pif Mutants Grown under Lights of Different Spectral Compositions. Cells. 2022; 11(24):3981. https://doi.org/10.3390/cells11243981
Chicago/Turabian StylePashkovskiy, Pavel, Vladimir Kreslavski, Alexandra Khudyakova, Elena S. Pojidaeva, Anatoliy Kosobryukhov, Vladimir Kuznetsov, and Suleyman I. Allakhverdiev. 2022. "Independent Responses of Photosynthesis and Plant Morphology to Alterations of PIF Proteins and Light-Dependent MicroRNA Contents in Arabidopsis thaliana pif Mutants Grown under Lights of Different Spectral Compositions" Cells 11, no. 24: 3981. https://doi.org/10.3390/cells11243981