
Hydroxysafflor Yellow A Exerts Neuroprotective Effects via HIF-1α/BNIP3 Pathway to Activate Neuronal Autophagy after OGD/R
 , , , , , and
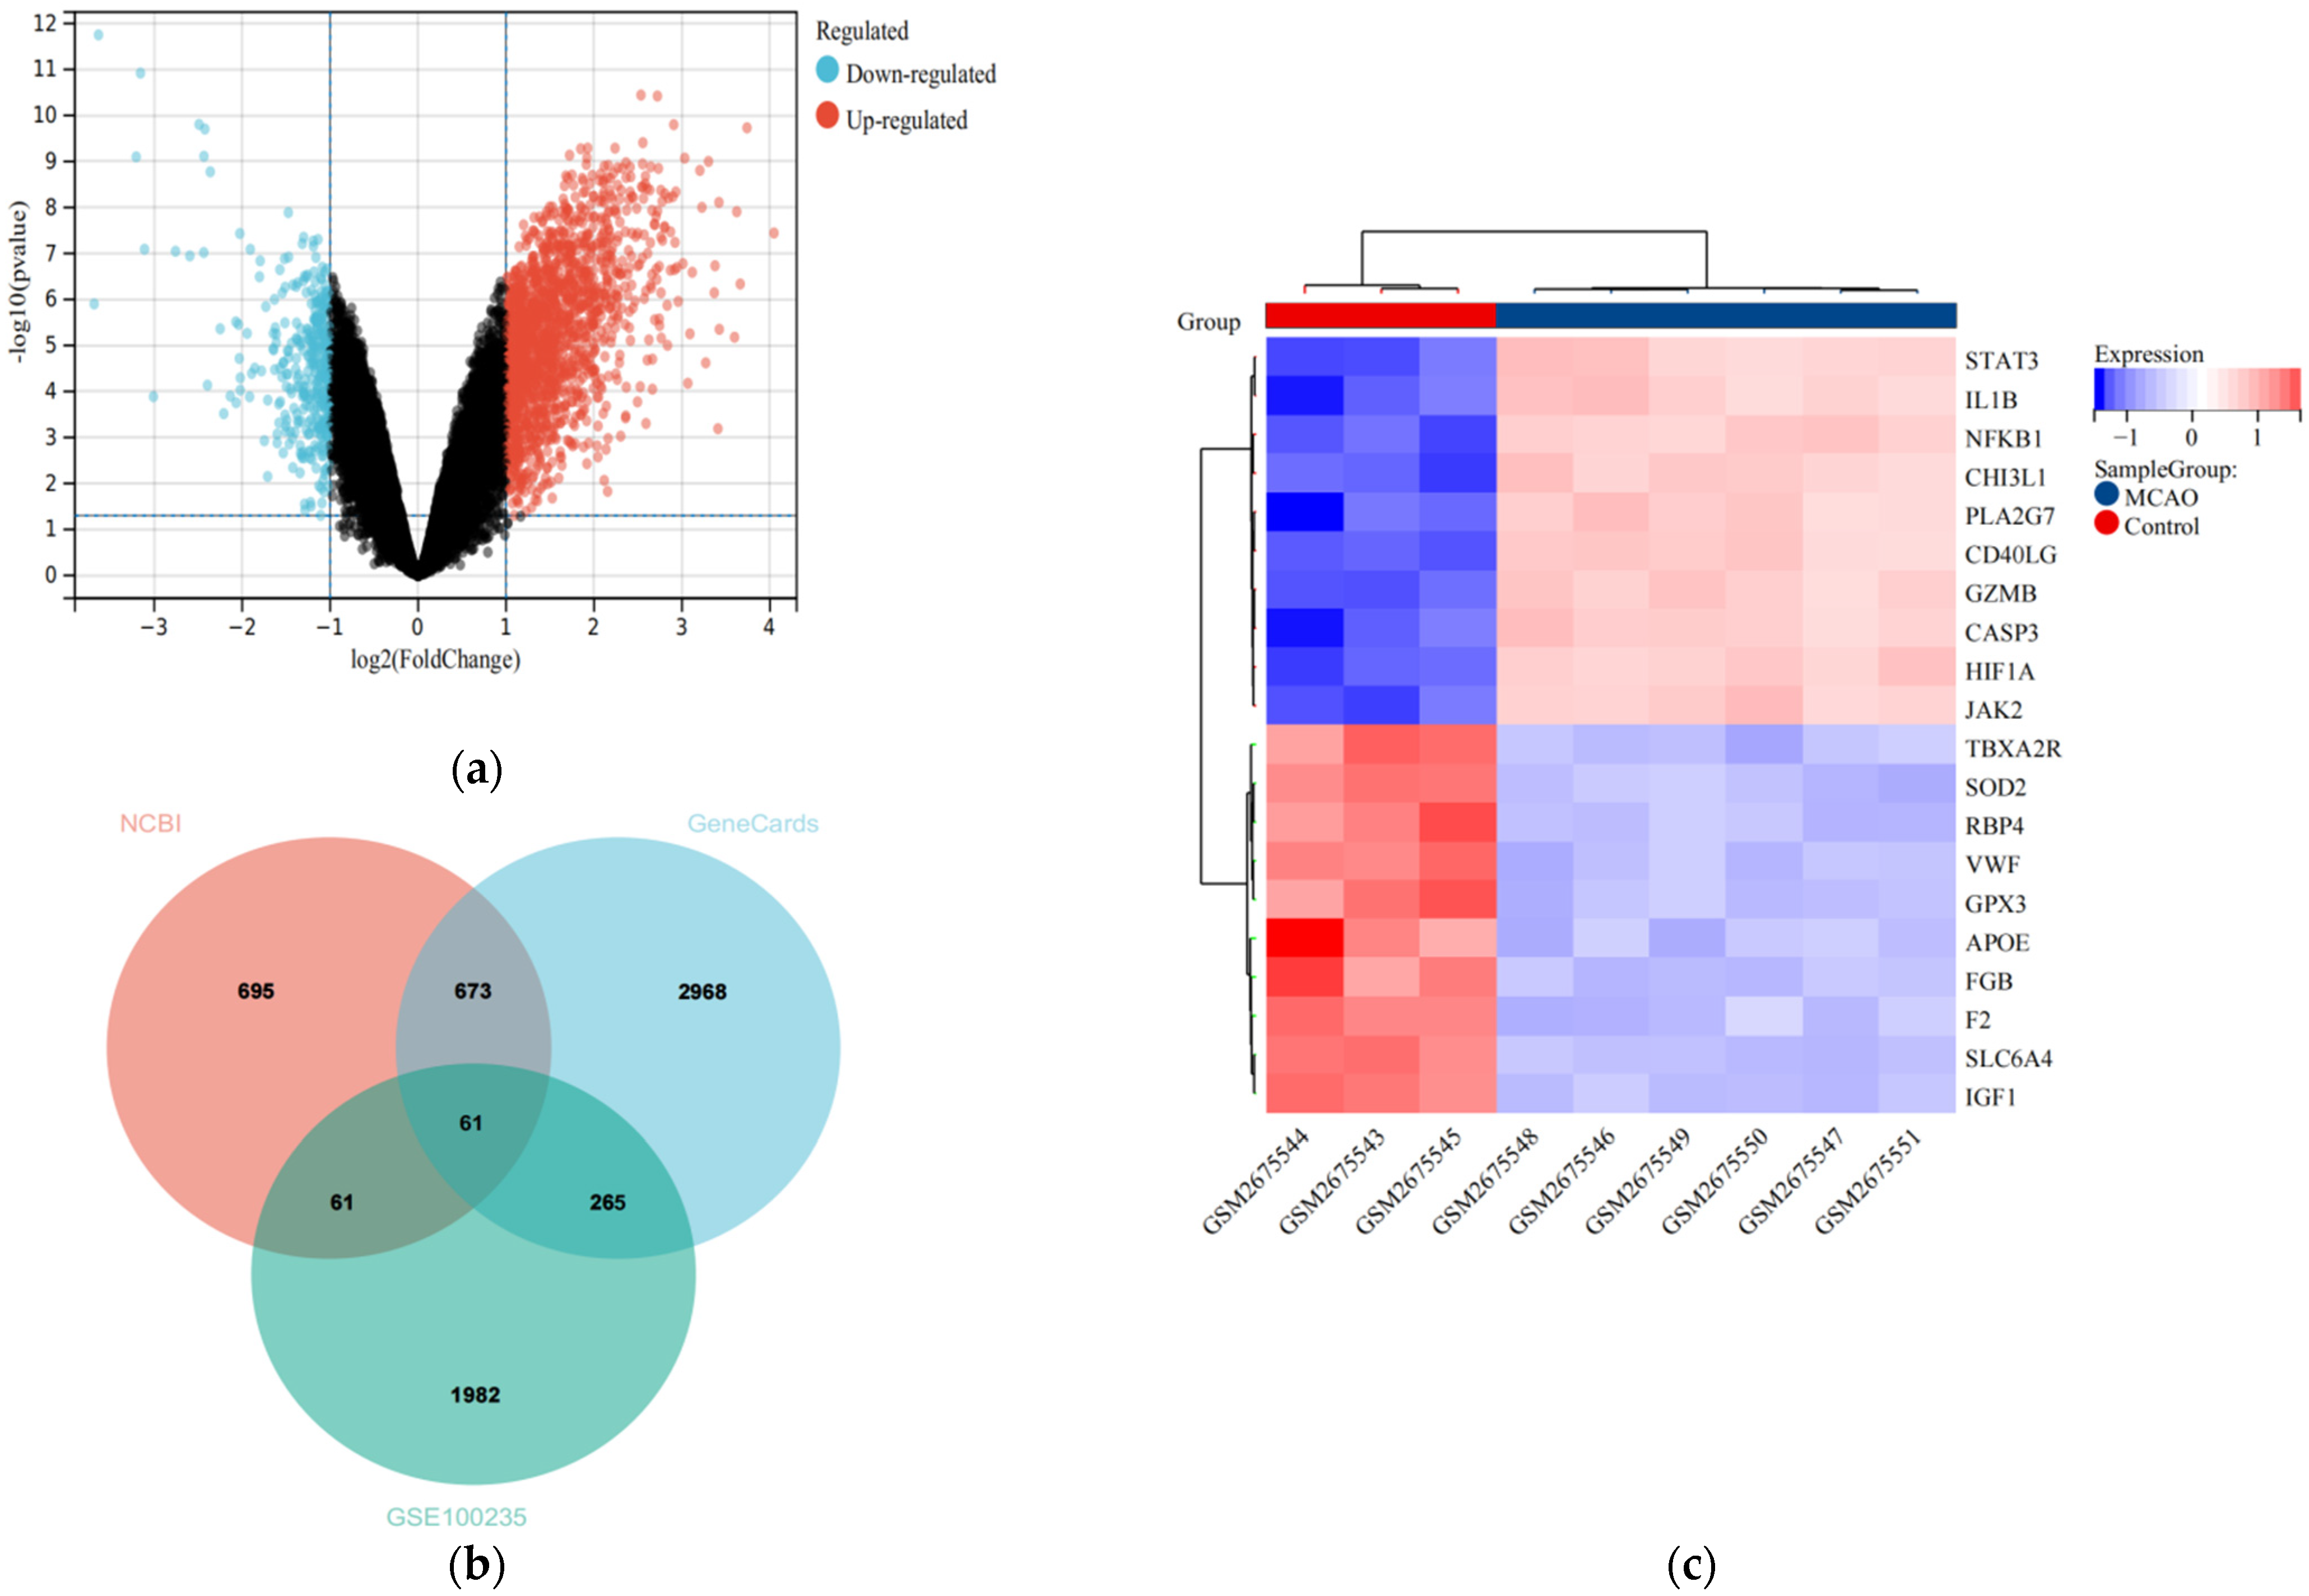
Abstract
:1. Introduction
2. Materials and Methods
2.1. Data Collection and Pre-Processing
2.2. Identification of IS-Related Differentially Expressed Genes
2.3. Identification of Protein–Protein Interaction (PPI) Networks of IS-DEGs
2.4. Functional Enrichment Analysis of Differential Genes
2.5. Therapeutic Target Screening of HSYA for IS
2.6. Cell Culture
2.7. OGD/R and Agent Treatments
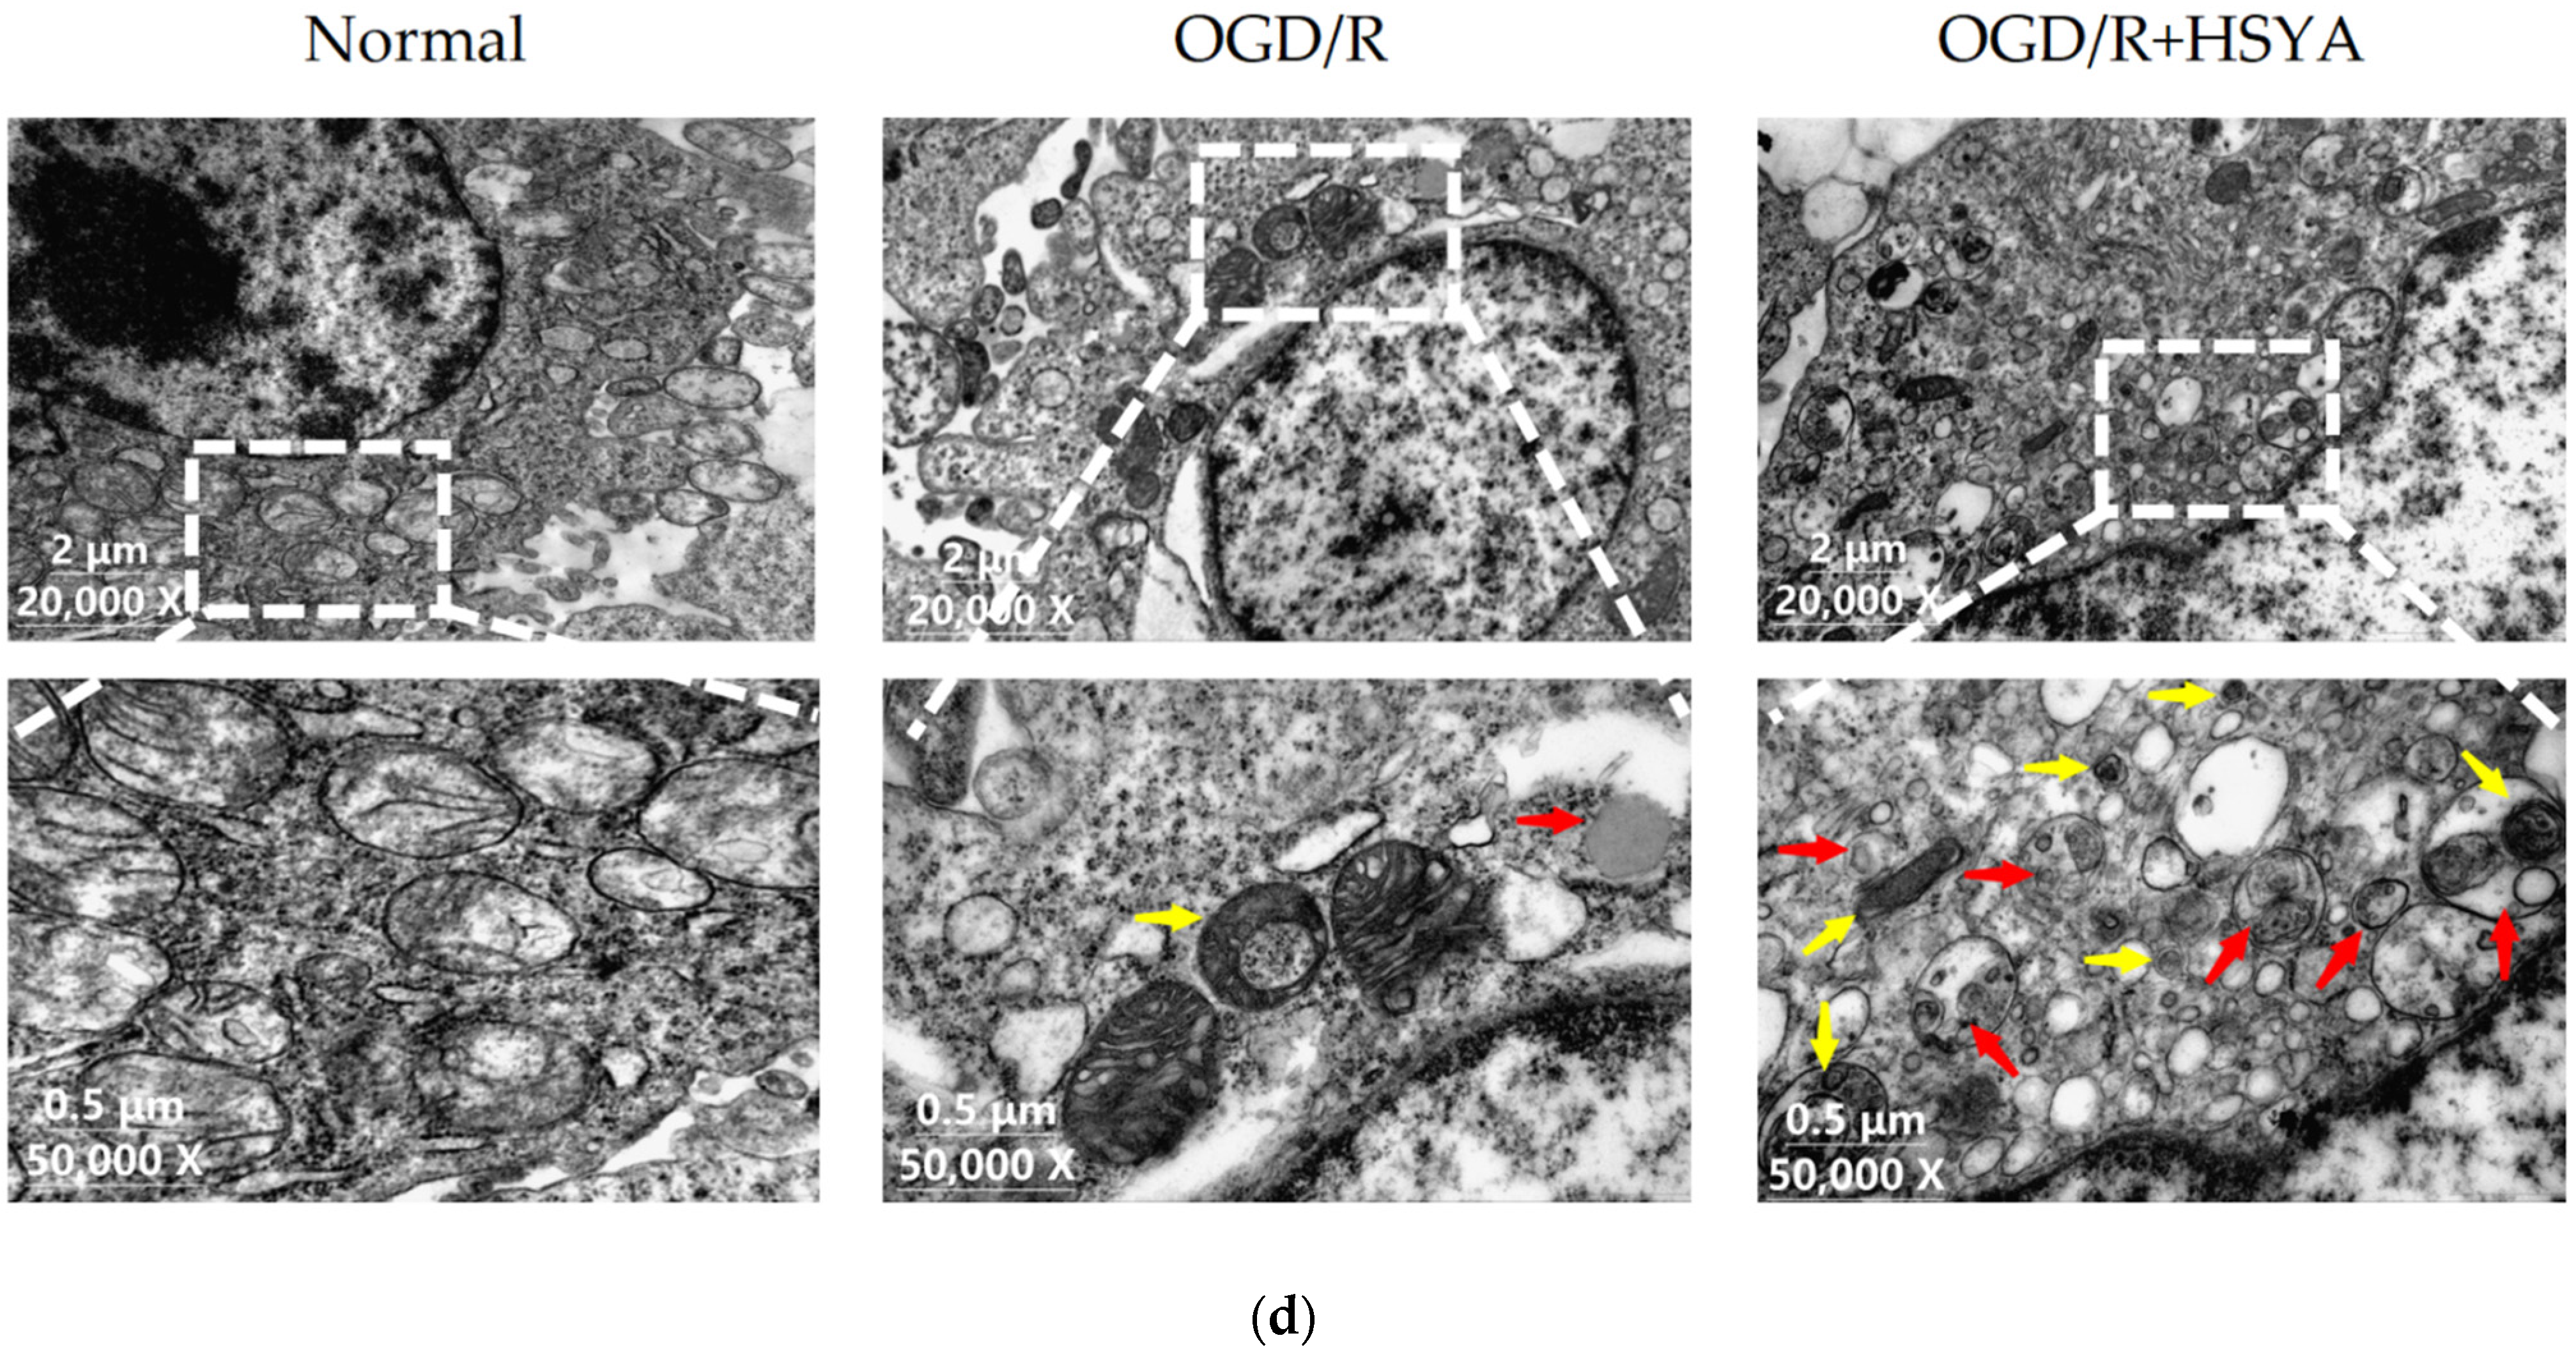
2.8. Transmission Electron Microscope Analysis (TEM)
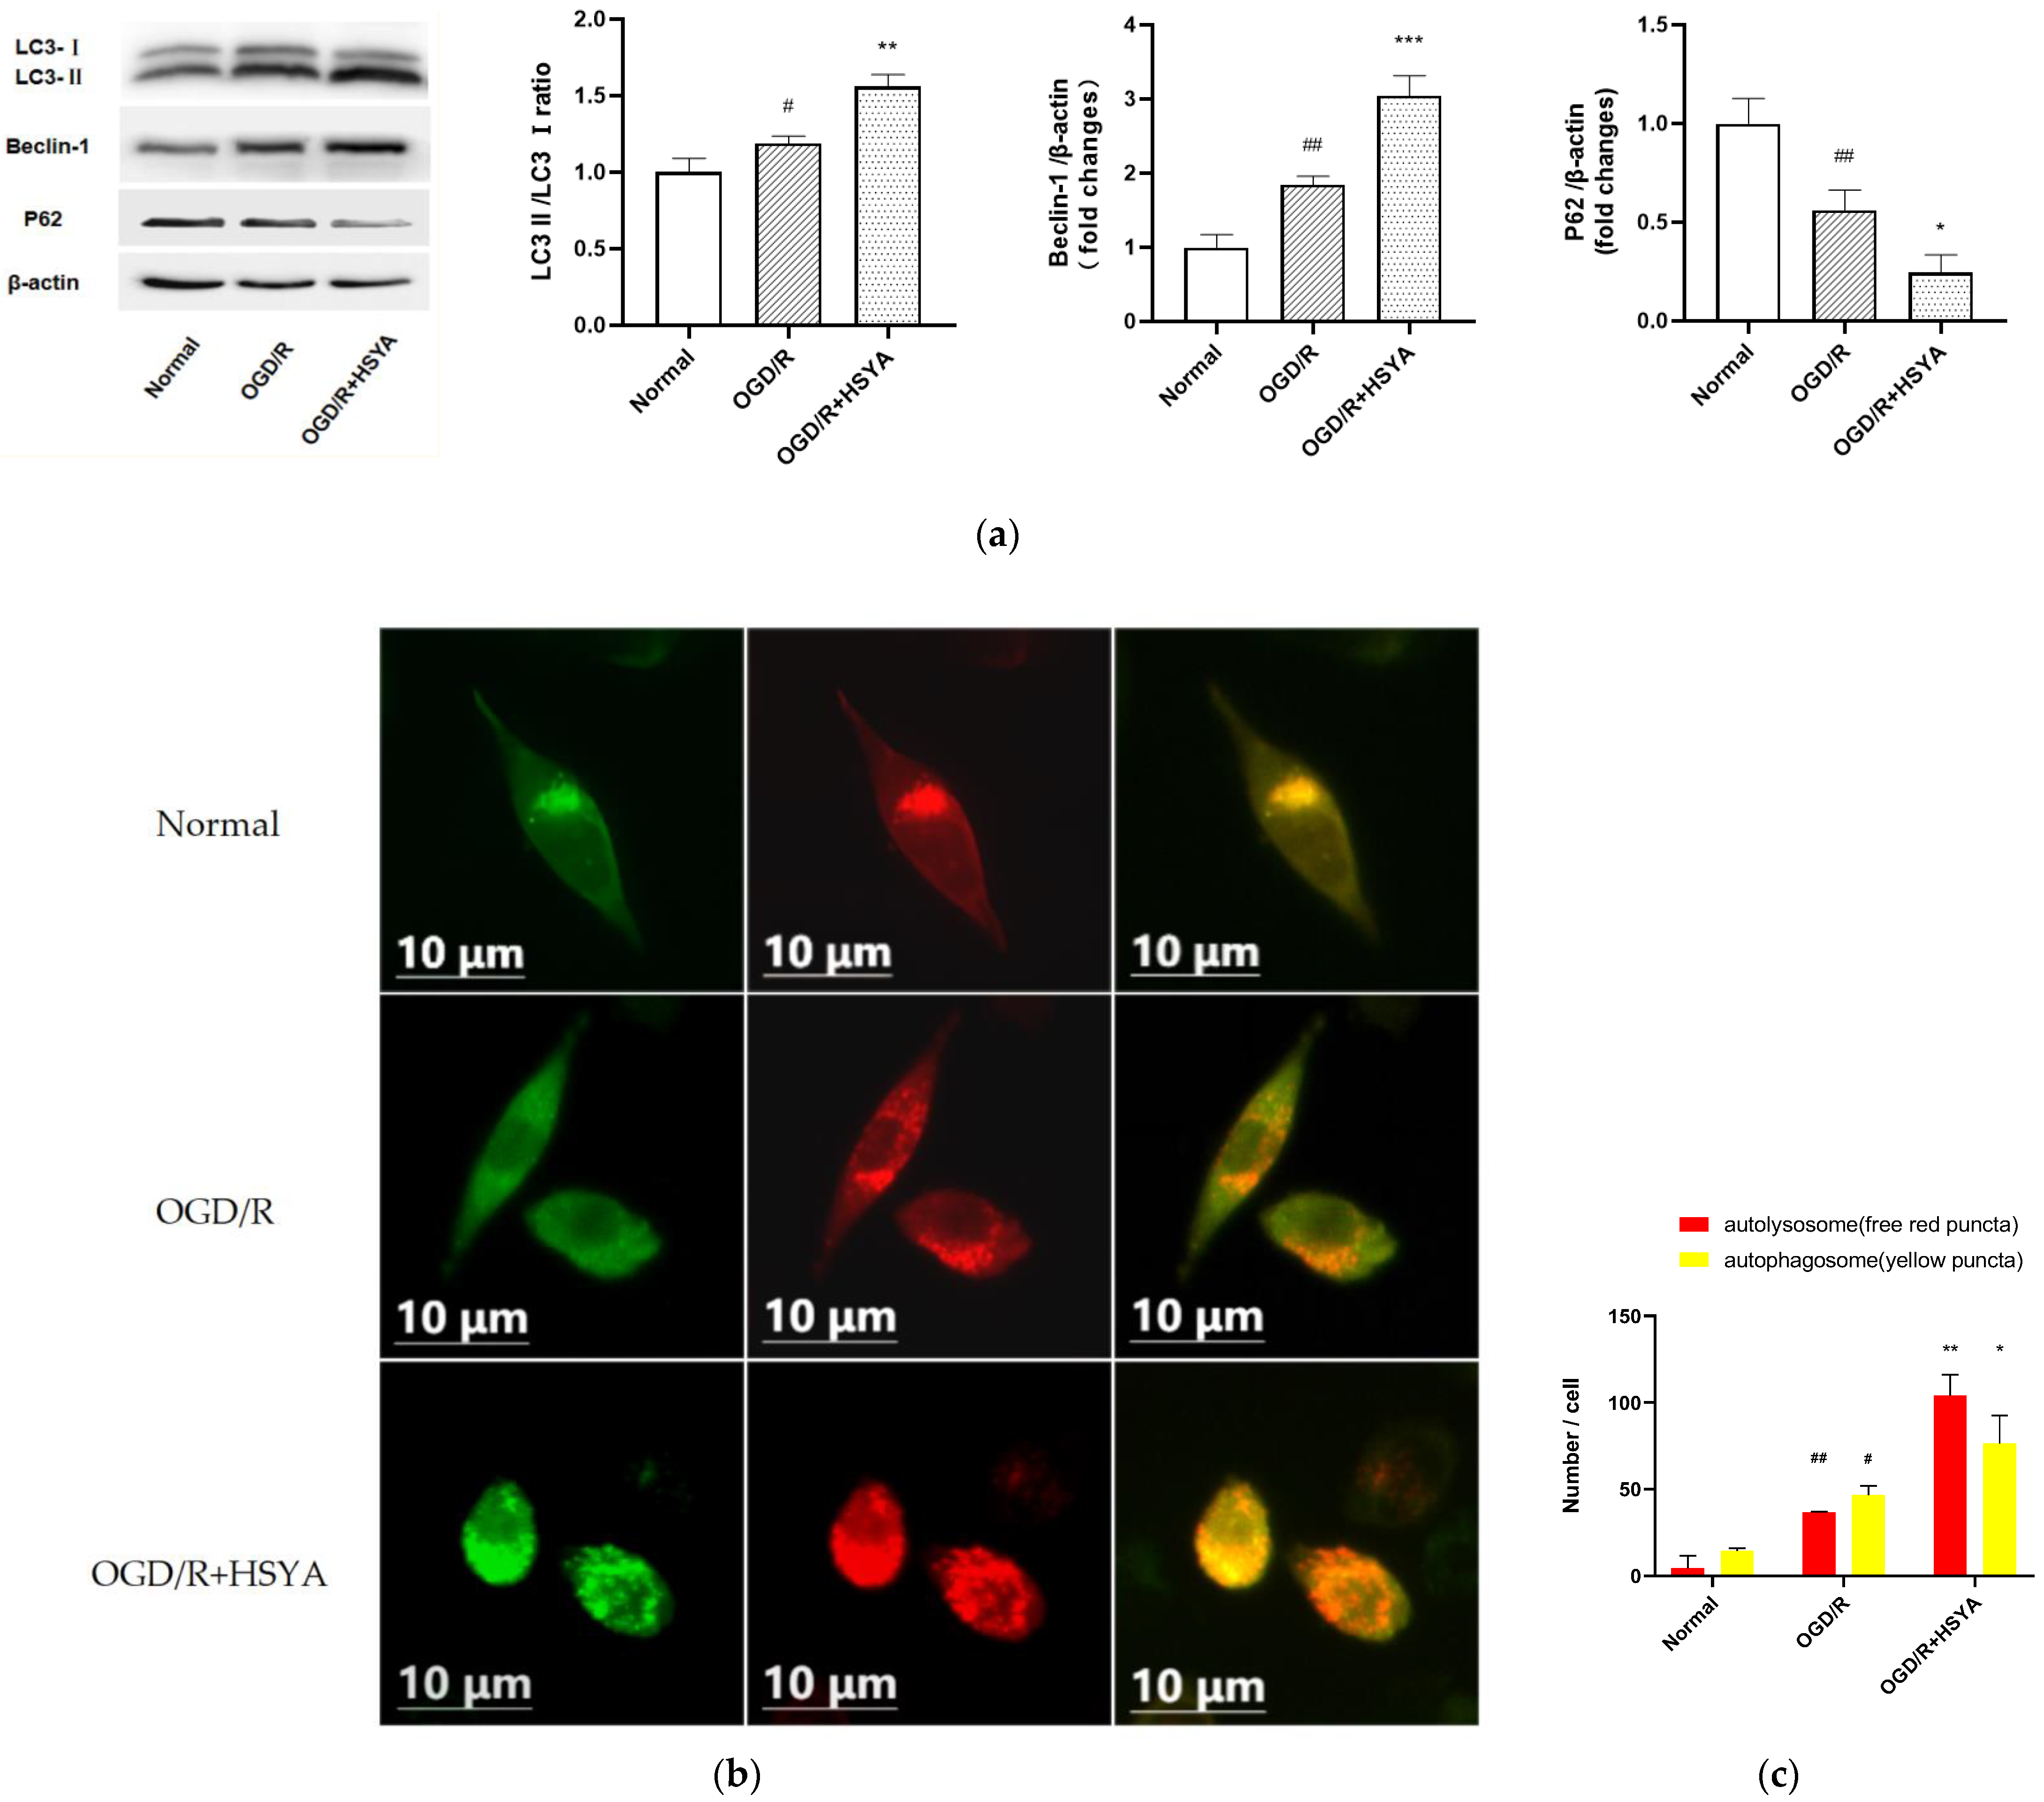
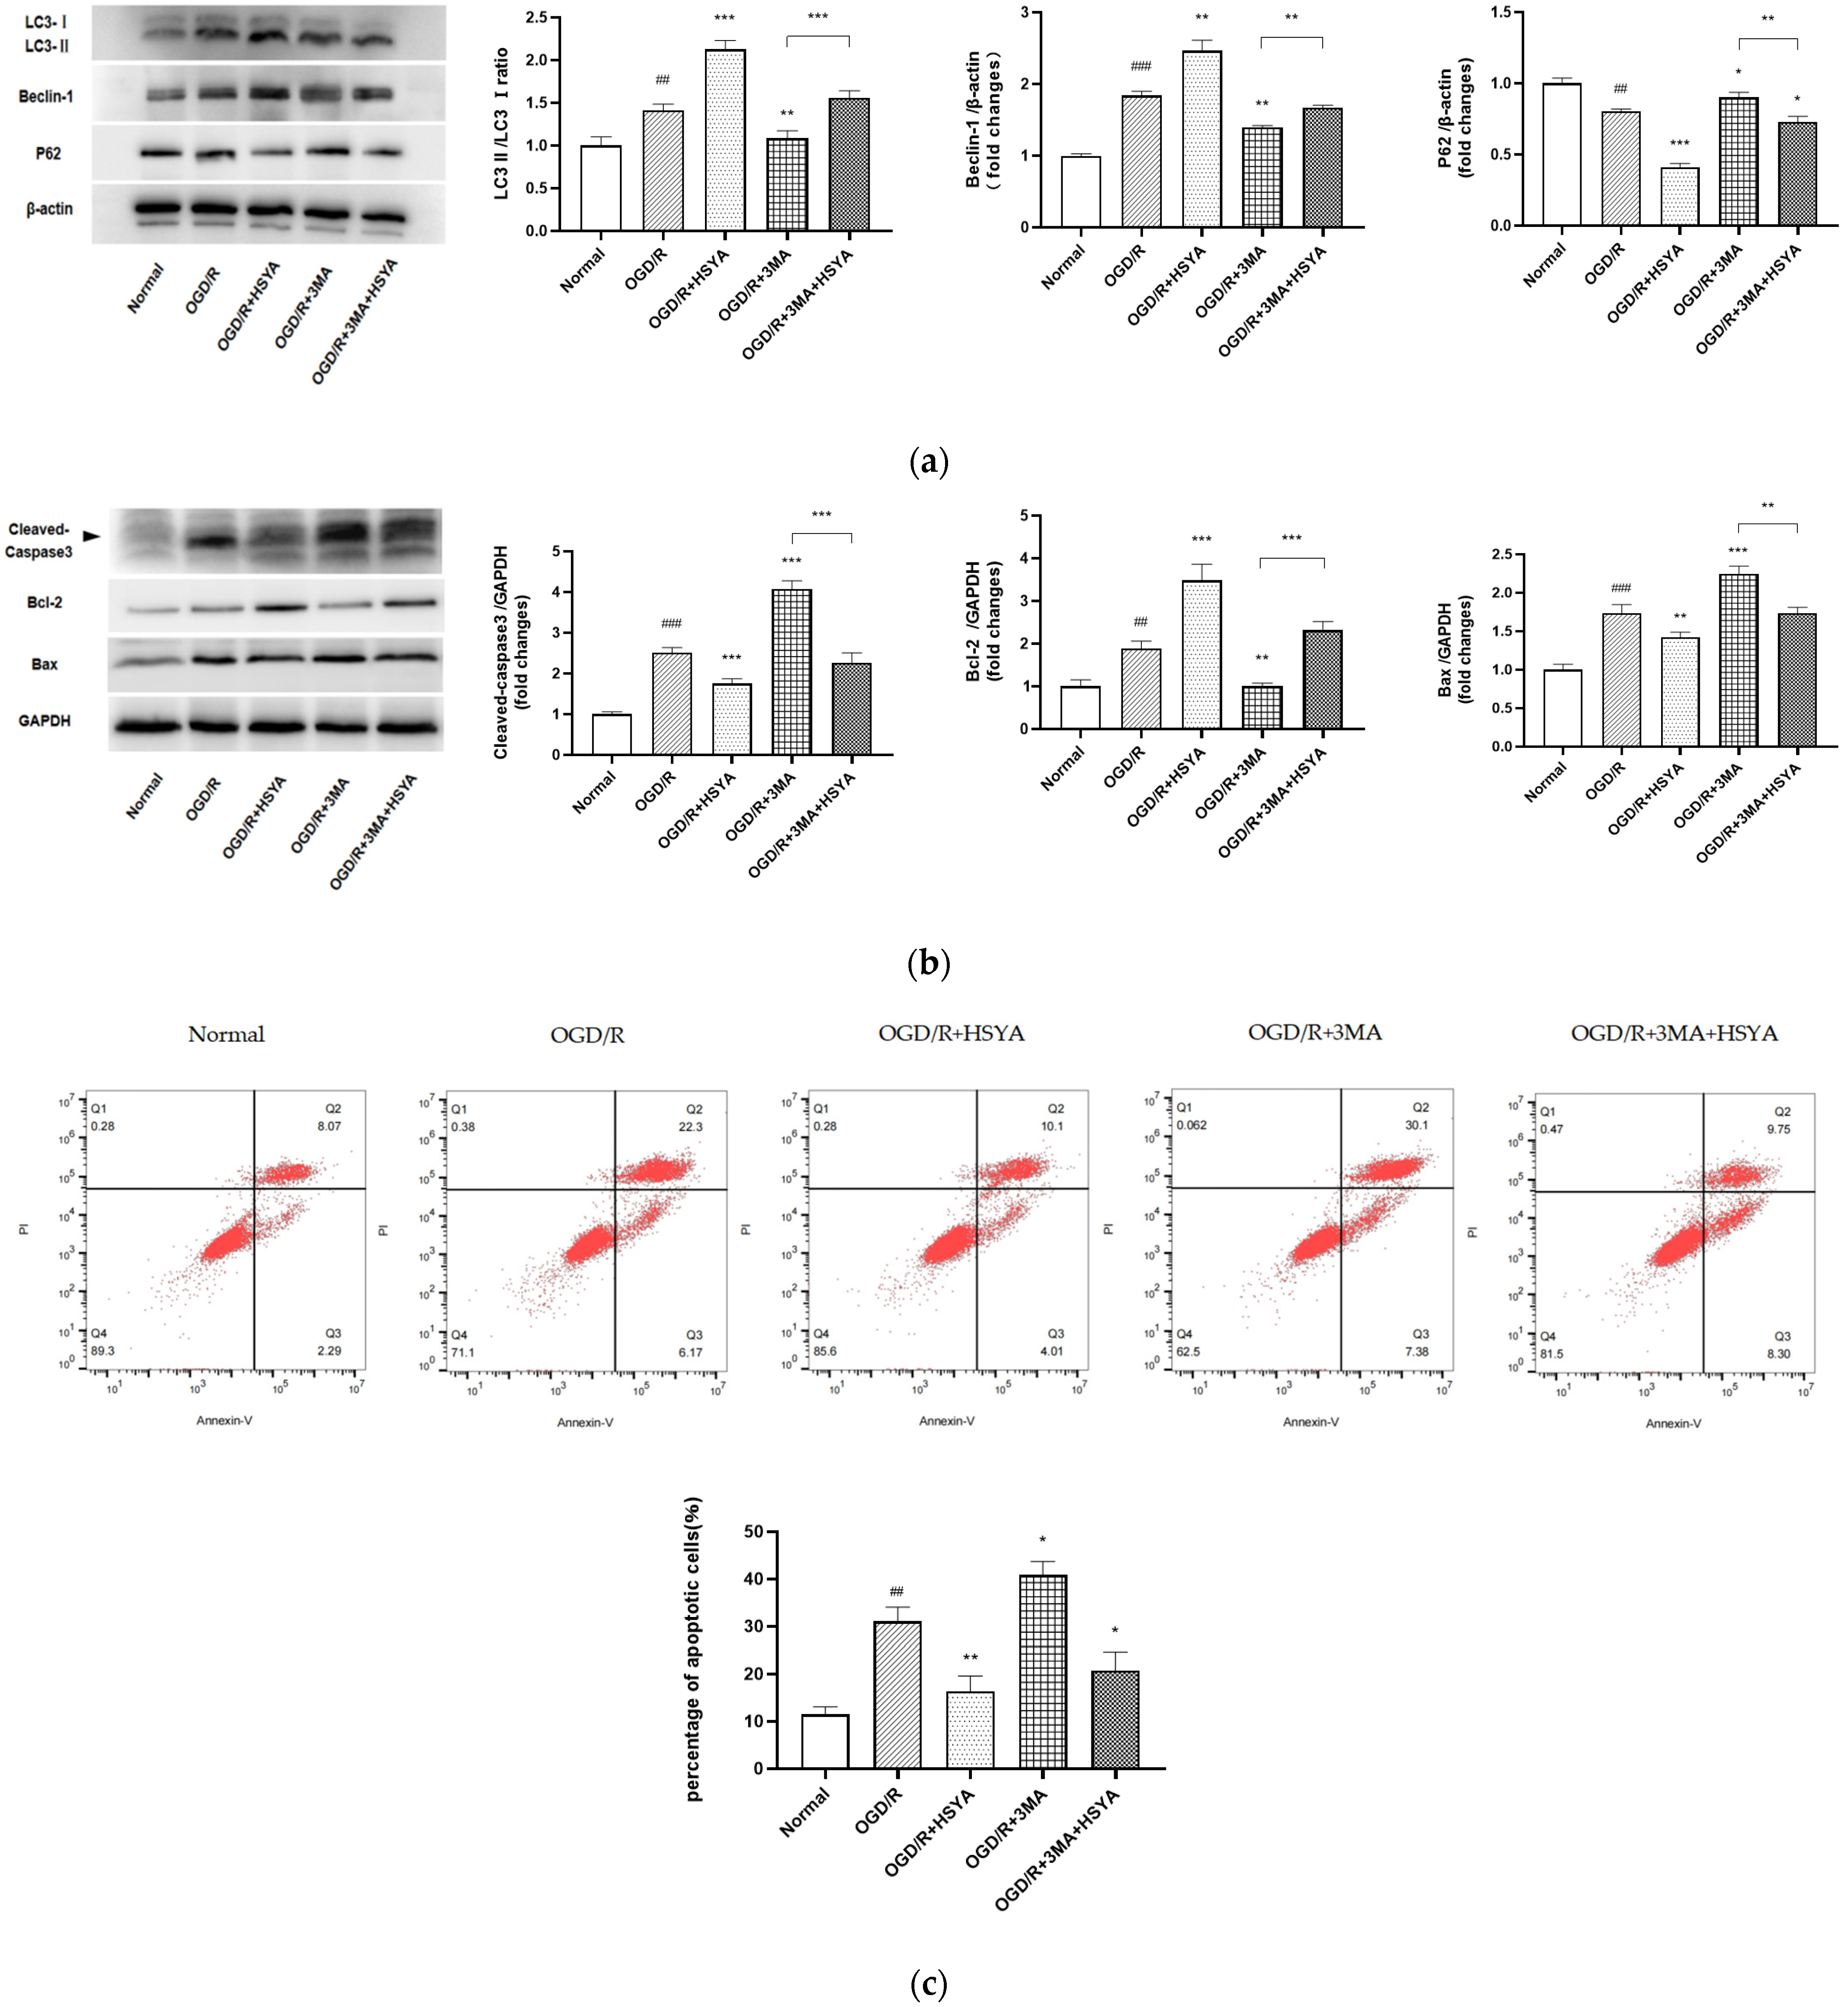
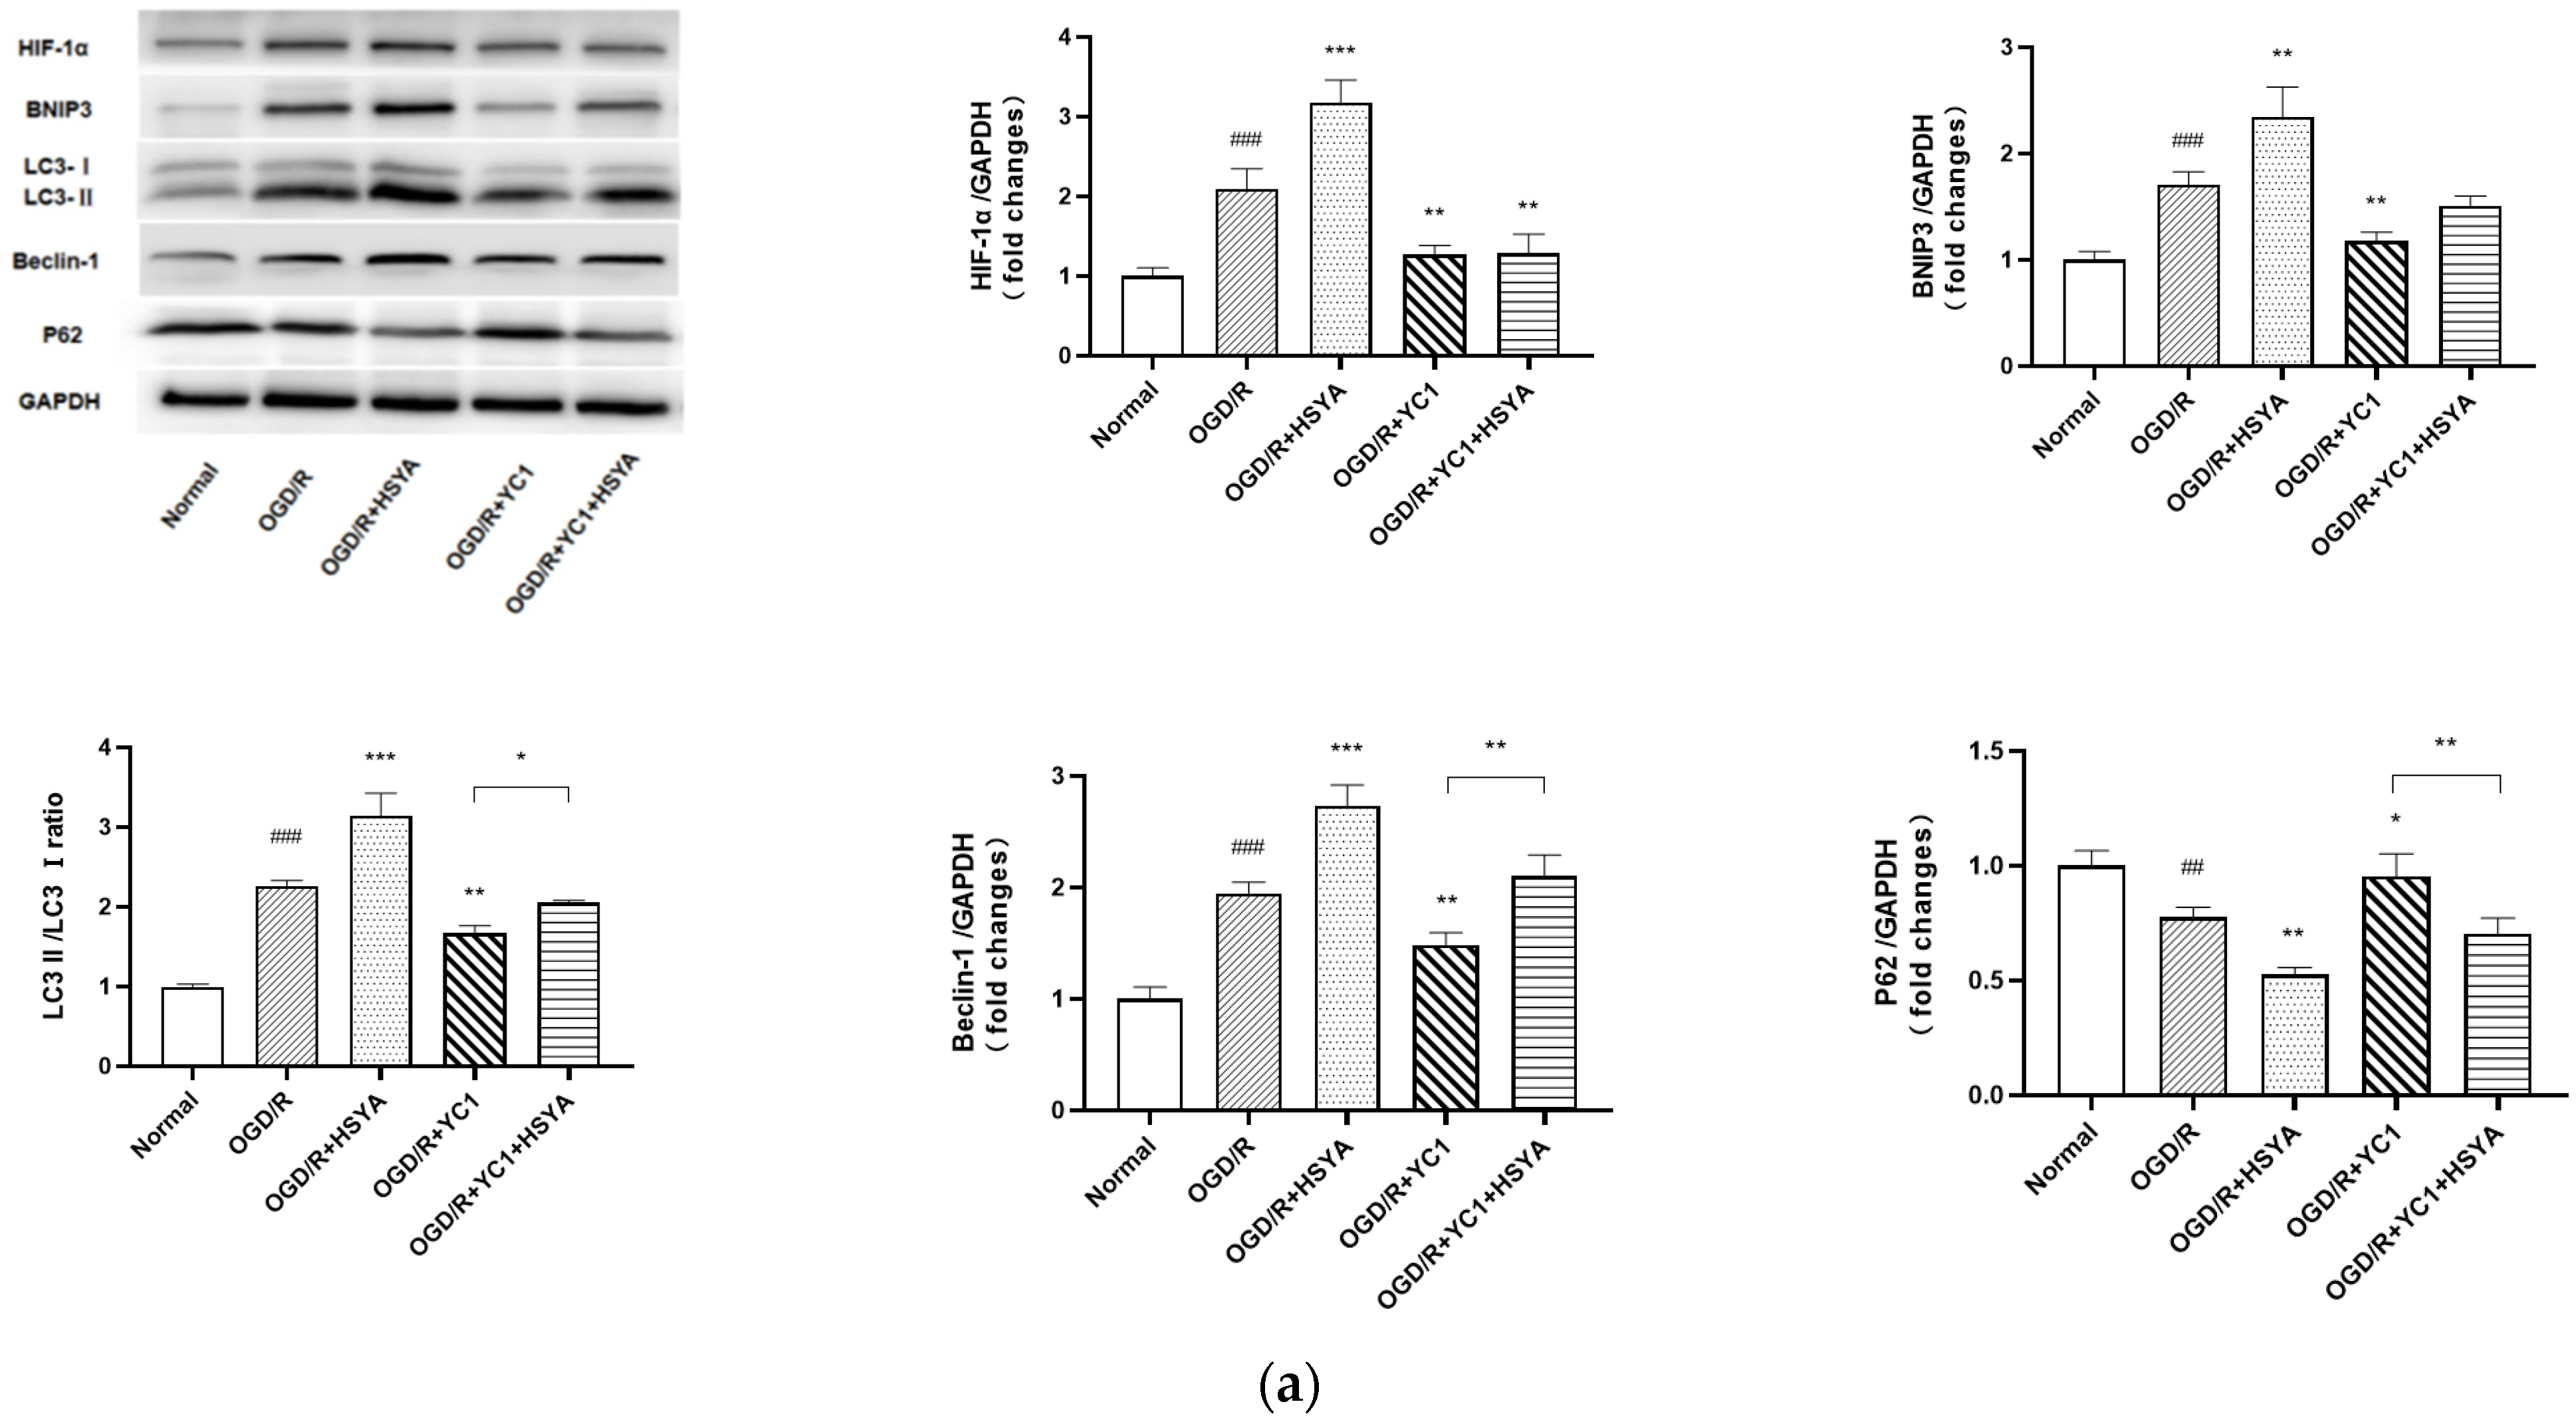
2.9. Western Blot Analysis
2.10. mCherry-GFP-LC3B Adenovirus Transfection
2.11. TUNEL Staining
2.12. Flow Cytometric Evaluation of Apoptosis (Annexin-V/PI)
2.13. Statistical Analysis
3. Results
3.1. Identification of DEGs and IS-Related DEGs
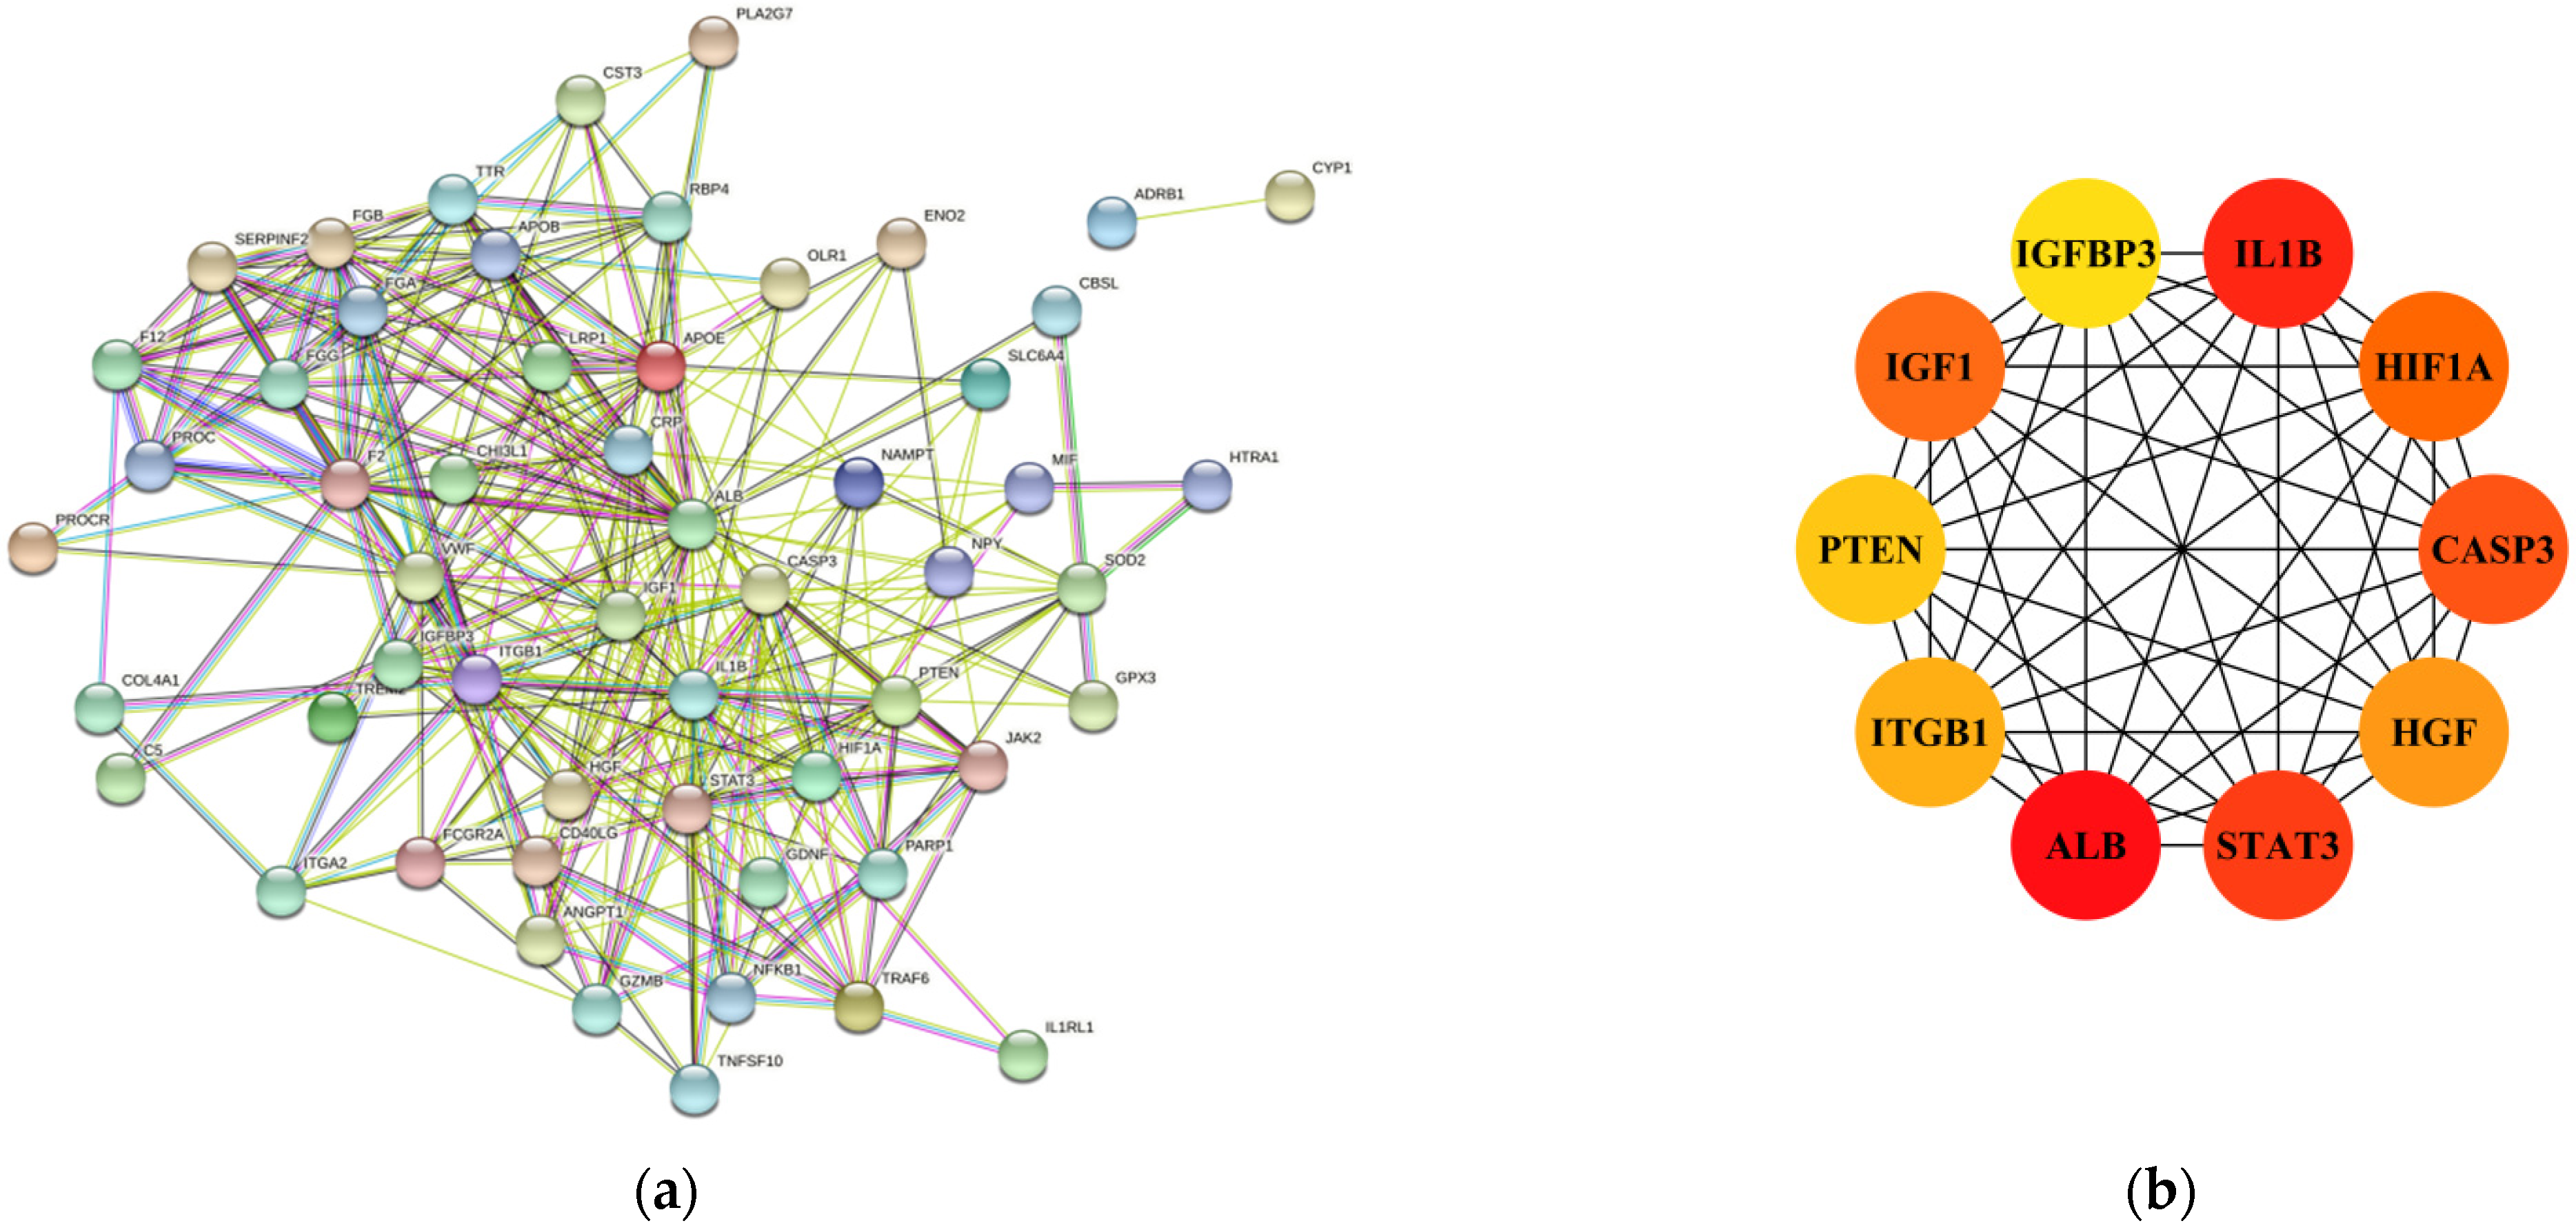
3.2. PPI Network Analysis of IS-DEGs, and Identification of Hub Genes
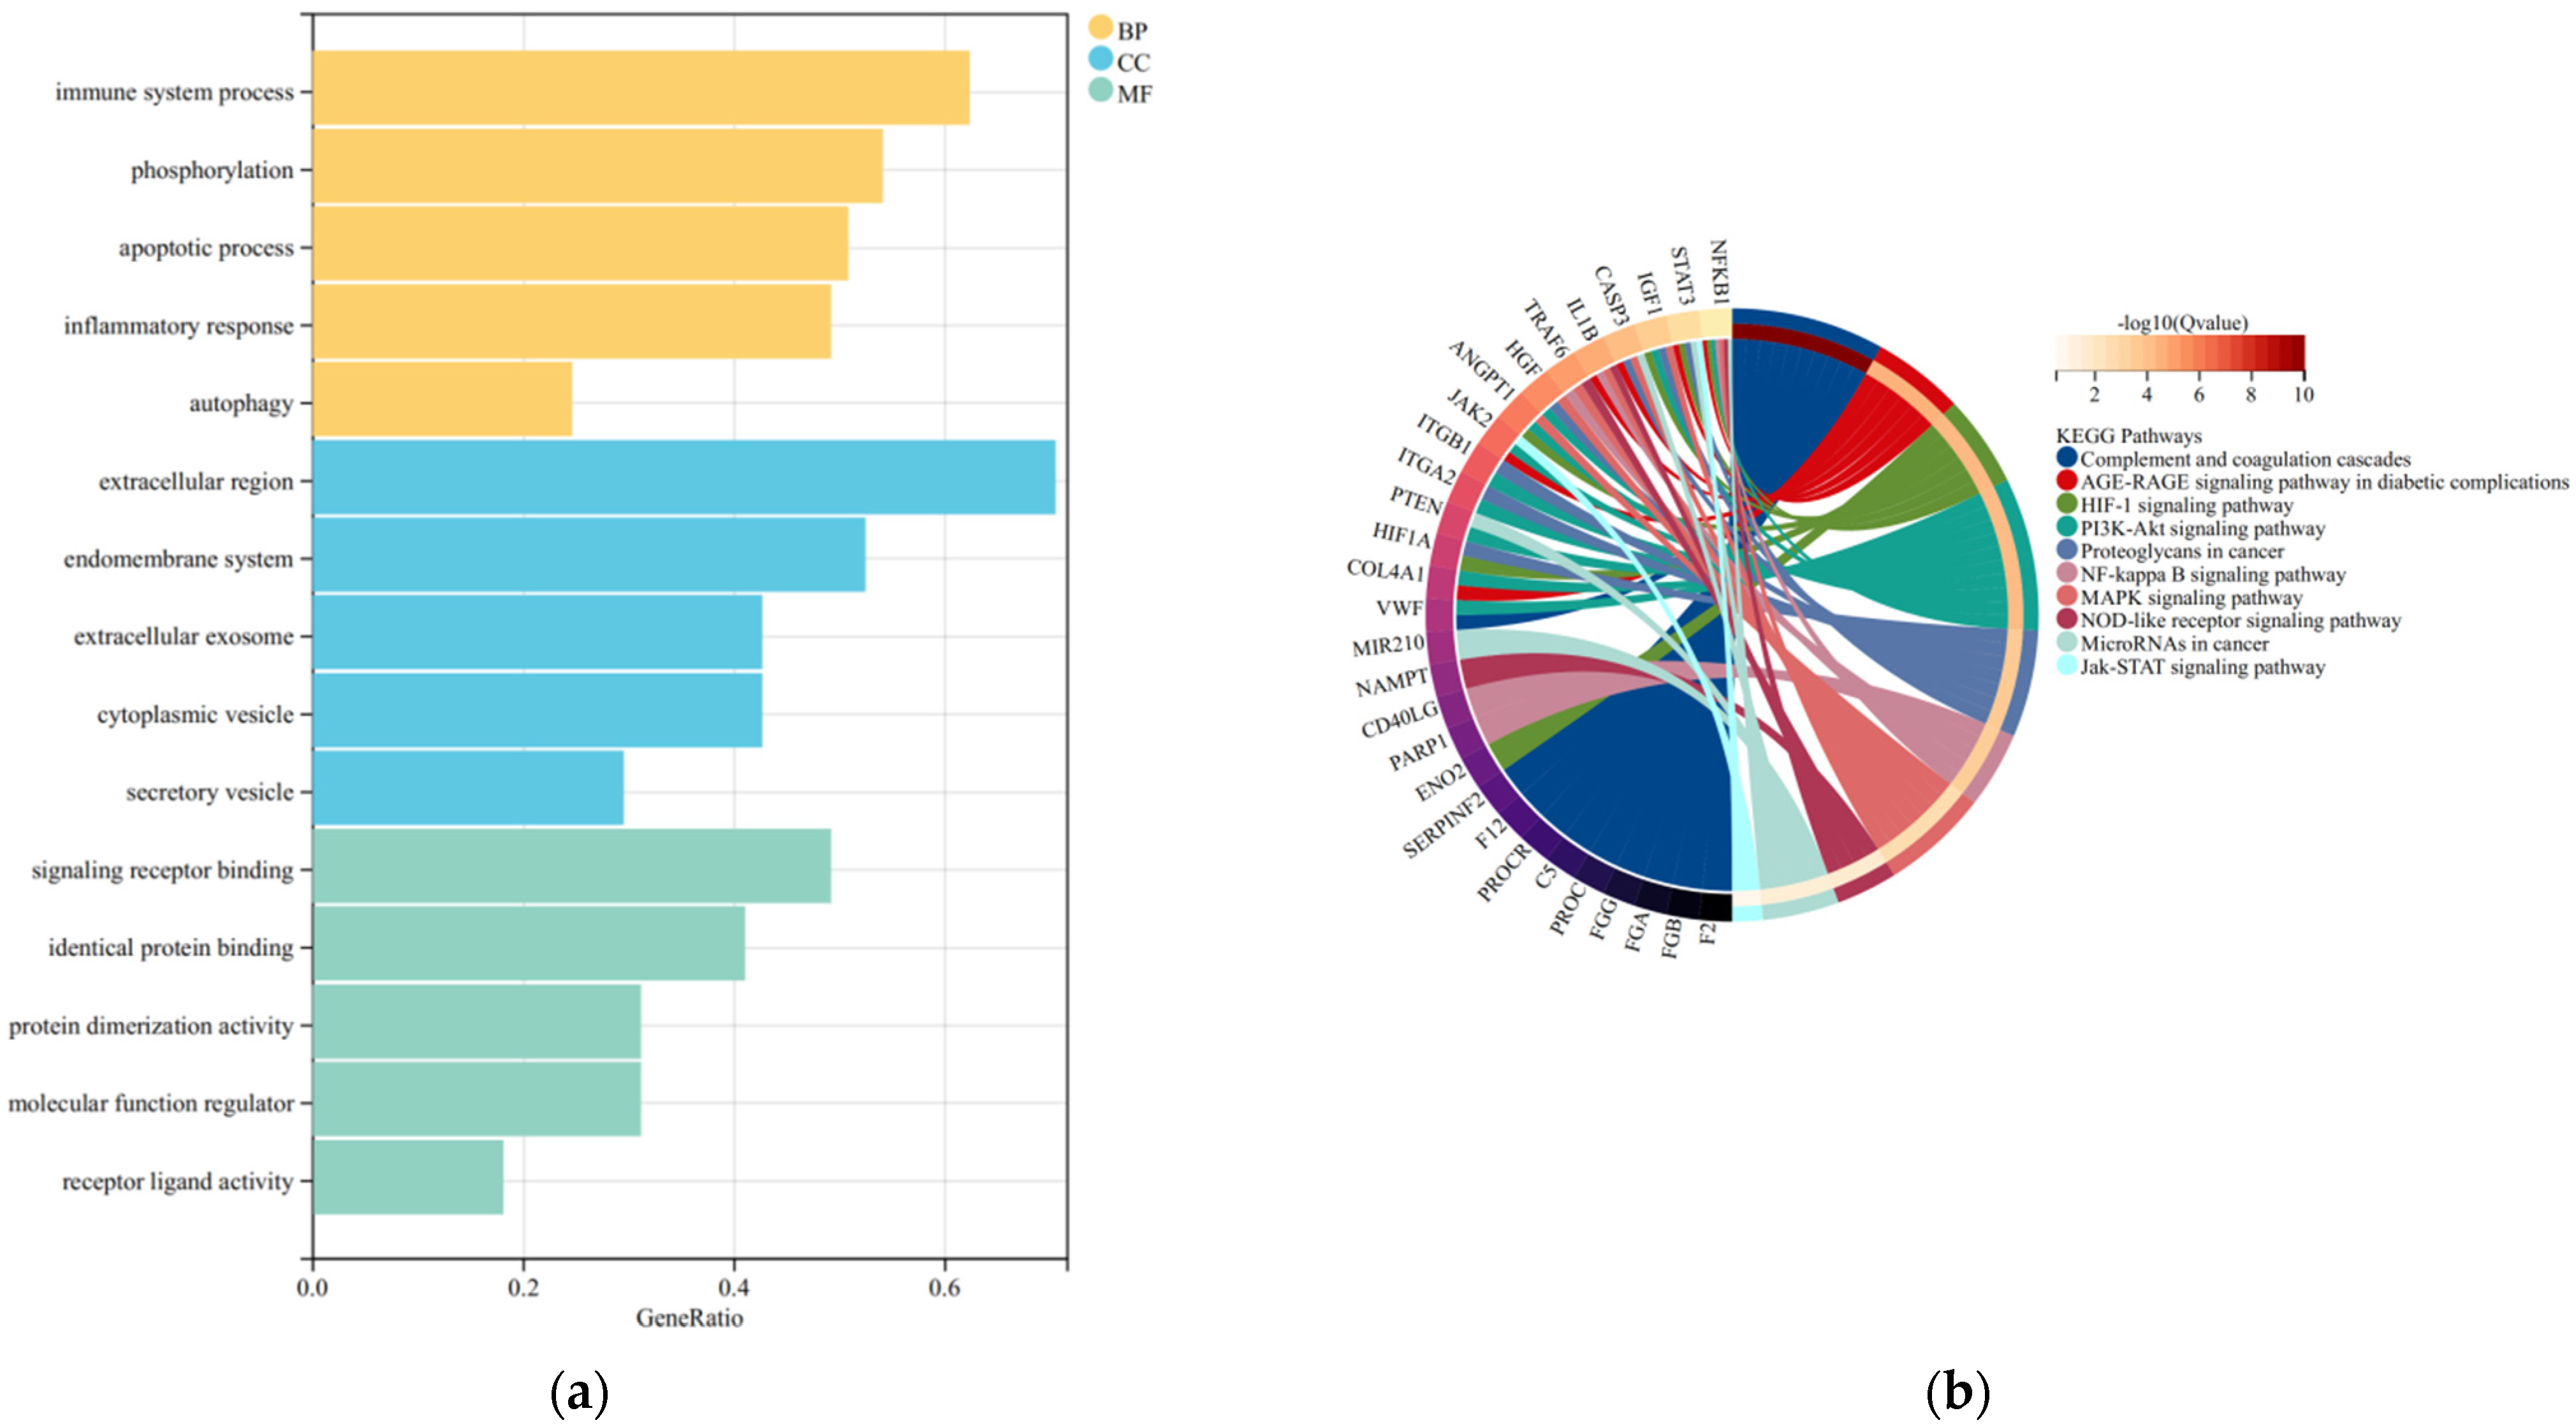
3.3. GO and KEGG Enrichment Analysis
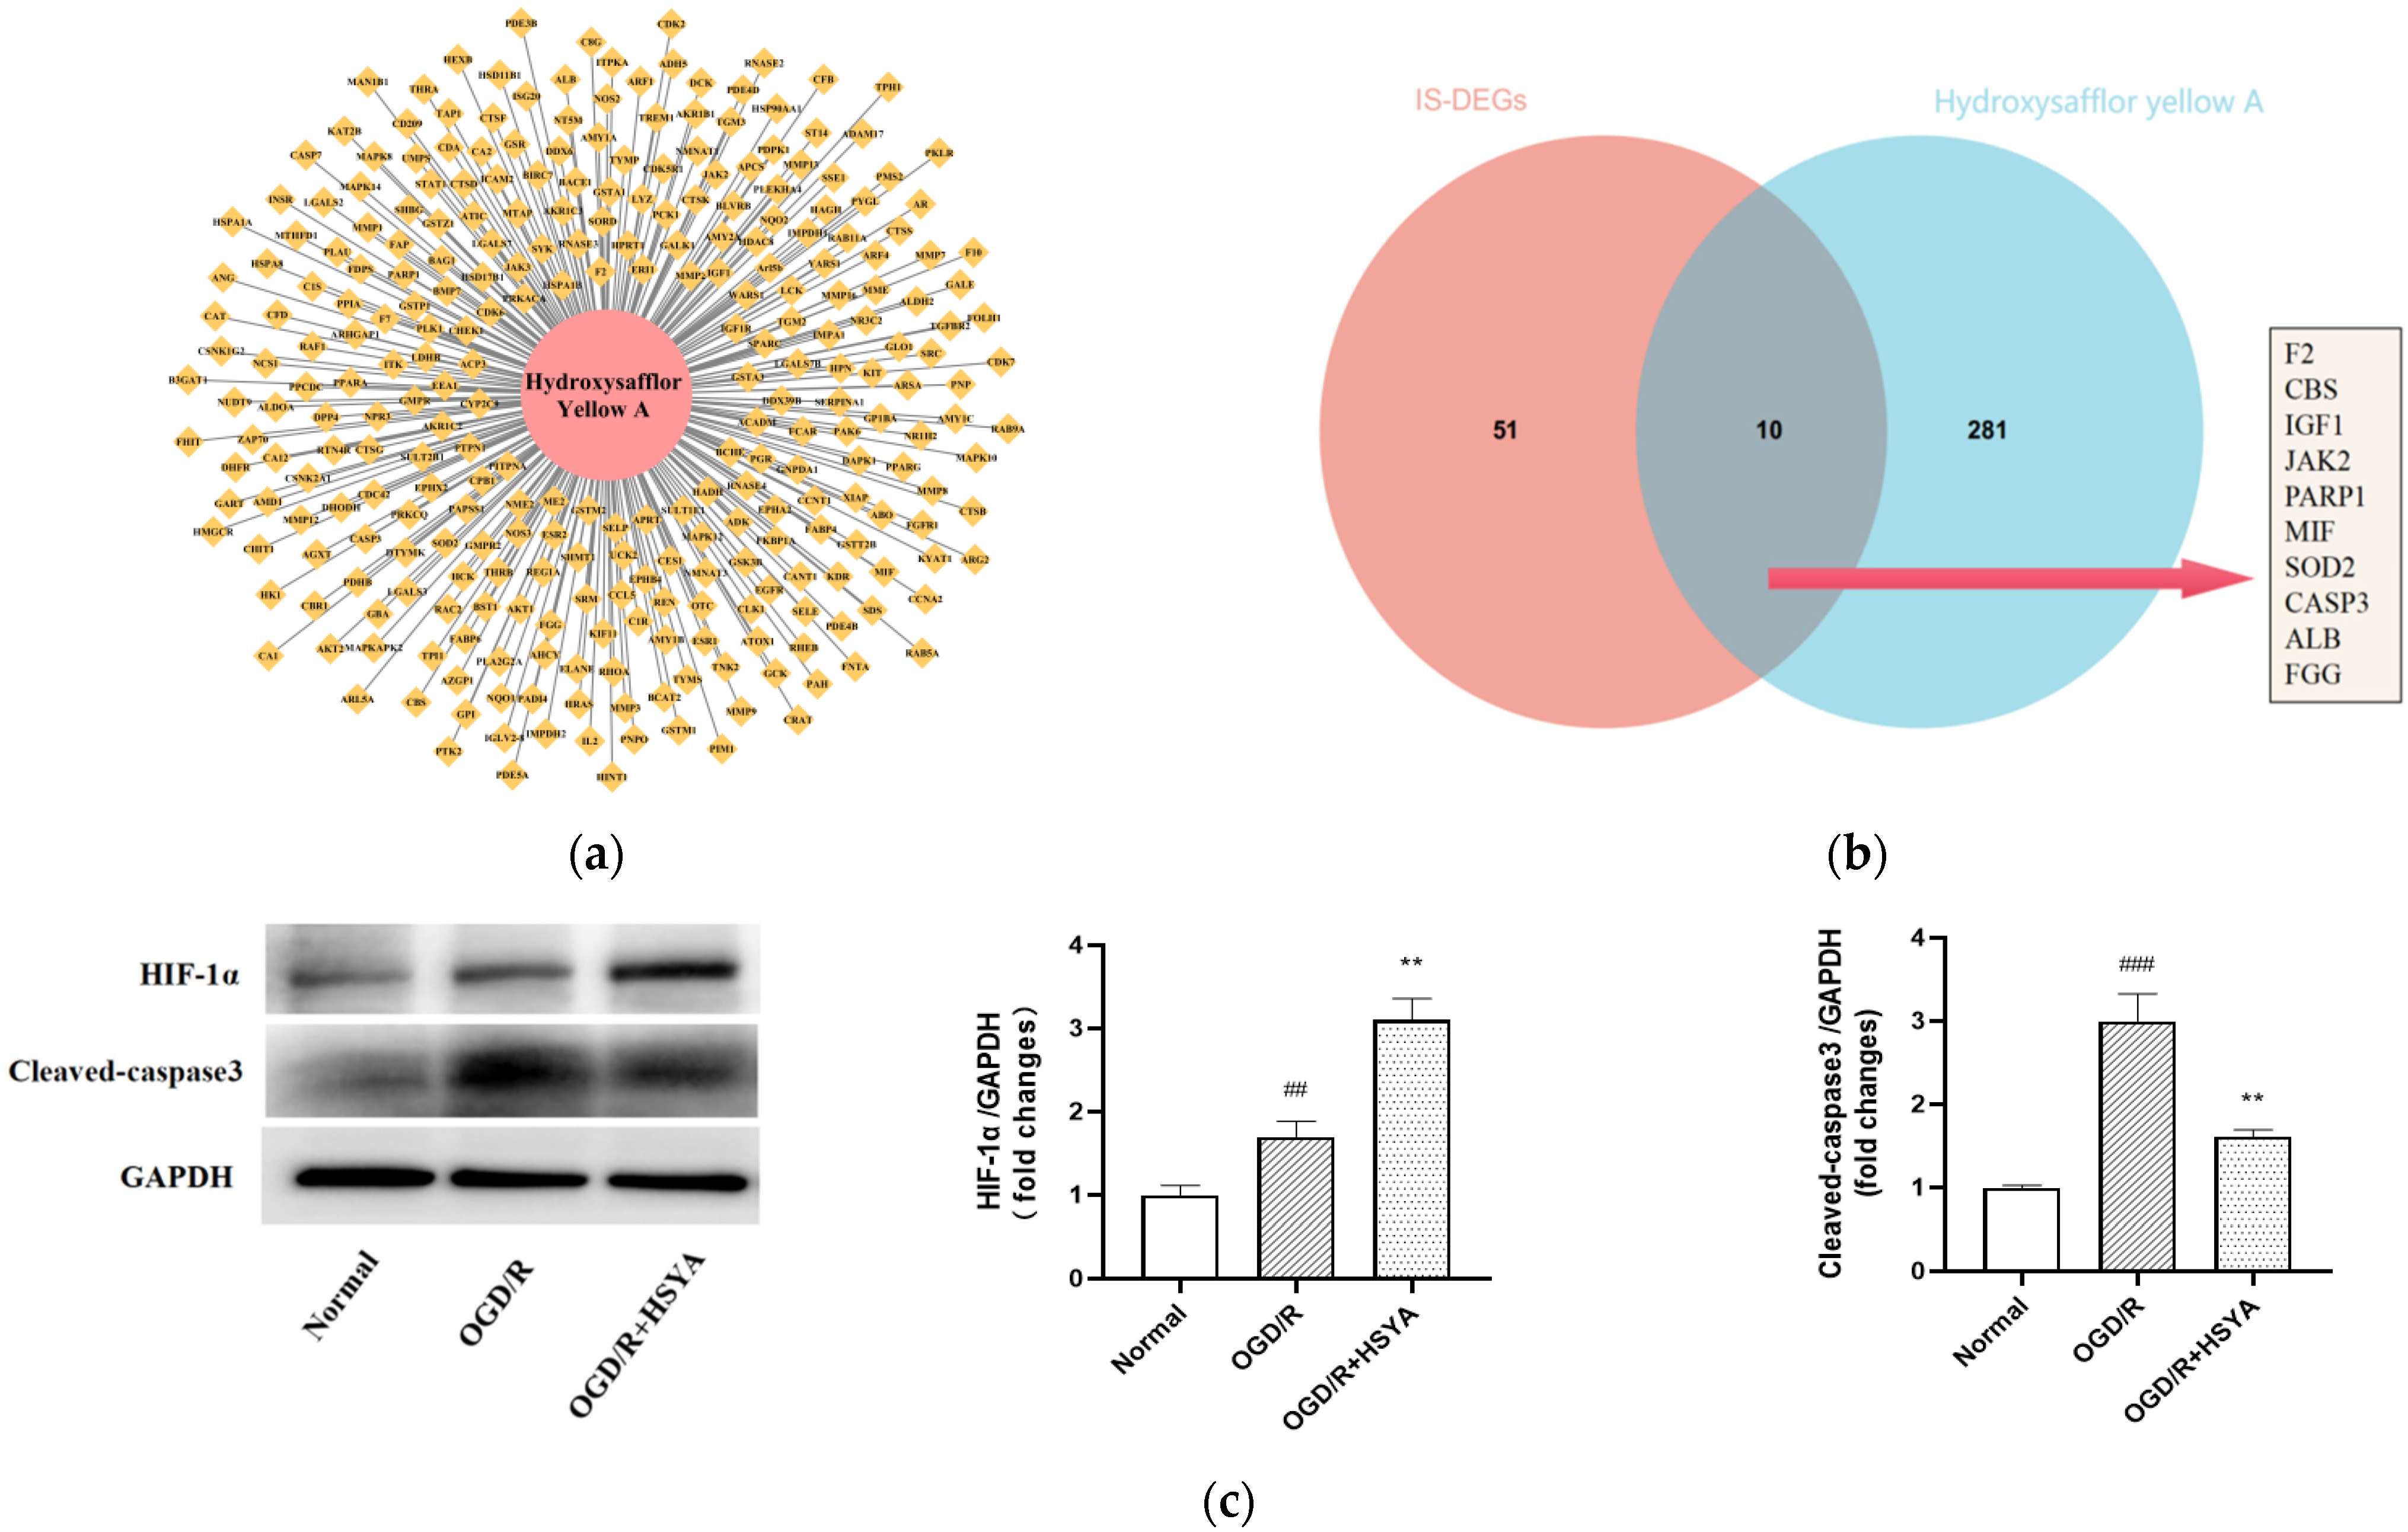
3.4. Target Prediction and Experimental Validation of HSYA for the Treatment of IS
3.5. HSYA Treatment Increases Autophagy in OGD/R-Injured SH-SY5Y Cells
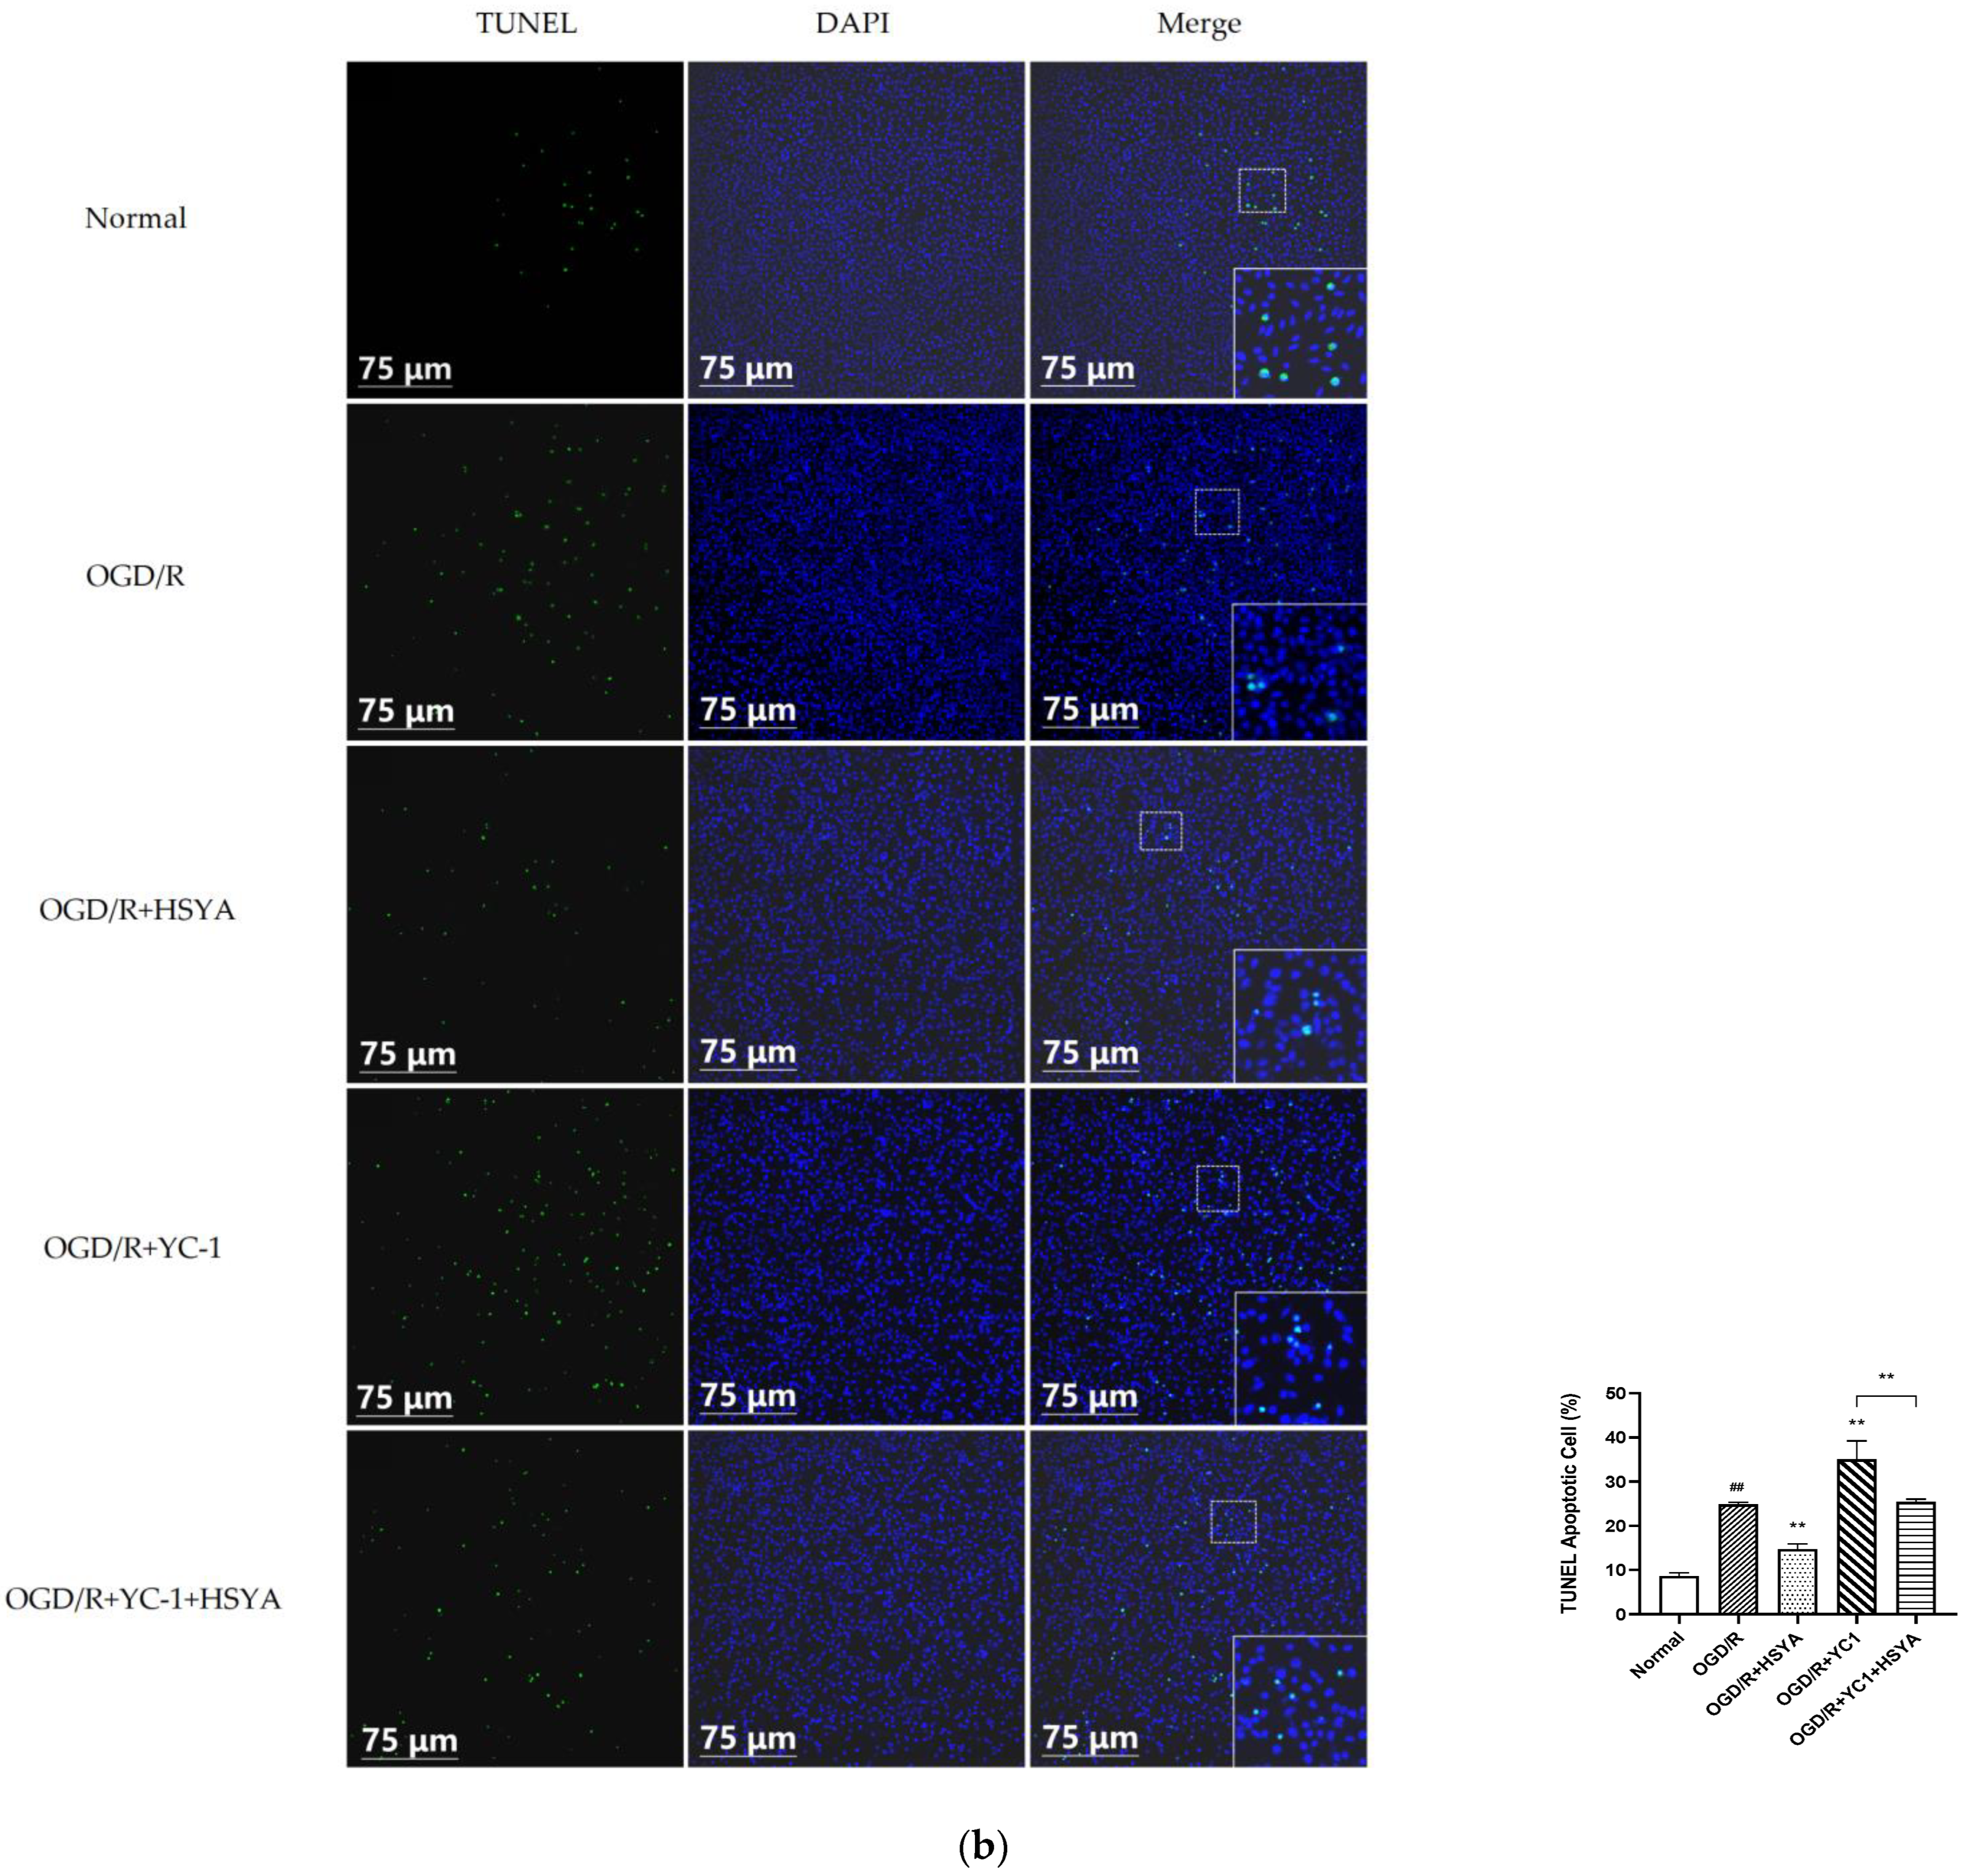
3.6. HSYA Attenuates Apoptosis by Regulating Autophagy in OGD/R-Injured Neurons
3.7. HIF-1α/BNIP3 Signaling Pathway Regulates HSYA-Induced Autophagy to Protect Neurons
4. Discussion
5. Conclusions
Supplementary Materials
Author Contributions
Funding
Institutional Review Board Statement
Informed Consent Statement
Data Availability Statement
Conflicts of Interest
References
- Diener, H.-C.; Hankey, G.J. Primary and Secondary Prevention of Ischemic Stroke and Cerebral Hemorrhage: JACC Focus Seminar. J. Am. Coll. Cardiol. 2020, 75, 1804–1818. [Google Scholar] [CrossRef]
- Feigin, V.L.; Norrving, B.; Mensah, G.A. Global Burden of Stroke. Circ. Res. 2017, 120, 439–448. [Google Scholar] [CrossRef]
- Yang, Y.; Torbey, M.T. Angiogenesis and Blood-Brain Barrier Permeability in Vascular Remodeling after Stroke. Curr. Neuropharmacol. 2020, 18, 1250–1265. [Google Scholar] [CrossRef]
- Sharma, D.; Maslov, L.N.; Singh, N.; Jaggi, A.S. Remote ischemic preconditioning-induced neuroprotection in cerebral ischemia-reperfusion injury: Preclinical evidence and mechanisms. Eur. J. Pharmacol. 2020, 883, 173380. [Google Scholar] [CrossRef]
- Lekoubou, A.; Awoumou, J.J.; Kengne, A.P. Incidence of seizure in stroke patients treated with recombinant tissue plasminogen activator: A systematic review and meta-analysis. Int. J. Stroke 2017, 12, 923–931. [Google Scholar] [CrossRef]
- Tao, T.; Liu, M.; Chen, M.; Luo, Y.; Wang, C.; Xu, T.; Jiang, Y.; Guo, Y.; Zhang, J.H. Natural medicine in neuroprotection for ischemic stroke: Challenges and prospective. Pharmacol. Ther. 2020, 216, 107695. [Google Scholar] [CrossRef]
- Sun, Y.; Xu, D.-P.; Qin, Z.; Wang, P.-Y.; Hu, B.-H.; Yu, J.-G.; Zhao, Y.; Cai, B.; Chen, Y.-L.; Lu, M.; et al. Protective cerebrovascular effects of hydroxysafflor yellow A (HSYA) on ischemic stroke. Eur. J. Pharmacol. 2018, 818, 604–609. [Google Scholar] [CrossRef]
- Bai, X.; Wang, W.-X.; Fu, R.-J.; Yue, S.-J.; Gao, H.; Chen, Y.-Y.; Tang, Y.-P. Therapeutic Potential of Hydroxysafflor Yellow A on Cardio-Cerebrovascular Diseases. Front. Pharmacol. 2020, 11, 01265. [Google Scholar] [CrossRef]
- Pei, J.-P.; Fan, L.-H.; Nan, K.; Li, J.; Dang, X.-Q.; Wang, K.-Z. HSYA alleviates secondary neuronal death through attenuating oxidative stress, inflammatory response, and neural apoptosis in SD rat spinal cord compression injury. J. Neuroinflammation 2017, 14, 97. [Google Scholar] [CrossRef]
- Ji, F.; Sadreyev, R.I. RNA-seq: Basic Bioinformatics Analysis. Curr. Protoc. Mol. Biol. 2018, 124, e68. [Google Scholar] [CrossRef]
- Cao, Y.; Kong, L.-B.; Huang, X.; Li, X.-L.; Chang, J.-L.; Gao, Y. Screening of key genes and pathways of ischemic stroke and prediction of traditional Chinese medicines based on bioinformatics. China J. Chin. Mater. Med 2021, 46, 1803–1812. [Google Scholar] [CrossRef]
- Barrett, T.; Wilhite, S.E.; Ledoux, P.; Evangelista, C.; Kim, I.F.; Tomashevsky, M.; Marshall, K.A.; Phillippy, K.H.; Sherman, P.M.; Holko, M.; et al. NCBI GEO: Archive for functional genomics data sets--update. Nucleic Acids Res. 2013, 41, D991–D995. [Google Scholar] [CrossRef] [Green Version]
- Barshir, R.; Fishilevich, S.; Iny-Stein, T.; Zelig, O.; Mazor, Y.; Guan-Golan, Y.; Safran, M.; Lancet, D. GeneCaRNA: A Comprehensive Gene-centric Database of Human Non-coding RNAs in the GeneCards Suite. J. Mol. Biol. 2021, 433, 166913. [Google Scholar] [CrossRef]
- Yang, Y.; Li, Y.; Wang, J.; Sun, K.; Tao, W.; Wang, Z.; Xiao, W.; Pan, Y.; Zhang, S.; Wang, Y. Systematic Investigation of Ginkgo Biloba Leaves for Treating Cardio-cerebrovascular Diseases in an Animal Model. ACS Chem. Biol. 2017, 12, 1363–1372. [Google Scholar] [CrossRef]
- UniProt Consortium. UniProt: The universal protein knowledgebase in 2021. Nucleic Acids Res. 2021, 49, D480–D489. [Google Scholar] [CrossRef]
- Paul, S.; Candelario-Jalil, E. Emerging neuroprotective strategies for the treatment of ischemic stroke: An overview of clinical and preclinical studies. Exp. Neurol. 2020, 335, 113518. [Google Scholar] [CrossRef]
- Rabinstein, A.A. Update on Treatment of Acute Ischemic Stroke. Contin. Lifelong Learn. Neurol. 2020, 26, 268–286. [Google Scholar] [CrossRef]
- Zhang, C.; Zhen, L.; Fang, Z.; Yu, L.; Zhang, Y.; Wei, H.; Jia, J.; Wang, S. Adiponectin Treatment Attenuates Cerebral Ischemia-Reperfusion Injury through HIF-1α-Mediated Antioxidation in Mice. Oxidative Med. Cell. Longev. 2021, 2021, 5531048. [Google Scholar] [CrossRef]
- Li, Z.; Xiao, G.; Wang, H.; He, S.; Zhu, Y. A preparation of Ginkgo biloba L. leaves extract inhibits the apoptosis of hippocampal neurons in post-stroke mice via regulating the expression of Bax/Bcl-2 and Caspase-3. J. Ethnopharmacol. 2021, 280, 114481. [Google Scholar] [CrossRef]
- Ruan, J.; Wang, L.; Dai, J.; Li, J.; Wang, N.; Seto, S. Hydroxysafflor Yellow a Promotes Angiogenesis in Rat Brain Microvascular Endothelial Cells Injured by Oxygen-glucose Deprivation/reoxygenation(OGD/R) through SIRT1-HIF-1α-VEGFA Signaling Pathway. Curr. Neurovascular Res. 2021, 18, 415–426. [Google Scholar] [CrossRef]
- Wei, K.; Wang, P.; Miao, C.-Y. A Double-Edged Sword with Therapeutic Potential: An Updated Role of Autophagy in Ischemic Cerebral Injury. CNS Neurosci. Ther. 2012, 18, 879–886. [Google Scholar] [CrossRef]
- Ho, T.T.; Warr, M.R.; Adelman, E.R.; Lansinger, O.M.; Flach, J.; Verovskaya, E.V.; Figueroa, M.E.; Passegué, E. Autophagy maintains the metabolism and function of young and old stem cells. Nature 2017, 543, 205–210. [Google Scholar] [CrossRef] [Green Version]
- Wang, P.; Shao, B.-Z.; Deng, Z.; Chen, S.; Yue, Z.; Miao, C.-Y. Autophagy in ischemic stroke. Prog. Neurobiol. 2018, 163–164, 98–117. [Google Scholar] [CrossRef]
- Ginet, V.; Spiehlmann, A.; Rummel, C.; Rudinskiy, N.; Grishchuk, Y.; Luthi-Carter, R.; Clarke, P.G.; Truttmann, A.C.; Puyal, J. Involvement of autophagy in hypoxic-excitotoxic neuronal death. Autophagy 2014, 10, 846–860. [Google Scholar] [CrossRef] [Green Version]
- Loos, B.; Klionsky, D.J.; Du Toit, A.; Hofmeyr, J.-H.S. On the relevance of precision autophagy flux control in vivo—Points of departure for clinical translation. Autophagy 2019, 16, 750–762. [Google Scholar] [CrossRef]
- Sun, Y.; Zhang, T.; Zhang, Y.; Li, J.; Jin, L.; Sun, Y.; Shi, N.; Liu, K.; Sun, X. Ischemic Postconditioning Alleviates Cerebral Ischemia–Reperfusion Injury Through Activating Autophagy During Early Reperfusion in Rats. Neurochem. Res. 2018, 43, 1826–1840. [Google Scholar] [CrossRef] [Green Version]
- Zhang, Y.; Zhang, Y.; Jin, X.-F.; Zhou, X.-H.; Dong, X.-H.; Yu, W.-T.; Gao, W.-J. The Role of Astragaloside IV against Cerebral Ischemia/Reperfusion Injury: Suppression of Apoptosis via Promotion of P62-LC3-Autophagy. Molecules 2019, 24, 1838. [Google Scholar] [CrossRef] [Green Version]
- Li, Q.; Yin, Y.; Zheng, Y.; Chen, F.; Jin, P. Inhibition of autophagy promoted high glucose/ROS-mediated apoptosis in ADSCs. Stem Cell Res. Ther. 2018, 9, 289. [Google Scholar] [CrossRef]
- Song, S.; Tan, J.; Miao, Y.; Li, M.; Zhang, Q. Crosstalk of autophagy and apoptosis: Involvement of the dual role of autophagy under ER stress. J. Cell. Physiol. 2017, 232, 2977–2984. [Google Scholar] [CrossRef]
- Nasiri-Ansari, N.; Nikolopoulou, C.; Papoutsi, K.; Kyrou, I.; Mantzoros, C.; Kyriakopoulos, G.; Chatzigeorgiou, A.; Kalotychou, V.; Randeva, M.; Chatha, K.; et al. Empagliflozin Attenuates Non-Alcoholic Fatty Liver Disease (NAFLD) in High Fat Diet Fed ApoE(-/-) Mice by Activating Autophagy and Reducing ER Stress and Apoptosis. Int. J. Mol. Sci. 2021, 22, 818. [Google Scholar] [CrossRef]
- Lu, Z.; Miao, Y.; Muhammad, I.; Tian, E.; Hu, W.; Wang, J.; Wang, B.; Li, R.; Li, J. Colistin-induced autophagy and apoptosis involves the JNK-Bcl2-Bax signaling pathway and JNK-p53-ROS positive feedback loop in PC-12 cells. Chem. Interact. 2017, 277, 62–73. [Google Scholar] [CrossRef]
- Guo, X.; Wang, Y.; Zheng, D.; Cheng, X.; Sun, Y. LncRNA-MIAT promotes neural cell autophagy and apoptosis in ischemic stroke by up-regulating REDD1. Brain Res. 2021, 1763, 147436. [Google Scholar] [CrossRef]
- Cui, Q.; Ma, Y.-H.; Yu, H.-Y.; Zhang, Y.-L.; Qin, X.-D.; Ge, S.-Q.; Zhang, G.-W. Systematic analysis of the mechanism of hydroxysafflor yellow A for treating ischemic stroke based on network pharmacology technology. Eur. J. Pharmacol. 2021, 908, 174360. [Google Scholar] [CrossRef]
- Fu, Z.-J.; Wang, Z.-Y.; Xu, L.; Chen, X.-H.; Li, X.-X.; Liao, W.-T.; Ma, H.-K.; Jiang, M.-D.; Xu, T.-T.; Xu, J.; et al. HIF-1α-BNIP3-mediated mitophagy in tubular cells protects against renal ischemia/reperfusion injury. Redox Biol. 2020, 36, 101671. [Google Scholar] [CrossRef]
- Yu, H.; Chen, B.; Ren, Q. Baicalin relieves hypoxia-aroused H9c2 cell apoptosis by activating Nrf2/HO-1-mediated HIF1α/BNIP3 pathway. Artif. Cells Nanomed. Biotechnol. 2019, 47, 3657–3663. [Google Scholar] [CrossRef] [Green Version]
- Zhang, Y.; Liu, Y.; Cui, Q.; Fu, Z.; Yu, H.; Liu, A.; Liu, J.; Qin, X.; Ge, S.; Zhang, G. Hydroxysafflor Yellow A Alleviates Ischemic Stroke in Rats via HIF-1α, BNIP3, and Notch1-Mediated Inhibition of Autophagy. Am. J. Chin. Med. 2022, 50, 799–815. [Google Scholar] [CrossRef]


Publisher’s Note: MDPI stays neutral with regard to jurisdictional claims in published maps and institutional affiliations. |
© 2022 by the authors. Licensee MDPI, Basel, Switzerland. This article is an open access article distributed under the terms and conditions of the Creative Commons Attribution (CC BY) license (https://creativecommons.org/licenses/by/4.0/).
Share and Cite
Wei, R.; Song, L.; Miao, Z.; Liu, K.; Han, G.; Zhang, H.; Ma, D.; Huang, J.; Tian, H.; Xiao, B.; et al. Hydroxysafflor Yellow A Exerts Neuroprotective Effects via HIF-1α/BNIP3 Pathway to Activate Neuronal Autophagy after OGD/R. Cells 2022, 11, 3726. https://doi.org/10.3390/cells11233726
Wei R, Song L, Miao Z, Liu K, Han G, Zhang H, Ma D, Huang J, Tian H, Xiao B, et al. Hydroxysafflor Yellow A Exerts Neuroprotective Effects via HIF-1α/BNIP3 Pathway to Activate Neuronal Autophagy after OGD/R. Cells. 2022; 11(23):3726. https://doi.org/10.3390/cells11233726
Chicago/Turabian StyleWei, Ruheng, Lijuan Song, Zhuyue Miao, Kexin Liu, Guangyuan Han, Haifei Zhang, Dong Ma, Jianjun Huang, Hao Tian, Baoguo Xiao, and et al. 2022. "Hydroxysafflor Yellow A Exerts Neuroprotective Effects via HIF-1α/BNIP3 Pathway to Activate Neuronal Autophagy after OGD/R" Cells 11, no. 23: 3726. https://doi.org/10.3390/cells11233726