
Melatonin Attenuates Ischemic-like Cell Injury by Promoting Autophagosome Maturation via the Sirt1/FoxO1/Rab7 Axis in Hippocampal HT22 Cells and in Organotypic Cultures
 , , , , ,
  and
and 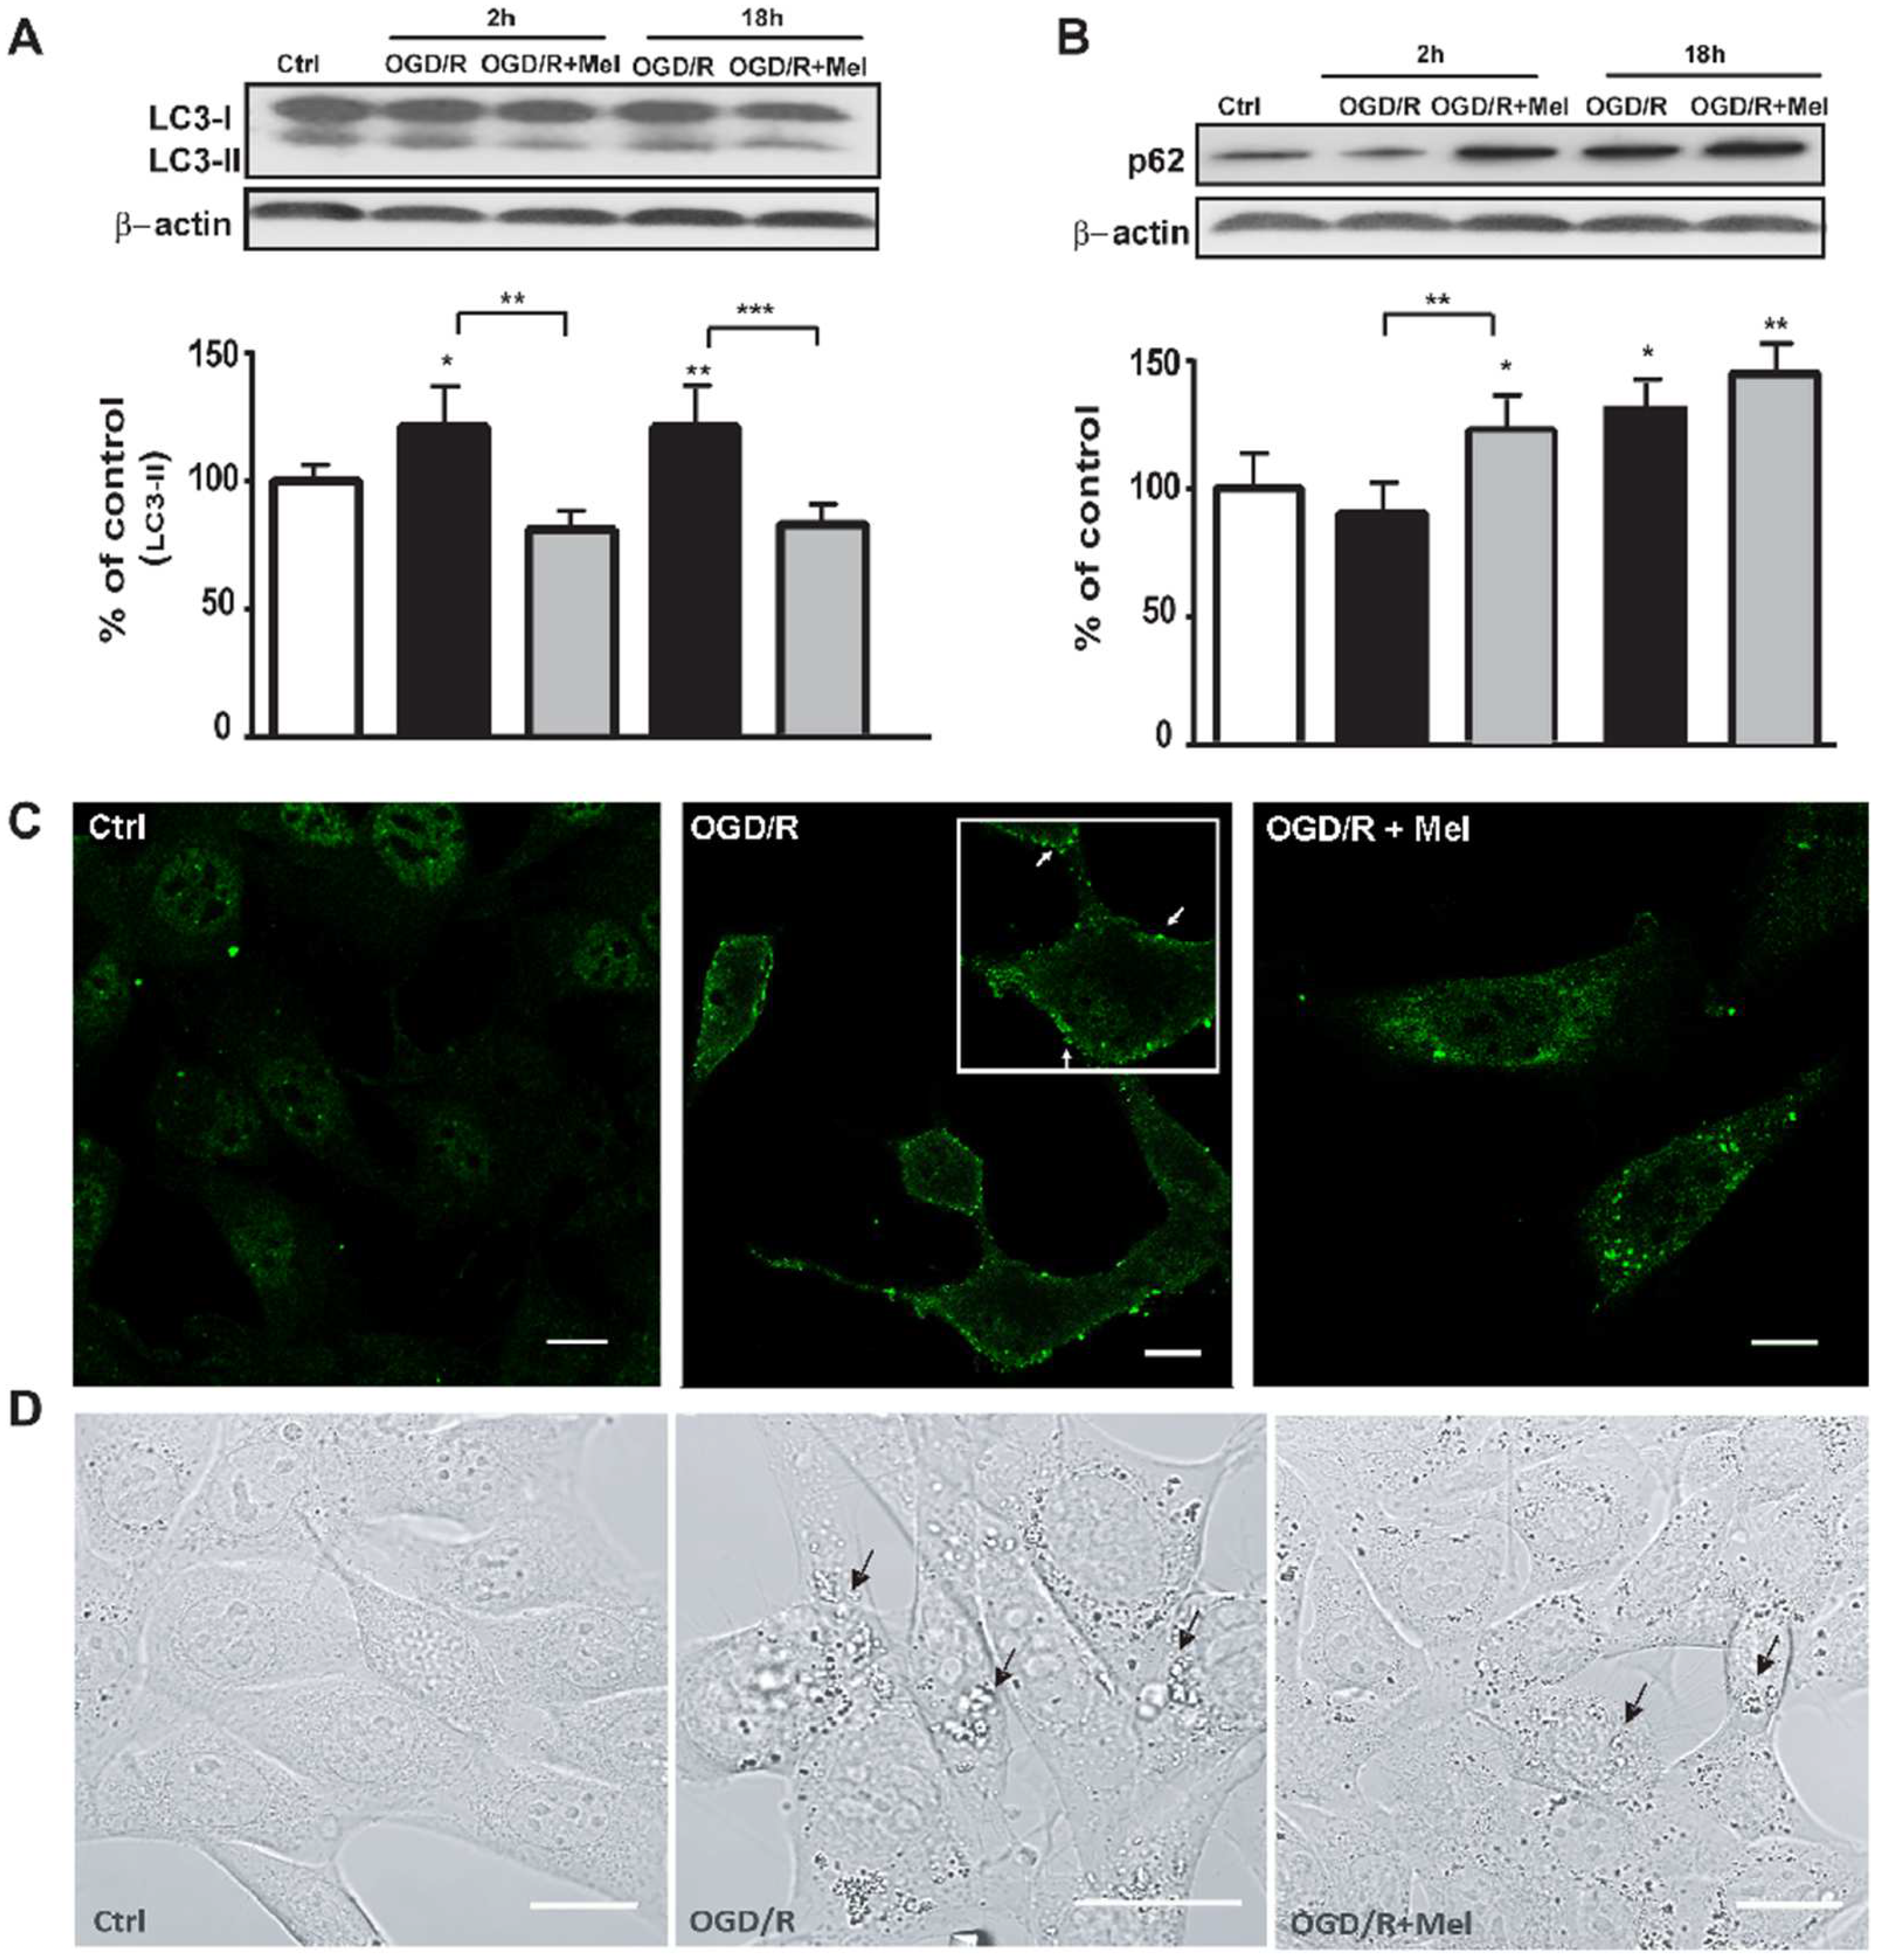
Abstract
:1. Introduction
2. Materials and Methods
2.1. Cell Cultures
2.2. Organotypic Hippocampal Slice Cultures
2.3. Simulation of In Vitro Ischemia with Oxygen–Glucose Deprivation (OGD)
2.4. Drug Treatments
2.5. Determination and Localization of Acid Organelles by LysoTracker Green-Uptake
2.6. Immunofluorescence
2.7. Transmission Electron Microscopy (TEM)
2.8. Western Blot Analysis
2.9. Injury Assessment in HT22 Cells and Organotypic Hippocampal Slice Cultures
2.10. Statistical Analyses
3. Results
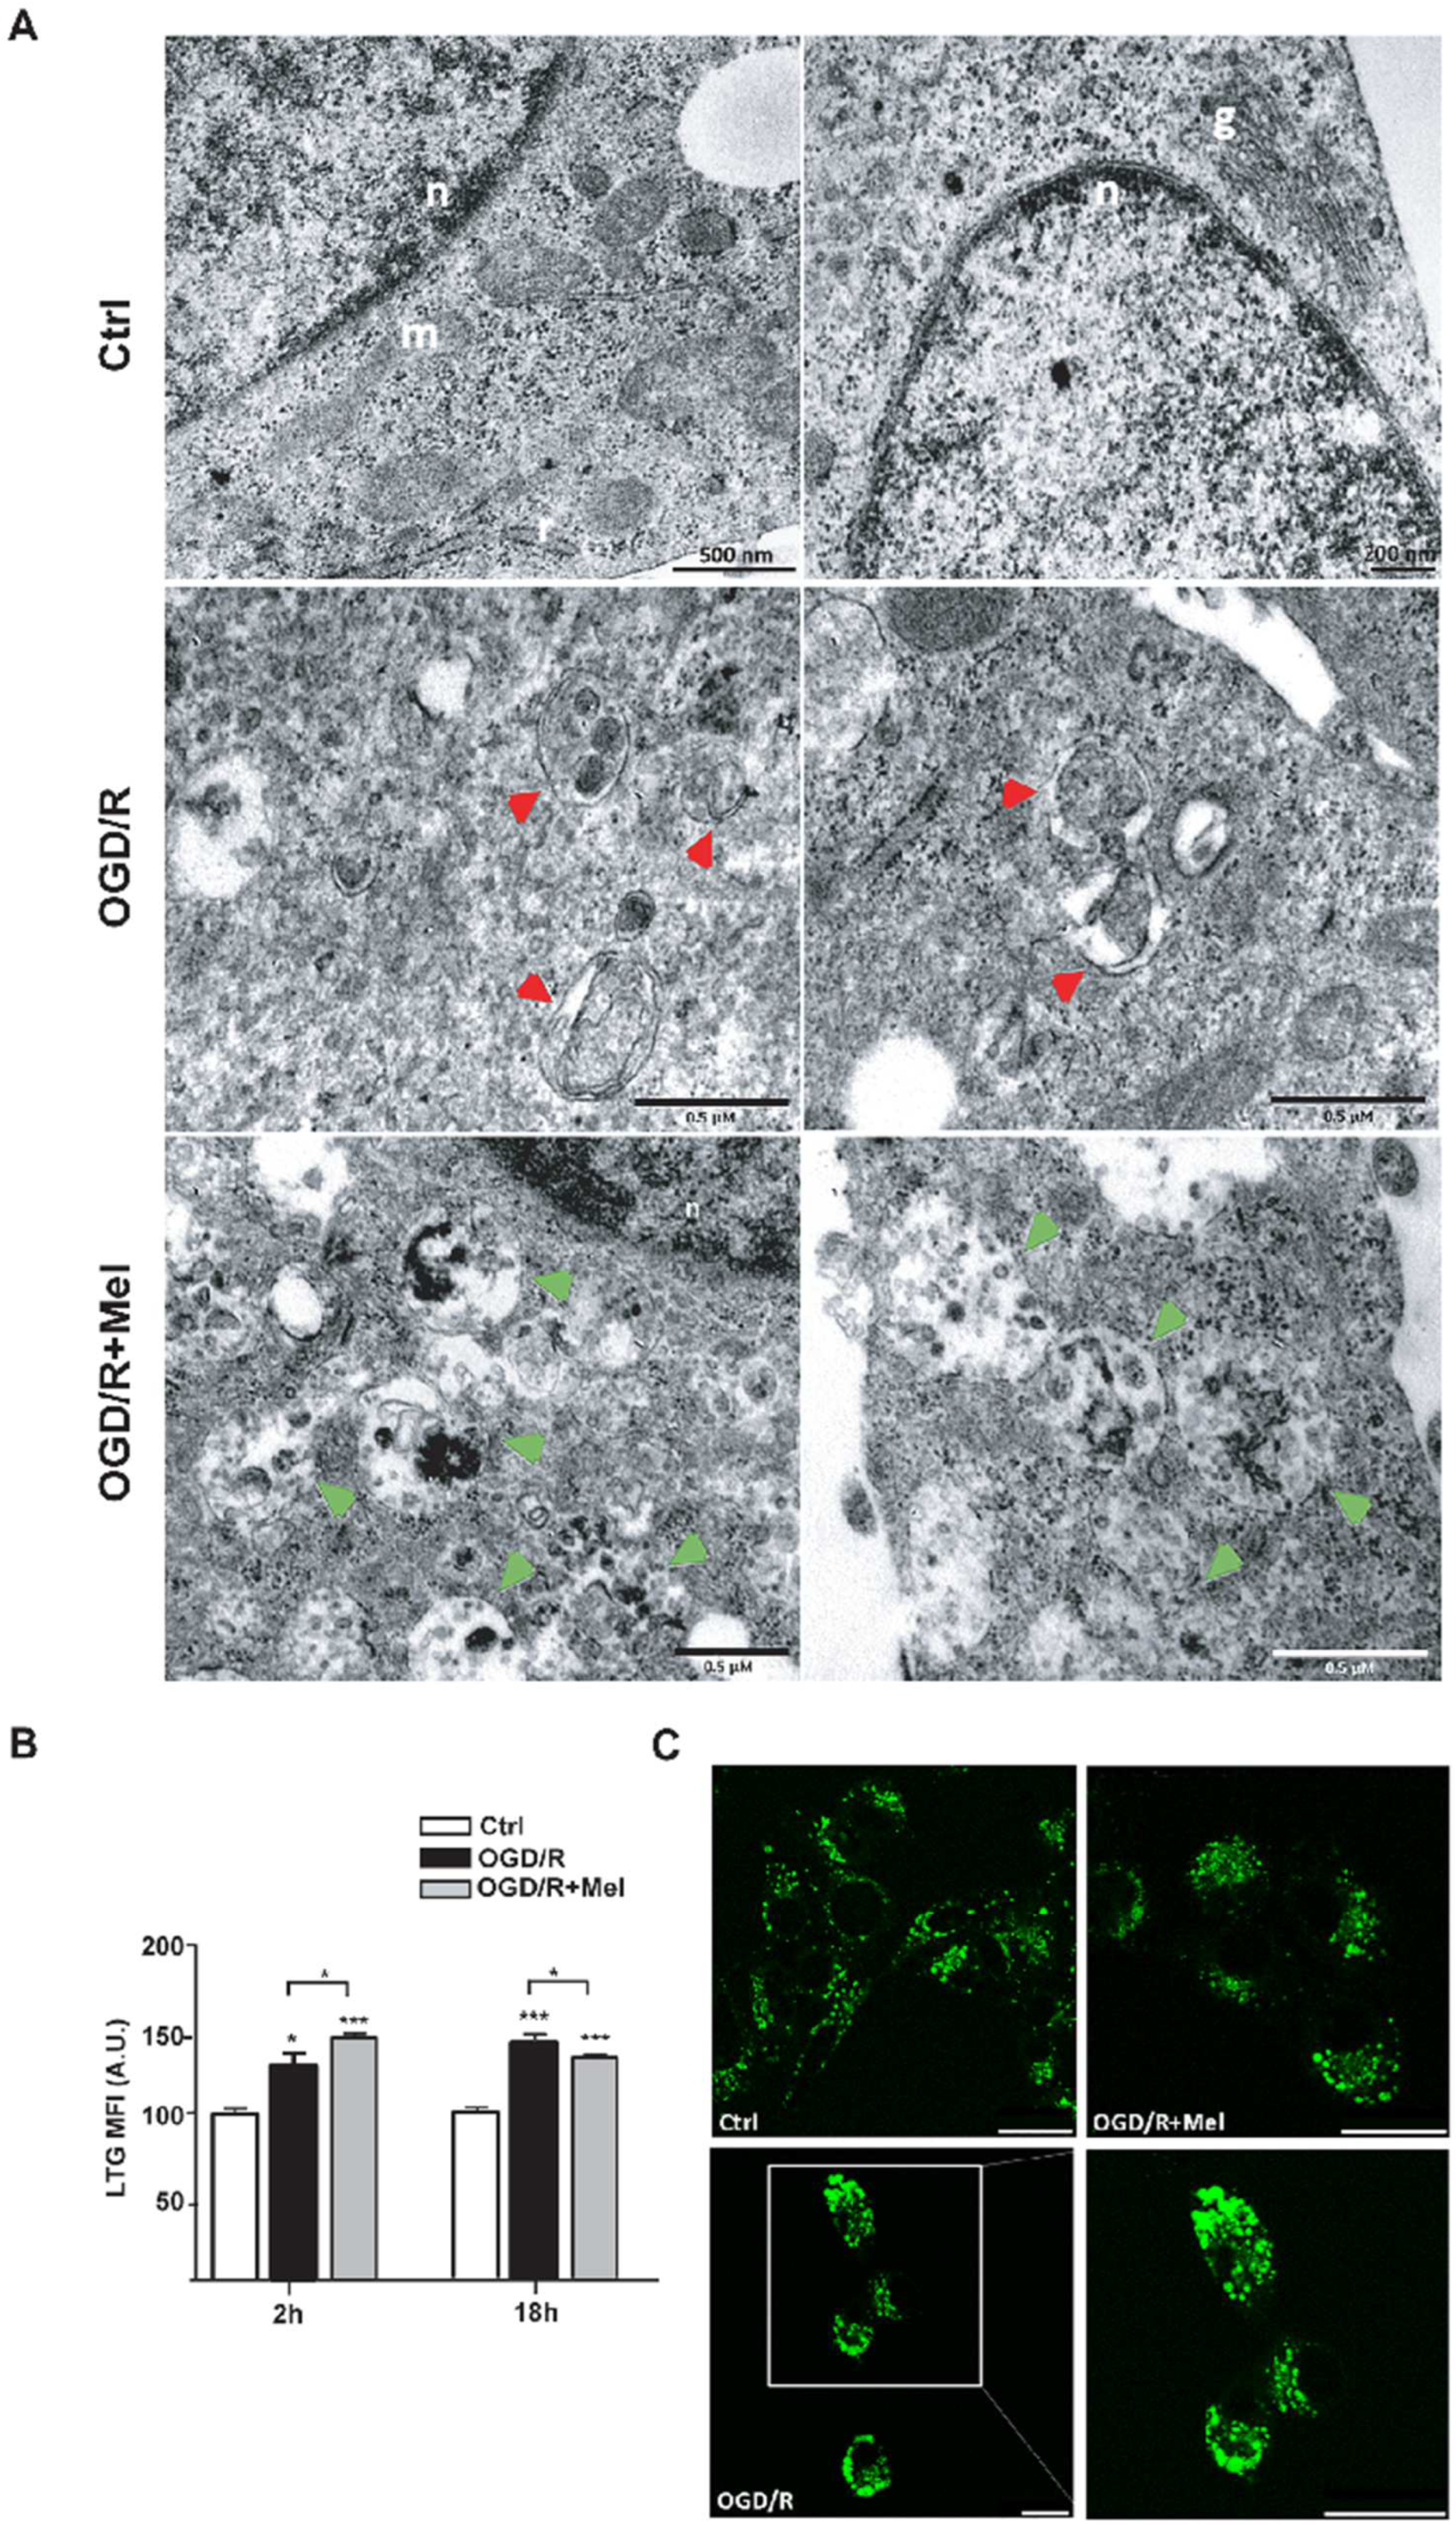
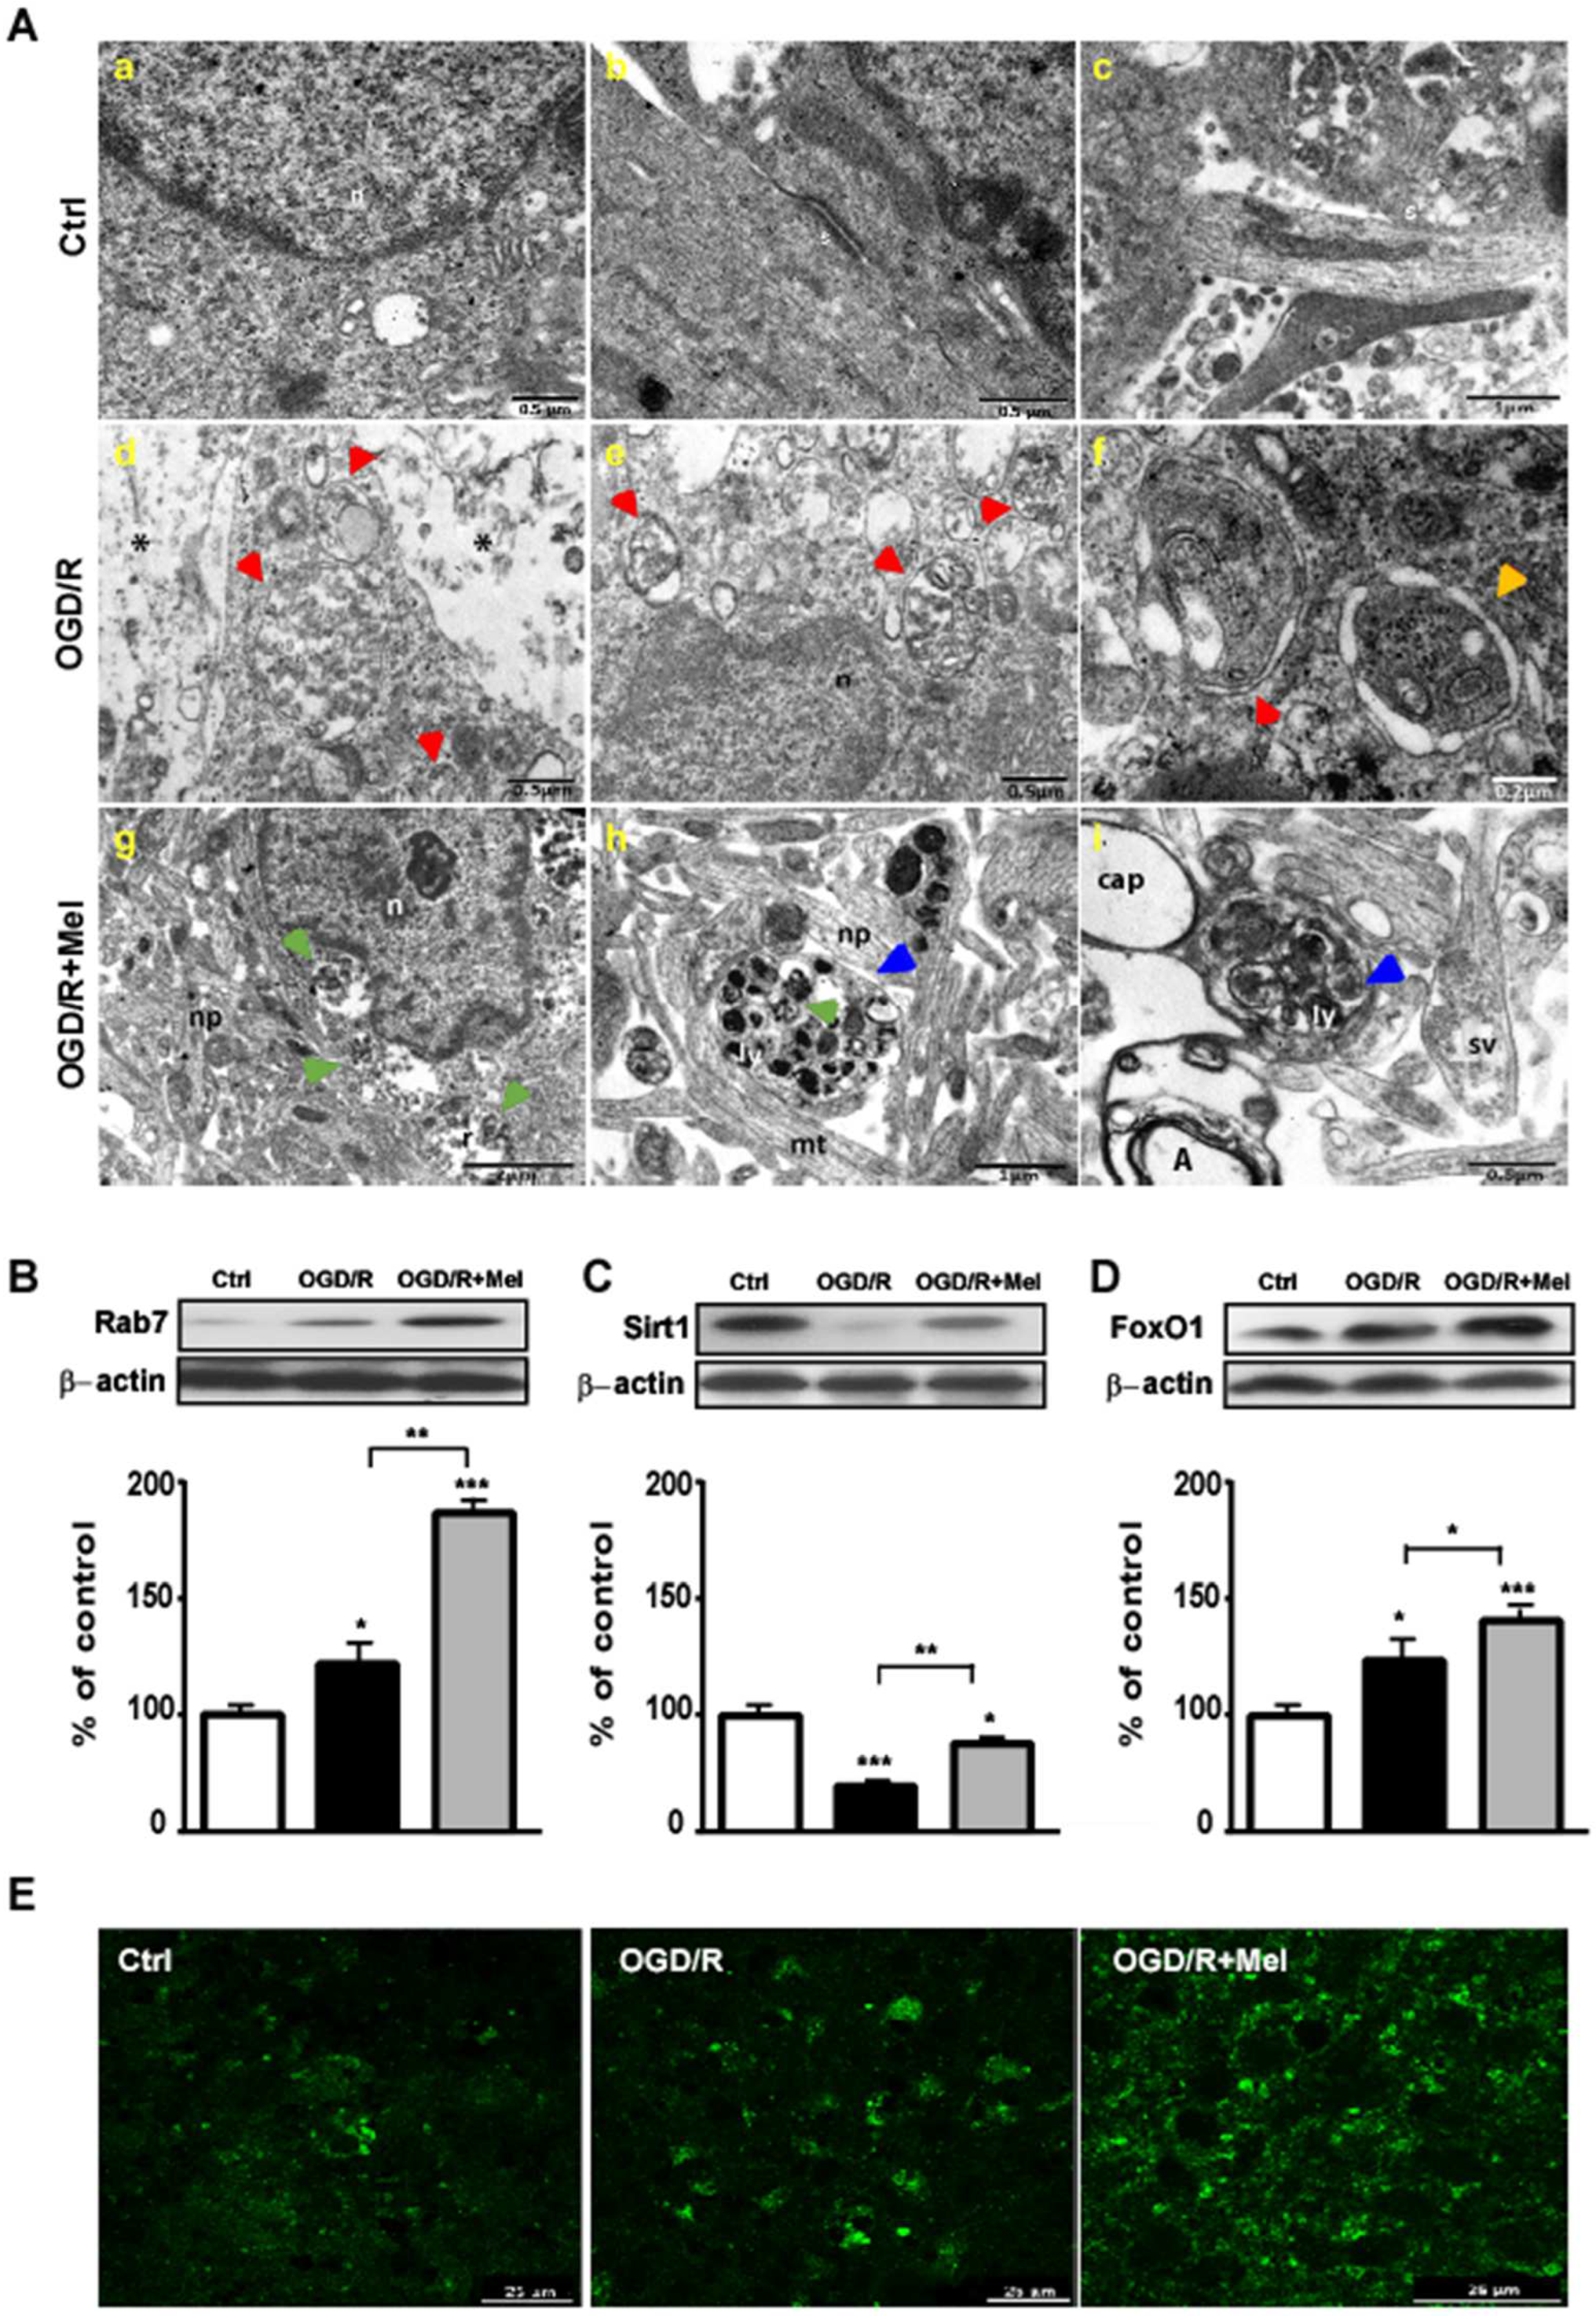
3.1. Melatonin Modulates Autophagy and Speeds up Autophagosomes Maturation during OGD/R in HT22 Cells
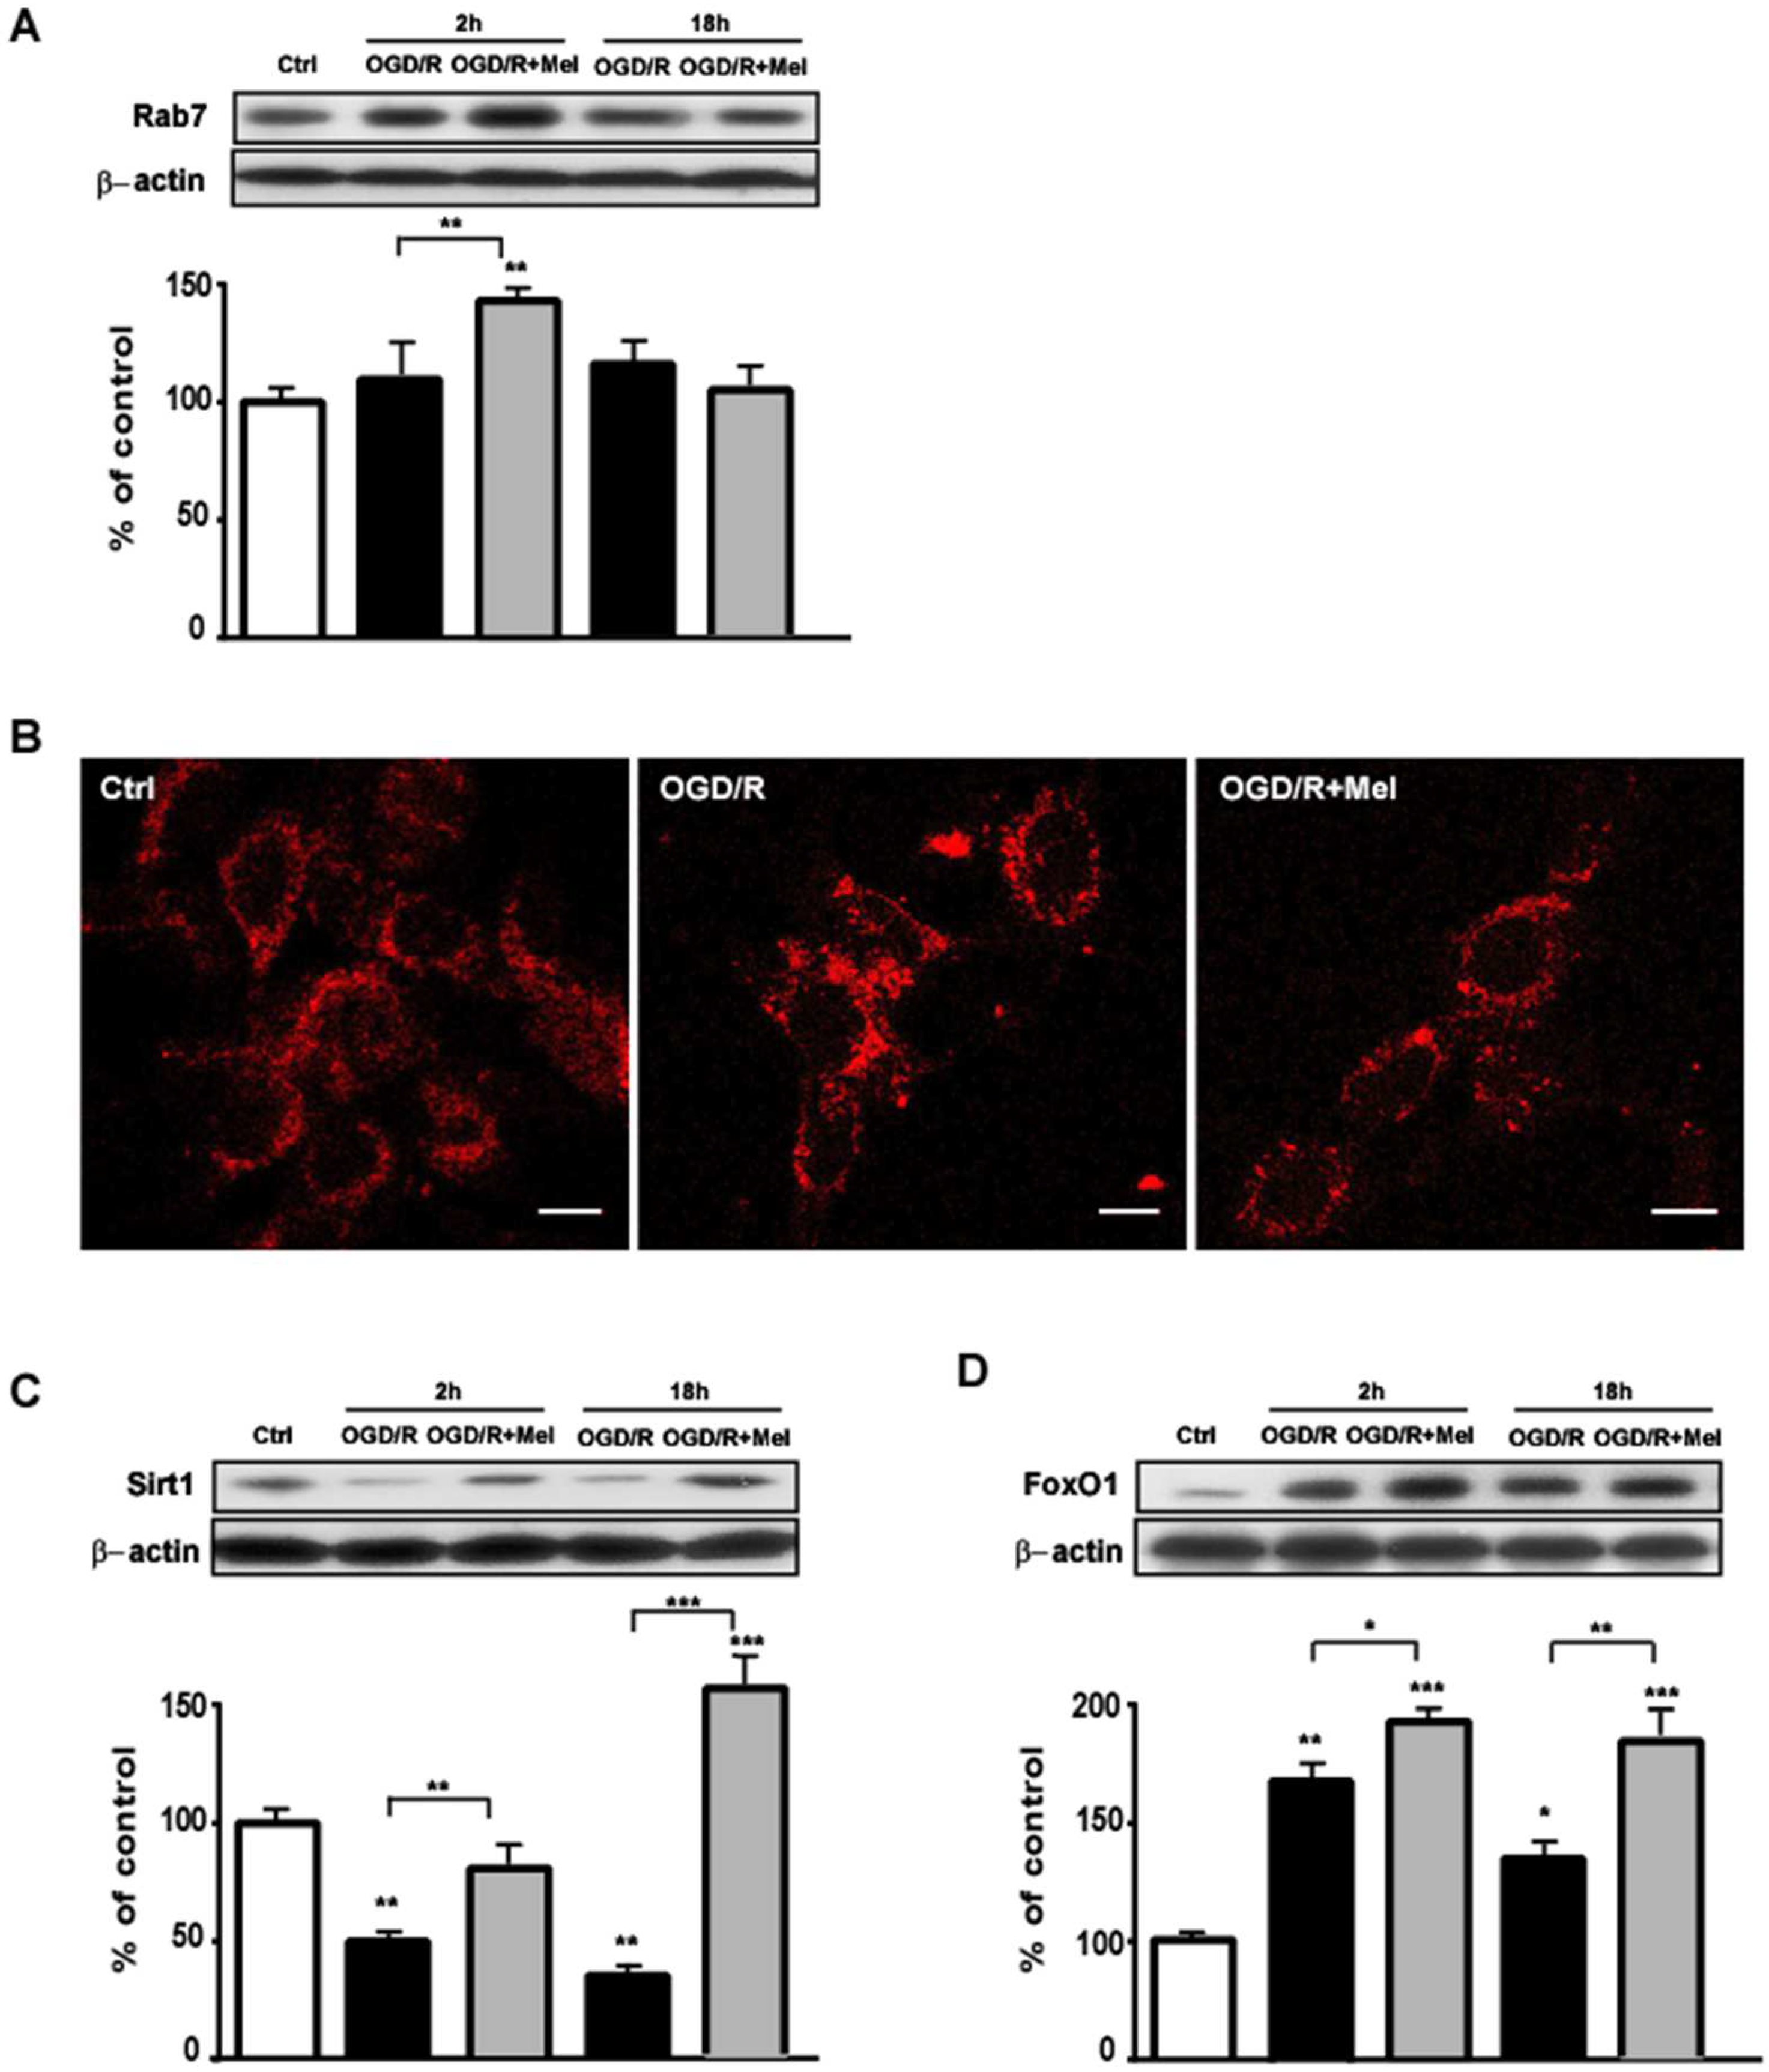
3.2. Melatonin Modulates the Sirt1/FoxO1/Rab7 Axis Involved in Autophagosomes Maturation during OGD/R in HT22 Cells
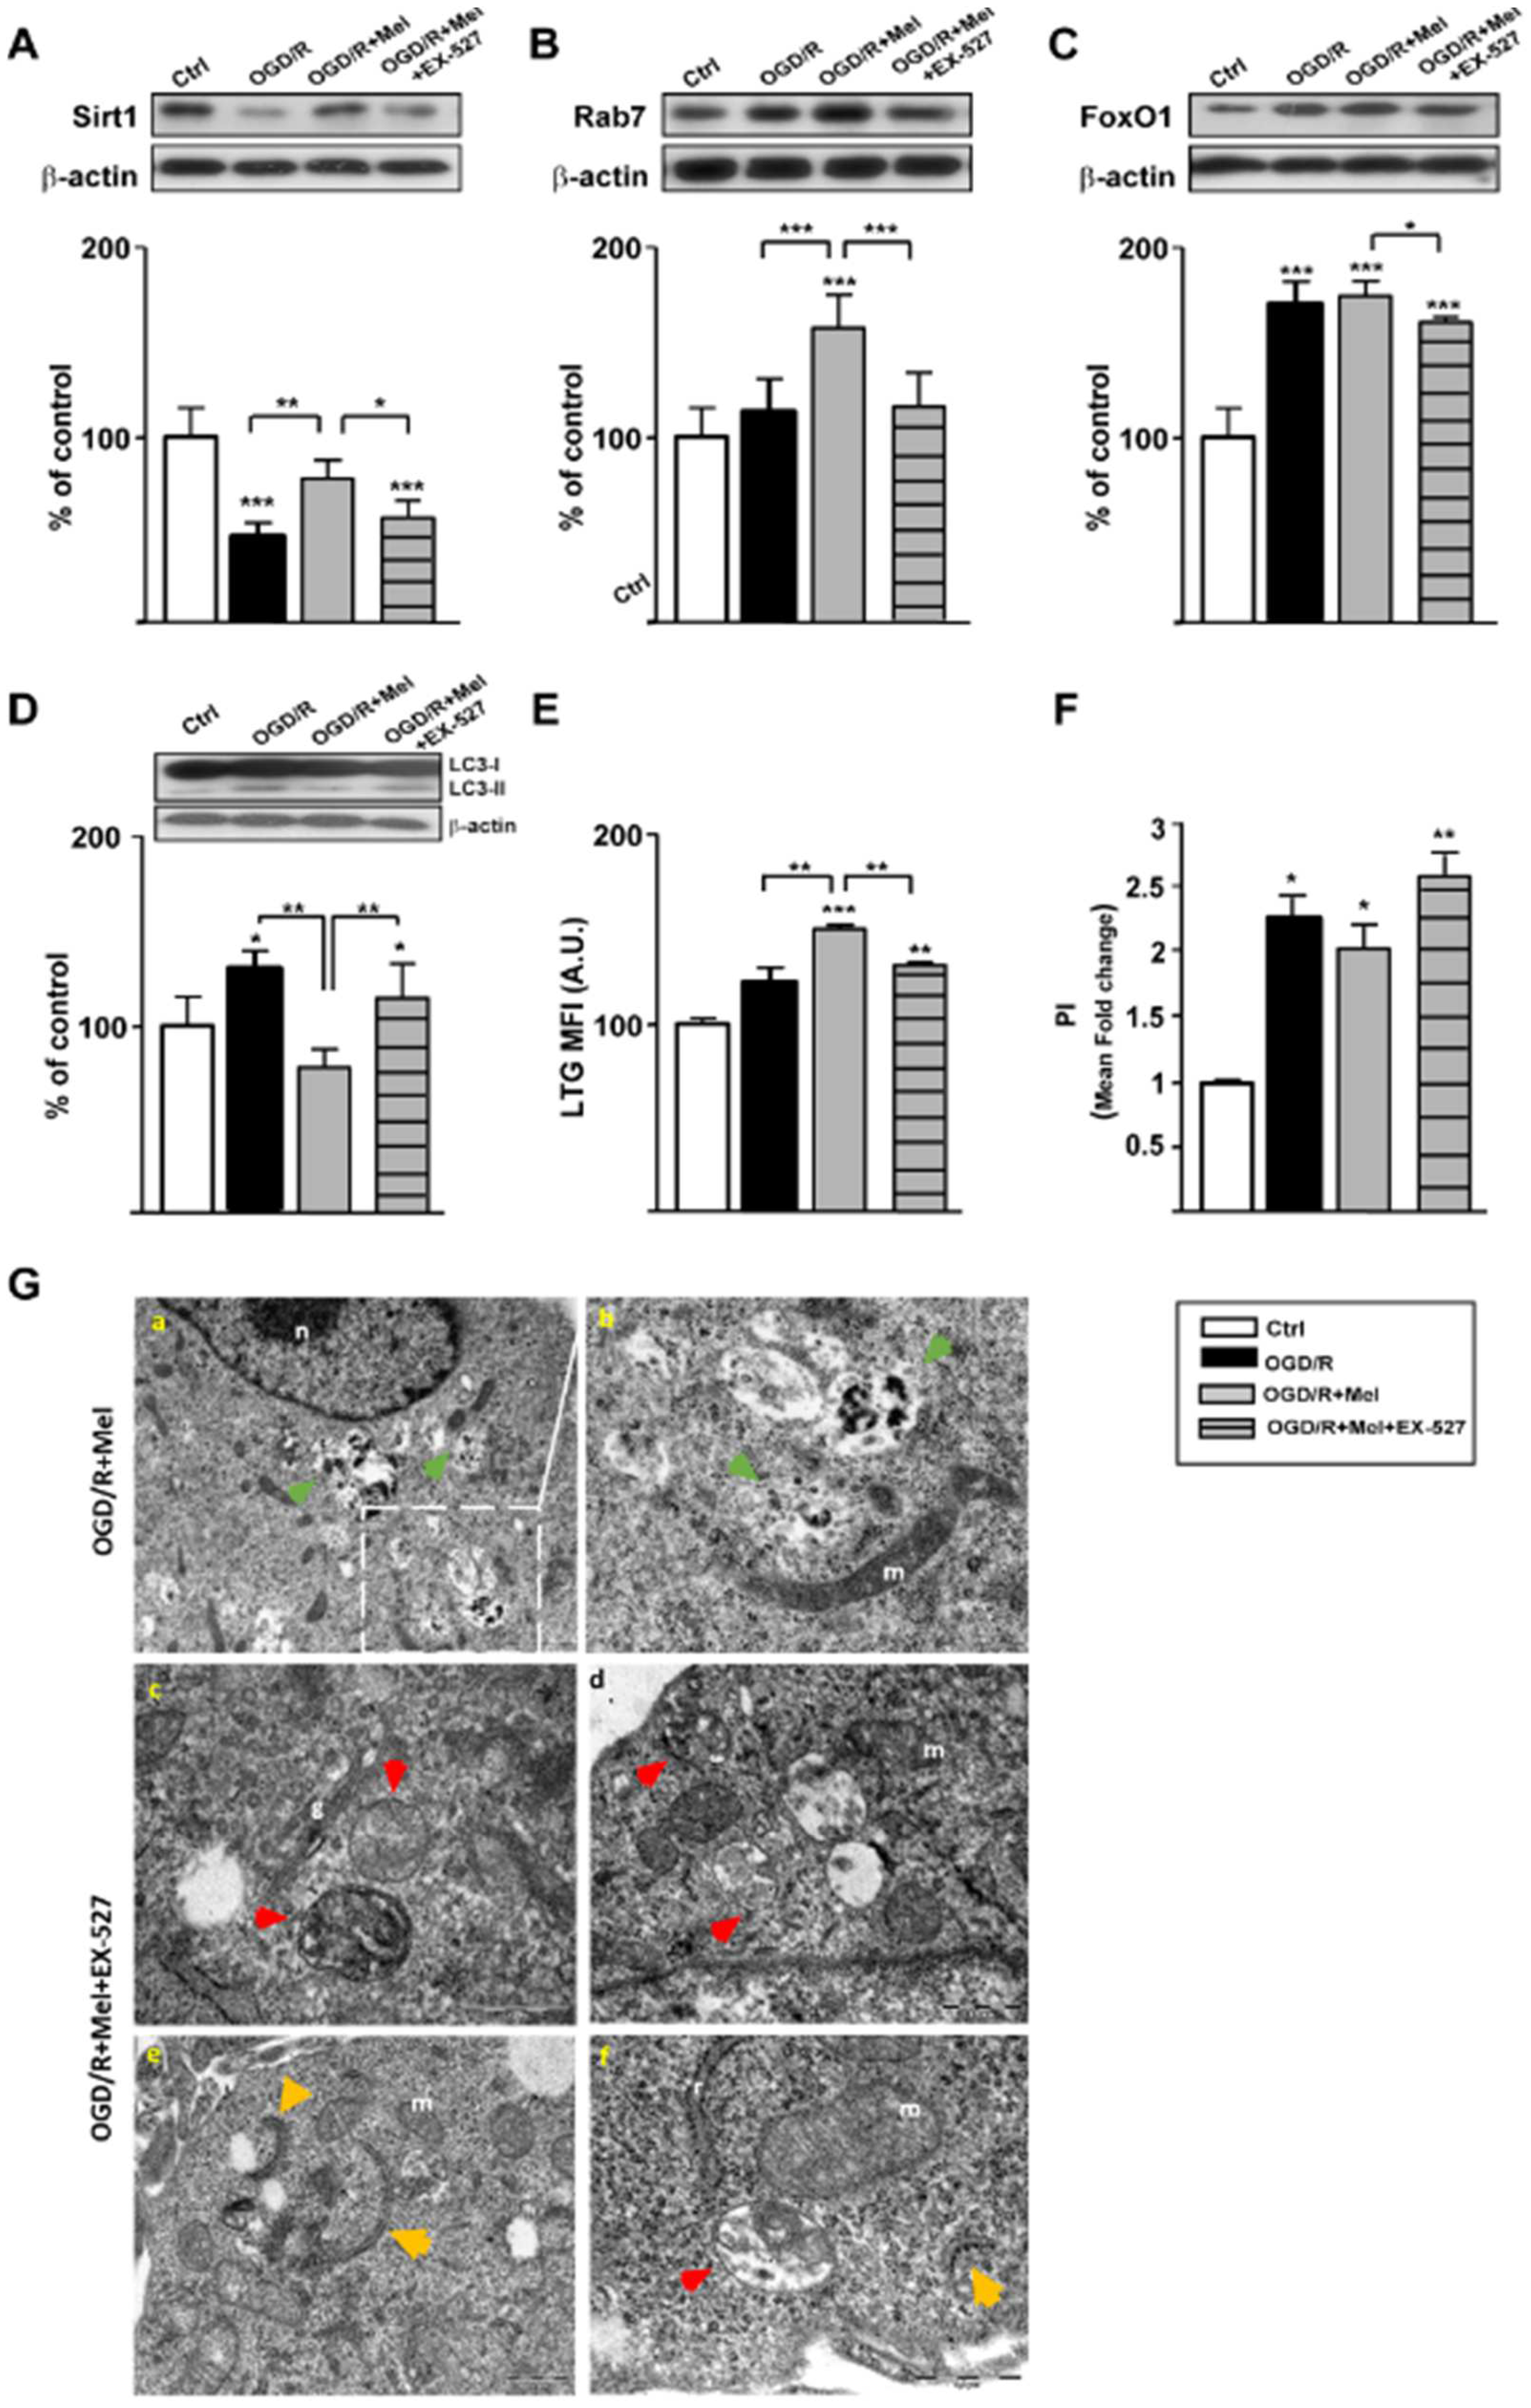
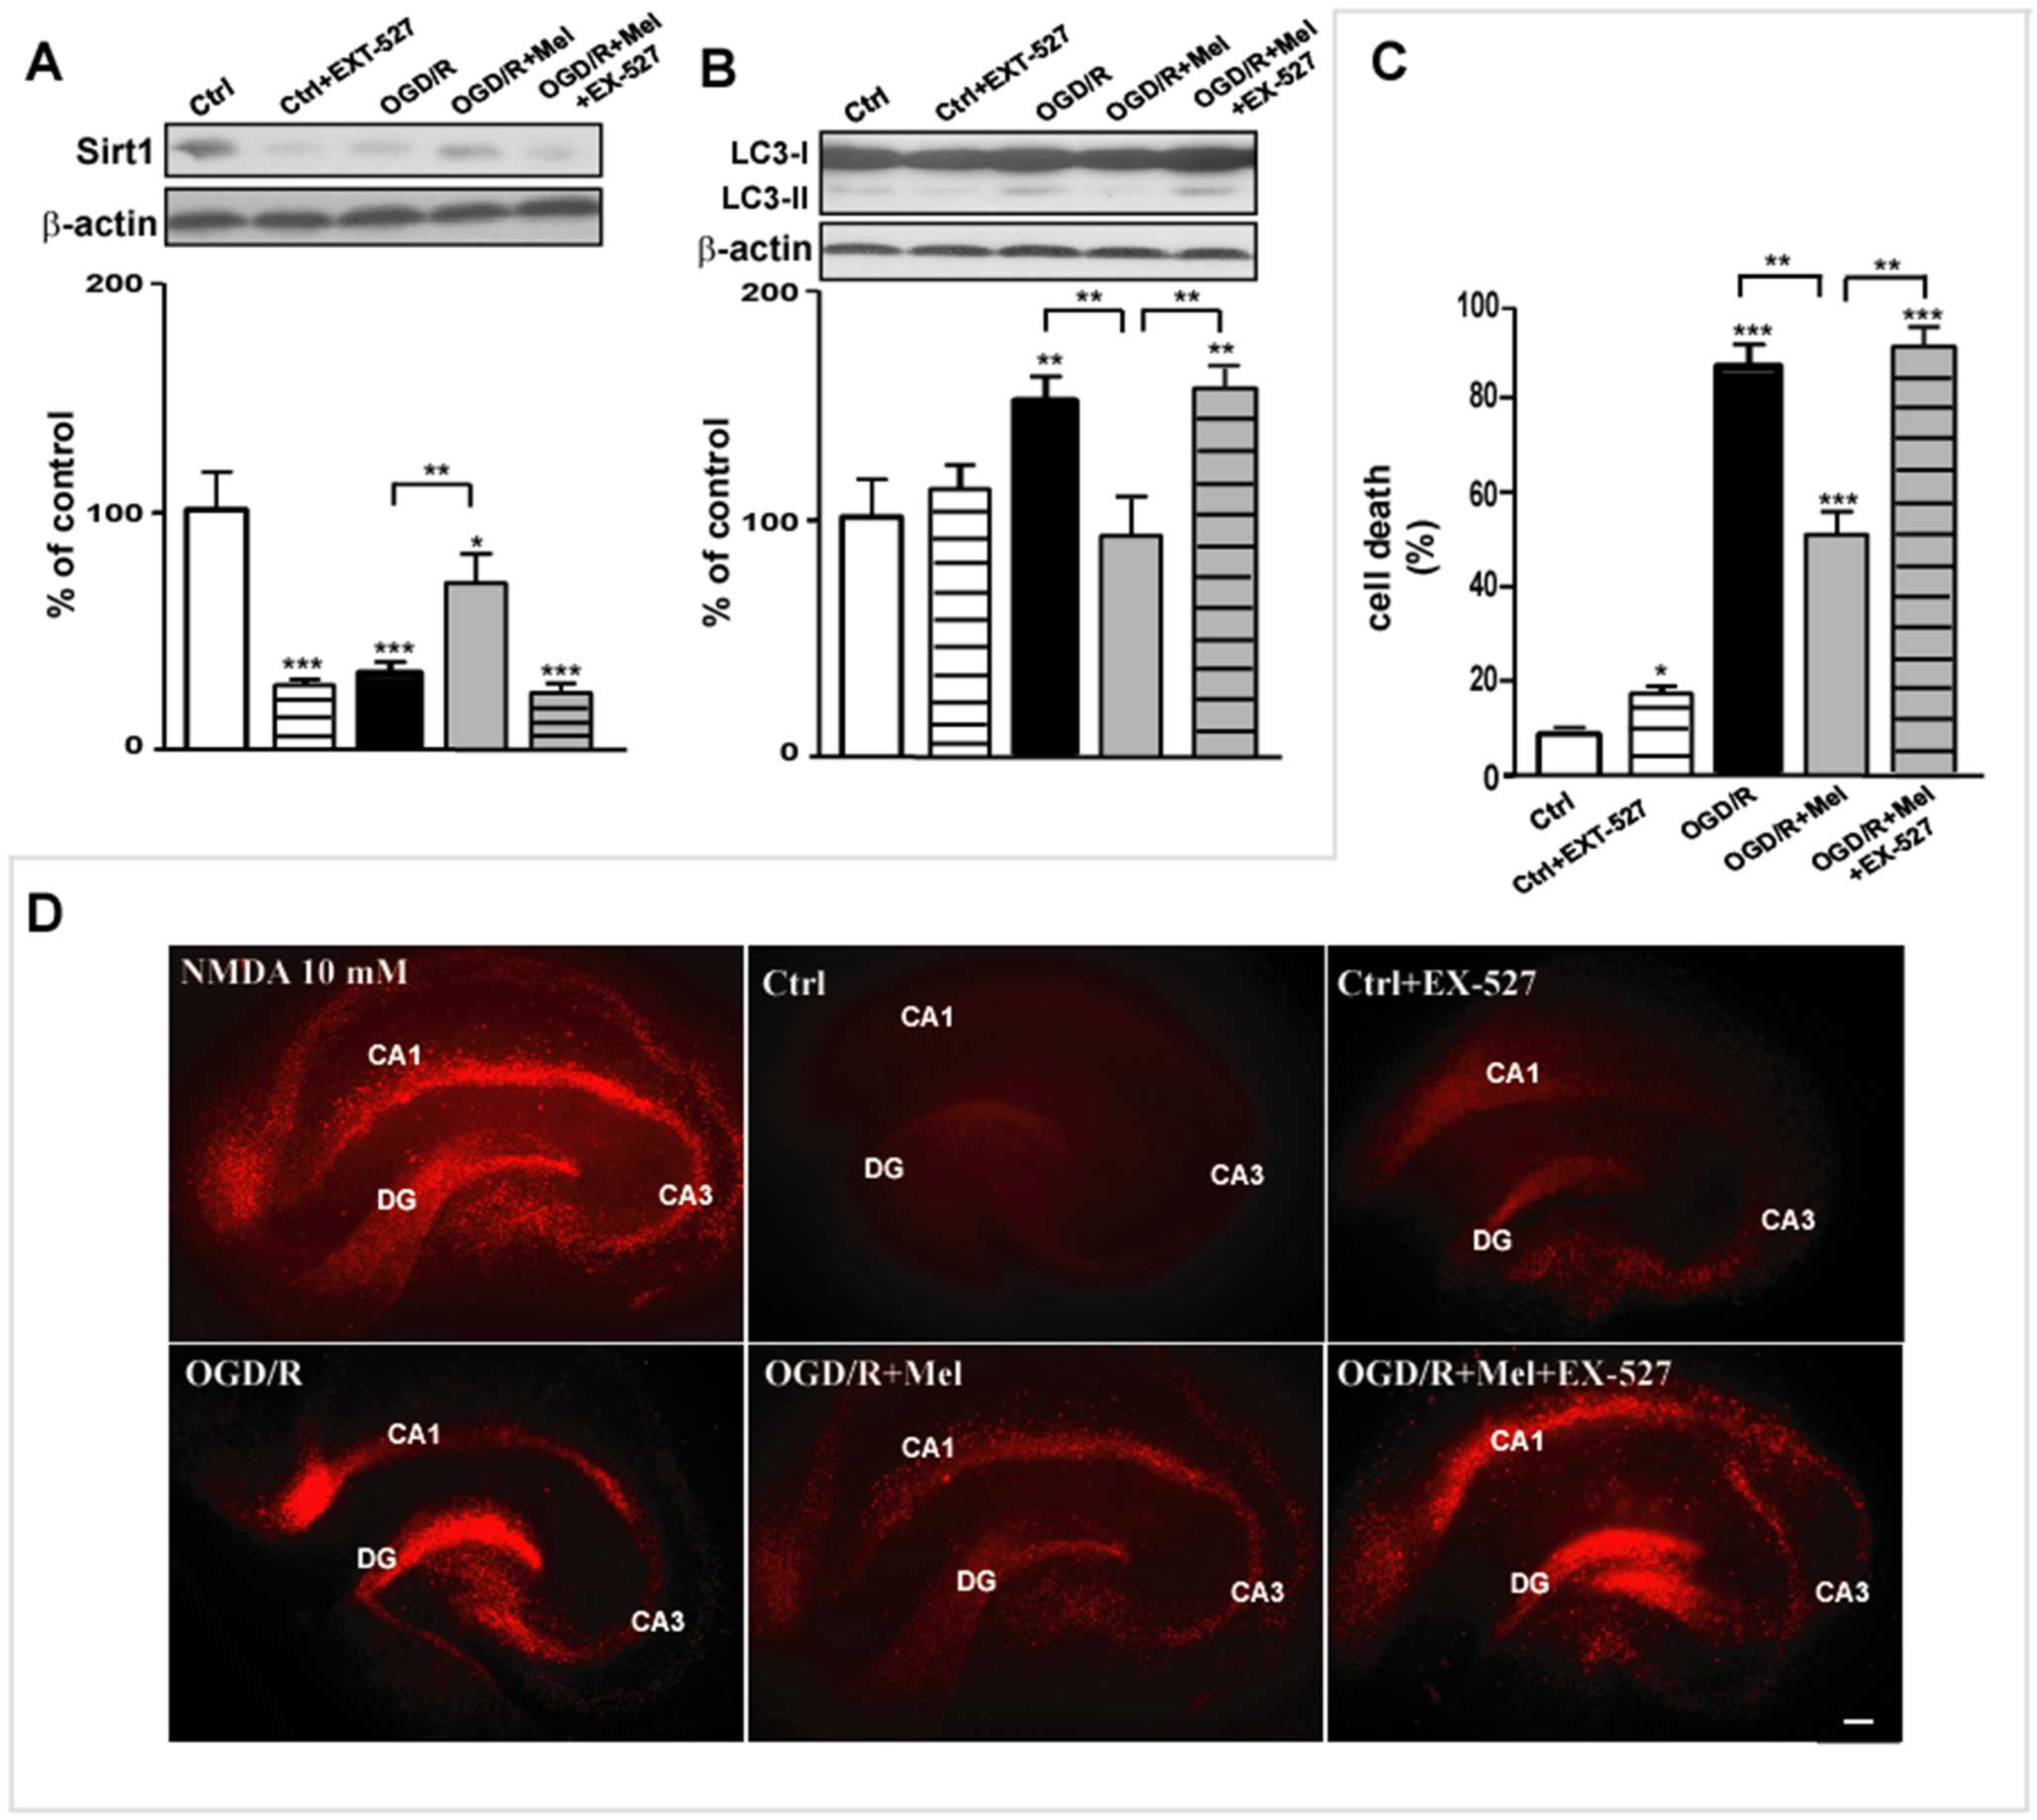
3.3. Melatonin Promotes Autophagosomal Maturation through the Activation of Sirt1/FoxO1/Rab7 Axis during OGD/R in Organotypic Hippocampal Slice Cultures of Neonatal Rats
4. Discussion
Author Contributions
Funding
Institutional Review Board Statement
Informed Consent Statement
Data Availability Statement
Acknowledgments
Conflicts of Interest
Abbreviations
| AL | autolysosome |
| AP | autophagosome |
| FoxO1 | Forkhead box class O1 |
| Mel | melatonin |
| OGD/R | oxygen-glucose deprivation/reoxygenation |
| Rab 7 | Ras-related protein 7 |
| Sirt1: | Silent information regulator 1 |
References
- Ravikumar, B.; Sarkar, S.; Davies, J.E.; Futter, M.; Garcia-Arencibia, M.; Green-Thompson, Z.W.; Jimenez-Sanchez, M.; Korolchuk, V.; Lichtenberg, M.; Luo, S.; et al. Regulation of Mammalian Autophagy in Physiology and Pathophysiology. Physiol. Rev. 2010, 90, 1383–1435. [Google Scholar] [CrossRef] [PubMed] [Green Version]
- Rubinsztein, D.C.; Shpilka, T.; Elazar, Z. Mechanisms of Autophagosome Biogenesis. Curr. Biol. 2012, 22, R29–R34. [Google Scholar] [CrossRef] [PubMed] [Green Version]
- Jahn, R.; Scheller, R.H. SNAREs—Engines for membrane fusion. Nat. Rev. Mol. Cell Biol. 2006, 7, 631–643. [Google Scholar] [CrossRef] [PubMed]
- Yu, I.-M.; Hughson, F.M. Tethering Factors as Organizers of Intracellular Vesicular Traffic. Annu. Rev. Cell Dev. Biol. 2010, 26, 137–156. [Google Scholar] [CrossRef] [PubMed]
- Langemeyer, L.; Fröhlich, F.; Ungermann, C. Rab GTPase Function in Endosome and Lysosome Biogenesis. Trends Cell Biol. 2018, 28, 957–970. [Google Scholar] [CrossRef] [PubMed]
- Fukuda, M. Membrane traffic in the secretory pathway. Cell. Mol. Life Sci. 2008, 65, 2801–2813. [Google Scholar] [CrossRef] [PubMed]
- Hutagalung, A.H.; Novick, P.J. Role of Rab GTPases in Membrane Traffic and Cell Physiology. Physiol. Rev. 2011, 91, 119–149. [Google Scholar] [CrossRef] [PubMed] [Green Version]
- Feng, Y.; Press, B.; Wandinger-Ness, A. Rab 7: An important regulator of late endocytic membrane traffic. J. Cell Biol. 1995, 131, 1435–1452. [Google Scholar] [CrossRef] [Green Version]
- Ao, X.; Zou, L.; Wu, Y. Regulation of autophagy by the Rab GTPase network. Cell Death Differ. 2014, 21, 348–358. [Google Scholar] [CrossRef] [Green Version]
- Mizuno-Yamasaki, E.; Rivera-Molina, F.; Novick, P. GTPase Networks in Membrane Traffic. Annu. Rev. Biochem. 2012, 81, 637–659. [Google Scholar] [CrossRef]
- Furuta, N.; Fujita, N.; Noda, T.; Yoshimori, T.; Amano, A. Combinational Soluble N-Ethylmaleimide-sensitive Factor Attachment Protein Receptor Proteins VAMP8 and Vti1b Mediate Fusion of Antimicrobial and Canonical Autophagosomes with Lysosomes. Mol. Biol. Cell 2010, 21, 1001–1010. [Google Scholar] [CrossRef] [PubMed] [Green Version]
- Itakura, E.; Kishi-Itakura, C.; Mizushima, N. The Hairpin-type Tail-Anchored SNARE Syntaxin 17 Targets to Autophagosomes for Fusion with Endosomes/Lysosomes. Cell 2012, 151, 1256–1269. [Google Scholar] [CrossRef] [PubMed] [Green Version]
- Nickerson, D.P.; Brett, C.L.; Merz, A.J. Vps-C complexes: Gatekeepers of endolysosomal traffic. Curr. Opin. Cell Biol. 2009, 21, 543–551. [Google Scholar] [CrossRef] [PubMed] [Green Version]
- Bains, M.; Zaegel, V.; Mize-Berge, J.; Heidenreich, K.A. IGF-I stimulates Rab7-RILP interaction during neuronal autophagy. Neurosci. Lett. 2011, 488, 112–117. [Google Scholar] [CrossRef] [Green Version]
- Zhao, C.; Zhang, C.; Sun, X.; Guo, Q.; Liu, J.; Liu, Y.; Hao, Y.; Feng, G.; Yang, L.; Liu, H.; et al. Paclitaxel-based supramolecular hydrogel loaded with mifepristone for the inhibition of breast cancer metastasis. Cancer Sci. 2021, 113, 733–743. [Google Scholar] [CrossRef]
- Brunet, A.; Sweeney, L.B.; Sturgill, J.F.; Chua, K.F.; Greer, P.L.; Lin, Y.; Tran, H.; Ross, S.E.; Mostoslavsky, R.; Cohen, H.Y.; et al. Stress-Dependent Regulation of FOXO Transcription Factors by the SIRT1 Deacetylase. Science 2004, 303, 2011–2015. [Google Scholar] [CrossRef] [Green Version]
- Hariharan, N.; Maejima, Y.; Nakae, J.; Paik, J.; DePinho, R.; Sadoshima, J. Deacetylation of FoxO by Sirt1 Plays an Essential Role in Mediating Starvation-Induced Autophagy in Cardiac Myocytes. Circ. Res. 2010, 107, 1470–1482. [Google Scholar] [CrossRef] [Green Version]
- Latifkar, A.; Ling, L.; Hingorani, A.; Johansen, E.; Clement, A.; Zhang, X.; Hartman, J.; Fischbach, C.; Lin, H.; Cerione, R.A.; et al. Loss of Sirtuin 1 Alters the Secretome of Breast Cancer Cells by Impairing Lysosomal Integrity. Dev. Cell 2019, 49, 393–408.e7. [Google Scholar] [CrossRef]
- Manchester, L.C.; Coto-Montes, A.; Boga, J.A.; Andersen, L.P.H.; Zhou, Z.; Galano, A.; Vriend, J.; Tan, D.-X.; Reiter, R.J. Melatonin: An ancient molecule that makes oxygen metabolically tolerable. J. Pineal Res. 2015, 59, 403–419. [Google Scholar] [CrossRef]
- Carloni, S.; Albertini, M.C.; Galluzzi, L.; Buonocore, G.; Proietti, F.; Balduini, W. Melatonin reduces endoplasmic reticulum stress and preserves sirtuin 1 expression in neuronal cells of newborn rats after hypoxia-ischemia. J. Pineal Res. 2014, 57, 192–199. [Google Scholar] [CrossRef]
- Carloni, S.; Perrone, S.; Buonocore, G.; Longini, M.; Proietti, F.; Balduini, W. Melatonin protects from the long-term consequences of a neonatal hypoxic-ischemic brain injury in rats. J. Pineal Res. 2007, 44, 157–164. [Google Scholar] [CrossRef] [PubMed]
- Carloni, S.; Riparini, G.; Buonocore, G.; Balduini, W. Rapid modulation of the silent information regulator 1 by melatonin after hypoxia-ischemia in the neonatal rat brain. J. Pineal Res. 2017, 63, e12434. [Google Scholar] [CrossRef] [PubMed]
- Cao, S.; Shrestha, S.; Li, J.; Yu, X.; Chen, J.; Yan, F.; Ying, G.; Gu, C.; Wang, L.; Chen, G. Melatonin-mediated mitophagy protects against early brain injury after subarachnoid hemorrhage through inhibition of NLRP3 inflammasome activation. Sci. Rep. 2017, 7, 2417. [Google Scholar] [CrossRef] [PubMed] [Green Version]
- Gao, Q.; Guo, X.; Cao, Y.; Jia, X.; Xu, S.; Lu, C.; Zhu, H. Melatonin Protects HT22 Hippocampal Cells from H2O2-induced Injury by Increasing Beclin1 and Atg Protein Levels to Activate Autophagy. Curr. Pharm. Des. 2021, 27, 446–454. [Google Scholar] [CrossRef]
- Areti, A.; Komirishetty, P.; Akuthota, M.; Malik, R.A.; Kumar, A. Melatonin prevents mitochondrial dysfunction and promotes neuroprotection by inducing autophagy during oxaliplatin-evoked peripheral neuropathy. J. Pineal Res. 2017, 62, e12393. [Google Scholar] [CrossRef]
- Teng, Y.C.; Tai, Y.I.; Huang, H.J.; Lin, A.M.Y. Melatonin Ameliorates Arsenite-Induced Neurotoxicity: Involvement of Autophagy and Mitochondria. Mol. Neurobiol. 2015, 52, 1015–1022. [Google Scholar] [CrossRef]
- Boga, J.A.; Caballero, B.; Potes, Y.; Perez-Martinez, Z.; Reiter, R.J.; Vega-Naredo, I.; Coto-Montes, A. Therapeutic potential of melatonin related to its role as an autophagy regulator: A review. J. Pineal Res. 2018, 66, e12534. [Google Scholar] [CrossRef] [Green Version]
- Carloni, S.; Balduini, W. Simvastatin preconditioning confers neuroprotection against hypoxia-ischemia induced brain damage in neonatal rats via autophagy and silent information regulator 1 (SIRT1) activation. Exp. Neurol. 2019, 324, 113117. [Google Scholar] [CrossRef]
- Carloni, S.; Girelli, S.; Scopa, C.; Buonocore, G.; Longini, M.; Balduini, W. Activation of autophagy and Akt/CREB signaling play an equivalent role in the neuroprotective effect of rapamycin in neonatal hypoxia-ischemia. Autophagy 2010, 6, 366–377. [Google Scholar] [CrossRef] [Green Version]
- Opitz-Araya, X.; Barria, A. Organotypic Hippocampal Slice Cultures. J. Vis. Exp. 2011, e2462. [Google Scholar] [CrossRef]
- Nasoni, M.G.; Carloni, S.; Canonico, B.; Burattini, S.; Cesarini, E.; Papa, S.; Pagliarini, M.; Ambrogini, P.; Balduini, W.; Luchetti, F. Melatonin reshapes the mitochondrial network and promotes intercellular mitochondrial transfer via tunneling nanotubes after ischemic-like injury in hippocampal HT22 cells. J. Pineal Res. 2021, 71, e12747. [Google Scholar] [CrossRef] [PubMed]
- Carloni, S.; Facchinetti, F.; Pelizzi, N.; Buonocore, G.; Balduini, W. Melatonin Acts in Synergy with Hypothermia to Reduce Oxygen-Glucose Deprivation-Induced Cell Death in Rat Hippocampus Organotypic Slice Cultures. Neonatology 2018, 114, 364–371. [Google Scholar] [CrossRef]
- Cheng, B.-H.; Bai, B.; Shao, Z.-Q.; Dou, S.-S.; Zhu, J.-G.; Wang, H.-Q.; Wang, C.-M. Apelin-13 inhibits apoptosis and excessive autophagy in cerebral ischemia/reperfusion injury. Neural Regen. Res. 2021, 16, 1044–1051. [Google Scholar] [CrossRef] [PubMed]
- Raval, A.P.; Dave, K.R.; Perez-Pinzon, M.A. Resveratrol Mimics Ischemic Preconditioning in the Brain. J. Cereb. Blood Flow Metab. 2005, 26, 1141–1147. [Google Scholar] [CrossRef] [PubMed] [Green Version]
- Montégut, L.; Chen, H.; Anagnostopoulos, G.; Spaggiari, S.; Kepp, O.; Maiuri, M.C.; Kroemer, G.; Martins, I. Multiplexed quantification of autophagic flux by imaging flow cytometry. Methods Cell Biol. 2021, 165, 59–71. [Google Scholar] [CrossRef] [PubMed]
- Gogolla, N.; Galimberti, I.; De Paola, V.; Caroni, P. Preparation of organotypic hippocampal slice cultures for long-term live imaging. Nat. Protoc. 2006, 1, 1165–1171. [Google Scholar] [CrossRef]
- Burattini, S.; Battistelli, M.; Codenotti, S.; Falcieri, E.; Fanzani, A.; Salucci, S. Melatonin action in tumor skeletal muscle cells: An ultrastructural study. Acta Histochem. 2016, 118, 278–285. [Google Scholar] [CrossRef]
- Cantoni, O.; Tommasini, I.; Cerioni, L. The Arachidonate-Dependent Survival Signaling Preventing Toxicity in Monocytes/Macrophages Exposed to Peroxynitrite. Methods Enzymol. 2008, 441, 73–82. [Google Scholar] [CrossRef]
- Klionsky, D.J.; Abdel-Aziz, A.K.; Abdelfatah, S.; Abdellatif, M.; Abdoli, A.; Abel, S.; Abeliovich, H.; Abildgaard, M.H.; Abudu, Y.P.; Acevedo-Arozena, A.; et al. Guidelines for the use and interpretation of assays for monitoring autophagy (4th edition). Autophagy 2020, 17, 1–382. [Google Scholar] [CrossRef]
- Katsuragi, Y.; Ichimura, Y.; Komatsu, M. p62/SQSTM1 functions as a signaling hub and an autophagy adaptor. FEBS J. 2015, 282, 4672–4678. [Google Scholar] [CrossRef]
- Jager, S.; Bucci, C.; Tanida, I.; Ueno, T.; Kominami, E.; Saftig, P.; Eskelinen, E.-L. Role for Rab7 in maturation of late autophagic vacuoles. J. Cell Sci. 2004, 117, 4837–4848. [Google Scholar] [CrossRef] [PubMed] [Green Version]
- Szatmári, Z.; Sass, M. The autophagic roles of Rab small GTPases and their upstream regulators. Autophagy 2014, 10, 1154–1166. [Google Scholar] [CrossRef] [PubMed] [Green Version]
- Shao, Z.; Dou, S.; Zhu, J.; Wang, H.; Xu, D.; Wang, C.; Cheng, B.; Bai, B. Apelin-36 Protects HT22 Cells Against Oxygen-Glucose Deprivation/Reperfusion-Induced Oxidative Stress and Mitochondrial Dysfunction by Promoting SIRT1-Mediated PINK1/Parkin-Dependent Mitophagy. Neurotox. Res. 2021, 39, 740–753. [Google Scholar] [CrossRef] [PubMed]
- Humpel, C. Neuroscience forefront review Organotypic brain slice cultures: A review. Neuroscience 2015, 305, 86–98. [Google Scholar] [CrossRef] [Green Version]
- Nikoletopoulou, V.; Papandreou, M.-E.; Tavernarakis, N. Autophagy in the physiology and pathology of the central nervous system. Cell Death Differ. 2014, 22, 398–407. [Google Scholar] [CrossRef] [Green Version]
- Sun, Y.; Zhu, Y.; Zhong, X.; Chen, X.; Wang, J.; Ying, G. Crosstalk Between Autophagy and Cerebral Ischemia. Front. Neurosci. 2019, 12, 1022. [Google Scholar] [CrossRef] [Green Version]
- Zhang, Y.; Cao, Y.; Liu, C. Autophagy and Ischemic Stroke. Autophagy Biol. Dis. 2020, 1207, 111–134. [Google Scholar] [CrossRef]
- Sheng, R.; Qin, Z.-H. The divergent roles of autophagy in ischemia and preconditioning. Acta Pharmacol. Sin. 2015, 36, 411–420. [Google Scholar] [CrossRef]
- Jain, A.; Lamark, T.; Sjøttem, E.; Larsen, K.B.; Awuh, J.A.; Øvervatn, A.; McMahon, M.; Hayes, J.D.; Johansen, T. p62/SQSTM1 is a target gene for transcription factor NRF2 and creates a positive feedback loop by inducing antioxidant response element-driven gene transcription. J. Biol. Chem. 2010, 285, 22576–22591. [Google Scholar] [CrossRef] [Green Version]
- Duran, A.; Amanchy, R.; Linares, J.F.; Joshi, J.; Abu-Baker, S.; Porollo, A.; Hansen, M.; Moscat, J.; Diaz-Meco, M.T. p62 Is a Key Regulator of Nutrient Sensing in the mTORC1 Pathway. Mol. Cell 2011, 44, 134–146. [Google Scholar] [CrossRef]
- Yang, Z.; Klionsky, D.J. An Overview of the Molecular Mechanism of Autophagy. Autophagy Infect. Immun. 2009, 335, 1–32. [Google Scholar] [CrossRef] [Green Version]
- Burman, C.; Ktistakis, N.T. Autophagosome formation in mammalian cells. Semin. Immunopathol. 2010, 32, 397–413. [Google Scholar] [CrossRef] [PubMed]
- Bélanger, M.; Allaman, I.; Magistretti, P.J. Brain Energy Metabolism: Focus on Astrocyte-Neuron Metabolic Cooperation. Cell Metab. 2011, 14, 724–738. [Google Scholar] [CrossRef] [Green Version]
- Klionsky, D.J.; Petroni, G.; Amaravadi, R.K.; Baehrecke, E.H.; Ballabio, A.; Boya, P.; Pedro, J.M.B.; Cadwell, K.; Cecconi, F.; Choi, A.M.K.; et al. Autophagy in major human diseases. EMBO J. 2021, 40, e108863. [Google Scholar] [CrossRef] [PubMed]
- Hu, Z.; Yang, B.; Mo, X.; Xiao, H. Mechanism and Regulation of Autophagy and Its Role in Neuronal Diseases. Mol. Neurobiol. 2014, 52, 1190–1209. [Google Scholar] [CrossRef] [PubMed]
- Galluzzi, L.; Bravo-San Pedro, J.M.; Levine, B.; Green, D.R.; Kroemer, G. Pharmacological modulation of autophagy: Therapeutic potential and persisting obstacles. Nat. Rev. Drug Discov. 2017, 16, 487–511. [Google Scholar] [CrossRef] [PubMed] [Green Version]
- Morel, E.; Mehrpour, M.; Botti, J.; Dupont, N.; Hamaï, A.; Nascimbeni, A.C.; Codogno, P. Autophagy: A Druggable Process. Annu. Rev. Pharmacol. Toxicol. 2017, 57, 375–398. [Google Scholar] [CrossRef] [PubMed]
- Zhan, L.; Chen, S.; Li, K.; Liang, D.; Zhu, X.; Liu, L.; Lu, Z.; Sun, W.; Xu, E. Autophagosome maturation mediated by Rab7 contributes to neuroprotection of hypoxic preconditioning against global cerebral ischemia in rats. Cell Death Dis. 2017, 8, e2949. [Google Scholar] [CrossRef] [Green Version]
- Vidoni, C.; Secomandi, E.; Castiglioni, A.; Melone, M.A.; Isidoro, C. Resveratrol protects neuronal-like cells expressing mutant Huntingtin from dopamine toxicity by rescuing ATG4-mediated autophagosome formation. Neurochem. Int. 2018, 117, 174–187. [Google Scholar] [CrossRef]
- Gutierrez, M.G.; Munafó, D.B.; Berón, W.; Colombo, M.I. Rab7 is required for the normal progression of the autophagic pathway in mammalian cells. J. Cell Sci. 2004, 117, 2687–2697. [Google Scholar] [CrossRef]
- Kuchitsu, Y.; Fukuda, M. Revisiting Rab7 Functions in Mammalian Autophagy: Rab7 Knockout Studies. Cells 2018, 7, 215. [Google Scholar] [CrossRef] [PubMed] [Green Version]
- Eskelinen, E.-L. Maturation of Autophagic Vacuoles in Mammalian Cells. Autophagy 2005, 1, 1–10. [Google Scholar] [CrossRef] [PubMed] [Green Version]
- McCray, B.A.; Skordalakes, E.; Taylor, J.P. Disease mutations in Rab7 result in unregulated nucleotide exchange and inappropriate activation. Hum. Mol. Genet. 2009, 19, 1033–1047. [Google Scholar] [CrossRef] [PubMed] [Green Version]
- Cataldo, A.M.; Mathews, P.M.; Boiteau, A.B.; Hassinger, L.C.; Peterhoff, C.M.; Jiang, Y.; Mullaney, K.; Neve, R.L.; Gruenberg, J.; Nixon, R.A. Down Syndrome Fibroblast Model of Alzheimer-Related Endosome Pathology: Accelerated Endocytosis Promotes Late Endocytic Defects. Am. J. Pathol. 2008, 173, 370–384. [Google Scholar] [CrossRef] [Green Version]
- Spinosa, M.R.; Progida, C.; De Luca, A.; Colucci, A.M.R.; Alifano, P.; Bucci, C. Functional Characterization of Rab7 Mutant Proteins Associated with Charcot-Marie-Tooth Type 2B Disease. J. Neurosci. 2008, 28, 1640–1648. [Google Scholar] [CrossRef] [Green Version]
- Guerra, F.; Paiano, A.; Migoni, D.; Girolimetti, G.; Perrone, A.M.; De Iaco, P.; Fanizzi, F.P.; Gasparre, G.; Bucci, C. Modulation of RAB7A Protein Expression Determines Resistance to Cisplatin through Late Endocytic Pathway Impairment and Extracellular Vesicular Secretion. Cancers 2019, 11, 52. [Google Scholar] [CrossRef] [PubMed] [Green Version]
- Hyttinen, J.M.; Niittykoski, M.; Salminen, A.; Kaarniranta, K. Maturation of autophagosomes and endosomes: A key role for Rab7. Biochim. Biophys. Acta (BBA)—Mol. Cell Res. 2013, 1833, 503–510. [Google Scholar] [CrossRef] [Green Version]
- Ma, X.; Liu, H.; Foyil, S.R.; Godar, R.J.; Weinheimer, C.J.; Hill, J.A.; Diwan, A. Impaired Autophagosome Clearance Contributes to Cardiomyocyte Death in Ischemia/Reperfusion Injury. Circulation 2012, 125, 3170–3181. [Google Scholar] [CrossRef] [Green Version]
- Zeng, H.; Chen, H.; Li, M.; Zhuang, J.; Peng, Y.; Zhou, H.; Xu, C.; Yu, Q.; Fu, X.; Cao, S.; et al. Autophagy protein NRBF2 attenuates endoplasmic reticulum stress-associated neuroinflammation and oxidative stress via promoting autophagosome maturation by interacting with Rab7 after SAH. J. Neuroinflamm. 2021, 18, 1–16. [Google Scholar] [CrossRef]
- Lee, I.H.; Cao, L.; Mostoslavsky, R.; Lombard, D.B.; Liu, J.; Bruns, N.E.; Tsokos, M.; Alt, F.W.; Finkel, T. A role for the NAD-dependent deacetylase Sirt1 in the regulation of autophagy. Proc. Natl. Acad. Sci. USA 2008, 105, 3374–3379. [Google Scholar] [CrossRef]
- Wang, R.; Tan, J.; Chen, T.; Han, H.; Tian, R.; Tan, Y.; Wu, Y.; Cui, J.; Chen, F.; Li, J.; et al. ATP13A2 facilitates HDAC6 recruitment to lysosome to promote autophagosome–lysosome fusion. J. Cell Biol. 2018, 218, 267–284. [Google Scholar] [CrossRef] [PubMed]
- Zhang, Y.; Zhang, M.; Dong, H.; Yong, S.; Li, X.; Olashaw, N.; Kruk, P.A.; Cheng, J.Q.; Bai, W.; Chen, J.; et al. Deacetylation of cortactin by SIRT1 promotes cell migration. Oncogene 2008, 28, 445–460. [Google Scholar] [CrossRef] [PubMed] [Green Version]
- Füllgrabe, J.; Klionsky, D.J.; Joseph, B. The return of the nucleus: Transcriptional and epigenetic control of autophagy. Nat. Rev. Mol. Cell Biol. 2013, 15, 65–74. [Google Scholar] [CrossRef] [PubMed]
- Cheng, Z. The FoxO–Autophagy Axis in Health and Disease. Trends Endocrinol. Metab. 2019, 30, 658–671. [Google Scholar] [CrossRef]
- Carloni, S.; Buonocore, G.; Balduini, W. Protective role of autophagy in neonatal hypoxia–ischemia induced brain injury. Neurobiol. Dis. 2008, 32, 329–339. [Google Scholar] [CrossRef]


Publisher’s Note: MDPI stays neutral with regard to jurisdictional claims in published maps and institutional affiliations. |
© 2022 by the authors. Licensee MDPI, Basel, Switzerland. This article is an open access article distributed under the terms and conditions of the Creative Commons Attribution (CC BY) license (https://creativecommons.org/licenses/by/4.0/).
Share and Cite
Luchetti, F.; Nasoni, M.G.; Burattini, S.; Mohammadi, A.; Pagliarini, M.; Canonico, B.; Ambrogini, P.; Balduini, W.; Reiter, R.J.; Carloni, S. Melatonin Attenuates Ischemic-like Cell Injury by Promoting Autophagosome Maturation via the Sirt1/FoxO1/Rab7 Axis in Hippocampal HT22 Cells and in Organotypic Cultures. Cells 2022, 11, 3701. https://doi.org/10.3390/cells11223701
Luchetti F, Nasoni MG, Burattini S, Mohammadi A, Pagliarini M, Canonico B, Ambrogini P, Balduini W, Reiter RJ, Carloni S. Melatonin Attenuates Ischemic-like Cell Injury by Promoting Autophagosome Maturation via the Sirt1/FoxO1/Rab7 Axis in Hippocampal HT22 Cells and in Organotypic Cultures. Cells. 2022; 11(22):3701. https://doi.org/10.3390/cells11223701
Chicago/Turabian StyleLuchetti, Francesca, Maria G. Nasoni, Sabrina Burattini, Atefeh Mohammadi, Marica Pagliarini, Barbara Canonico, Patrizia Ambrogini, Walter Balduini, Russel J. Reiter, and Silvia Carloni. 2022. "Melatonin Attenuates Ischemic-like Cell Injury by Promoting Autophagosome Maturation via the Sirt1/FoxO1/Rab7 Axis in Hippocampal HT22 Cells and in Organotypic Cultures" Cells 11, no. 22: 3701. https://doi.org/10.3390/cells11223701