Article

Physiological Oxygen Levels Differentially Regulate Adipokine Production in Abdominal and Femoral Adipocytes from Individuals with Obesity Versus Normal Weight

by
Ioannis G. Lempesis
1,2,3,*,
Nicole Hoebers
2,
Yvonne Essers
2,
Johan W. E. Jocken
2,
Kasper M. A. Rouschop
4,
Ellen E. Blaak
2,
Konstantinos N. Manolopoulos
1,3,† and
Gijs H. Goossens
2,*,†
1
Institute of Metabolism and Systems Research (IMSR), College of Medical and Dental Sciences, University of Birmingham, Birmingham B15 2TT, UK
2
Department of Human Biology, NUTRIM School of Nutrition and Translational Research in Metabolism, Maastricht University Medical Centre+, 6229 ER Maastricht, The Netherlands
3
Centre for Endocrinology, Diabetes and Metabolism, Birmingham Health Partners, Birmingham B15 2TT, UK
4
Radiotherapy, GROW School for Oncology & Reproduction, Maastricht University Medical Centre+, 6229 ER Maastricht, The Netherlands
*
Authors to whom correspondence should be addressed.
These authors contributed equally to this work.
Cells 2022, 11(22), 3532; https://doi.org/10.3390/cells11223532
Submission received: 4 October 2022 / Revised: 28 October 2022 / Accepted: 6 November 2022 / Published: 8 November 2022
(This article belongs to the Special Issue Adipose Tissue Inflammation 2022)

Abstract

:
Adipose tissue (AT) inflammation may increase obesity-related cardiometabolic complications. Altered AT oxygen partial pressure (pO2) may impact the adipocyte inflammatory phenotype. Here, we investigated the effects of physiological pO2 levels on the inflammatory phenotype of abdominal (ABD) and femoral (FEM) adipocytes derived from postmenopausal women with normal weight (NW) or obesity (OB). Biopsies were collected from ABD and FEM subcutaneous AT in eighteen postmenopausal women (aged 50–65 years) with NW (BMI 18–25 kg/m2, n = 9) or OB (BMI 30–40 kg/m2, n = 9). We compared the effects of prolonged exposure to different physiological pO2 levels on adipokine expression and secretion in differentiated human multipotent adipose-derived stem cells. Low physiological pO2 (5% O2) significantly increased leptin gene expression/secretion in ABD and FEM adipocytes derived from individuals with NW and OB compared with high physiological pO2 (10% O2) and standard laboratory conditions (21% O2). Gene expression/secretion of IL-6, DPP-4, and MCP-1 was reduced in differentiated ABD and FEM adipocytes from individuals with OB but not NW following exposure to low compared with high physiological pO2 levels. Low physiological pO2 decreases gene expression and secretion of several proinflammatory factors in ABD and FEM adipocytes derived from individuals with OB but not NW.

1. Introduction

Excess fat mass in obesity poses a major health risk [1]. The research in the past decades has clearly demonstrated that body fat distribution is a better predictor of cardiometabolic complications than total fat mass, with abdominal obesity increasing and lower-body (gluteofemoral) fat accumulation conferring relative protection against chronic cardiometabolic diseases [2,3,4,5,6]. This seems related to the distinct functional properties of these different AT depots. Many studies in rodents and humans have shown that AT dysfunction in obesity is characterised by adipocyte hypertrophy, mitochondrial dysfunction, reactive oxygen species (ROS) production, impaired lipid metabolism, reduced blood flow, and inflammation, together contributing to an increased risk of developing cardiometabolic diseases and cancer [6,7,8,9,10,11].
The AT microenvironment impacts metabolic and inflammatory processes [8,9]. We, and others, have previously demonstrated that AT oxygen partial pressure (pO2), which is determined by the balance between local oxygen supply (determined by adipose tissue blood flow) and consumption (primarily mitochondrial oxygen consumption), may be an important determinant of the AT phenotype and whole-body insulin sensitivity [9,12,13,14]. Interestingly, differences in adipose tissue blood flow and/or adipose tissue oxygen consumption between individuals with normal weight and obesity, and between upper and lower AT depots, have previously been demonstrated [9,10,12,15,16]. Although AT pO2 is reduced in rodent models of obesity [17,18,19], conflicting findings on AT pO2 have been reported in humans [9,20,21,22,23,24]. We have previously shown that AT pO2 was higher in individuals with obesity and was positively associated with AT gene expression of proinflammatory markers and whole-body insulin resistance [22,25]. Moreover, we found that AT pO2 was lower in femoral than in abdominal subcutaneous AT in women with obesity [16].
The normal physiological range of AT pO2 in human AT is ~3–11% O2 (~23–84 mmHg) [9,21,22,23,25]. Therefore, the outcomes of experiments comparing the effects of pO2 below and well above these physiological levels should be interpreted with caution, because the results may not directly translate to the human in vivo situation [9]. Several in vitro studies have demonstrated that the expression and secretion of many adipokines are sensitive to changes in pO2 levels, as extensively reviewed [9,26]. Most of these studies have shown that acute exposure to severe, non-physiological hypoxia (1% O2 for 1–24 h) induces a proinflammatory expression and secretion profile in (pre)adipocytes, while prolonged exposure to mild physiological hypoxia (5% O2 for 14 days) seems to elicit a different adipokine expression/secretion profile [9,16,27]. Recently, we found that prolonged exposure to low physiological hypoxia decreased proinflammatory gene expression in abdominal and femoral adipocytes derived from women with obesity [16]. The metabolic and inflammatory responses to changes in the AT microenvironment may differ between individuals and AT depots. Thus, oxygen levels might exert distinct effects on AT function in people with different adiposity and in different AT depots. Importantly, however, studies investigating the impact of altered pO2 levels on the inflammatory phenotype of adipocytes derived from people with normal weight and obesity are lacking.
Therefore, the aim of the present study was to investigate the impact of prolonged exposure to various physiological oxygen levels on gene expression and secretion of inflammatory factors within upper and lower body differentiated human multipotent adipose-derived stem (hMADS) cells derived from women with normal weight or obesity.

2. Materials and Methods

2.1. Upper and Lower Body Adipose Tissue Biopsies

Paired abdominal (ABD) and femoral (FEM) subcutaneous AT needle biopsies were obtained from eighteen postmenopausal women (aged 50–65 years) with normal weight (NW: BMI 18–25 kg/m2, n = 9) or obesity (OB: BMI 30–40 kg/m2, n = 9) (Table 1). The U.K. Health Research Authority National Health System Research Ethics Committee approved the present study (approval no. 18/NW/0392). Briefly, the biopsy specimens (up to ∼1 g) were collected 6 to 8 cm lateral from the umbilicus (ABD AT) and from the anterior aspect of the upper leg (FEM AT) under local anaesthesia (1% lidocaine) after an overnight fast. Samples were immediately rinsed with sterile saline, and visible blood vessels were removed with sterile tweezers. Isolation of hMADS cells followed, as described before [16].

2.2. Human Primary Adipocyte Experiments

Human multipotent abdominal (ABD) and femoral (FEM) adipose-derived stem cells, an established human white adipocyte model [28], were seeded at a density of 2000 cells/cm2 and kept in proliferation medium for seven days. Thereafter, these cells were differentiated under different physiological O2 levels (10% O2, high physiological pO2; 5% O2, low physiological pO2) [9,16,22,29] as well as standard laboratory conditions (room air, 21% O2) for 14 days. Gas mixtures were refreshed every 8 h (to maintain variation <0.1% O2), whereas the medium was refreshed three times per week.

2.3. Adipocyte Gene Expression

Total RNA was extracted from hMADS cells using TRIzol reagent (Invitrogen, Breda, The Netherlands), and SYBR-Green-based real-time PCRs were performed to assess the gene expression of leptin, dipeptidyl-peptidase (DPP)-4, interleukin (IL)-6, plasminogen activator inhibitor (PAI)-1, adiponectin, tumour necrosis factor (TNF)α, and monocyte chemoattractant protein (MCP)-1; the adipocyte differentiation markers peroxisome proliferator-activated receptor γ (PPARγ), CCAAT-enhancer binding protein α (C/EBPα), fatty acid synthase (FAS), and perilipin 1 (PLIN1); as well as the hypoxia markers glucose transporter 1 (GLUT1), Bcl-2 interacting protein 3 (BNIP3), and vascular endothelial growth factor A (VEGFA) using an iCycler (Bio-Rad, Veenendaal, The Netherlands). Results were normalised to 18S ribosomal RNA.

2.4. Adipokine Secretion

The medium of the hMADS cells was collected over 24 h, from day 13 (after replacement of medium) to day 14 of differentiation, to determine the secretion of adipokines using high-sensitive ELISAs (leptin and DPP-4 from R&D Systems, Inc., Minneapolis, MN, USA; IL-6 and MCP-1 from Diaclone SAS, Besancon Cedex, France; adiponectin and PAI-1 from BioVendor–Laboratorni medicina a.s., Brno, Czech Republic). If necessary, samples were diluted with the dilution buffer provided by the manufacturer prior to the assay, which was performed in duplicates according to the manufacturer’s instructions.

2.5. Statistical Analyses

Data are presented as mean ± SEM. The effects of exposure to different oxygen levels on adipocyte gene expression and adipokine secretion were analysed using one-way ANOVA or the Friedman test when data were not normally distributed, followed by post hoc comparison using Student’s paired t-tests or the Wilcoxon signed-rank test in case of skewed data. GraphPad Prism version 8 for Windows (GraphPad Software, San Diego, CA, USA) was used to perform statistical analyses. p < 0.05 was considered statistically significant.

3. Results

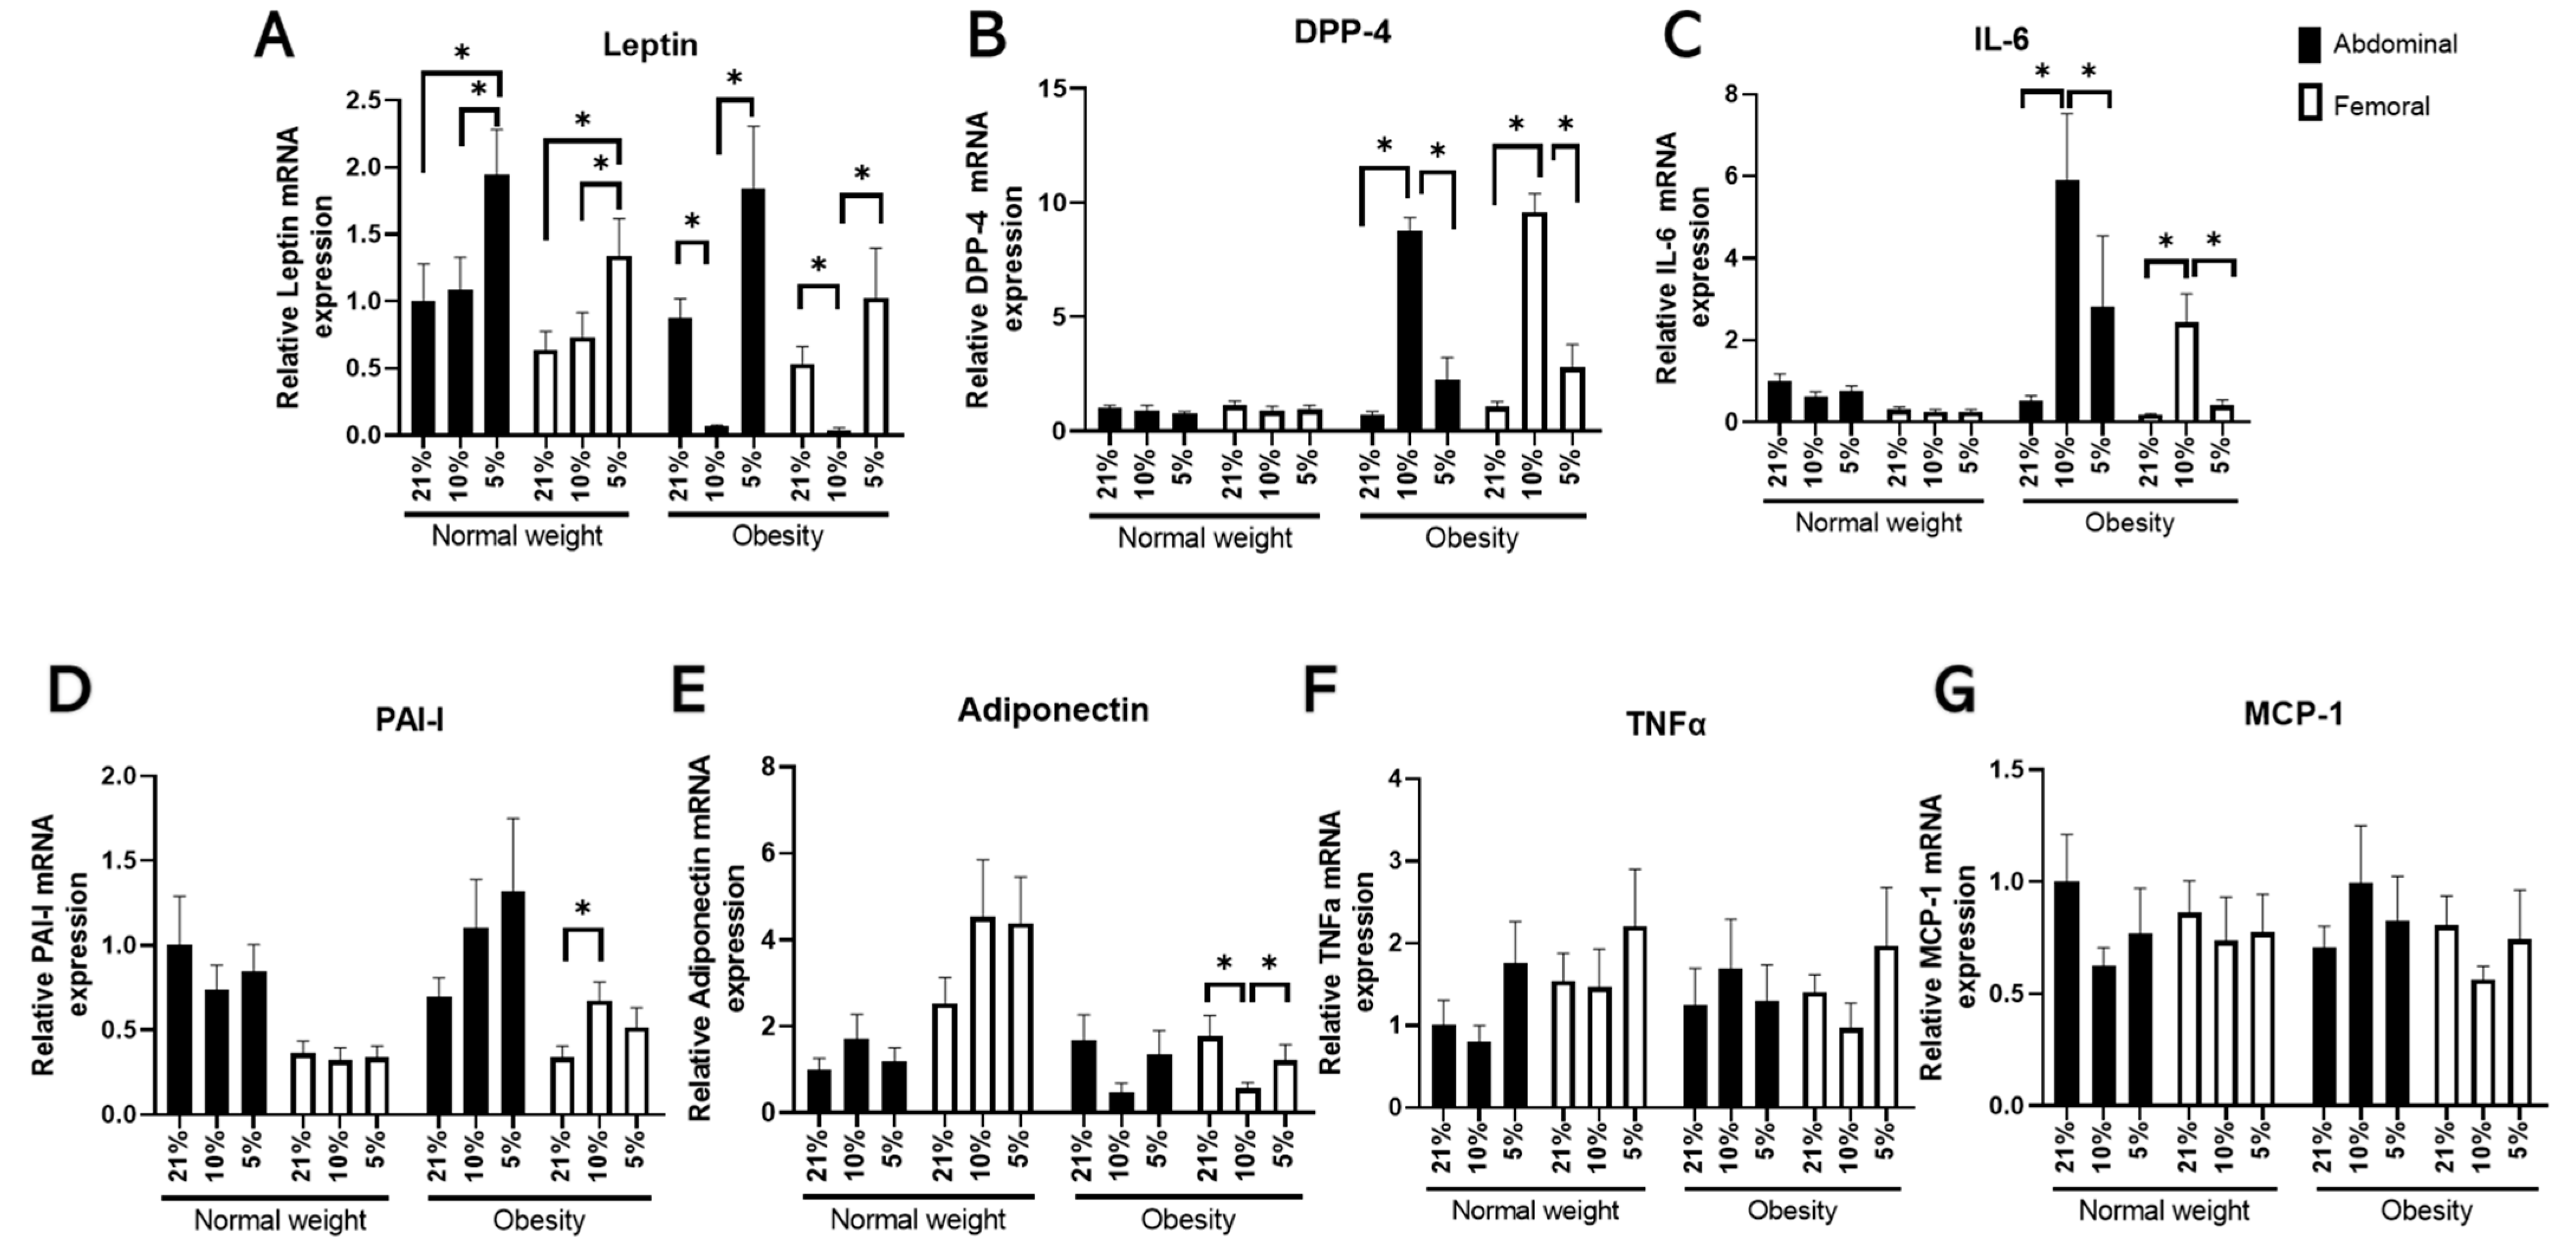
3.1. The Effects of Oxygen Partial Pressure on Adipocyte Gene Expression

The exposure of differentiated hMADS cells derived from ABD and FEM AT to different pO2 levels induced distinct gene expression patterns. Specifically, exposure to low physiological pO2 (5% O2) increased leptin expression compared with exposure to high physiological pO2 (10% O2) or room air (21% O2) in differentiated ABD and FEM hMADS derived from individuals with NW as well as OB (all p < 0.01, Figure 1A). Furthermore, low physiological pO2 markedly reduced the gene expression of the proinflammatory factors DPP-4 and IL-6 in both ABD and FEM differentiated hMADS derived from donors with OB (all p < 0.01) but not NW compared with high physiological pO2 (Figure 1B,C). Low physiological pO2 levels did not significantly alter the gene expression of PAI-1, TNFα, or MCP-1 in differentiated ABD and FEM hMADS derived from NW and OB individuals (Figure 1D–G), except for a modest but significant (p = 0.041) increase in adiponectin gene expression in FEM differentiated hMADS derived from individuals with obesity (Figure 1E). In addition, high physiological AT pO2 (10% O2) increased the PAI-1 (p = 0.005) and reduced the adiponectin expression (p = 0.010) in FEM differentiated hMADS derived from individuals with OB compared with those at 21% O2 exposure. As expected, exposure to physiological oxygen levels, i.e., lower oxygen levels compared with standard laboratory conditions, increased the gene expression of the classical hypoxia markers GLUT1 and VEGFA, and, to a lesser extent, increased that of BNIP3 (Figure S1A–C). Furthermore, exposure to low physiological oxygen levels (5% O2) did not alter the gene expression of adipocyte differentiation markers compared with room air (21% O2) in differentiated hMADS derived from individuals with NW as well as OB (Supplemental Figure S1D–G). In the differentiated hMADS derived from individuals with OB, the gene expression of PPARγ, C/EBPα, and FAS was lower, and expression of PLIN1 higher, following exposure to 5% compared with 10% O2.

3.2. The Effects of Oxygen Partial Pressure on Adipokine Secretion

Next, we investigated whether exposure to different pO2 levels elicited functional changes in adipokine secretion from differentiated ABD and FEM hMADS. We found that adipokine secretion from both differentiated ABD and FEM hMADS was significantly affected by changes in oxygen availability (Figure 2). Specifically, low physiological pO2 (5% O2) exposure increased leptin secretion in differentiated ABD and FEM hMADS derived from individuals with OB compared with exposure to high physiological pO2 (10% O2: ABD, p = 0.009; FEM, p = 0.021), and in differentiated ABD and FEM hMADS derived from individuals with NW compared with exposure to room air (21% O2: ABD, p = 0.014; FEM, p = 0.006) (Figure 2A). Furthermore, DPP-4 secretion was significantly lower following exposure to low (5% O2) compared with high (10% O2) physiological pO2 in differentiated ABD (p = 0.027) and FEM hMADS (p = 0.004) and IL-6 secretion in differentiated FEM hMADS only (p = 0.007), derived from donors with OB but not NW (Figure 2B,C). Moreover, low physiological pO2 (5% O2) reduced MCP-1 secretion (p = 0.030) but did not alter PAI-1 secretion from differentiated ABD hMADS derived from individuals with OB compared with 10% O2 (Figure 2D,E). Finally, low physiological pO2 (5% O2) reduced both MCP-1 (p = 0.028) and PAI-1 (p = 0.003) secretion from differentiated FEM hMADS derived from donors with NW compared with 21% O2 (Figure 2D,E). Adiponectin secretion was not detectable, and these data are therefore not reported.

4. Discussion

In the present study, we investigated the impact of oxygen tension on adipokine gene expression and secretion in differentiated human multipotent ABD and FEM adipose-derived stem cells from women with NW or OB. Here, we demonstrate that low physiological pO2 decreased gene expression and secretion of the proinflammatory factors DDP-4 and IL-6 in both differentiated ABD and FEM hMADS derived from individuals with OB, while these responses were not present in differentiated hMADS cells from NW individuals. Our findings highlight that the changes in pO2 within the human physiological range in the adipocyte microenvironment contribute to alterations in the AT inflammatory phenotype and that these effects may differ between individuals with normal weight and obesity.
To determine whether the amount of oxygen present in the AT microenvironment affects the gene expression of adipokines, we exposed differentiating hMADS cells from ABD and FEM AT to low (5%) and high (10%) physiological pO2 levels in human AT [9,16,21,22,23,24]. As expected, low physiological pO2 levels increased the gene expression of several hypoxia markers. Strikingly, we show for the first time that low physiological pO2 during adipogenesis consistently decreased the expression and secretion of the proinflammatory markers IL-6 and DPP-4 in both differentiated FEM and ABD hMADS derived from individuals with OB, but not NW. Moreover, the present data suggest that these cells maintain a memory of origin (i.e., a normal-weight or obese microenvironment) in vitro, even after 14 days of exposure to the same experimental conditions. In agreement with our findings, we have previously reported that in vivo ABD AT pO2 was positively associated with the AT gene expression of several proinflammatory markers [22] and that low physiological pO2 exposure reduced the gene expression of IL-6 and DPP-4 in adipocytes derived from women with obesity [16]. In addition, the present results show that low physiological pO2 levels consistently increased leptin gene expression and secretion in differentiated ABD and FEM hMADS derived from donors with NW or OB. Leptin is an important regulator of appetite and energy expenditure, providing important feedback in relation to energy storage in the body through the hypothalamus, and is involved in multiple physiological processes such as the regulation of immunity [9,30,31,32]. Changes in leptin secretion due to altered oxygen tension in the AT microenvironment may thus affect these processes. Notably, pO2-induced alterations in adipokine gene expression were paralleled by comparable changes in adipokine secretion. Importantly, the modest effects of pO2 levels on adipocyte differentiation, if present at all, do not seem to explain the observed changes in adipokine expression and secretion, exemplified by the opposing effects of low pO2 on the expression and secretion of leptin and the proinflammatory markers Il-6 and DPP-4. Famulla et al. [27] previously showed increased DPP-4, adiponectin, and IL-6 secretion following prolonged exposure to high physiological pO2 (10% O2), while low physiological pO2 (5% O2) tended to reduce the secretion of adiponectin. These differences between studies may at least partly be explained by differences in donor characteristics.
A strength of the present study is the paired comparisons between differentiated adipose-derived multipotent stem cells derived from ABD and FEM AT of individuals with NW and OB. Previous studies examining the effects of pO2 levels on adipocyte inflammation have either used cell lines, adipose-derived multipotent stem cells from a single donor, or a pool of stem cells obtained from different donors. Because our findings demonstrate that the impact of changes in the AT microenvironment (i.e., different physiological pO2 levels) on adipokine expression and secretion depends on the characteristics of the donors, future studies in the field of AT biology should take this ‘memory-of-origin effect’ into account. Secondly, in contrast to many studies showing that acute exposure to severe (non-physiological) hypoxia evokes a proinflammatory response in murine and human (pre)adipocytes [13,14], we aimed to mimic physiological in vivo conditions in terms of pO2 levels as well as the prolonged exposure duration in the present study. This study also has some limitations. We examined the effects of various oxygen levels in cells derived from postmenopausal women. Therefore, our findings cannot be translated to other subgroups of the population such as men or individuals of different age. Furthermore, we used a targeted approach to examine the gene expression and secretion of several adipokines. Future studies using an untargeted approach (e.g., microarray analysis, RNA sequencing, or proteomics) are warranted.

5. Conclusions

In conclusion, the present findings demonstrate that physiological oxygen levels regulate adipokine expression and secretion in differentiated ABD and FEM hMADS. Differentiated hMADS cells derived from women with OB display lower expression and secretion of several (proinflammatory) adipokines at low (5% O2) compared with high (10% O2) physiological oxygen tension. Except for the effects on leptin expression, no significant effects of low compared with high physiological oxygen levels were observed in differentiated hMADS cells derived from individuals with NW. Our findings thus indicate that pO2 levels alter the expression and secretion of several adipokines in differentiated human ABD and FEM hMADS, and that donor characteristics determine experimental outcomes. This has important implications for future mechanistic in vitro studies in the field of AT biology. For example, the outcomes of studies in which the effects of certain interventions on adipocyte inflammation and related biological mechanisms are investigated may depend on the microenvironmental oxygen tension. Furthermore, our findings highlight that it is important to report detailed the characteristics of the cell donor(s) in studies examining human adipocyte biology.

Supplementary Materials

The following supporting information can be downloaded at: https://www.mdpi.com/article/10.3390/cells11223532/s1, Figure S1: Adipocyte differentiation and hypoxia markers’ gene expression in adipose tissue-derived mesenchymal stem cells following differentiation under different pO2s (21% vs. 10% vs. 5% O2).

Author Contributions

K.N.M. and G.H.G. acquired funding, conceived and designed research, interpreted data, and revised the manuscript; I.G.L. performed experiments, analysed data, interpreted data, prepared figures, and drafted the manuscript; N.H., Y.E., and J.W.E.J. performed experiments and analysed data. K.M.A.R. and E.E.B. interpreted data and revised the manuscript. All authors approved the final version of the manuscript.

Funding

This work was supported by the European Foundation for the Study of Diabetes (EFSD) under an EFSD/Lilly European Diabetes Research Program grant to Gijs H. Goossens and Konstantinos N. Manolopoulos, and Maastricht University (The Netherlands) and the University of Birmingham (U.K.) under a joint Ph.D. scholarship grant to Gijs H. Goossens and Konstantinos N. Manolopoulos.

Institutional Review Board Statement

The study was conducted in accordance with the Declaration of Helsinki, and the U.K. Health Research Authority National Health System Research Ethics Committee approved the present study (approval no. 18/NW/0392).

Informed Consent Statement

Informed consent was obtained from all subjects involved in the study.

Data Availability Statement

Data presented in this manuscript are available from the corresponding author on reasonable request.

Acknowledgments

The authors would like to express their gratitude to the study participants, the teams of the NIHa/Wellcome Trust Clinical Research Facility at Queen Elizabeth Hospital Birmingham and the NIHR CRN West Midlands (U.K.), as well as the Department of Human Biology at Maastricht University Medical Center+ (The Netherlands) for excellent practical support.

Conflicts of Interest

The authors declare no conflict of interest. The funders had no role in the design of the study; in the collection, analyses, or interpretation of data; in the writing of the manuscript; or in the decision to publish the results.

References

  1. Kopelman, P.G. Obesity as a medical problem. Nature 2000, 404, 635–643. [Google Scholar] [CrossRef] [PubMed]
  2. Karpe, F.; Pinnick, K.E. Biology of upper-body and lower-body adipose tissue—Link to whole-body phenotypes. Nat. Rev. Endocrinol. 2014, 11, 90–100. [Google Scholar] [CrossRef] [PubMed]
  3. Goossens, G.H. The Metabolic Phenotype in Obesity: Fat Mass, Body Fat Distribution, and Adipose Tissue Function. Obes. Facts 2017, 10, 207–215. [Google Scholar] [CrossRef] [PubMed]
  4. Yusuf, S.; Hawken, S.; Ôunpuu, S.; Bautista, L.; Franzosi, M.G.; Commerford, P.; Lang, C.C.; Rumboldt, Z.; Onen, C.L.; Lisheng, L.; et al. Obesity and the risk of myocardial infarction in 27 000 participants from 52 countries: A case-control study. Lancet 2005, 366, 1640–1649. [Google Scholar] [CrossRef]
  5. Seidell, J.; Perusse, L.; Després, J.-P.; Bouchard, C. Waist and hip circumferences have independent and opposite effects on cardiovascular disease risk factors: The Quebec Family Study. Am. J. Clin. Nutr. 2001, 74, 315–321. [Google Scholar] [CrossRef] [Green Version]
  6. Goossens, G.H.; Jocken, J.W.; Blaak, E.E. Sexual Dimorphism in Cardiometabolic Health: The Role of Adipose Tissue, Muscle and Liver. Nat. Rev. Endocrinol. 2021, 17, 47–66. [Google Scholar] [CrossRef]
  7. Goossens, G.H. The role of adipose tissue dysfunction in the pathogenesis of obesity-related insulin resistance. Physiol. Behav. 2008, 94, 206–218. [Google Scholar] [CrossRef]
  8. Rosen, E.D.; Spiegelman, B.M. What We Talk About When We Talk About Fat. Cell 2014, 156, 20–44. [Google Scholar] [CrossRef] [Green Version]
  9. Lempesis, I.G.; Van Meijel, R.L.J.; Manolopoulos, K.N.; Goossens, G.H. Oxygenation of adipose tissue: A human perspective. Acta Physiol. 2019, 228, e13298. [Google Scholar] [CrossRef]
  10. Heinonen, S.; Jokinen, R.; Rissanen, A.; Pietiläinen, K.H. White adipose tissue mitochondrial metabolism in health and in obesity. Obes. Rev. 2019, 21, e12958. [Google Scholar] [CrossRef]
  11. Chen, K.; Zhang, J.; Beeraka, N.M.; Tang, C.; Babayeva, Y.V.; Sinelnikov, M.Y.; Zhang, X.; Zhang, J.; Liu, J.; Reshetov, I.V.; et al. Advances in the Prevention and Treatment of Obesity-Driven Effects in Breast Cancers. Front. Oncol. 2022, 12, 2663. [Google Scholar] [CrossRef] [PubMed]
  12. Goossens, G.H.; Blaak, E.E. Adipose Tissue Dysfunction and Impaired Metabolic Health in Human Obesity: A Matter of Oxygen? Front. Endocrinol. 2015, 6, 55. [Google Scholar] [CrossRef] [PubMed] [Green Version]
  13. Goossens, G.H.; Blaak, E.E. Adipose Tissue Oxygen Tension: Implications for Chronic Metabolic and Inflammatory Diseases. Curr. Opin. Clin. Nutr. Metab. Care 2012, 15, 539–546. [Google Scholar] [CrossRef]
  14. Trayhurn, P. Hypoxia and Adipose Tissue Function and Dysfunction in Obesity. Physiol. Rev. 2013, 93, 1–21. [Google Scholar] [CrossRef] [PubMed] [Green Version]
  15. Lempesis, I.G.; Goossens, G.H.; Manolopoulos, K.N. Measurement of human abdominal and femoral intravascular adipose tissue blood flow using percutaneous Doppler ultrasound. Adipocyte 2021, 10, 119–123. [Google Scholar] [CrossRef]
  16. Vogel, M.A.; Jocken, J.W.; Sell, H.; Hoebers, N.; Essers, Y.; Rouschop, K.M.; Čajlaković, M.; Blaak, E.E.; Goossens, G.H. Differences in Upper and Lower-Body Adipose Tissue Oxygen Tension Contribute to the Adipose Tissue Phenotype in Humans. J. Clin. Endocrinol. Metab. 2018, 103, 3688–3697. [Google Scholar] [CrossRef] [Green Version]
  17. Rausch, M.E.; Weisberg, S.; Vardhana, P.; Tortoriello, D.V. Obesity in C57BL/6J mice is characterized by adipose tissue hypoxia and cytotoxic T-cell infiltration. Int. J. Obes. 2007, 32, 451–463. [Google Scholar] [CrossRef] [Green Version]
  18. Ye, J.; Gao, Z.; Yin, J.; He, Q. Hypoxia Is a Potential Risk Factor for Chronic Inflammation and Adiponectin Reduction in Adipose Tissue of Ob/Ob and Dietary Obese Mice. Am. J. Physiol. Endocrinol. Metab. 2007, 293, E1118–E1128. [Google Scholar] [CrossRef] [Green Version]
  19. Yin, J.; Gao, Z.; He, Q.; Zhou, D.; Guo, Z.; Ye, J. Role of hypoxia in obesity-induced disorders of glucose and lipid metabolism in adipose tissue. Am. J. Physiol. Metab. 2009, 296, E333–E342. [Google Scholar] [CrossRef] [Green Version]
  20. Hodson, L.; Humphreys, S.M.; Karpe, F.; Frayn, K.N. Metabolic Signatures of Human Adipose Tissue Hypoxia in Obesity. Diabetes 2013, 62, 1417–1425. [Google Scholar] [CrossRef]
  21. Pasarica, M.; Sereda, O.R.; Redman, L.M.; Albarado, D.C.; Hymel, D.T.; Roan, L.E.; Rood, J.C.; Burk, D.H.; Smith, S.R. Reduced Adipose Tissue Oxygenation in Human Obesity: Evidence for Rarefaction, Macrophage Chemotaxis, and Inflammation without an Angiogenic Response. Diabetes 2009, 58, 718–725. [Google Scholar] [CrossRef] [PubMed] [Green Version]
  22. Goossens, G.H.; Bizzarri, A.; Venteclef, N.; Essers, Y.; Cleutjens, J.P.; Konings, E.; Jocken, J.W.E.; Čajlaković, M.; Ribitsch, V.; Clément, K.; et al. Increased Adipose Tissue Oxygen Tension in Obese Compared with Lean Men Is Accompanied by Insulin Resistance, Impaired Adipose Tissue Capillarization, and Inflammation. Circulation 2011, 124, 67–76. [Google Scholar] [CrossRef] [PubMed] [Green Version]
  23. Lawler, H.M.; Underkofler, C.M.; Kern, P.A.; Erickson, C.; Bredbeck, B.; Rasouli, N. Adipose Tissue Hypoxia, Inflammation, and Fibrosis in Obese Insulin-Sensitive and Obese Insulin-Resistant Subjects. J. Clin. Endocrinol. Metab. 2016, 101, 1422–1428. [Google Scholar] [CrossRef] [Green Version]
  24. Cifarelli, V.; Beeman, S.C.; Smith, G.I.; Yoshino, J.; Morozov, D.; Beals, J.W.; Kayser, B.D.; Watrous, J.D.; Jain, M.; Patterson, B.W.; et al. Decreased adipose tissue oxygenation associates with insulin resistance in individuals with obesity. J. Clin. Investig. 2020, 130, 6688–6699. [Google Scholar] [CrossRef] [PubMed]
  25. Goossens, G.H.; Vogel, M.A.A.; Vink, R.G.; Mariman, E.C.; Van Baak, M.A.; Blaak, E.E. Adipose tissue oxygenation is associated with insulin sensitivity independently of adiposity in obese men and women. Diabetes Obes. Metab. 2018, 20, 2286–2290. [Google Scholar] [CrossRef] [PubMed]
  26. Trayhurn, P. Hypoxia and Adipocyte Physiology: Implications for Adipose Tissue Dysfunction in Obesity. Annu. Rev. Nutr. 2014, 34, 207–236. [Google Scholar] [CrossRef] [PubMed]
  27. Famulla, S.; Schlich, R.; Sell, H.; Eckel, J. Differentiation of Human Adipocytes at Physiological Oxygen Levels Results in Increased Adiponectin Secretion and Isoproterenol-Stimulated Lipolysis. Adipocyte 2012, 1, 132–181. [Google Scholar] [CrossRef] [PubMed] [Green Version]
  28. Jocken, J.W.E.; Goossens, G.H.; Popeijus, H.; Essers, Y.; Hoebers, N.; Blaak, E.E. Contribution of lipase deficiency to mitochondrial dysfunction and insulin resistance in hMADS adipocytes. Int. J. Obes. 2015, 40, 507–513. [Google Scholar] [CrossRef]
  29. Rouschop, K.M.; Ramaekers, C.H.; Schaaf, M.B.; Keulers, T.G.; Savelkouls, K.G.; Lambin, P.; Koritzinsky, M.; Wouters, B. Autophagy is required during cycling hypoxia to lower production of reactive oxygen species. Radiother. Oncol. 2009, 92, 411–416. [Google Scholar] [CrossRef]
  30. Dardeno, T.A.; Chou, S.H.; Moon, H.-S.; Chamberland, J.P.; Fiorenza, C.G.; Mantzoros, C.S. Leptin in human physiology and therapeutics. Front. Neuroendocr. 2010, 31, 377–393. [Google Scholar] [CrossRef]
  31. Fasshauer, M.; Blüher, M. Adipokines in health and disease. Trends Pharmacol. Sci. 2015, 36, 461–470. [Google Scholar] [CrossRef] [PubMed]
  32. Celik, O.; Aydin, S.; Celik, N.; Yilmaz, M. Peptides: Basic determinants of reproductive functions. Peptides 2015, 72, 34–43. [Google Scholar] [CrossRef] [PubMed]
Figure 1. Adipokine and inflammatory markers’ gene expression in hMADS cells following differentiation under different pO2s (21% vs. 10% vs. 5% O2) (n = 9 paired samples): (A) leptin, (B) dipeptidyl-peptidase (DPP)-4, (C) interleukin (IL)-6, (D) plasminogen activator inhibitor (PAI)-1, (E) adiponectin, (F) tumour necrosis factor (TNF)α, and (G) monocyte chemoattractant protein (MCP)-1. Data are expressed as mean ± SEM. * p < 0.05.
Cells 11 03532 g001
Figure 2. Adipokine and inflammatory markers’ secretion in hMADS cells following differentiation under different pO2s (21% vs. 10% vs. 5% O2) (n = 9 paired samples). (A) Leptin, (B) dipeptidyl-peptidase (DPP)-4, (C) interleukin (IL)-6, (D) plasminogen activator inhibitor (PAI)-1, and (E) monocyte chemoattractant protein (MCP)-1. Data are expressed as mean ± SEM. * p < 0.05.
Cells 11 03532 g002
Table 1. Subjects’ characteristics.
ParameterNormal Weight (n = 9)Obesity (n = 9)p Value
Age (years)56.7 ± 1.856 ± 1.30.566
BMI (kg/m2)22.8 ± 0.434.8 ± 1.3<0.001
Waist circumference (cm)79.4 ± 3.1105.2 ± 3.8<0.001
Hip circumference (cm)94.4 ± 2.8119.9 ± 4.8<0.001
Waist-to-hip ratio0.84 ± 0.020.88 ± 0.040.127
Visceral fat mass (g)402.5 ± 1181,325 ± 153.30.003
Abdominal fat mass (kg)10.01 ± 1.4824.4 ± 2.37<0.001
Leg fat mass (kg)7.67 ± 0.8616.03 ± 1.430.001
Fasting glucose (mmol/L)4.91 ± 0.105.10 ± 0.230.416
2-hour glucose (mmol/L)4.90 ± 0.344.70 ± 0.330.684
Fasting insulin (pmol/L)28.40 ± 5.8043.30 ± 10.200.202
HOMA2 IR0.46 ± 0.100.72 ± 0.200.187
SBP (mmHg)119.6 ± 4.4133.0 ± 3.10.039
DBP (mmHg)73.6 ± 4.381.7 ± 1.90.153
BMI, body mass index; DBP, diastolic blood pressure; HOMA2 IR, Homeostasis Model Assessment 2 Insulin Resistance; SBP, systolic blood pressure. Data are mean ± SEM.
Publisher’s Note: MDPI stays neutral with regard to jurisdictional claims in published maps and institutional affiliations.

