Article

The Immediate Early Response of Lens Epithelial Cells to Lens Injury

Department of Biological Sciences, University of Delaware, Newark, DE 19716, USA
*
Author to whom correspondence should be addressed.
Cells 2022, 11(21), 3456; https://doi.org/10.3390/cells11213456
Submission received: 1 October 2022 / Revised: 17 October 2022 / Accepted: 21 October 2022 / Published: 1 November 2022
(This article belongs to the Special Issue New Advances in Lens Biology and Pathology)

Abstract

:
Cataracts are treated by lens fiber cell removal followed by intraocular lens (IOL) implantation into the lens capsule. While effective, this procedure leaves behind numerous lens epithelial cells (LECs) which undergo a wound healing response that frequently leads to posterior capsular opacification (PCO). In order to elucidate the acute response of LECs to lens fiber cell removal which models cataract surgery (post cataract surgery, PCS), RNA-seq was conducted on LECs derived from wild type mice at 0 and 6 h PCS. This analysis found that LECs upregulate the expression of numerous proinflammatory cytokines and profibrotic regulators by 6 h PCS suggesting rapid priming of pathways leading to inflammation and fibrosis PCS. LECs also highly upregulate the expression of numerous immediate early transcription factors (IETFs) by 6 h PCS and immunolocalization found elevated levels of these proteins by 3 h PCS, and this was preceded by the phosphorylation of ERK1/2 in injured LECs. Egr1 and FosB were among the highest expressed of these factors and qRT-PCR revealed that they also upregulate in explanted mouse lens epithelia suggesting potential roles in the LEC injury response. Analysis of lenses lacking either Egr1 or FosB revealed that both genes may regulate a portion of the acute LEC injury response, although neither gene was essential for expression of either proinflammatory or fibrotic markers at later times PCS suggesting that IETFs may work in concert to mediate the LEC injury response following cataract surgery.

1. Introduction

The lens is a transparent tissue that refracts light onto the retina and is thus critical for high resolution vision [1]. Cataract, the clouding of the ocular lens due to age, metabolic dysfunction, genetic abnormalities, or ocular injury, was historically the predominate cause of human blindness [2]. However, over the past 50 years, the global burden of cataract has been greatly reduced due to the development of cost effective extracapsular/phacoemulsification cataract extraction methods coupled with the implantation of artificial intraocular lenses which restore vision [3].
While modern cataract surgery has revolutionized the practice of ophthalmology, like all surgeries, it results in elevated inflammation at the wound site [4,5,6] leading to post-surgical pain and discomfort. As ocular inflammation can also trigger retinal edema, retinal detachment, and exacerbate uveitis [6,7,8,9,10] as well as fibrotic conditions [11,12], it is typically aggressively treated with a combination of steroids and NSAIDs either via eye drops [13,14] or “drop-less” methods [15] which instill anti-inflammatories into the eye at the time of surgery. While these drugs are highly effective, post-surgical inflammation still does occur, and is clinically observed as “flare” [16] defined by increases in the protein concentration of the aqueous humor and the influx of inflammatory cells into the anterior segment of the eye by 20–24 h post cataract surgery (PCS) [17,18].
Concomitant with inflammation, lens epithelial cells (LECs) left behind after cataract surgery undergo a wound healing response characterized by their increased proliferation and migration which occurs simultaneously with their phenotypic conversion into either myofibroblasts [19] or aberrant lens fiber cells [20,21]. Early in the development of extracapsular cataract surgery methods, these migratory lens–derived cells (LCs) would rapidly populate the posterior lens capsule, leading to the development of posterior capsular opacification (PCO) within weeks or months following cataract surgery. However, advanced IOL designs now physically sequester LCs to the capsular bag periphery, preventing their migration into the optical axis [11], which greatly reduced the incidence of PCO within a year following surgery. However, longer term, PCO is still of clinical concern as lens derived myofibroblasts persist years or even decades following cataract surgery [22], and can escape from the capsular bag periphery leading to PCO development at extended times PCS [23,24].
While the pathogenesis of ocular inflammation PCS has been attributed to mechanical disruption of the blood/aqueous barrier during surgery [25,26], the underlying molecular mechanisms driving this have not been well characterized. However, it has long been recognized that poor control of inflammation is associated with increased risks of retinal damage and aggressive PCO development PCS highlighting the importance of studying its etiology [7]. We recently discovered that the LECs remaining behind after lens fiber cell removal in both mouse [18,27,28] and human (manuscript in preparation) models of cataract surgery massively remodel their transcriptome by 24 h PCS to express high levels of both pro-inflammatory cytokines and fibrotic marker mRNAs. While our prior study found that LECs express elevated protein levels of some inflammatory cytokines by 3–6 h PCS [18], neither the extent of this initial pro-inflammatory response nor potential mechanisms regulating it were known.
Here, we used RNAseq to globally profile the transcriptional changes that mouse LECs undergo by six hours after fiber cell removal in a mouse model of cataract surgery in order to characterize the acute response of these cells to surgery and tested the function of two potential regulators of this initial response.

2. Methods

2.1. Animals

All procedures using mice comply with the Association for Research in Vision and Ophthalmology on the Use of Animals in Vision and Ophthalmologic Research and were approved by the University of Delaware Institutional Animal Care and Use Committee under protocol #1039-2021-1. Animals were bred and maintained in ventilated caging at the University of Delaware animal facility under a 14/10 h light-dark cycle and received food ad libitum.
Mice harboring a germline deletion of the Egr1 (Egr1KO) gene were obtained from the Jackson Laboratory ((JAX stock #012924; B6N; 129-Egr1tm1Jmi/J) [29], where they were deposited by Dr. Jeffery Milbrandt, Washington University School of Medicine, St. Louis. These mice were genotyped for lack of an intact Egr1 gene via PCR analysis utilizing the following primers: Common forward: 5′-GGG-CAC-AGG-GGA-TGG-GAA-TG-3′, Wildtype reverse: 5′-AAC-CGG-CCC-AGC-AAG-ACA-CC-3′, Mutant reverse:5′-CTC-GTG-CTT-TAC-GGT-ATC-GC-3′.
Mice harboring a FosB allele where exon 2 and 3 are flanked by lox p sites (Fosbtm1.1Nes) [30]. were obtained from Drs. Alfred Robinson (Michigan State University) and Eric Nestler (Icahn School of Medicine at Mount Sinai). MLR10 cre mice (Tg(Cryaa-cre)10Mlr) binding site modified alpha-A crystallin promoter [31] were obtained on an FVB/N background from Dr. Michael Robinson (Miami University, Oxford, OH, USA) and backcrossed to C57Bl/6 mice for over 10 generations at the University of Delaware. Mice lacking the FosB gene from the lens (FosBcKO mice) were generated by mating Fosbtm1.1Nes mice with Tg(Cryaa-cre)10Mlr mice. Mice were genotyped for the presence of the floxed FosB allele, and MLR10cre transgene via PCR utilizing the following primers: FosB flox forward: 5′-GCT-GAA-GGA-GAT-GGG-TAA-CAG-3′ and reverse: 5′-AAG-CCT-GGT-ATG-GTG-A-3′: MLR10cre forward: 5′-CCT-GTT-TTG-CAC-GTT-CAC-CG-3′ and reverse: 5′-ATG-CTT-CTG-TCC-GTT-TGC-CG-3′. Successful deletion of exon 2 and 3 of the FosB gene was confirmed by PCR using genomic DNA isolated from adult mouse lenses utilizing the following primers: forward: 5′-TTC-CCT-TCC-TAT-TTG-TAG-AGC-GTA-G-3′ and reverse: 5′-TGC-TAC-TTG-TGC-CTC-GGT-TTC-C-3′.

2.2. Morphological Analysis

Histological analysis was conducted by isolating eyes from euthanized mice and immediately fixing them in Davidson’s Fixative Solution (Electron Microscopy Sciences, Hatfield, PA, USA). The fixed eyes were sent to HistoWiz (Brooklyn, NY, USA), where they were sectioned and stained with hematoxylin and eosin (H&E). The H&E stained slides were then photographed on a Zeiss Axio Observer epifluorescent microscope (Carl Zeiss Inc., Gottingen, Germany).
Lens clarity was assessed by viewing isolated lenses using darkfield optics. Lens optical properties were assessed following previously described methods [32,33] by placing the lenses on a 200-mesh electron microscopy grid. Images were collected with a Zeiss Stemi SV microscope fitted with a darkfield base (Carl Zeiss Inc., Gottingen, Germany).
Lens measurements were conducted by taking images of the reflection of the lens through a 45° mirror (face = 5 mm × 5 mm) (Edmund Optics, Barrington, NJ, USA) as previously described [34] in a plastic box with 1XPBS. The mirror was positioned at a constant distance from the lens and an in-focus image of the mirror edge (length = 5 mm) was also collected for distance calibration. Image measurements were calculated by Fiji ImageJ v52 [35] based on the distance calibration.

2.3. Mouse Cataract Surgery Model

Lens fiber cells were surgically removed from living 3–5 months old mice of both sexes to simulate the extracapsular lens extraction surgery typically performed to treat human cataract [36,37]. Notably, this surgery differs from human cataract surgery in that an anterior capsulotomy is not performed and the lens fiber cell mass is removed as a single unit. Generally, no additional aspiration of lens cortical material is needed for complete fiber cell removal in this method. Samples were collected from euthanized animals at various times post fiber cell removal including 0, 1, 3, 6, 12, 24, 48, 72, and/or 120 h post surgery (post cataract surgery, PCS).

2.4. Next Generation RNA Sequencing and Bioinformatic Analysis

Lens capsular bags with the attached lens cells (LCs) were dissected at either 0 or 6 h PCS. Samples from five independent animals were pooled to create a single biological replicate, then flash frozen on dry ice as previously described [27,28].
Total RNA was extracted from each biological replicate using the RNeasy Mini Kit from Qiagen (Cat No./ID: 74104). RNA libraries were prepared using the SMARTer® Stranded Total RNA-Seq Kit-Pico Input Mammalian (Takara Bio USA, Inc., Mountain View, CA, USA) and sequenced by DNA Link, USA (1000 S Hope St. unit 521 Los Angeles, CA 90015, USA) on a Novaseq 6000 (Los Angeles, CA, USA). Read pairs (101 nucleotides long) were aligned to the Ensembl primary assembly of the mouse GRCm38 genome [38] using the default parameters of Hisat2 [39]. Using the HTseq-Count in union mode [40], read pairs aligned to the genomic features annotated in an Ensembl Mouse GTF file were quantified as gene level counts. The Ensembl version 100 GTF file was used for the initial analysis, and the Ensembl version 104 GTF File was used for later analyses. Following the merging of overlapping exons, length normalized abundance estimates, Fragments per Kilobase-Million (FPKM), were calculated from gene level counts using the total length of all known exons for a given gene.
Samples were partitioned for Trimmed Median of Means (TMM) scaling [41,42] and differential expression analyses were performed based on the objective of a particular contrast.
The edgeR statistical package (version 3.30.3) was used to estimate the magnitude and statistical significance of differential gene expression, with robust dispersion estimates [41,42]. For the initial analysis, edgeR’s “Quasi-Likelihood F-Test (QLF-Test) was used for differential expression analysis. It was later determined that in certain cases, the QLF-Test may be overly conservative for data derived from this experiment, thus edgeR’s “exact test” was used for the subsequent analysis. As significant effort had been applied to the interpretation of the initial study results, and DEG detected by the QLF-Test are usually also captured by the exact test, reanalysis of the initial study was considered unnecessary. Genes with at least 10 mapped reads in at least three samples were considered to have “detectable” levels of expression. Genes failing “detectable” criteria were removed using edgeR’s “filterByExpr” function [43], prior to running statistical tests. Biologically significant differentially expressed genes (DEGs) were characterized as genes exhibiting a statistically significant difference in expression using edgeR’s default method to adjust for False Discovery Rate (FDR ≤ 0.05); a difference in expression level greater than 2 FPKM between PCS conditions, Fold Change (FC) greater than 2 in either the positive or negative direction and expressed at a level greater than 2 FPKM as previously used [44].

2.5. Pathway Analyses

iPathwayGuide (Advaita Bioinformatics, Plymouth, MI, USA) pathway analysis was performed on all statistically significant DEGs defined as those exhibiting a fold change ≥ |2| and FDR ≤ 0.05. iPathwayGuide uses Impact Analysis, which considers the directed interactions of DEGs within a pathway (as defined by the Kyoto Encyclopedia of Genes and Genomes, KEGG [45], Release 96.0 + 11–21, Nov 20) and if more pathway participants are observed in the DEG list than would be estimated by chance [46,47,48]. Gene ontology comparisons were made against the 14 October 2020 release of the Gene Ontology Consortium database [49].

2.6. Lens Dissections, Culture and RNA Extractions

Mouse lenses were dissected from the eye after mouse sacrifice using sterile forceps. The lens capsule was removed from the lens then suspension cultured in Medium 199 (ThermoFisher Scientific, Waltham, MA, USA) with 1% penicillin-streptomycin for 6 h or immediately placed into 600 µL of Trizol (two lens capsules/biological replicate; ThermoFisher Scientific, Waltham, MA, USA) and stored at −20 °C. After 6 h of culture, the explants were also placed in Trizol (2 capsules per biological replicate) and stored at −20 °C. Crude RNA was isolated following manufacturer methods and was further purified using the RNA Clean & ConcentratorTM-5 kit (ZYMO Research, Irvine, CA, USA). Isolated RNA was stored in −80 °C until use.

2.7. cDNA Synthesis and Quantitative RT-PCR

cDNA was synthesized from lens cell RNA using the iScript cDNA Synthesis Kit (Bio-Rad, Hercules, CA and used for real-time quantitative PCR (qRT-PCR) conducted using the Power SYBR Green kit (Invitrogen Life Technology, Carlsbad, CA, USA) using the gene-specific primers shown in Supplementary Table S1. Three biological replicates were analyzed with 2 technical replicates each for each experimental condition and fold-change calculated using the ΔΔCT-method with GAPDH as the housekeeping gene. Statistical significance was determined using a Student’s two sample t-test.

2.8. Immunofluorescence and Confocal Imaging

Quantitative immunofluorescence was conducted to determine protein level expression in ocular tissue as previously described [50,51]. Briefly, eyes were placed in Optimum Cutting Temperature (OCT) Media (Tissue Tek, Torrance, CA, USA) following harvest and stored at −80 °C. The frozen blocks were then sectioned at 16µm using the Leica CM3050 cryostat (Leica Microsystems, Buffalo Grove, IL, USA) and placed on Color Frost plus microscope slides (Fisher Scientific, Hampton, NH, USA). Slides were fixed under conditions chosen to best optimize staining for the antibody of interest (Supplementary Table S2). Following fixation, blocking buffer optimized for each antibody (100 µL) was applied to each slide for 1 h at room temperature in a humid chamber (see Supplementary Table S2). Immediately afterwards, the primary antibody diluted in blocking buffer is applied and incubated for either 1 h at room temperature or overnight in 4 °C depending on the antibody (Supplementary Table S2). After primary antibody incubation, slides were washed three times in 1XPBS for 5 min, then the species appropriate Alexa Fluor 488/568 (ThermoFisher Scientific, Waltham, MA, USA) conjugated secondary antibody (if needed) is used at a 1:200 dilution in blocking solution which includes a 1:2000 dilution of Draq-5 (ThermoFisher Scientific, Waltham, MA, USA) to stain DNA and incubated for 1 h at room temperature. After washing, samples were wet mounted in a glycerol based antifade and cover slipped prior to imaging.
During confocal imaging, the negative control was used to measure minimum laser threshold levels to subtract from other experimental images [50,51], in order, to set a baseline, which removes low levels of non-specific binding caused by the secondary antibody. Each immunofluorescence staining experiment was performed with a minimum of three biological replicates. Imaging of the lens capsule and associated lens cells was performed on either a Zeiss LSM780 or Zeiss LSM880 confocal microscope (Carl Zeiss Inc., Gottingen, Germany). The confocal imaging of all slides in the same experiment were imaged the same day using the same imaging parameters to allow direct comparison of experimental conditions and reduce variability [51]. For some figures, brightness and contrast were adjusted post confocal acquisition for optimum viewing on various platforms, but in all cases identical adjustments were on images to be directly compared.

2.9. ImageJ Quantification and Statistical Analysis

Immunofluorescence intensities were quantified on a minimum of three independent biological replicates as previously described (Shihan et al., 2021a). All statistics were performed using either a Student’s t-test (correct for multiple comparisons using the Holm-Šídák method) or one-way ANOVA with Tukey’s post hoc test. Data are presented as mean ± standard error (SE) with statistical differences considered significant when p ≤ 0.05.

3. Results

Lens epithelial cells of both mice and humans drastically upregulate the expression of numerous inflammatory mediators and fibrotic marker genes by 24 h post cataract surgery (PCS) [18,52]. However, the mechanisms by which lens fiber cell removal drives this transcriptomic shift were unknown. As the earliest change we have observed in lens-derived cells (LCs) post fiber cell removal is the initial upregulation of inflammatory mediators at 6 h PCS [18], we conducted an unbiased RNAseq analysis on wild type mice at 6 h PCS to elucidate potential mechanisms regulating this process. The raw and processed data for this analysis is deposited in the Gene expression omnibus database under accession number GSE206563.

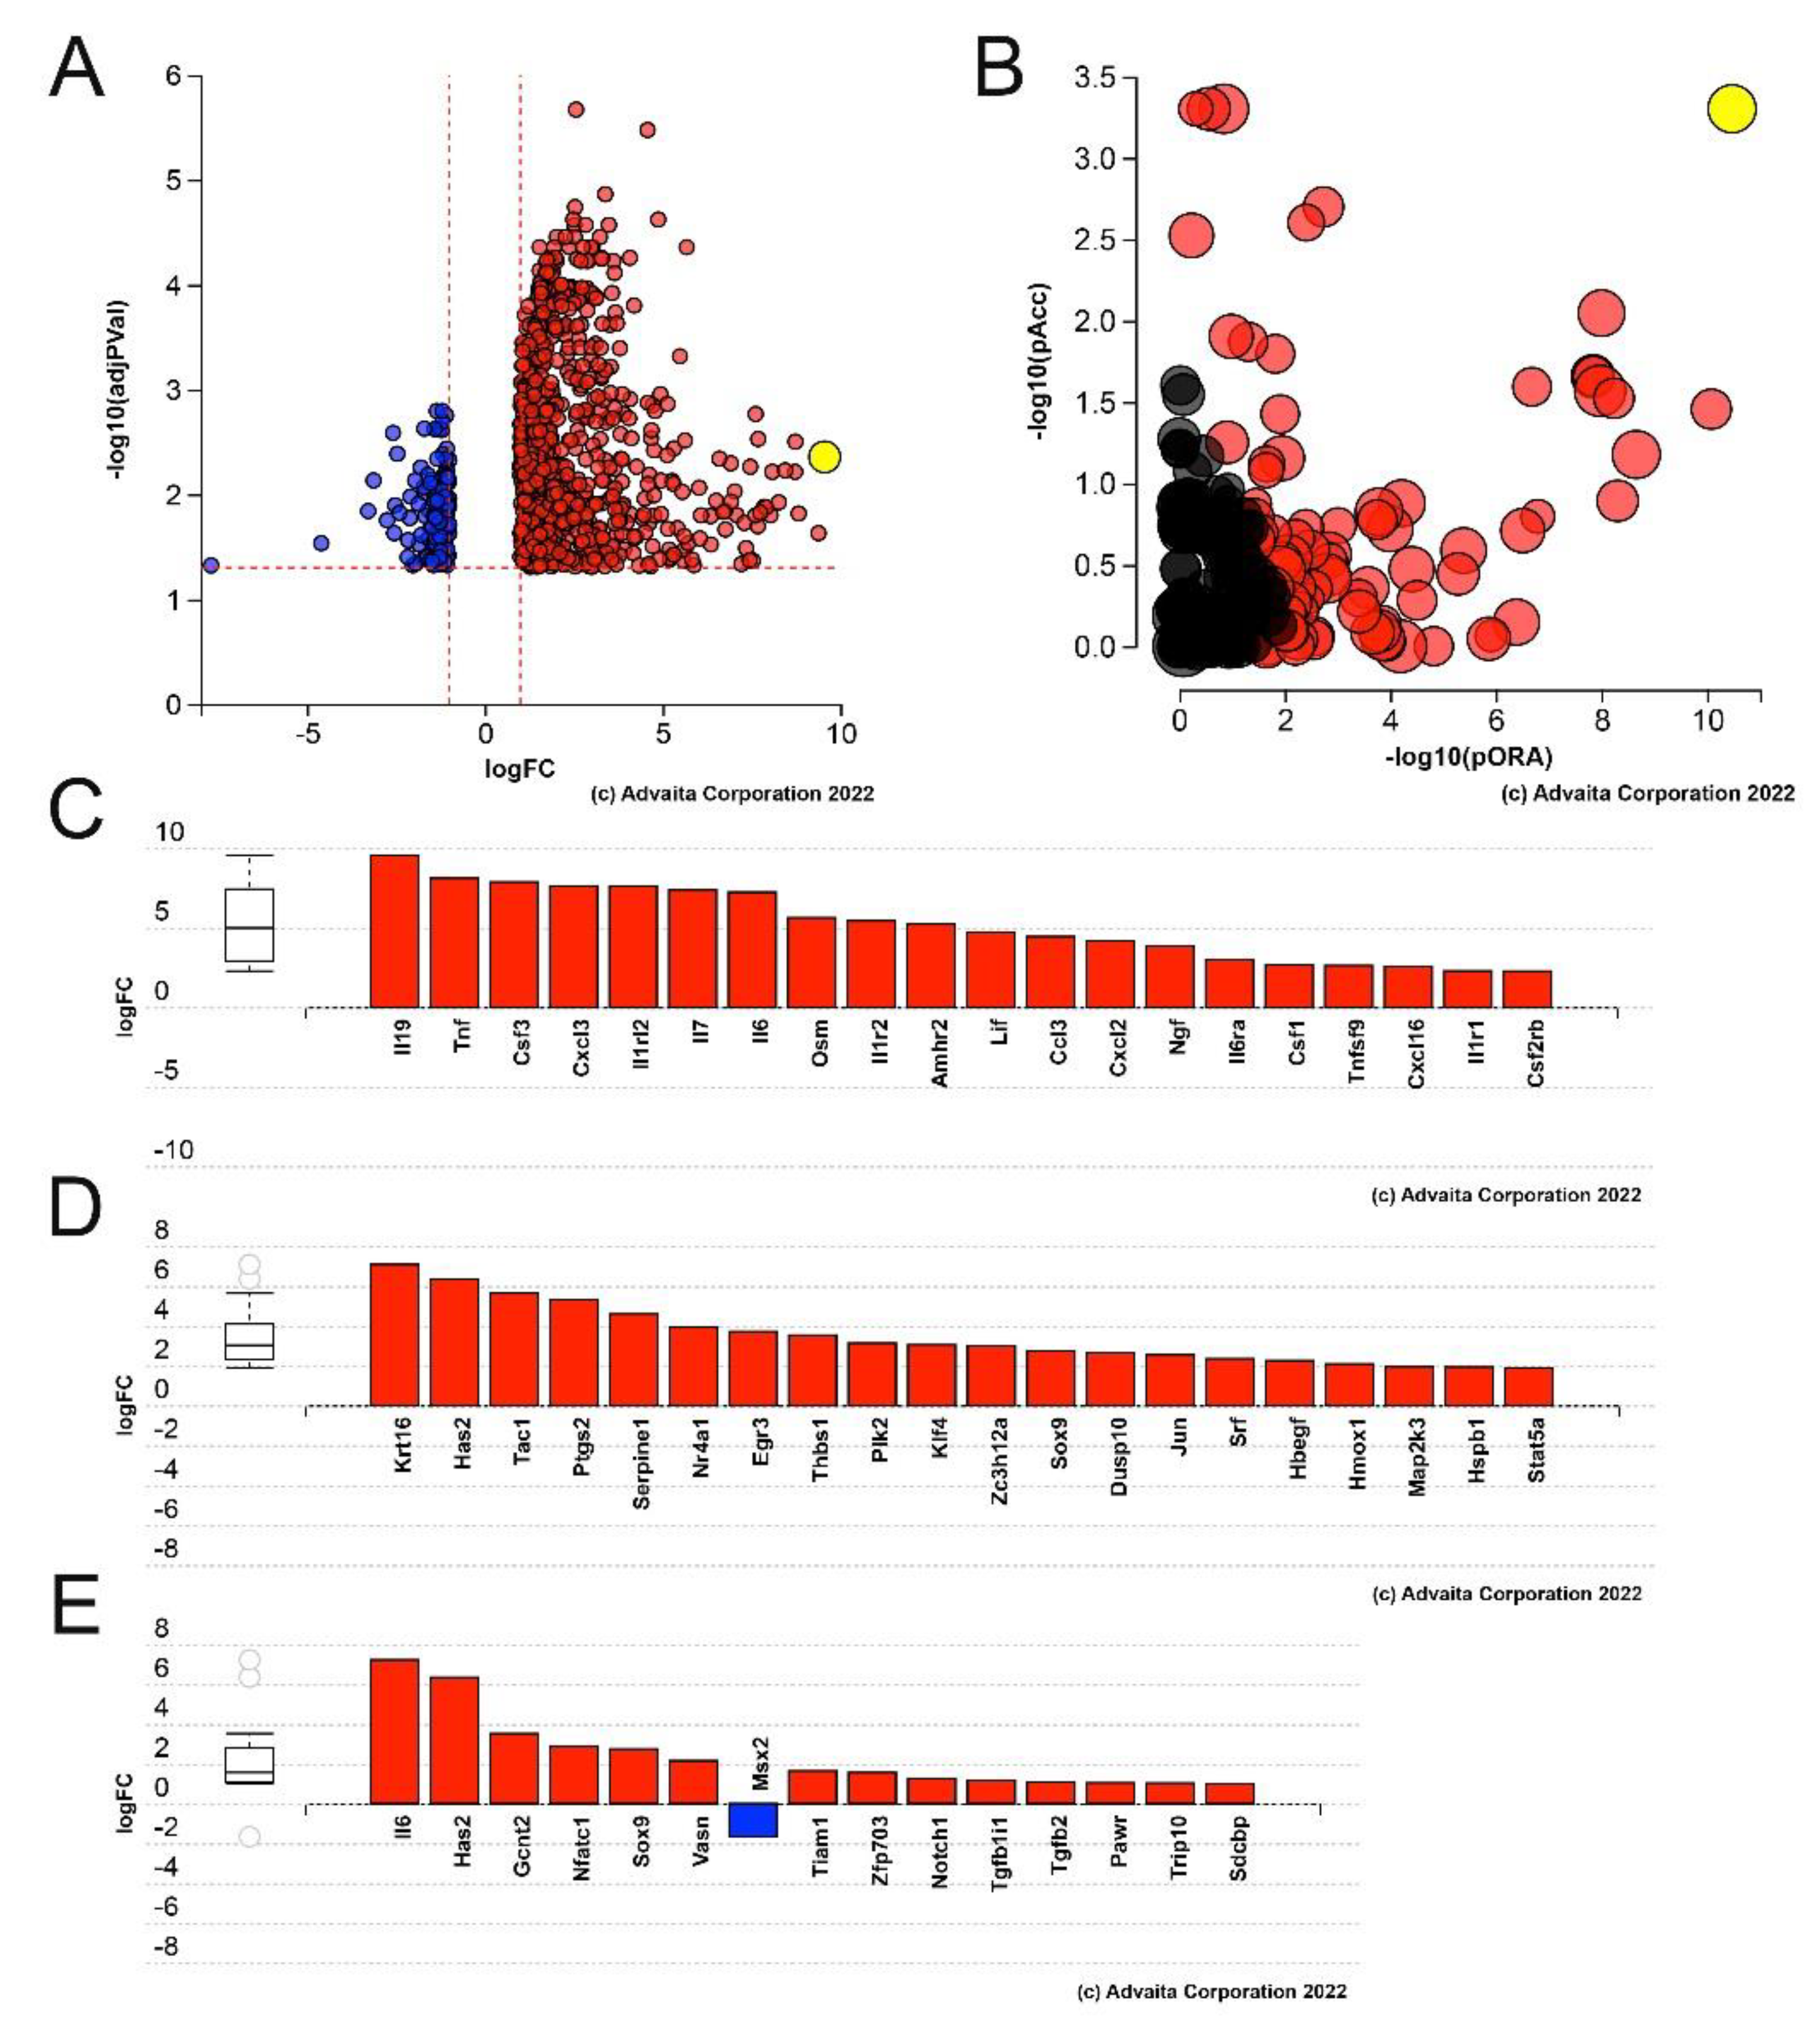
3.1. Lens Epithelial Cells Upregulate the Expression of Numerous Pro-Inflammatory Cytokines by 6 h PCS, but Do Not Yet Upregulate the Expression of Fibrotic Markers

RNAseq revealed that the normal adult mouse epithelium expresses mRNAs encoded by 17,981 genes while 913 genes were differentially expressed at 6 h PCS by at least two fold at a false discovery rate (FDR) corrected p value ≤ 0.05. Filtering these differentially expressed genes (DEGs) for their likelihood to effect cellular biology (“biologically significant” genes exhibit a minimum expression level of 2 FPKM in either condition and at least a 2 Fragments per Kilobase-Million (FPKM) absolute change in expression level [44]), as previously described, revealed 615 DEGs with 547 DEGs being upregulated and 68 DEGs being downregulated (Figure 1A, see Supplementary Table S3).
Advaita iPathway Guide analysis of the DEGs detected in lens epithelial cells (LECs) at 6 h PCS revealed that, like at 24 h PCS [18], the “cytokine-cytokine receptor interaction” pathway was the most impacted with a p-value of 1.120 × 10⁻⁸ (Figure 1B). Of the 615 biologically significant DEGs, the top most upregulated gene at 6 h PCS was Il19, which is implicated in the inflammatory response [53] (Figure 1A, Table 1) while the mRNA for Ptgs2 which encodes the cyclooxygenase Cox2 was upregulated 37 fold and Csf3 was upregulated 233 fold (Table 1) consistent with our prior observation that both Cox2 and Csf3 were upregulated at the protein level in LECs by 6 h PCS [18].
In addition, the DEGs detected at 6 h PCS were significantly enriched in those mapping to pathways necessary for posterior capsular opacification (PCO) pathogenesis including those involved in “epithelial cell migration” (p-value = 9600 × 10−5) and “epithelial to mesenchymal transition” (p-value = 0.003) (Figure 1D,E). Despite this, fibrotic marker mRNAs commonly associated with fibrotic PCO pathogenesis are not significantly upregulated in LECs by 6 h PCS (Table 2) which suggests that LECs induce inflammatory responses prior to fibrotic responses after lens injury.
While these data revealed that numerous genes were rapidly upregulated PCS, the mechanisms driving this upregulation were unclear. Notably, Advaita iPathway guide Impact analysis of the DEGs in LECs 6 h after lens fiber cell removal revealed that genes involved in Mitogen activated kinase (MAPK) pathways were enriched in this gene set (Figure 2A; p-value = 1.165 × 10⁻⁶). Immunostaining of LECs for phosphorylated ERK1/2 (pERK1/2) revealed that nuclear pERK1/2 levels were sharply elevated at 1 h PCS, decrease by 3 h PCS, then begin to increase again to variable extents by 6 h PCS (Figure 2B–D).

3.2. Many Immediate Early Transcription Factors Are Upregulated in LECs by 6 h PCS

The changes in the LEC transcriptome at 6 h PCS revealed that LECs rapidly induce the expression of many genes after lens fiber cell removal, however, it was less clear how these changes in RNA levels are regulated. Interestingly, FosB, a member of AP1 family of transcription factors, was one of the most induced and abundantly expressed upregulated genes (130 fold change; FPKM = 198) in LECs at 6 h PCS (Table 1). FosB is also recognized to be an immediate early transcription factor (IETF) as its expression is often rapidly induced by cell signaling cascades such as MAPK [54,55]. Notably, comparison between the list of genes differentially expressed in LECs at 0 versus 6 h PCS with a list of IETFs identified in other studies [56,57], revealed that the expression of 27 different IETFs are induced by LECs at 6 h after lens fiber cell removal (Table 3).

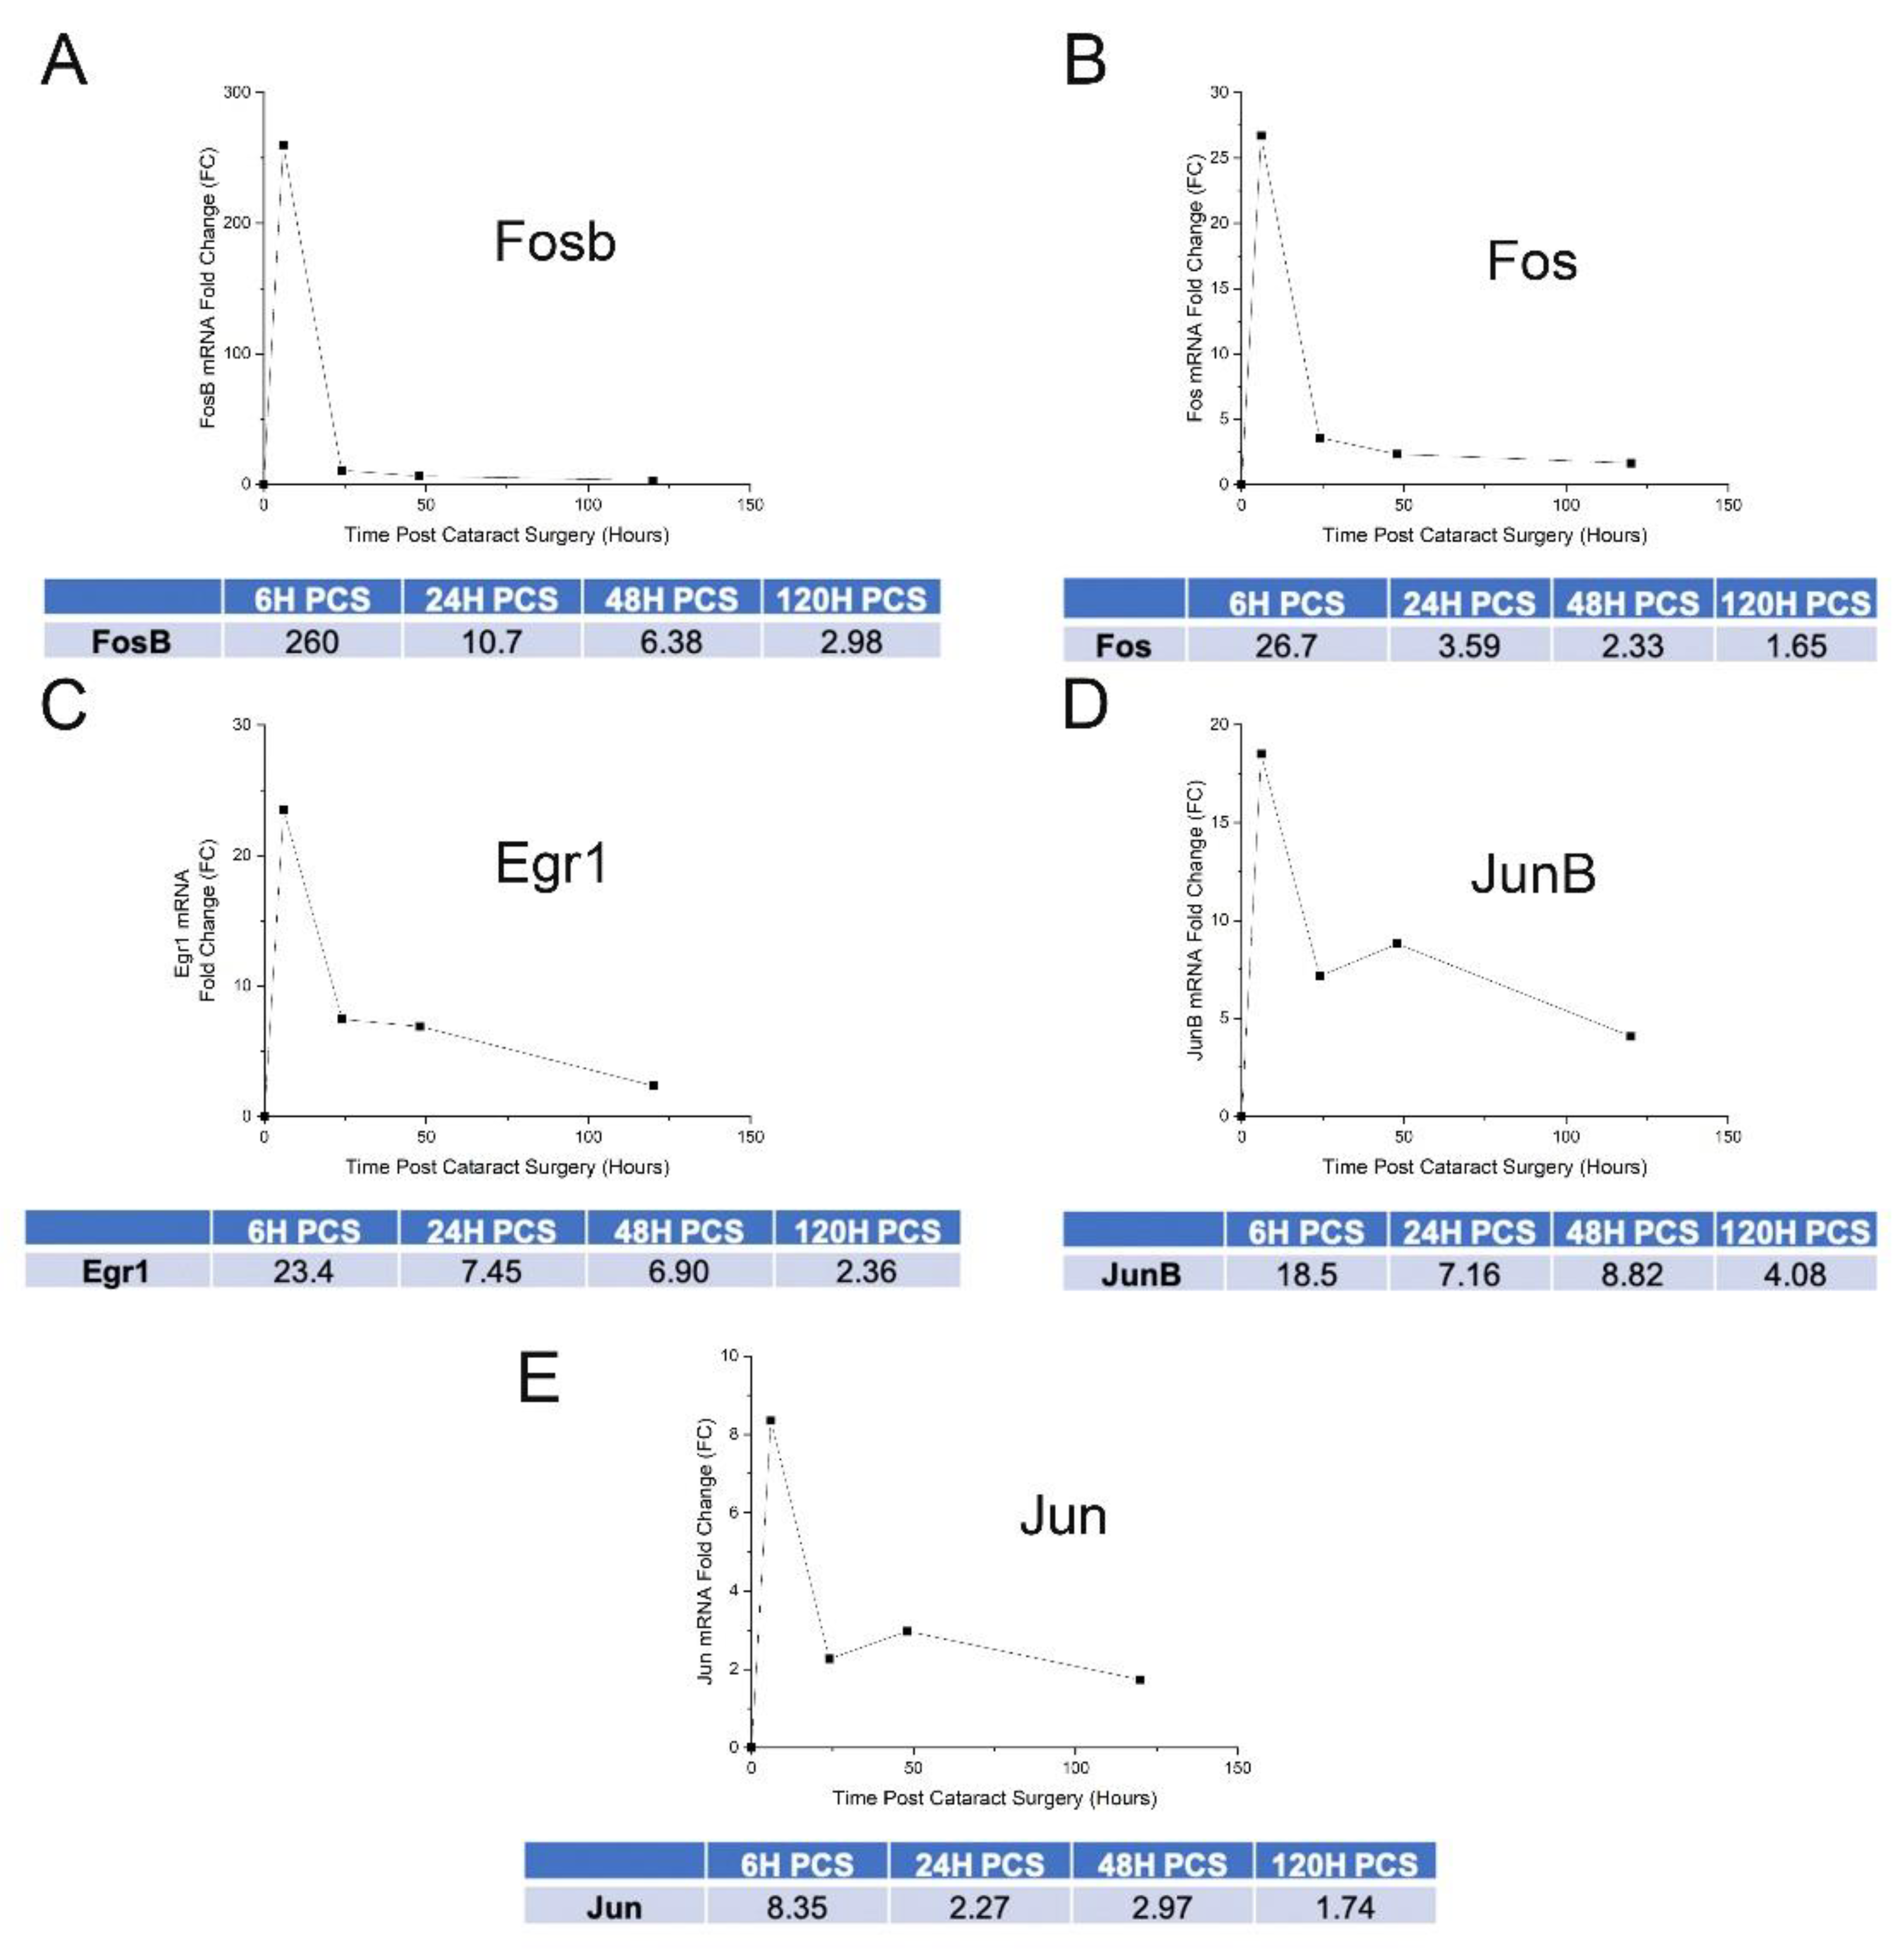
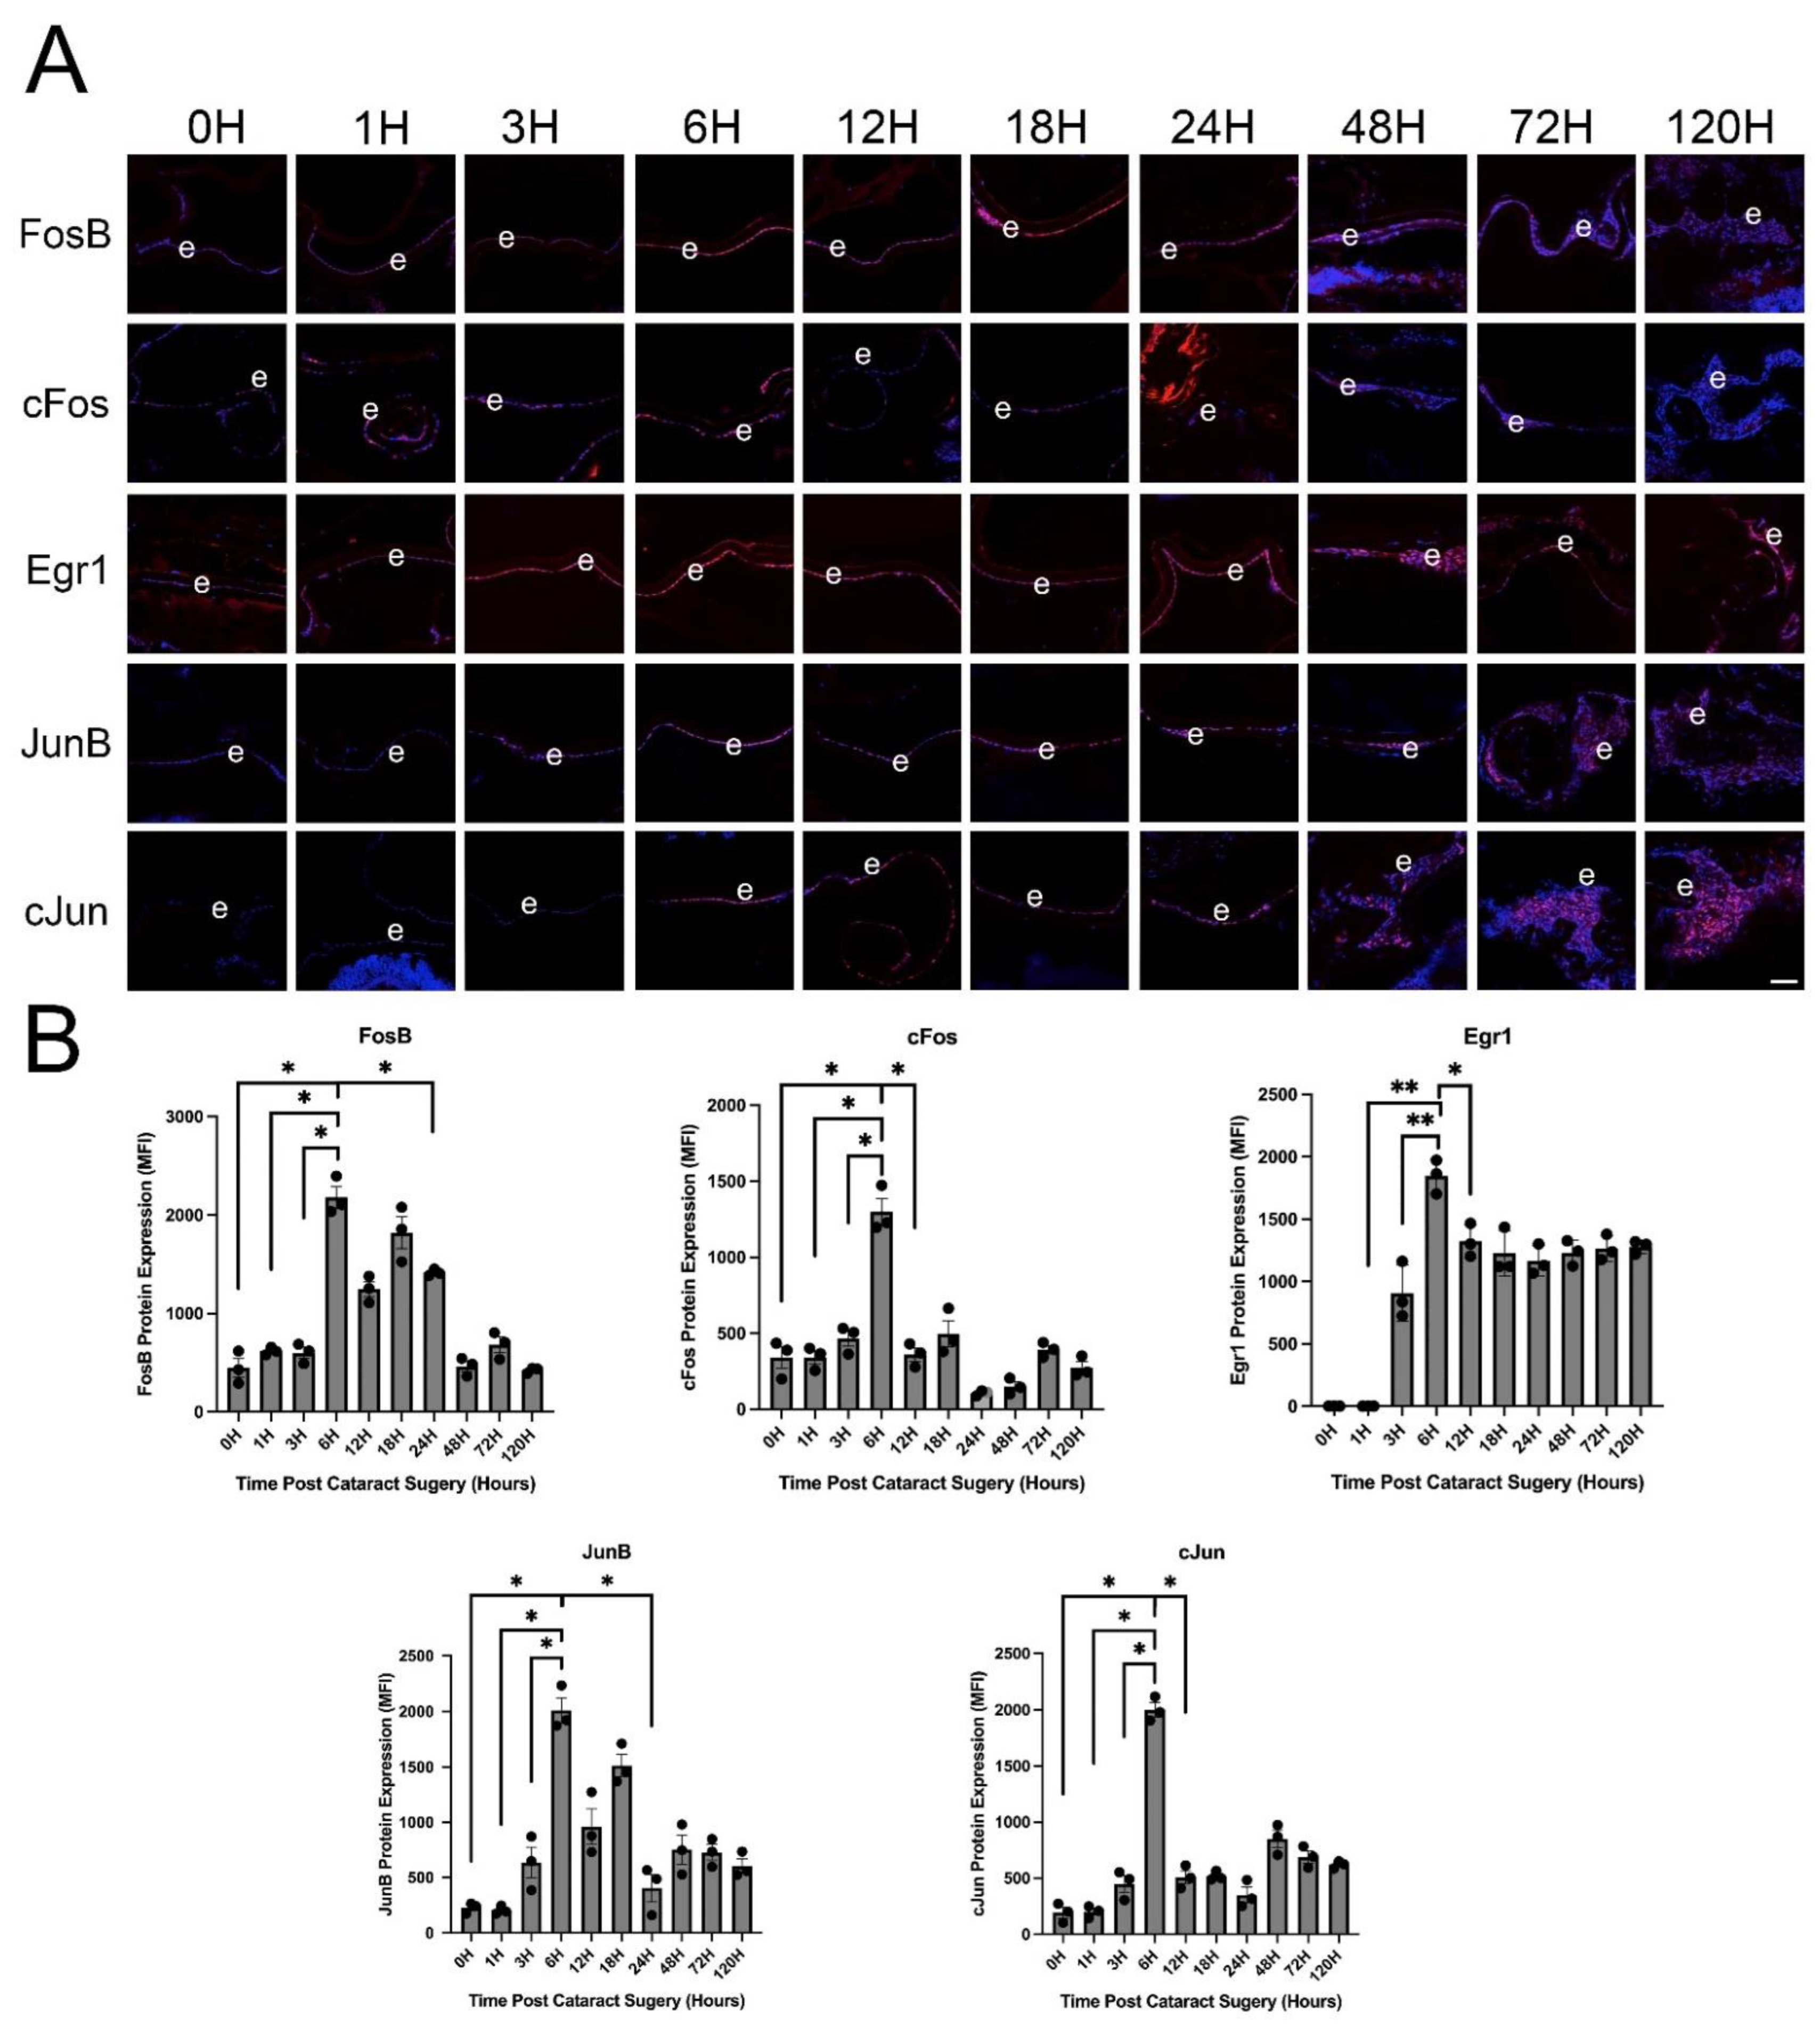
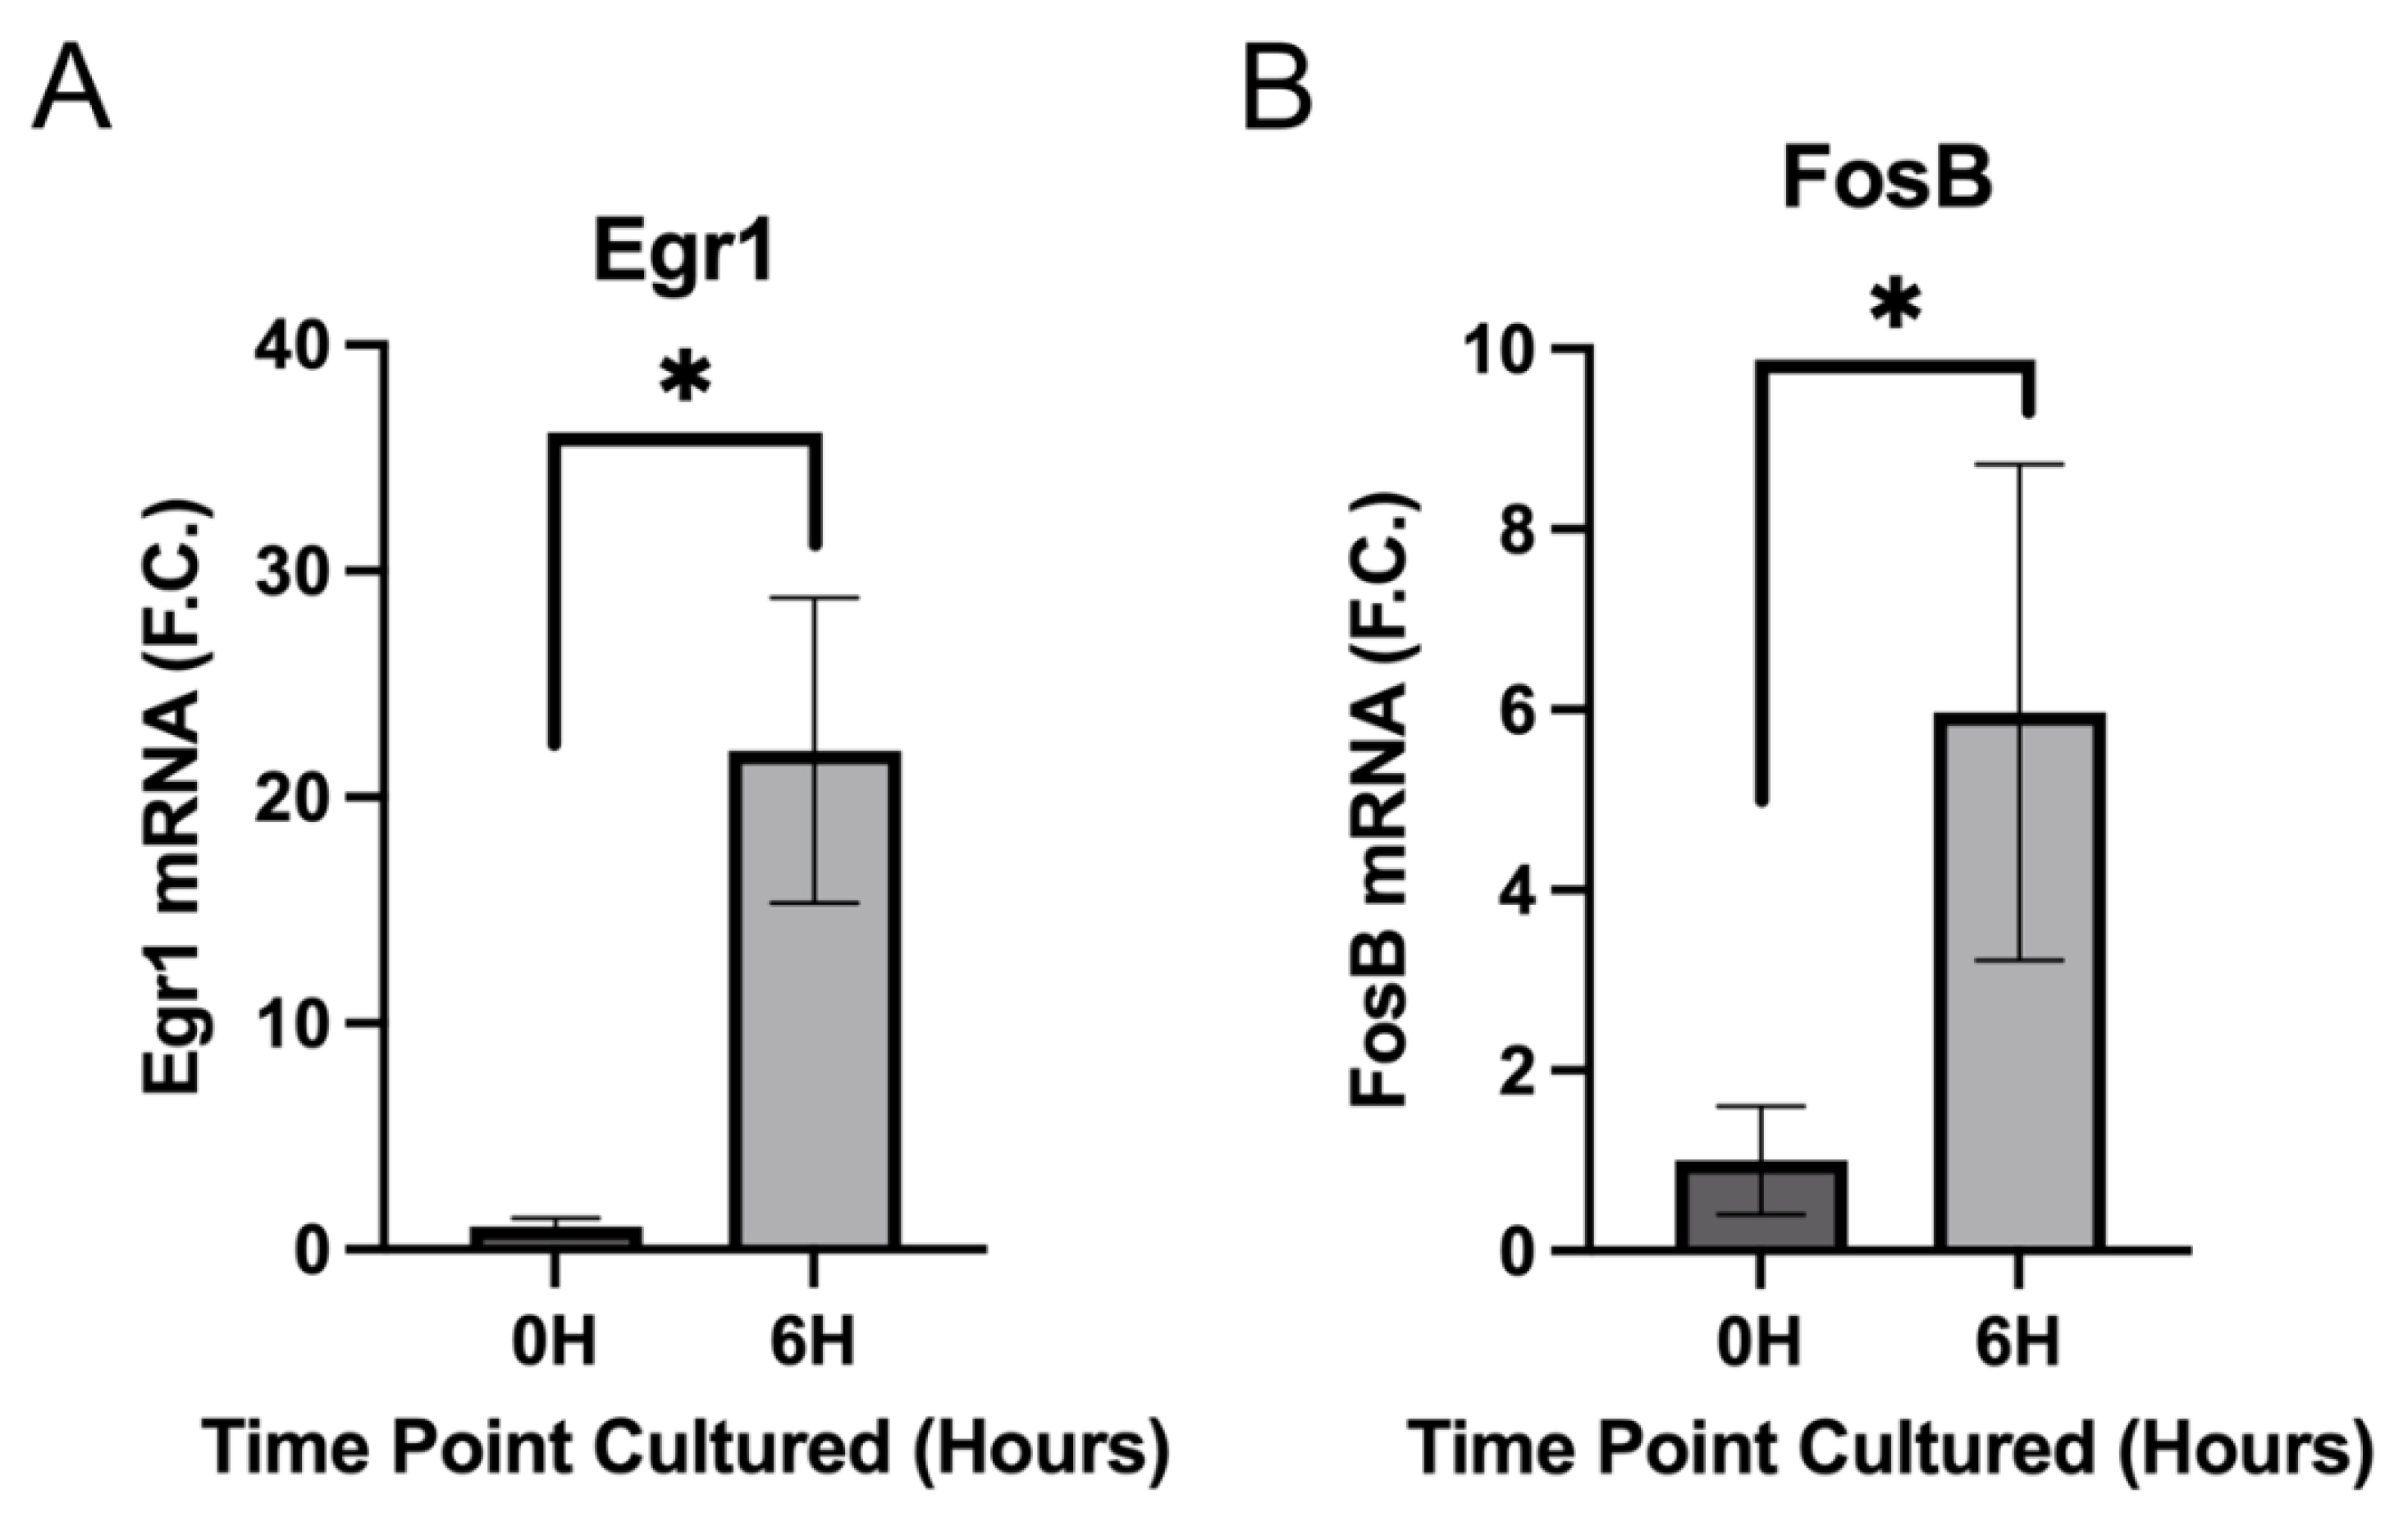
3.3. IETF MRNA and Protein Levels Acutely Upregulate in LECs at 6 h PCS then Rapidly Fall

We have compiled a database of global gene expression changes occurring in LECs between 0–120 h PCS as measured by bulk RNAseq (lens injury response time series/LIRTS, unpublished) and used this to discover the dynamics of IETF expression in LECs from 0–120 h PCS. This revealed that the mRNA levels of these genes are typically highly induced at 6 h PCS, then sharply downregulate by 24 h PCS (Figure 3). As IETFs have the potential to be mediating the LEC wound healing response, we then validated whether a select set of the IETFs whose mRNA levels upregulate in injured mouse lenses in vivo are also upregulated at the protein level. This analysis revealed that the protein levels of FosB, Egr1, Fos (cFos), JunB and Jun (cJun) all upregulate robustly and significantly in LECs by 6 h PCS, and then begin to downregulate over the next 5 days (Figure 4). Next, we attempted to understand whether this rapid induction of IETF expression in LECs PCS was driven by a cell autonomous LEC response or was triggered by something in the ocular environment. Lenses were dissected, and the lens capsule with attached LECs was either immediately frozen or placed into culture in serum free media for six hours. qRT-PCR analysis of these samples revealed that both FosB and Egr1 mRNA levels upregulate in LECs after 6 h of culture (Figure 5) demonstrating that IETF induction by LECs following injury can occur in the absence of signals from other ocular structures.

3.4. Removal of the Gene Encoding the IETF Egr1 from the Lens Only Has a Minor Impact on Lens Phenotype

While IETF expression acutely upregulates in LECs at both the RNA and protein levels PCS, their role in the lens injury response was unknown. Notably, Egr1, the most abundantly expressed IETF at the mRNA level (Table 3) which also upregulates at the protein level at 6 h PCS (Figure 4), is a negative regulator of myopia [58] whose expression upregulates in the lens following selenite stress [59] as well as Hsf4 [60] and β1-integrin gene deletion [61]. While the functional importance of Egr1 in the wild type lens is unclear, removal of the Egr1 gene from β1-integrin conditional knockout lenses partially rescued their fibrotic/apoptotic phenotype [61]. Thus, we investigated the possible function of Egr1 in the LEC injury response using Egr1 knockout (Egr1KO) mice [29].
We first confirmed that Egr1KO mice did not express the Egr1 protein (and validated the Egr1 antibody used in this study) by quantitative immunofluorescence (Supplementary Figure S1). Morphologically, adult Egr1KO lenses were the same size as those from their wildtype littermates, but exhibited subtle refractive abnormalities and focal opacities. Hematoxylin and eosin (H&E) staining suggest that Egr1KO lenses are phenotypically similar to wildtype although they may have a slight disorganization of their transition zone (Supplementary Figure S1) suggesting that Egr1 may play a role in regulating adult lens structure.

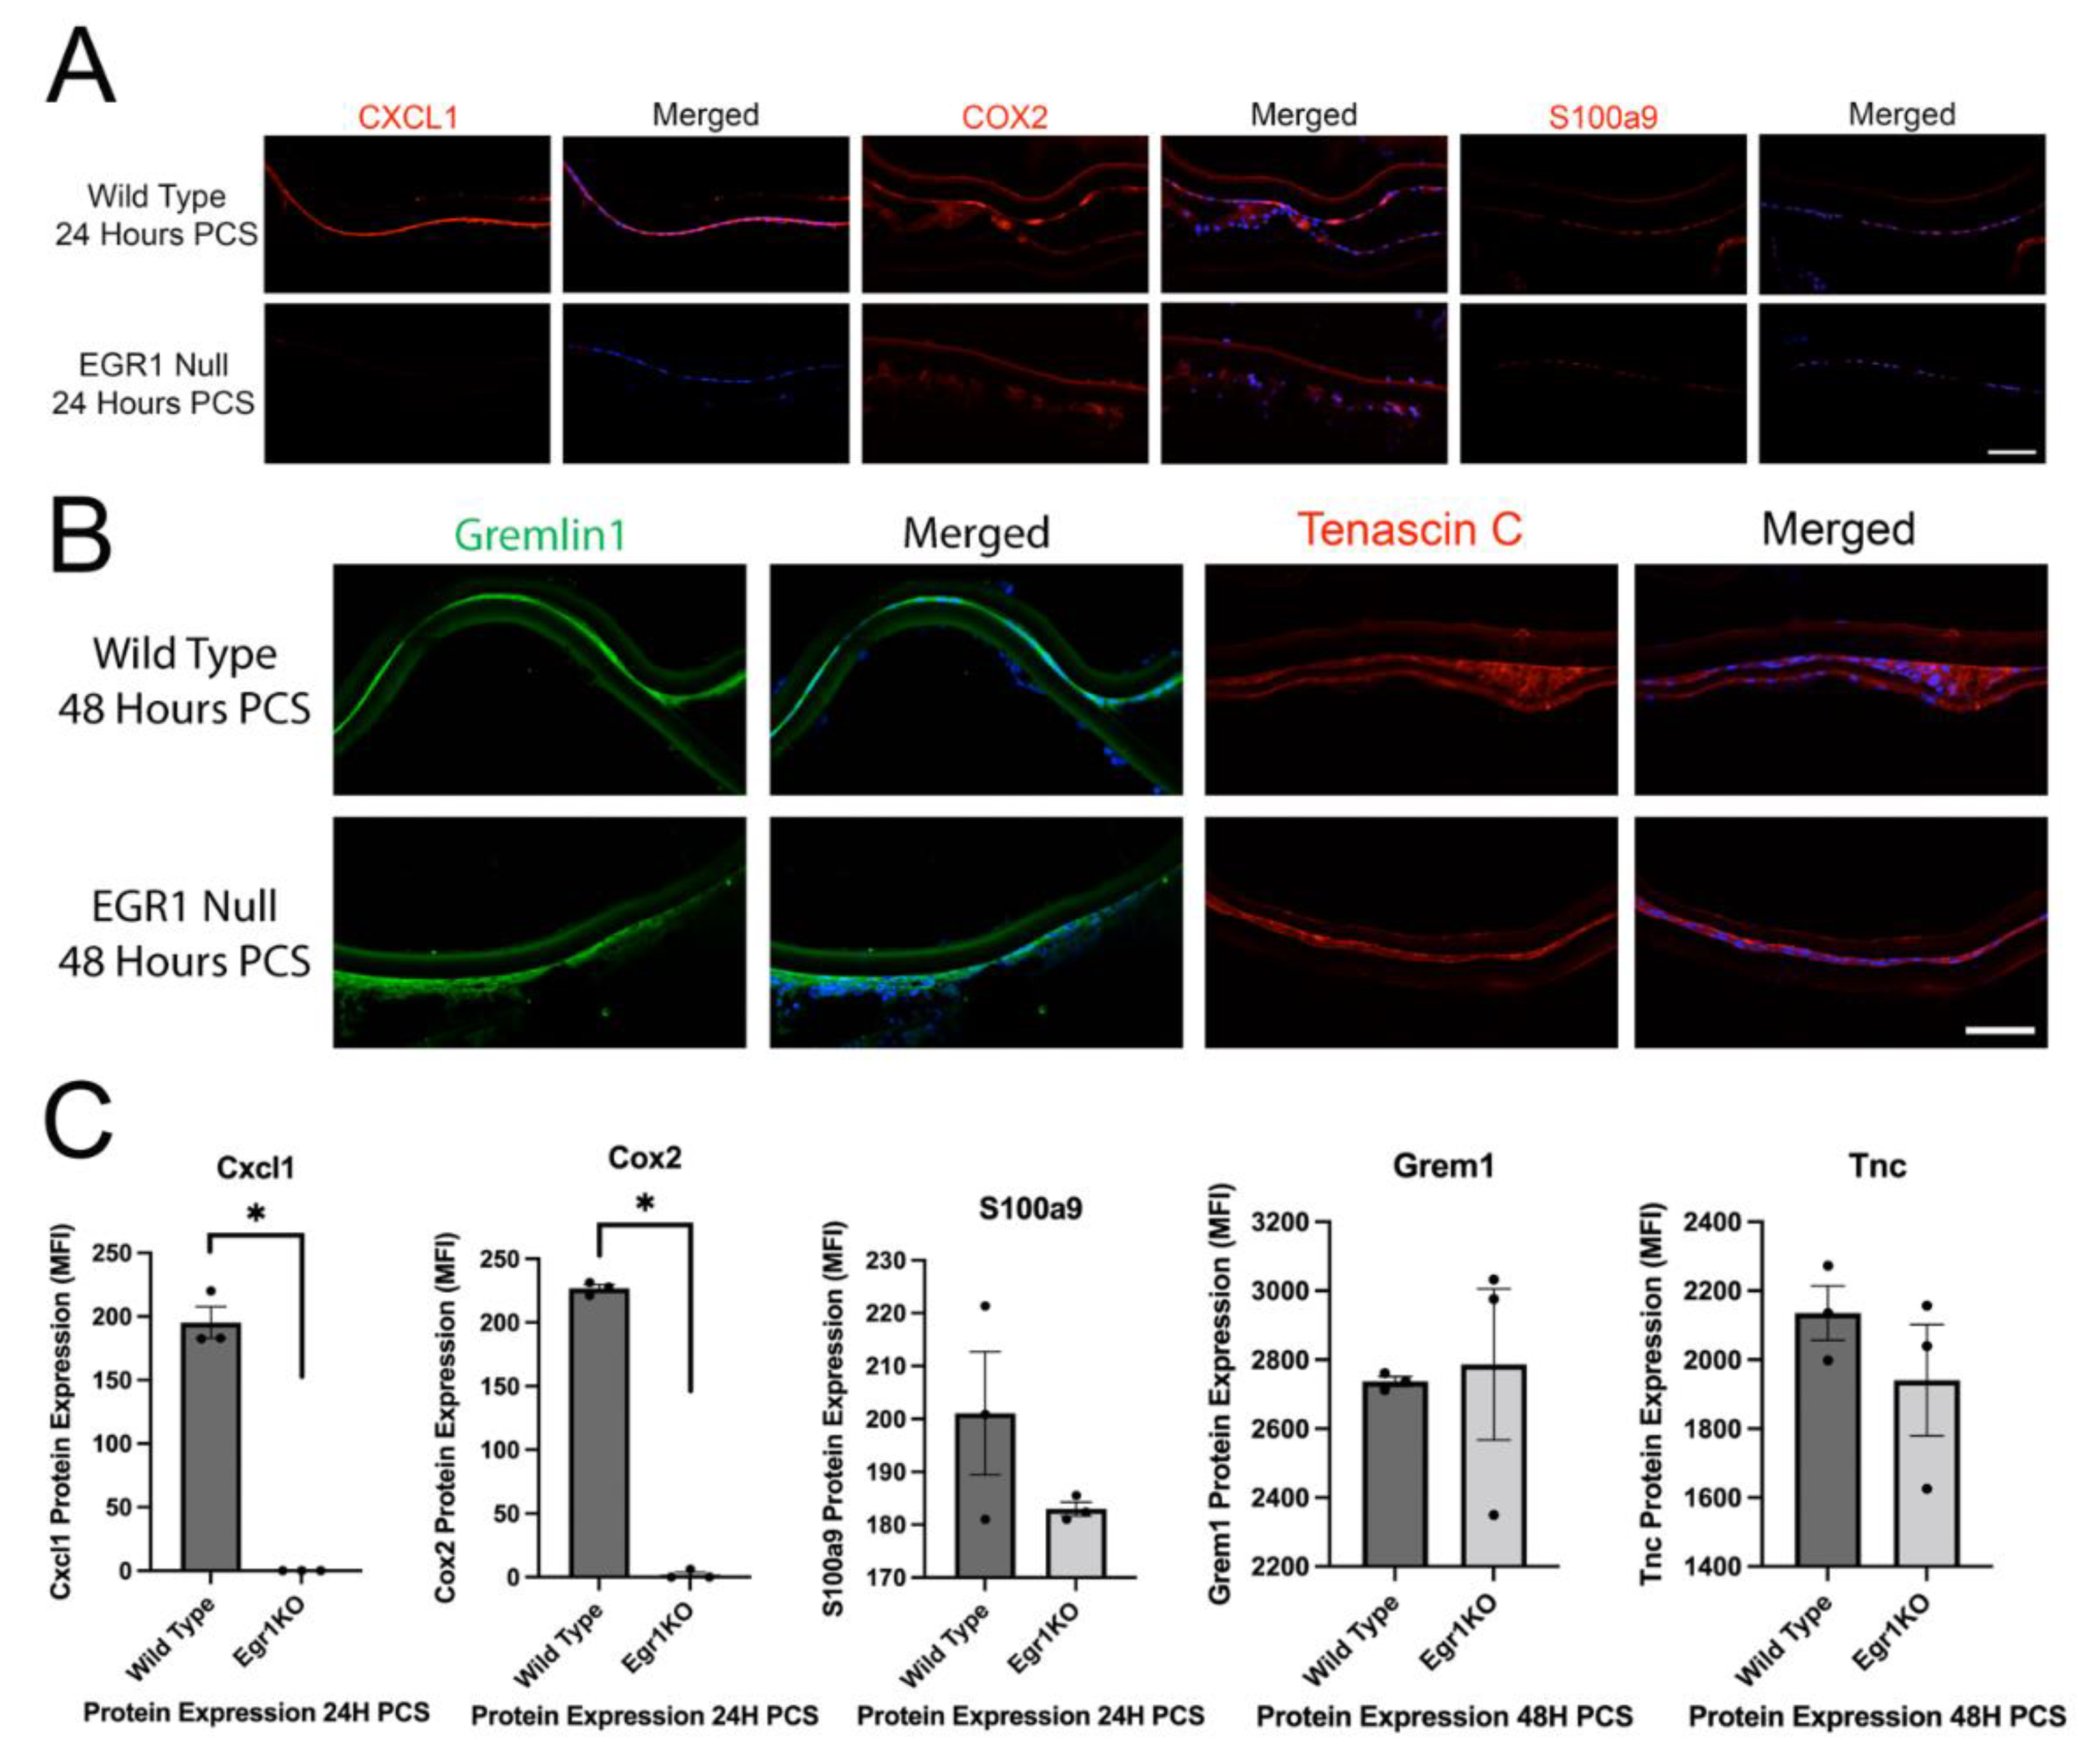
3.5. Egr1 May Mediate a Portion of the Injury Response of LECs PCS

To investigate the role of Egr1 on the inflammatory and fibrotic response of LECs PCS, we first conducted a candidate gene approach. As previously described [18], we found that Cxcl1, Cox2 and S100a9 protein expression are all upregulated in wild type LECs at 24 h PCS while the upregulation of Cxcl1 and Cox2 was attenuated in Egr1KO mice. However, it appears that the inflammatory response is not globally attenuated as S100a9 expression upregulated normally in Egr1KO LECs at 24 h PCS (Figure 6A,C). Further protein levels for the fibrotic markers Gremlin1 and Tenascin C upregulate in wildtype LECs by 48 h PCS as previously reported [11,62] and this upregulation was not affected in Egr1KO LECs (Figure 6B,C) even though Egr1 has been reported to regulate the fibrotic response in other systems [63].

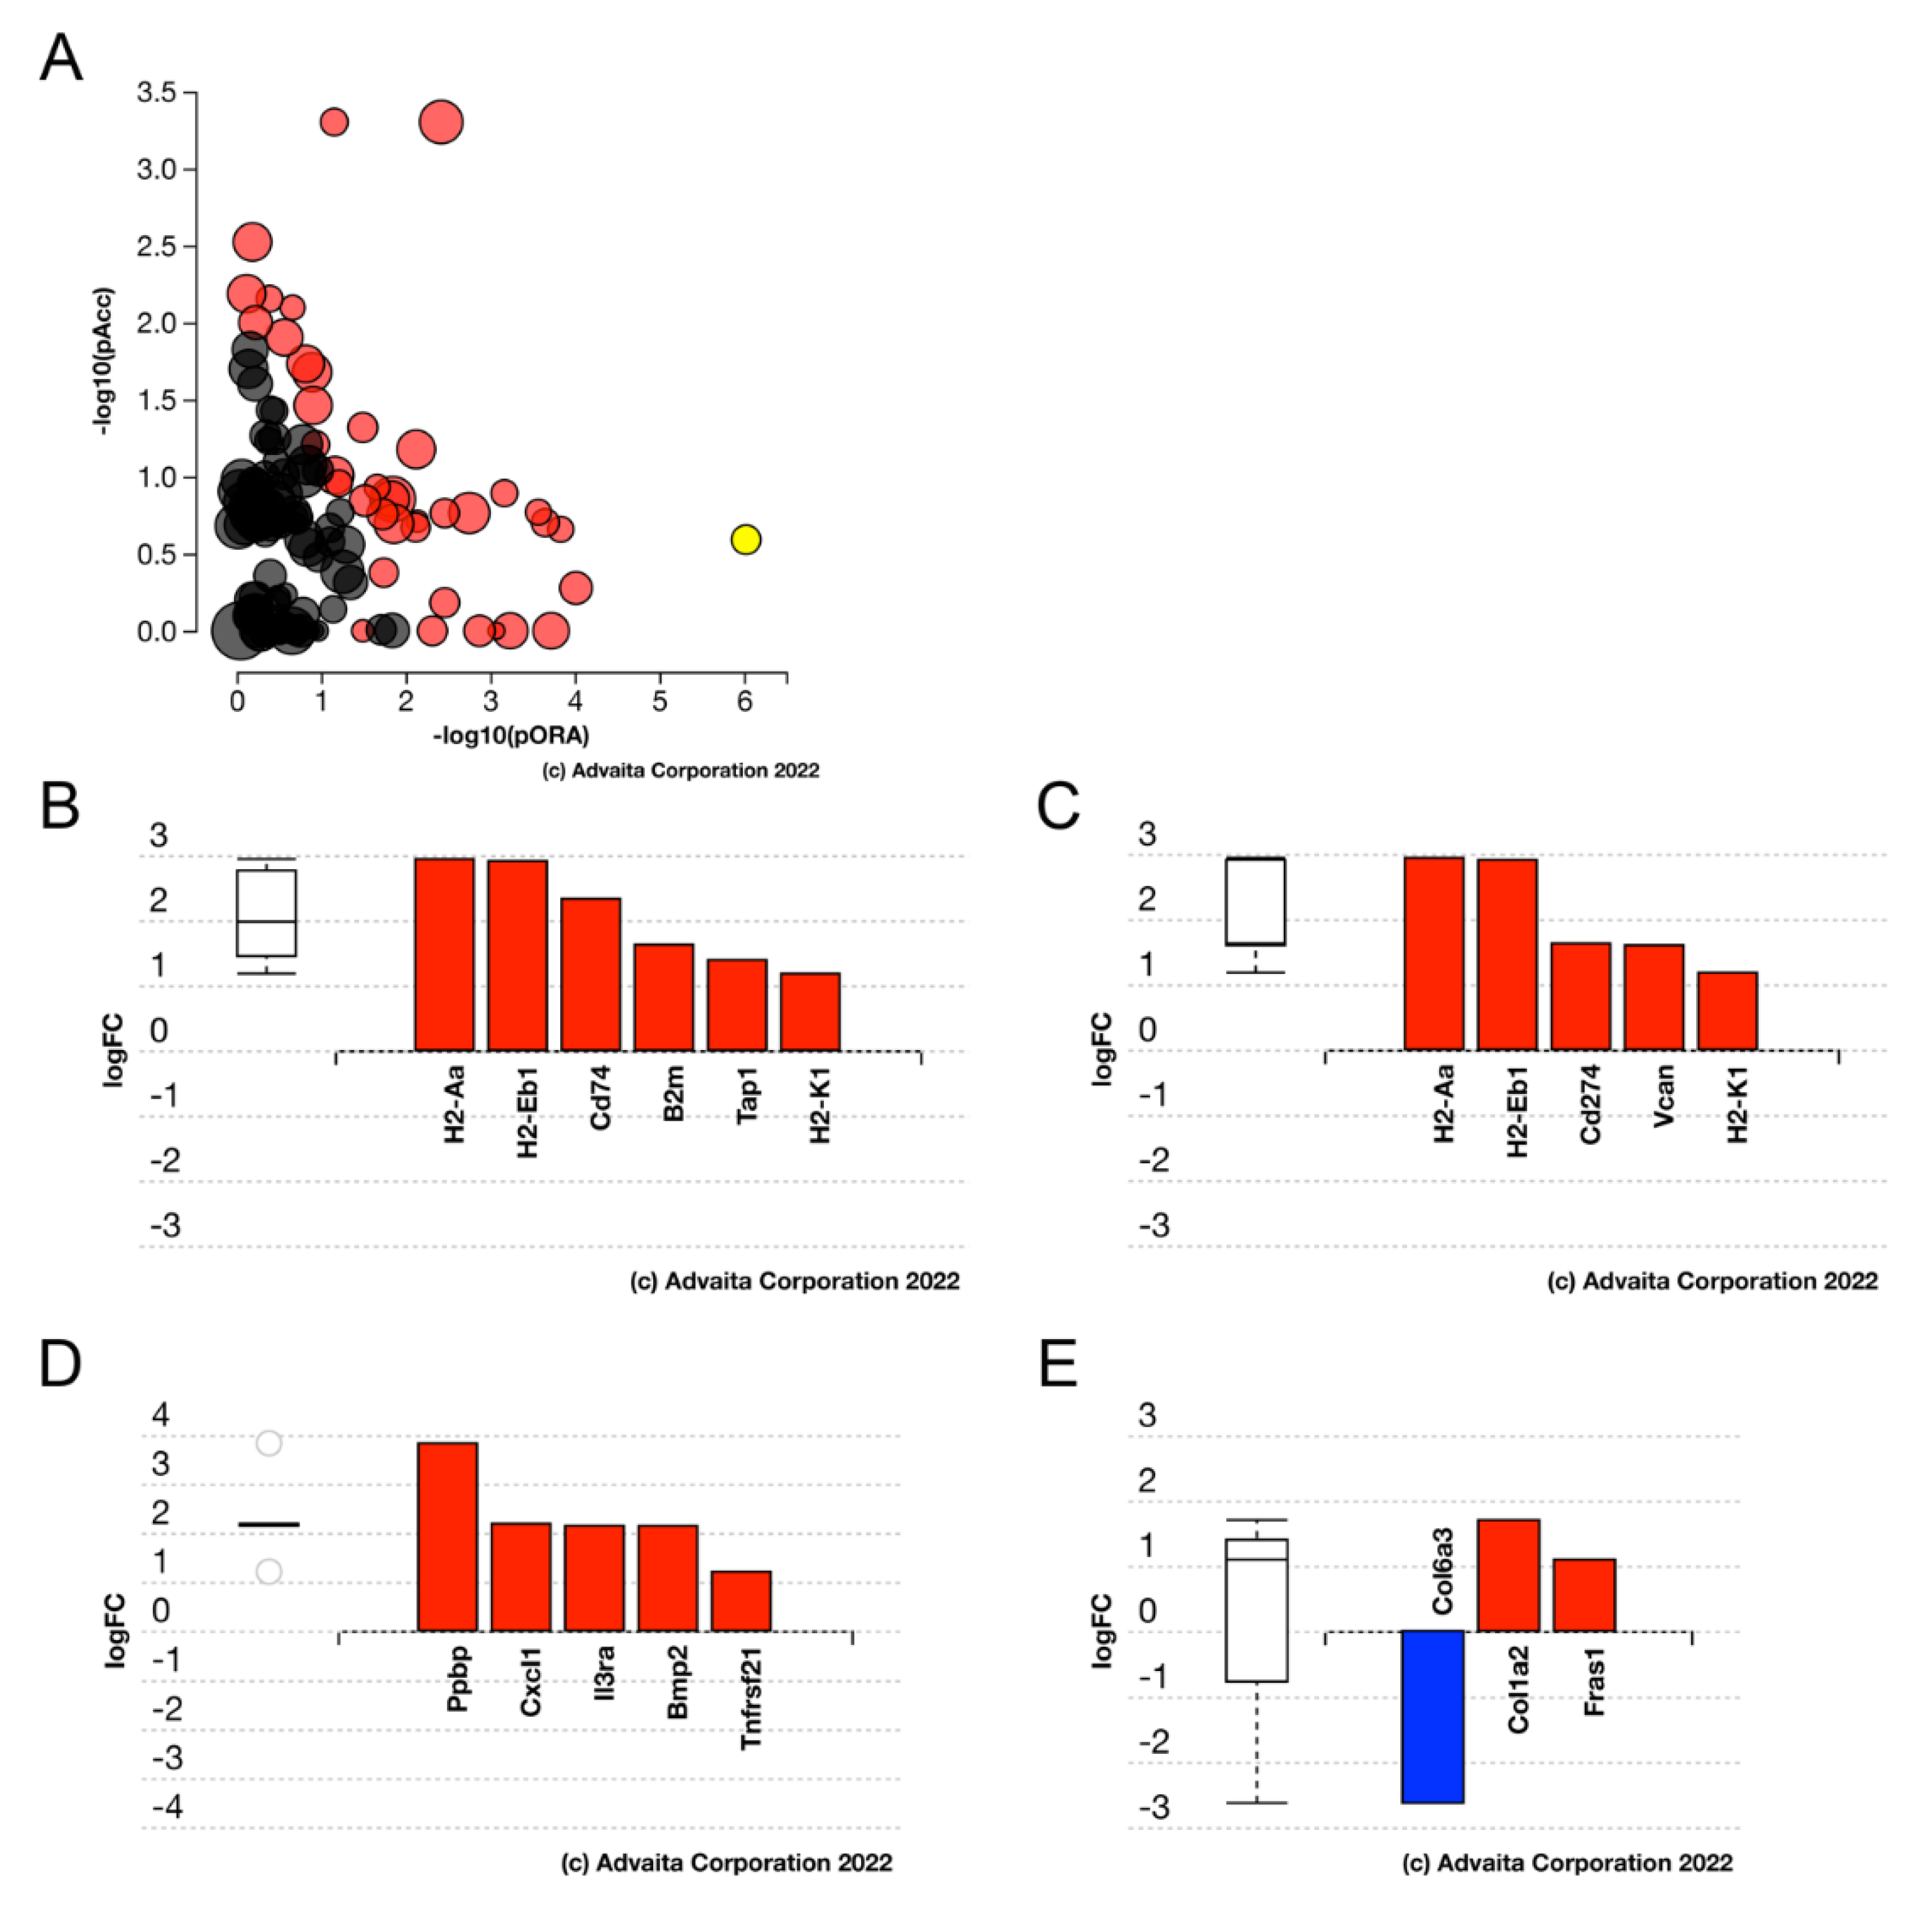
3.6. Deletion of the IETF Egr1 Only Slightly Affects the Transcriptome of Uninjured LECs but Altered a Portion of the Acute LEC Injury Response

As the function of Egr1 in the adult lens was still obscure following phenotypic and candidate gene investigations, RNAseq was then performed on wildtype and Egr1KO LECs isolated either immediately after lens fiber cell removal surgery or 6 h PCS, a time when Egr1 levels are robustly elevated at both the mRNA and protein levels (Figure 3 and Figure 4).
Comparison of wild type and Egr1KO LECs isolated immediately after lens fiber cell removal revealed that only 59 genes were differentially expressed by at least two-fold (FDR corrected p value ≤ 0.05), with 13 of these genes being upregulated and 46 being downregulated in Egr1KO LECs. Advaita iPathway guide analysis of the DEGs did not reveal any significantly impacted pathways common between the genes, although, 28 of the DEGs did map to the gene ontology term “cellular response to stimulus” (FDR corrected p = 0.04). These include the reduced expression of several genes encoding known regulators or targets of the MAPK pathway including Dusp5, Dusp10, Socs3, Arc, Ier5, Mt2 in naïve Egr1KO LECs (Supplementary Table S4; data deposited in the gene expression omnibus under #GSE206574).
Comparison between the transcriptomes of Egr1KO and wildtype LECs at 6 h PCS revealed 115 genes to be significantly differentially expressed by at least two fold (FDR corrected p value ≤ 0.05), with 72 of these genes being upregulated and 43 being downregulated DEGs. Filtering these DEGs for expression changes likely to be biologically significant [44], revealed 73 DEGs with 52 DEGs being upregulated and 21 DEGs downregulated in Egr1KO LECs at 6 h PCS compared to wild type (Supplementary Table S5/GEO#GSE206574). The most upregulated and downregulated genes in Egr1KO LECs at 6 h PCS can be found in Table 4 and Table 5, respectively.

3.7. Egr1KO LECs Upregulate Zonule Associated Genes upon Lens Injury

Inspection of the DEGs in Egr1KO LECs at 6 h PCS revealed that the mRNA levels of fibrillin 1 and fibrillin 2, two components of the ciliary zonule that maintains the position of the lens within the eye [64,65], were upregulated compared to wild type LECs at 6 h PCS. In order to evaluate Egr1’s involvement in zonular homeostasis, we compared the set of genes differentially expressed between wildtype and Egr1KO LECs to a set of 91 human proteins that proteomic analysis indicates to be the primary constituents of zonular fibers [65]. We observed 5 mouse homologs of human zonular genes with biologically significant and elevated differential expression at six hours PCS in Egr1KO LECs compared to WT (Table 6). This suggests that acute elevation of Egr1 levels apparently represses injury-associated elevation of zonule gene expression in LECs.
Advaita iPathway analysis of the DEGs in Egr1KO LECs at 6H revealed that the “antigen processing and presentation” pathway (p-value = 4.147 × 10⁻⁶) was the pathway most impacted by Egr1 gene deletion. In addition, genes mapping to the “cytokine-cytokine receptor interaction” (p-value = 0.003), “cell adhesion molecule” (p-value = 0.003) and ECM receptor interaction (p-value = 0.045) gene ontology terms were enriched in the Egr1KO 6H DEGs (Figure 7).

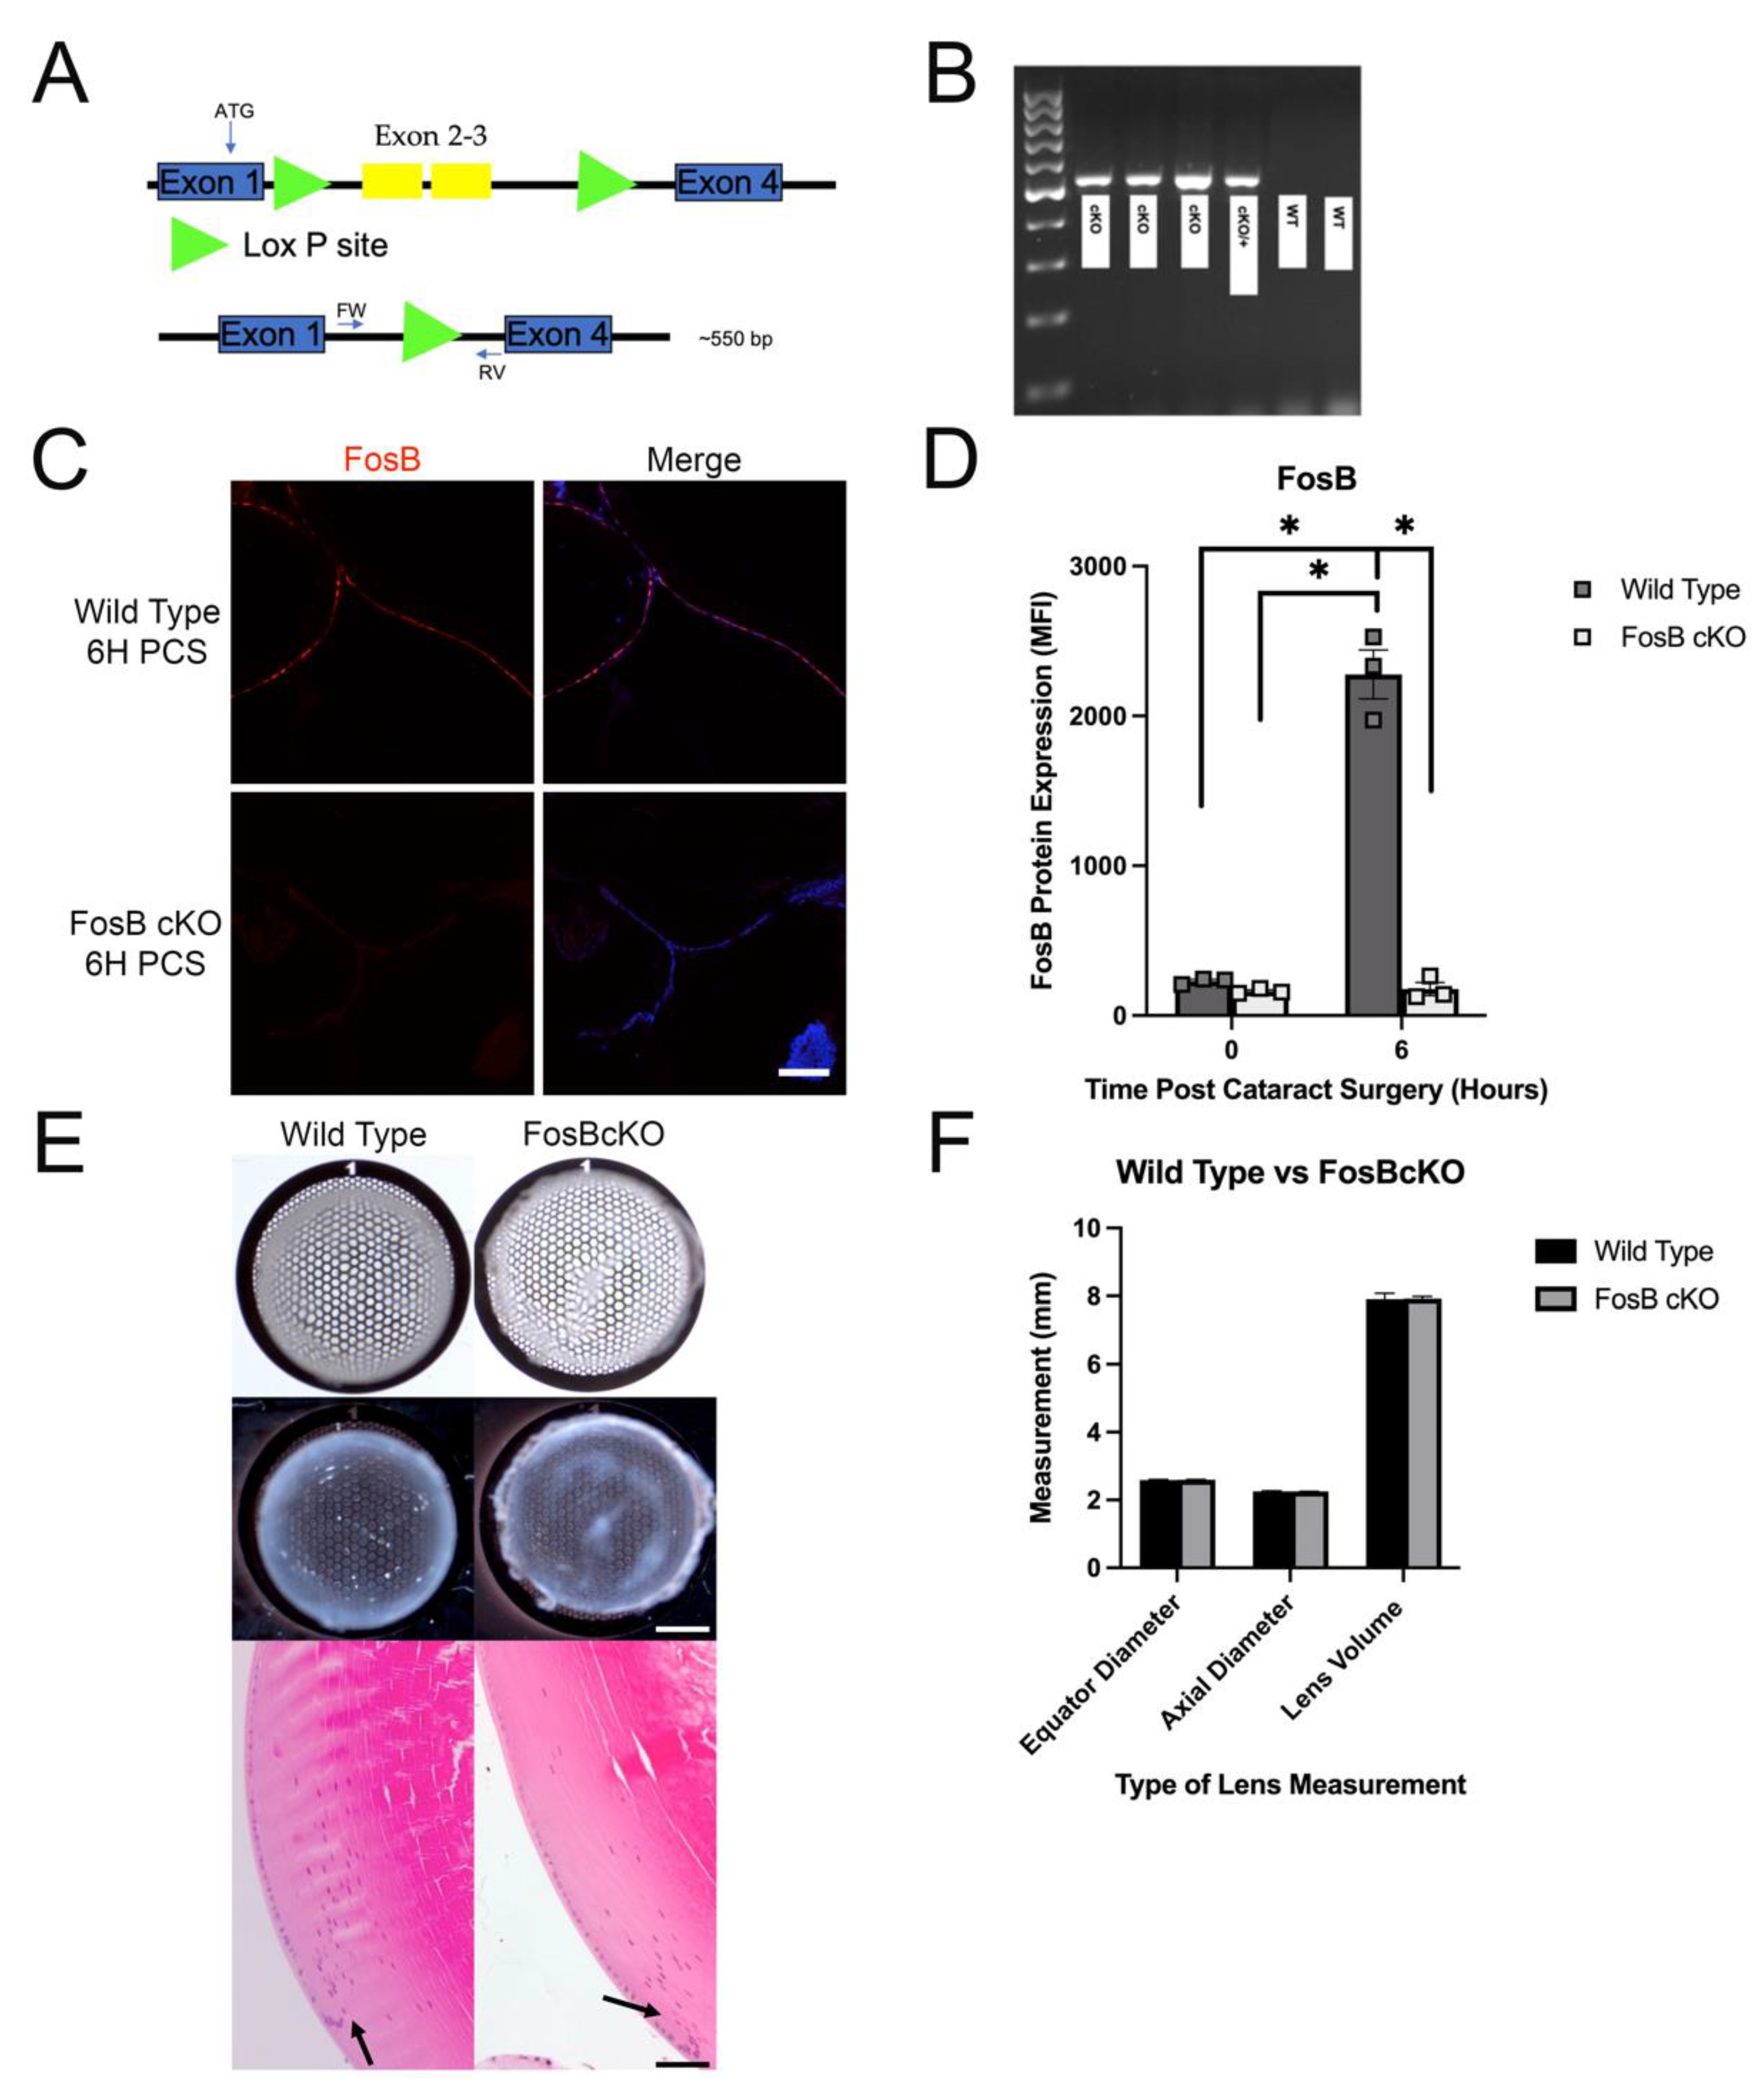
3.8. Generation, Validation and Morphological Analysis of FosB Conditional Knock Out Mice

After the investigation of the Egr1KO LEC injury phenotype, the role of IETFs in regulating the response of LECs to lens fiber cell removal was still obscure. Thus, we investigated the role of FosB in the acute response of LECs to lens injury as it was one of the most upregulated genes (Table 1) and most upregulated IETFs (Table 3) at 6 h PCS. As FosB null mice exhibit nurturing defects [66], we generated mice lacking a functional FosB gene just in the lens (FosBcKO) by breeding a mouse carrying a floxed FosB allele [30] to a mouse containing the MLR10 lens specific cre recombinase transgene [31] (Figure 8A). The complete deletion of the floxed region of the FosB gene was validated by PCR analysis of DNA from mouse lens (Figure 8B) and further confirmation was validated at the protein level via immunofluorescence (Figure 8C,D). FosBcKO lens were the same size as the WT lens (Figure 8F), but similar to the Egr1KO lens, exhibit focal opacities visible by both brightfield and darkfield imaging (Figure 8E). Hematoxylin and eosin (H&E) staining demonstrated that FosBcKO lenses and WT lenses are histologically similar but FosBcKO appear to have a slight disorganization of the transition zone (Figure 8E).

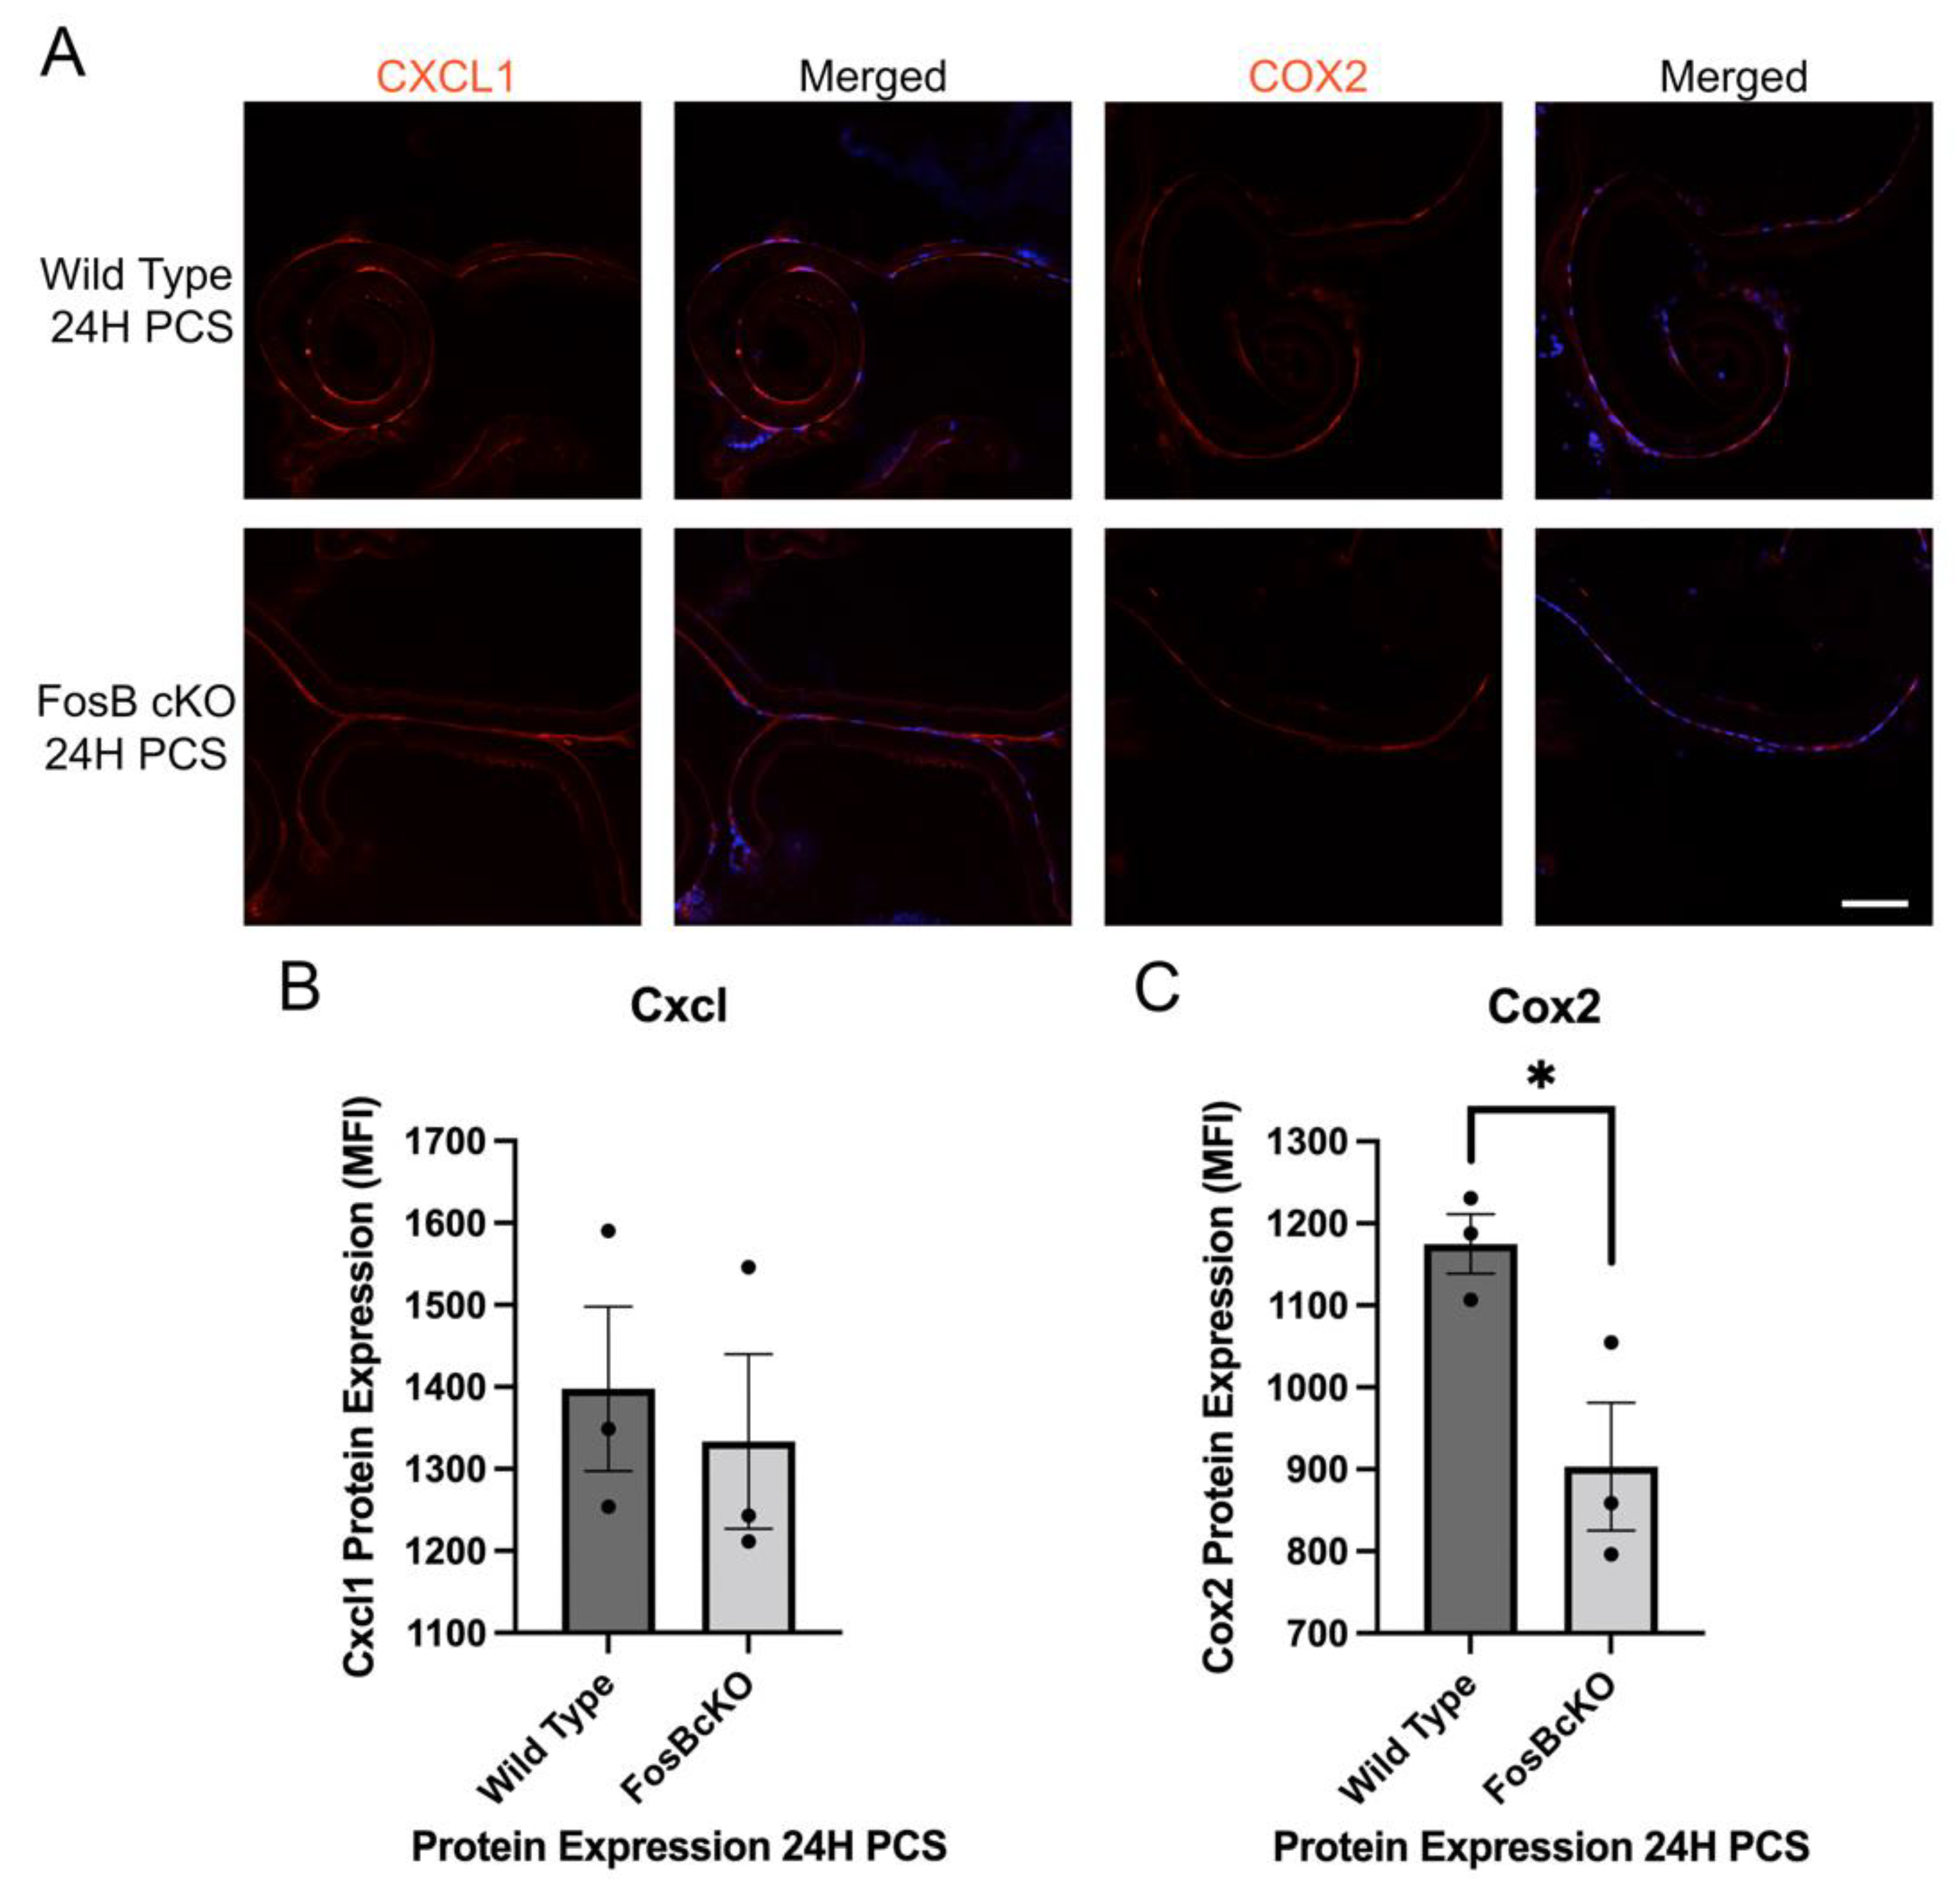
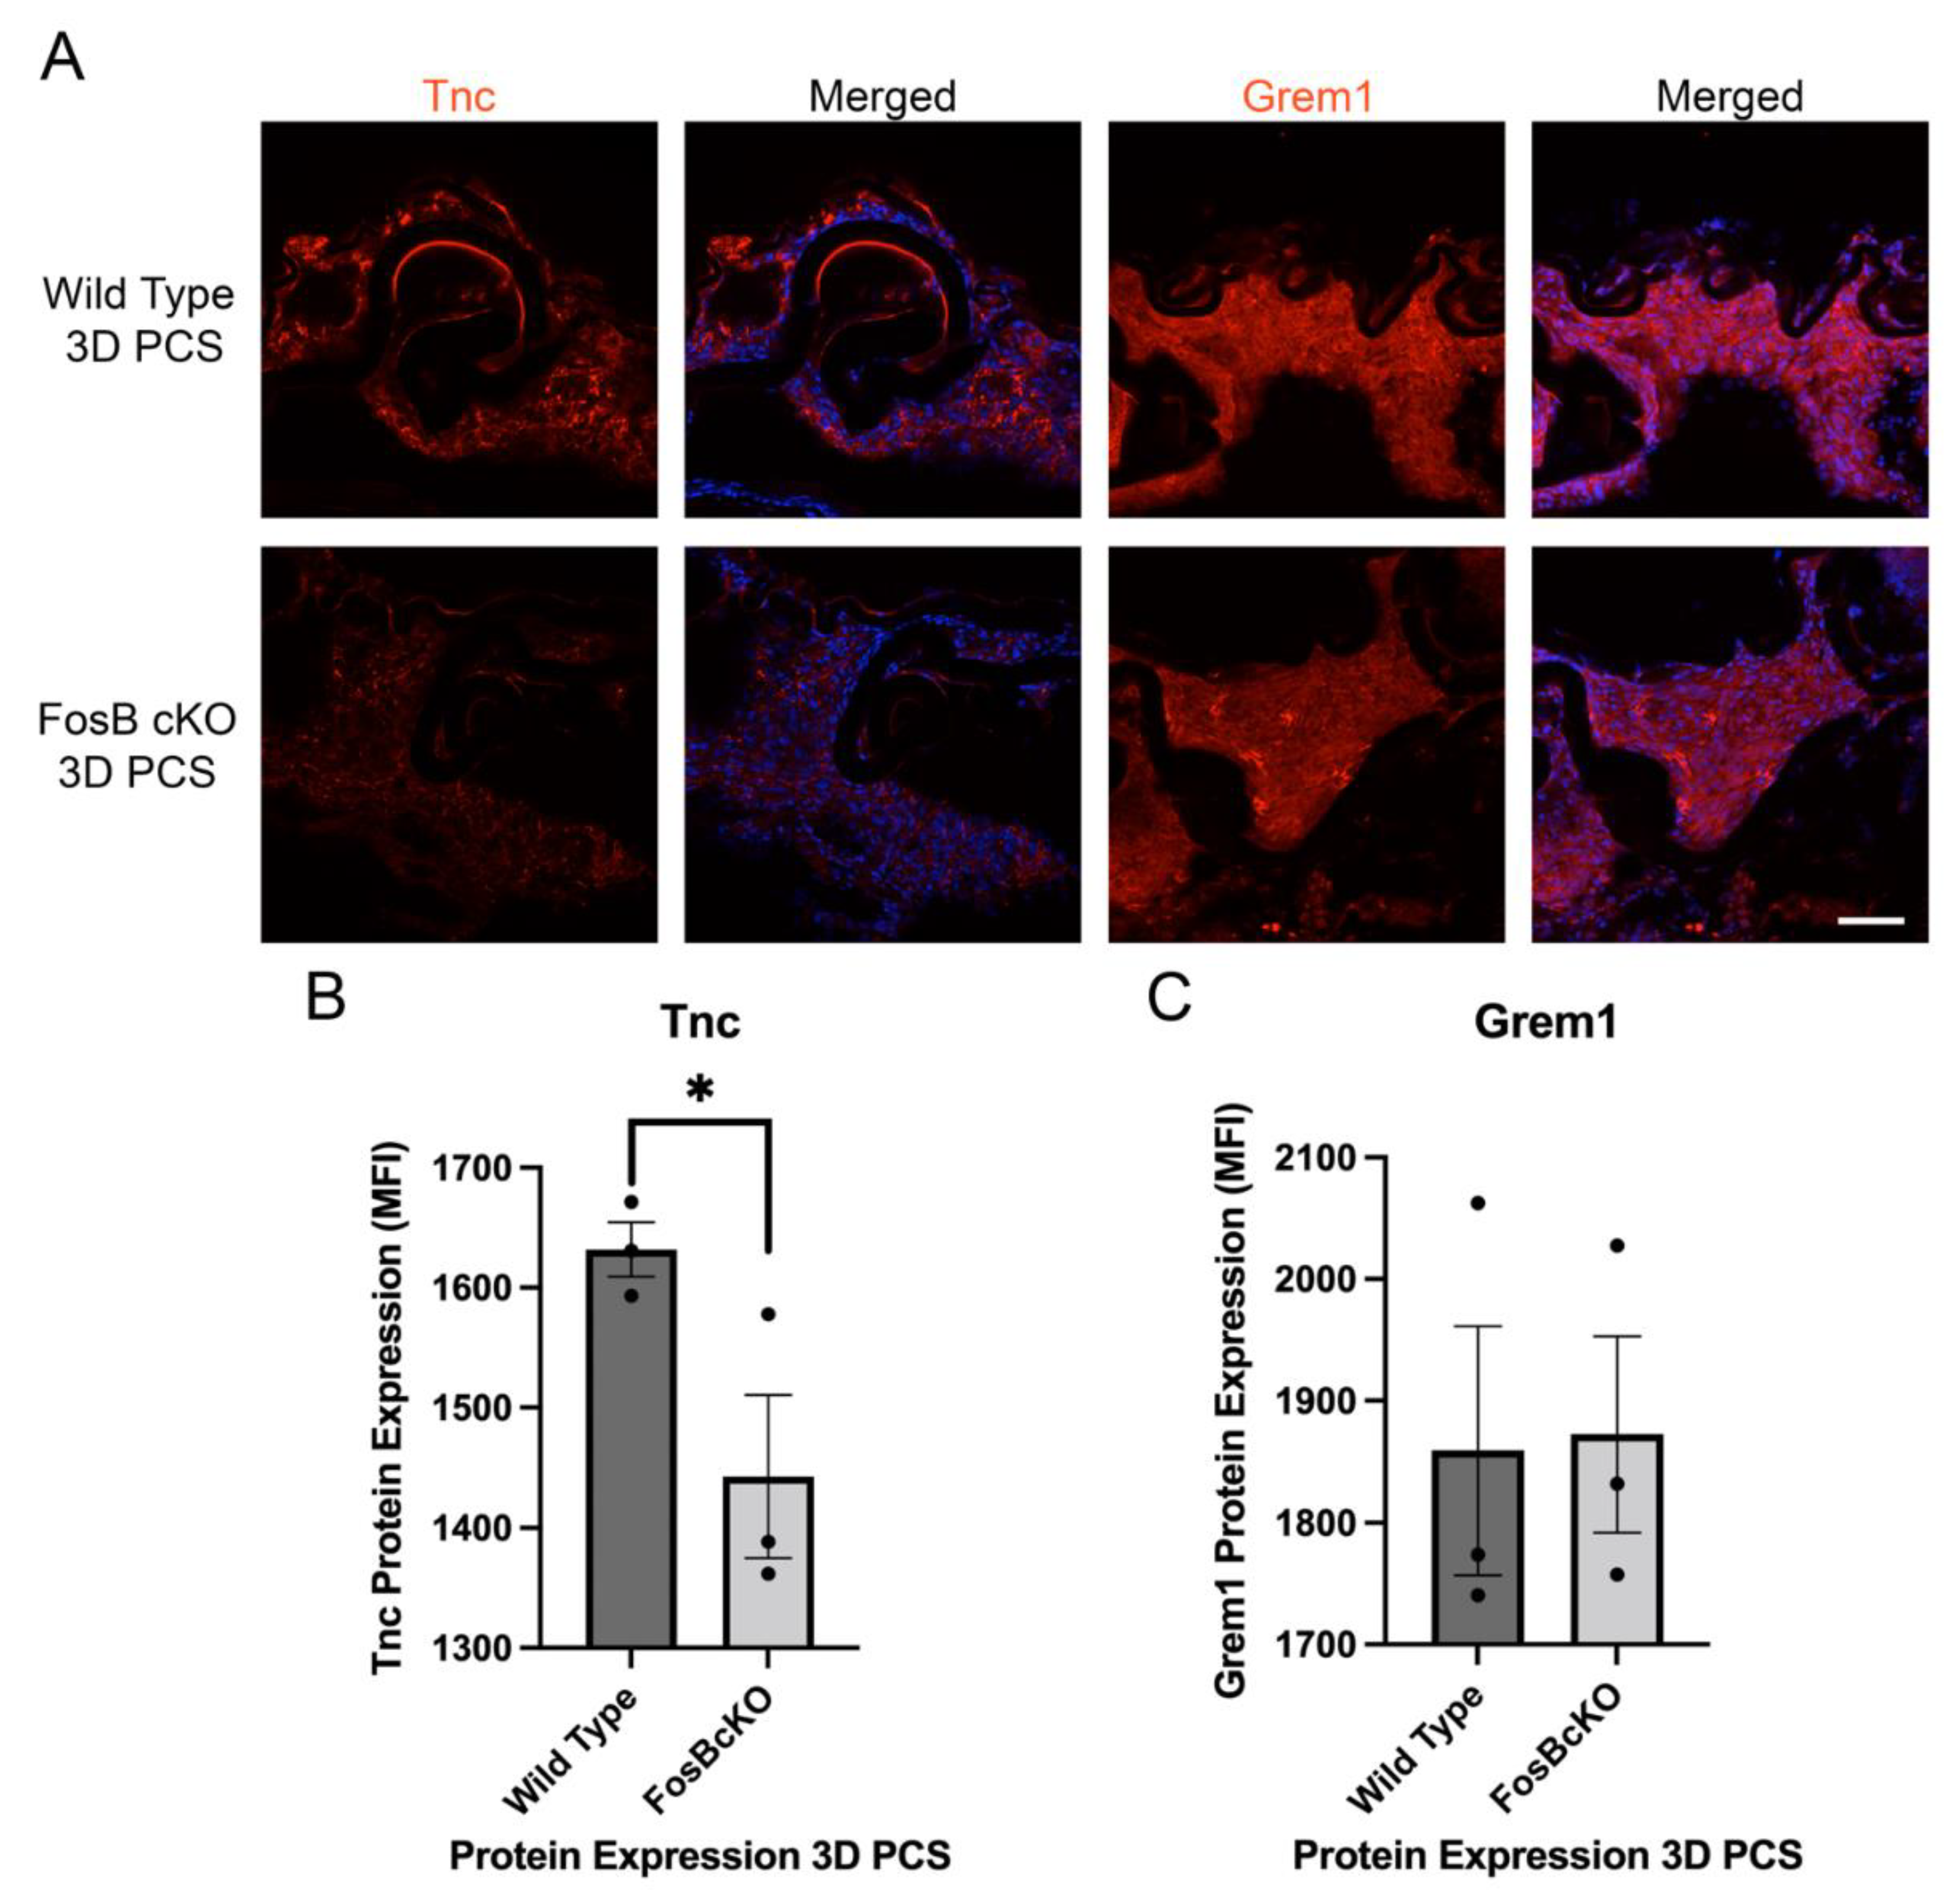
3.9. Acute FosB Elevation PCS May Regulate a Portion of Both the Inflammatory and Fibrotic Responses Post Cataract Surgery

To investigate the role of FosB on the inflammatory response PCS, we first conducted a candidate gene approach based upon the top upregulated and expressed inflammatory cytokines found in [18]. This analysis revealed that Cox2 expression was significantly downregulated in FosBcKO mice at 24 h PCS although Cxcl1 levels were not significantly affected (Figure 9). At 72 h PCS, a time point where fibrotic markers upregulate robustly in injured LECs, FosBcKO LECs exhibit much less Tenascin C upregulation than normal although levels of the fibrotic marker of Gremlin1 was similar between FosBcKO and wild type LECs (Figure 10).

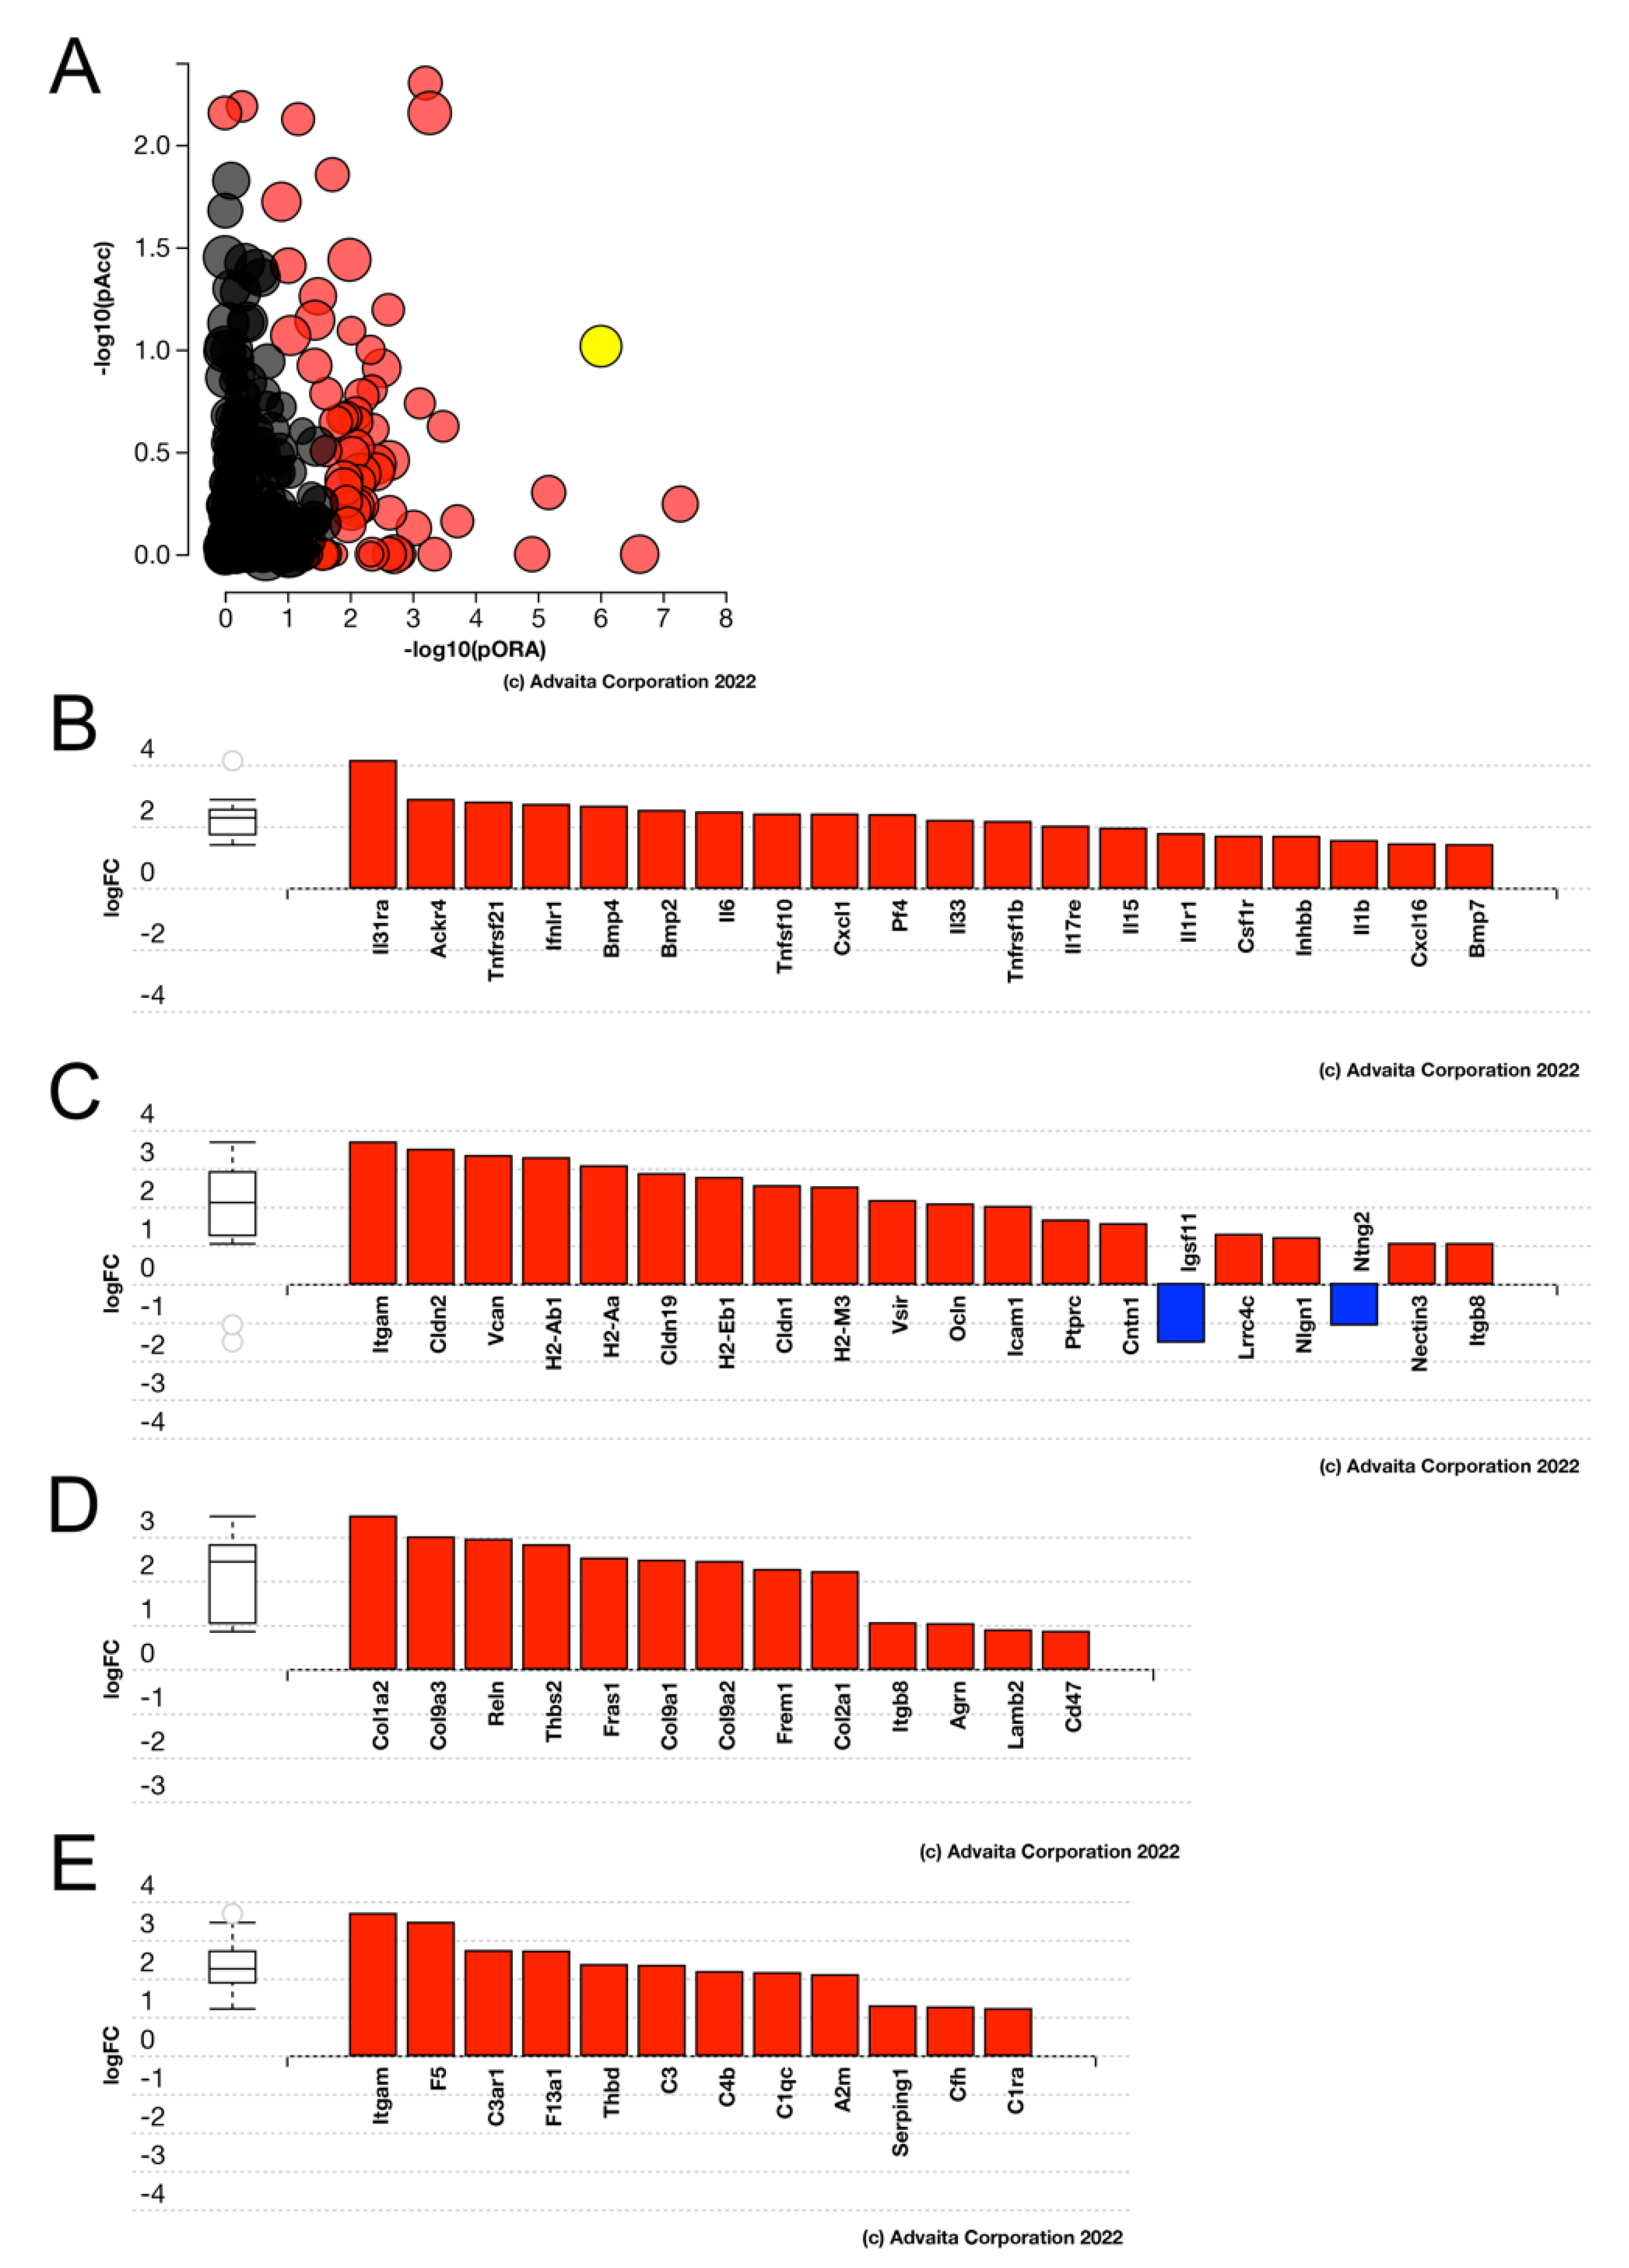
3.10. Acute FosB Upregulation PCS Regulates Many Genes in Injured LECs

To further investigate the role of FosB in naïve LECs and the LEC injury response, RNAseq was conducted on LECs isolated from wild type and FosBcKO mice at 0 h and 6 h PCS. Notably, uninjured FosBcKO LECs only expressed 43 genes at levels statistically different from wild type, only 25 of which met the biological significant criteria of [44]) showing that the naïve lens transcriptome is only minimally impacted by the absence of FosB (Supplementary Table S6/GEO#GSE206574). However, comparison between FosBcKO and wildtype LECs at 6 h PCS revealed 874 genes to be differentially expressed, 589 meeting the biological significance criteria of [44], 485 DEGs being upregulated and 104 downregulated in FosBcKO LECs (Supplementary Table S7/GEO#GSE206574). The top most upregulated and downregulated genes in this comparison are presented in Table 7 and Table 8.
Several DEGs at 6 h PCS with higher expression in FosBcKO LECs compared to wildtype appeared to be associated with zonule formation. As a result, a list of zonules genes from a previous study [65] were used as a filter and revealed that FosBcKO LECs upregulate the expression of zonule genes upon lens injury and at 6 h PCS, this resulted in their elevated expression compared to wildtype (Table 9).
Advaita iPathway analysis revealed that the lack of FosB in LECs compared to WT LECs causes the “cytokine-cytokine receptor interaction” pathway (p-value = 1.655 × 10⁻⁶) to be the most upregulated signaling pathway (Figure 11). In addition, there is an upregulation of cell adhesion molecules (p-value = 7.754 × 10⁻⁶), ECM-receptor interaction (p-value = 4.252 × 10⁻⁵), and complement and coagulation cascades (p-value = 4.528 × 10⁻⁵) when there is the absence of FosB in the LECs PCS compared to WT LECs PCS.

4. Discussion

Extracapsular cataract extraction followed by intraocular lens implantation [3] is a marvel of modern medicine that has greatly reduced the worldwide burden of cataract-associated visual disability. While great methodological advances have improved the outcomes of this procedure over the past 50 years, post-surgical ocular inflammation [6] can still be problematic in the short term. Longer term, patients still have a significant risk of developing posterior capsular opacification (PCO) during the first decade following surgery [24]. Inflammation following cataract surgery is usually attributed to surgically induced breaks in the blood-aqueous barrier [25,26], and PCO is attributed to elevated TGFβ signaling [12,67] in lens epithelium cells retained on the lens capsular bag following surgery. However, the mechanisms by which cataract surgery induces these negative sequelae are still obscure.
Our prior work found that inflammation markers upregulate in LECs following lens fiber cell removal as early as 6 h post cataract surgery (PCS) with maximal upregulation by 24 h PCS [18] while it takes 48–72 h after surgery for TGFβ signaling leading to lens epithelial cell (LEC) fibrotic responses to elevate [18,36,62]. Here, we used RNAseq to globally evaluate the changes in LEC biology at 6 h PCS and identified a group of transcription factors that might be regulating the LEC injury response which contributes to ocular inflammation and PCO.

4.1. LECs Rapidly Induce the Expression of Pro-Inflammatory Cytokines after Lens Fiber Cell Removal but Fibrotic Responses Are More Delayed

Here, RNAseq confirmed that LECs upregulate the expression of numerous genes encoding pro-inflammatory cytokines by 6 h PCS, including Il19 [68], Csf3 [69], Il6 [70], and Ptgs2 [71], consistent with our prior study showing that select proinflammatory cytokines upregulate at the protein level by 6 h PCS [18]. As signaling from such cytokines can both loosen endothelial tight junctions and chemoattract neutrophils and macrophages to sites of tissue injury [72,73,74,75], this suggests that the LECs left on the lens capsular bag following cataract surgery may contribute to the loosening of the blood-aqueous barrier that leads to ocular inflammation (flare plus cells) [16] that is apparent by 24 h PCS.
Further, while remnant LECs still express most lens epithelial cell markers at pre-injury levels at 6 h PCS and did not upregulate mRNAs encoding classic fibrotic markers by this time, they already appear to have elevated the expression of numerous genes needed to set the stage for PCO pathogenesis. Particularly, the upregulated DEGs in LECs at 6 h PCS are enriched in those known to participate in epithelial-mesenchymal transition (EMT) and cell migration pathways which are important for PCO pathogenesis [76]. Notably, these genes are induced in LECs 1–2 days prior to upregulation of the αVβ8-integrin [11] expression needed to activate latent TGFβ and subsequent Smad2/3 phosphorylation which drives the long-term fibrotic response of LECs PCS. These data suggest that LECs are rapidly reprogrammed in response to lens injury/cataract surgery and this sets the stage for later TGFβ pathway mediated loss of lens epithelial marker gene expression and induction of the myofibroblast phenotype.

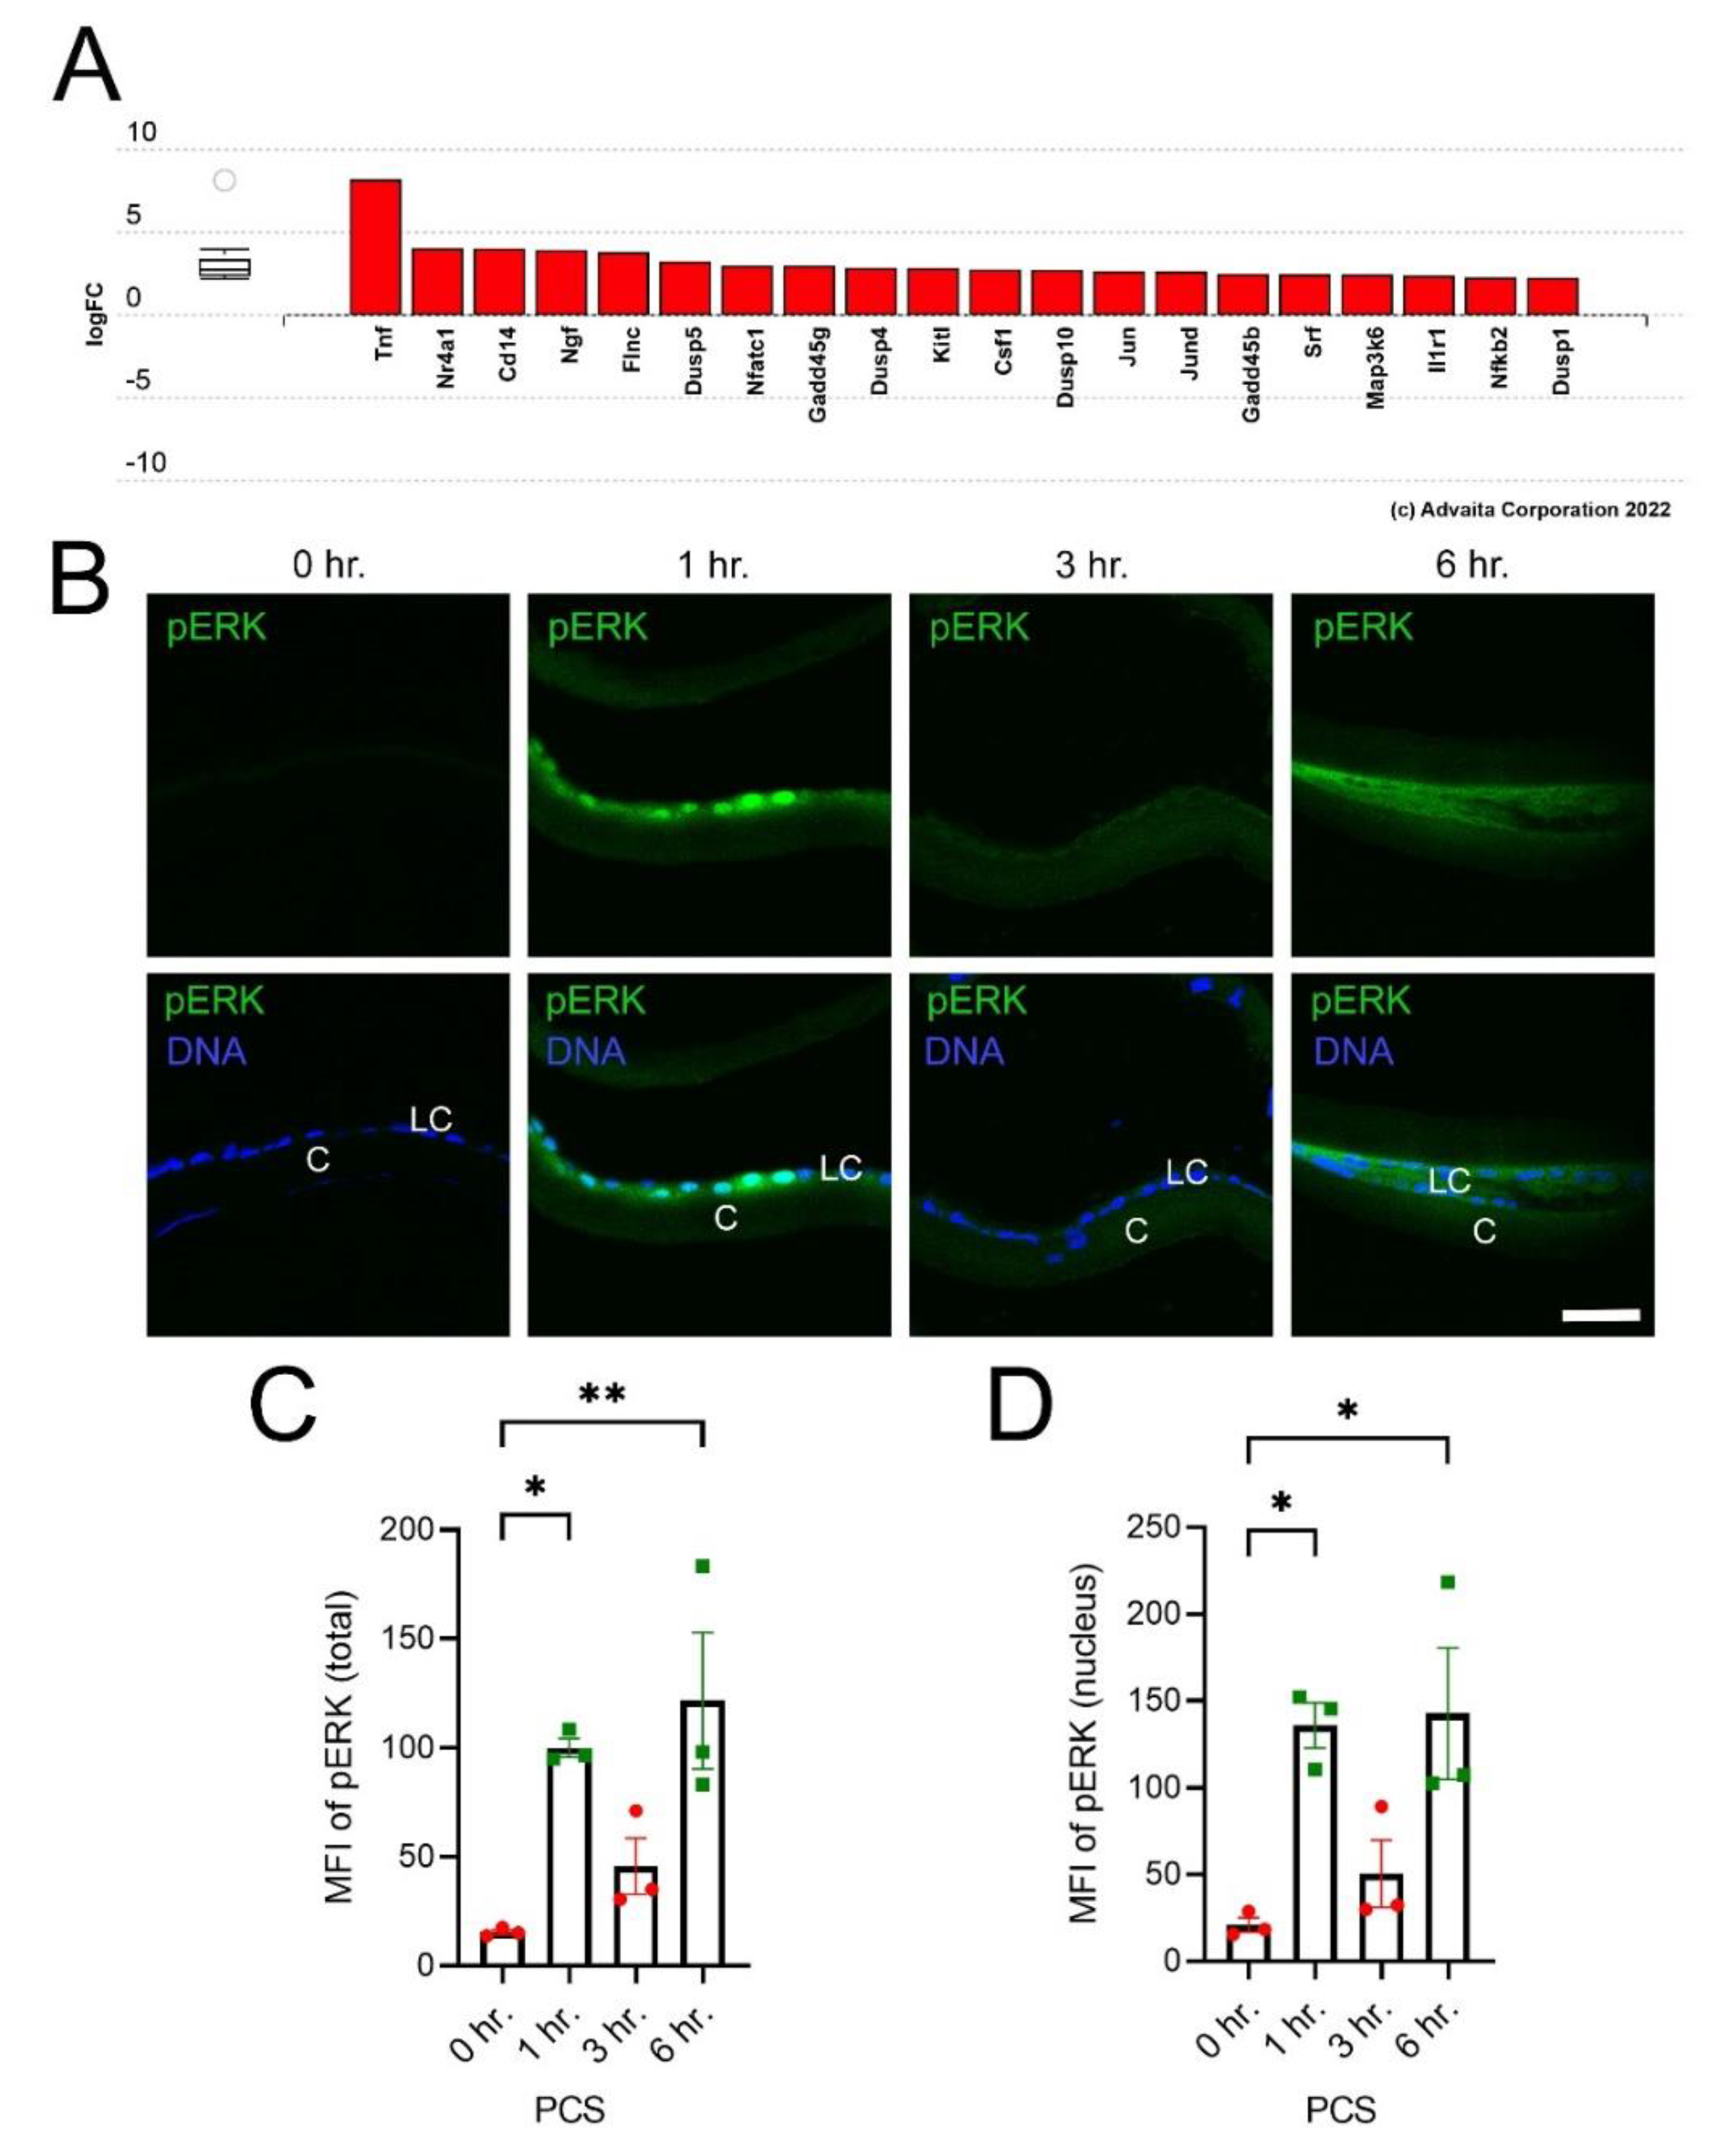
4.2. Mitogen Activated Protein Kinase Signaling and Immediate Early Transcription Factor Expression Are Rapidly Induced in LECs |Following| Lens Fiber Cell Removal

Bioinformatic analysis of the DEGs detected in LECs at 6 h PCS found that many genes map to the gene ontology term, mitogen activated protein kinase (MAPK) signaling. Further, direct inspection of the DEGs found that the expression of numerous immediate early transcription factors (IETFs), which are known to be the first genes whose expression is elevated by MAPK signaling in other systems [77,78], were elevated by 6 h PCS. We subsequently experimentally confirmed that these observations which suggests that the lens wound healing response is triggered by an event occurring during cataract surgery that leads to acute MAPK pathway activation and subsequent IETF expression. As isolated LEC/lens capsule complexes subjected to 6 h of ex vivo serum-free culture also induce the expression of IETFs, this response appears to be autonomous to LECs themselves.
While future work is needed to identify the trigger of MAPK signaling, there are several possibilities. Danger-associated molecular patterns (DAMPs) are intracellular proteins which are released upon cellular injury. They can bind to DAMP receptors (Toll-like receptors are the best characterized members of this class) which activates several downstream signaling pathways including MAPK [79]. While cataract surgery would be expected to release known DAMPs such as αA- and αB- crystallins [80] into the ocular environment, inspection of the LEC transcriptome for DAMP receptors suggested that this pathway may not be the acute trigger of the LEC injury response as their expression levels are low in naïve LECs. However, DAMP receptors may play a role in later LEC responses post-surgery as their expression elevates at later times PCS. Alternatively, the biomechanical stress placed on the remnant LECs during fiber cell removal could be the trigger. Biomechanical stress on the lens has been reported to acutely induce the expression of IETFs in LECs [81,82] and when the biomechanical stress is high or prolonged, anterior subcapsular cataract develops [83,84], which like PCO, often involves the EMT of LECs [85]. Notably, naïve LECs do express some known biomechanical sensors including β1-integrin [61] and Piezo1 [86] which, when activated, upregulate the ERK/MAPK signaling cascade and subsequent IETF expression in other systems [87,88].

4.3. The IETFs Egr1 and FosB Regulate Some Aspects of the Lens Wound Healing Response

IETFs are known to regulate wound healing responses in non-lens cell types [89,90,91,92], however their functions in the lens are obscure. Here, we found that numerous IETFs upregulate rapidly in injured LECs then downregulate their expression later, although the kinetics of this downregulation varies between IETFs. Here, we tested the function of two of the most upregulated IETFs in LECs, Egr1 and FosB in the lens wound healing response as both genes can be under the control of ERK/MAPK signaling [77,78] and are known to regulate both inflammation [93,94] and fibrosis [63,89] in other tissues.
The absence of Egr1 does not induce major changes to normal lens biology either at the level of structure/transparency nor the global LEC transcriptome. This is consistent with prior reports identifying a role for Egr1 in scleral growth during compensatory myopia in mice although no effects on lens transparency are noted. Prior work has found that Egr1 upregulates in LEC in response to cellular stresses ranging from a loss of calcium homoeostasis due to selenite stress [59] and the loss of β1-integrin [61] while this study found Egr1 expression to rapidly elevate after lens fiber cell removal. However, the function of Egr1 in lens biology is still obscure. While we previously found that deletion of Egr1 from lenses lacking the gene encoding β1-integrin rescued [61] a portion of the LEC phenotype, the genes that Egr1 regulates that lead to lens destruction are still unknown. Here, we found that deletion of Egr1 from lenses subjected to injury only affected the expression of 73 genes, and surprisingly the handful of inflammatory cytokines among this list exhibited elevated expression in Egr1 null LECs at 6 h PCS, including Cxcl1 (4.55 fold), a known Egr1 target gene [94]. However, by 24 h PCS, Egr1 null LECs did exhibit reduced levels of Cxcl1 compared to wild type controls. While the mechanisms that underlay these results are unclear, Egr1 is known to function as both a transcriptional activator and repressor depending on context. LECs do express appreciable levels of the mRNAs encoding the Egr1 co-repressors Nab1 and Nab2 which could explain why Cxcl1 mRNA levels are elevated in Egr1 nulls at 6 h PCS as Cxcl1 is a known Egr1 target gene. It is possible that Egr1 shifts function later in the injury response as Cxcl1 levels are reduced at the protein level in Egr1 null LECs at 24 h PCS which is more consistent with other studies that suggest that Egr1 can activate the inflammatory response in non-lens cells [93,94]. It is also possible that the small effect of Egr1 deletion on the acute injury transcriptome derives from the large number of IETFs (who have similar or identical DNA binding sites) with elevated expression at 6 h PCS creating a “bulk” effect to drive the injury response so that loss of any one component only has a minor effect on the global injury response [95,96,97].
Like Egr1KO lenses, FosBcKO lenses exhibit neither major structural defects nor large changes in the LEC transcriptome. While it has been reported that elevated expression of the delta FosB (ΔFosB) variant in the lens can result in posterior subcapsular cataract [98], the apparently normal phenotype of FosBcKO lenses is not surprising in light of the low level of FosB expression in healthy LECs. In contrast, LECs lacking FosB exhibit many changes to their acute transcriptomic response to lens fiber cell removal with 874 DEGs detected in FosBcKO LECs at 6 h PCS. However, in contrast to our initial predictions, FosBcKO LECs exhibit higher expression of inflammatory markers than wildtype LECs at 6 h PCS.
FosB is a member of the AP1 family of transcription factors that mediates its function as either a homodimer or a heterodimer with other members of this family. The complexity of FosB function is further expanded by its numerous splice forms including ΔFosB which is a stable transcriptional repressor [99,100]. As the vast majority of the injury related DEGs detected in FosBcKO LECs are upregulated, including other IETFs such as JunB and Ier3 as well as Itgb8 (2 fold) which is critical for TGFβ activation [11] by injured LECs, it is possible that FosB elevation upon lens injury buffers the acute injury response by repressing the action of other IETFs.

5. Conclusions

This study revealed that lens epithelial cells that remain attached to the lens capsule following lens fiber cell removal modeling cataract surgery greatly reprogram their transcriptome by 6 h post surgery which likely sets the stage for subsequent post surgical ocular inflammation and fibrosis/PCO pathogenesis. The rapid elevation of MAPK signaling as measured by ERK phosphorylation post cataract surgery and the subsequent induction of immediate early transcription factor expression suggests that injury induced cell signaling driving the immediate early response sets the stage for the conditions needed to induce the epithelial-mesenchymal transition of lens epithelial cells to myofibroblasts. Further work is necessary to identify the molecular mechanisms by which lens fiber cell removal triggers this response and which IETFs play the most critical roles in setting the stage for later epithelial mesenchymal transition of lens epithelial cells and subsequent fibrotic PCO.

Supplementary Materials

The following supporting information can be downloaded at: https://www.mdpi.com/article/10.3390/cells11213456/s1, Figure S1: Phenotype of the adult Egr1KO lens; Table S1: List of all qRT-PCR primers; Table S2: Primary antibodies used in this study; Table S3: Differential expression of genes between naïve WT LECs and those isolated 6 h PCS; Table S4: Genes differentially expressed in naïve adult mouse LECs due to deletion of the Egr1 gene; Table S5: Genes differentially expressed in between WT adult mouse LECs and those lacking the Egr1 gene at 6 hours PCS; Table S6: Genes differentially expressed in naïve adult mouse LECs due to deletion of the Fosb gene; Table S7: Genes differentially expressed in between WT adult mouse LECs and those lacking the Fosb gene at 6 hours PCS.

Author Contributions

Conceptualization, S.G.N. and M.K.D.; methodology, Y.W. and A.P.F.; investigation, S.G.N., A.P.F., M.H.S., Y.W. and A.G.; data curation, A.P.F.; writing—original draft preparation, S.G.N.; writing—review and editing, S.G.N., M.K.D. and M.H.S.; visualization, S.G.N., A.P.F. and M.K.D.; supervision, M.K.D.; project administration, M.K.D.; funding acquisition, S.G.N. and M.K.D. All authors have read and agreed to the published version of the manuscript.

Funding

This study was supported by National Institutes of Health Grant (EY028597) to MKD; SGN received a Sigma Xi Grant-in-Aid of Research; INBRE program grant P20 GM103446 and the State of Delaware supported the University of Delaware Core Bioimaging Facility; (NIH grant 1S10 RR027273-01) funded the acquisition of the confocal microscope used in this study.

Institutional Review Board Statement

The animal study protocol was approved by the Institutional Review Board of the University of Delaware (protocol code 1039, approved 12 January 2021).

Data Availability Statement

The RNAseq data presented in this manuscript can be obtained at the Gene Expression Omnibus under accession numbers GSE206563 and GSE206574.

Conflicts of Interest

The authors declare no conflict of interest.

References

  1. Wormstone, M.; Wride, M.A. The ocular lens: A classic model for development, physiology and disease. Philos. Trans. R. Soc. B Biol. Sci. 2011, 366, 1190–1192. [Google Scholar] [CrossRef] [PubMed] [Green Version]
  2. Liu, Y.C.; Wilkins, M.; Kim, T.; Malyugin, B.; Mehta, J.S. Cataracts. Lancet 2017, 390, 600–612. [Google Scholar] [CrossRef]
  3. Ang, B. Cataract Surgery Steps: From Start to Finish. Victoria, Australia: Vision-and-Eye-Health.com. 2022. Available online: https://www.vision-and-eye-health.com/cataractsurgery-steps.html (accessed on 24 October 2022).
  4. Khairallah, M.; Kahloun, R.; Bourne, R.; Limburg, H.; Flaxman, S.R.; Jonas, J.B.; Keeffe, J.; Leasher, J.; Naidoo, K.; Pesudovs, K.; et al. Number of People Blind or Visually Impaired by Cataract Worldwide and in World Regions, 1990 to 2010. Investig. Opthalmol. Vis. Sci. 2015, 56, 6762–6769. [Google Scholar] [CrossRef] [PubMed] [Green Version]
  5. Diagourtas, A.; Petrou, P.; Georgalas, I.; Oikonomakis, K.; Giannakouras, P.; Vergados, A.; Papaconstantinou, D. Bleb failure and intraocular pressure rise following Nd: Yag laser capsulotomy. BMC Ophthalmol. 2017, 17, 18. [Google Scholar] [CrossRef] [Green Version]
  6. Ascaso, F.J.; Huerva, V.; Grzybowski, A. The Role of Inflammation in the Pathogenesis of Macular Edema Secondary to Retinal Vascular Diseases. Mediat. Inflamm. 2014, 2014, 432685. [Google Scholar] [CrossRef] [PubMed]
  7. Teh, B.L.; Megaw, R.; Borooah, S.; Dhillon, B. Optimizing cataract surgery in patients with age-related macular degeneration. Surv. Ophthalmol. 2017, 62, 346–356. [Google Scholar] [CrossRef] [PubMed]
  8. Palestine, A.G.; Pecen, P.E.; Siringo, F.; Colo, A. Retinal Detachments in Patients with Uveitis. Newtown Square, PA, USA: Review of Ophthalmology. 2017. Available online: https://www.reviewofophthalmology.com/article/retinal-detachments-in-patients-with-uveitis (accessed on 10 July 2019).
  9. Bhutto, I.; Lutty, G. Understanding age-related macular degeneration (AMD): Relationships between the photoreceptor/retinal pigment epithelium/Bruch’s membrane/choriocapillaris complex. Mol. Asp. Med. 2012, 33, 295–317. [Google Scholar] [CrossRef] [Green Version]
  10. Abbouda, A.; Tortorella, P.; Restivo, L.; Santoro, E.; De Marco, F.; La Cava, M. Follow-Up Study of Over Three Years of Patients with Uveitis after Cataract Phacoemulsification: Outcomes and Complications. Semin. Ophthalmol. 2015, 31, 532–541. [Google Scholar] [CrossRef]
  11. Shihan, M.H.; Novo, S.G.; Wang, Y.; Sheppard, D.; Atakilit, A.; Arnold, T.D.; Rossi, N.M.; Faranda, A.P.; Duncan, M.K. αVβ8 integrin targeting to prevent posterior capsular opacification. JCI Insight 2021, 6, e145715. [Google Scholar] [CrossRef]
  12. Wormstone, I.M. Posterior Capsule Opacification: A Cell Biological Perspective. Exp. Eye Res. 2002, 74, 337–347. [Google Scholar] [CrossRef]
  13. Juthani, V.V.; Clearfield, E.; Chuck, R.S. Non-steroidal anti-inflammatory drugs versus corticosteroids for controlling inflammation after uncomplicated cataract surgery. Cochrane Database Syst. Rev. 2017, 2017, CD010516. [Google Scholar] [CrossRef]
  14. Colin, J. The Role of NSAIDs in the Management of Postoperative Ophthalmic Inflammation. Drugs 2007, 67, 1291–1308. [Google Scholar] [CrossRef] [PubMed]
  15. Liegner, J.; Grzybowski, A.; Galloway, M.; Lindstrom, R. Dropless Cataract Surgery: An Overview. Curr. Pharm. Des. 2017, 23, 558–564. [Google Scholar] [CrossRef] [PubMed]
  16. Sawa, M. Laser flare-cell photometer: Principle and significance in clinical and basic ophthalmology. Jpn. J. Ophthalmol. 2016, 61, 21–42. [Google Scholar] [CrossRef] [PubMed]
  17. Song, P.; Li, P.; Geng, W.; Qin, M.; Su, S.; Zhou, T.; Yuan, Y.; Zhang, G.; Wu, J.; Ji, M.; et al. Cytokines possibly involved in idiopathic epiretinal membrane progression after uncomplicated cataract surgery. Exp. Eye Res. 2022, 217, 108957. [Google Scholar] [CrossRef] [PubMed]
  18. Jiang, J.; Shihan, M.H.; Wang, Y.; Duncan, M.K. Lens Epithelial Cells Initiate an Inflammatory Response Following Cataract Surgery. Investig. Opthalmology Vis. Sci. 2018, 59, 4986–4997. [Google Scholar] [CrossRef] [Green Version]
  19. Eldred, J.A.; Zheng, J.; Chen, S.; Wormstone, I.M. An In Vitro Human Lens Capsular Bag Model Adopting a Graded Culture Regime to Assess Putative Impact of IOLs on PCO Formation. Investig. Opthalmology Vis. Sci. 2019, 60, 113–122. [Google Scholar] [CrossRef] [Green Version]
  20. Raj, S.M.; Vasavada, A.R.; Johar, S.R.K.; Vasavada, V.A.; Vasavada, V.A. Post-operative capsular opacification: A review. Int. J. Biomed. Sci. 2007, 3, 237–250. Available online: https://www.ncbi.nlm.nih.gov/pmc/articles/PMC3614664/ (accessed on 12 October 2021).
  21. Findl, O.; Neumayer, T.; Hirnschall, N.; Buehl, W. Natural Course of Elschnig Pearl Formation and Disappearance. Investig. Opthalmology Vis. Sci. 2010, 51, 1547–1553. [Google Scholar] [CrossRef] [Green Version]
  22. Bisevac, J.; Anisimova, N.S.; Nagymihály, R.; Kristianslund, O.; Katta, K.; Noer, A.; Sharafetdinov, I.H.; Drolsum, L.; Moe, M.C.; Malyugin, B.E.; et al. Long-term myofibroblast persistence in the capsular bag contributes to the late spontaneous in-the-bag intraocular lens dislocation. Sci. Rep. 2020, 10, 20532. [Google Scholar] [CrossRef]
  23. Donachie, P.H.J.; Barnes, B.L.; Olaitan, M.; Sparrow, J.M.; Buchan, J.C. The Royal College of Ophthalmologists’ National Ophthalmology Database study of cataract surgery: Report 9, Risk factors for posterior capsule opacification. Eye 2022, 29, 552–560. [Google Scholar] [CrossRef] [PubMed]
  24. Shihan, M.H.; Novo, S.G.; Duncan, M.K. Cataract surgeon viewpoints on the need for novel preventative anti-inflammatory and anti-posterior capsular opacification therapies. Curr. Med Res. Opin. 2019, 35, 1971–1981. [Google Scholar] [CrossRef] [PubMed]
  25. Wormstone, I.M.; Eldred, J.A. Experimental models for posterior capsule opacification research. Exp. Eye Res. 2016, 142, 2–12. [Google Scholar] [CrossRef]
  26. Pande, M.V.; Spalton, D.J.; Kerr-Muir, M.G.; Marshall, J. Postoperative inflammatory response to phacoemulsification and extracapsular cataract surgery: Aqueous flare and cells. J. Cataract Refract. Surg. 1996, 22, 770–774. [Google Scholar] [CrossRef]
  27. Faranda, A.P.; Shihan, M.H.; Wang, Y.; Duncan, M.K. The effect of sex on the mouse lens transcriptome. Exp. Eye Res. 2021, 209, 108676. [Google Scholar] [CrossRef]
  28. Faranda, A.P.; Shihan, M.H.; Wang, Y.; Duncan, M.K. The aging mouse lens transcriptome. Exp. Eye Res. 2021, 209, 108663. [Google Scholar] [CrossRef]
  29. Lee, S.L.; Tourtellotte, L.C.; Wesselschmidt, R.L.; Milbrandt, J. Growth and Differentiation Proceeds Normally in Cells Deficient in the Immediate Early Gene NGFI-A. J. Biol. Chem. 1995, 270, 9971–9977. [Google Scholar] [CrossRef] [Green Version]
  30. Ohnishi, Y.N.; Eagle, A.L.; Ohnishi, Y.H.; Cahill, M.E.; Wirtz, A.J.; Robinson, A.J.; Nestler, E.J. Generation and Validation of a Floxed Fosb Mouse Line. 2017. Available online: https://www.biorxiv.org/content/10.1101/179309v1 (accessed on 24 October 2022).
  31. Zhao, H.; Yang, Y.; Rizo, C.M.; Overbeek, P.A.; Robinson, M.L. Insertion of a Pax6 Consensus Binding Site into the αA-Crystallin Promoter Acts as a Lens Epithelial Cell Enhancer in Transgenic Mice. Investig. Opthalmology Vis. Sci. 2004, 45, 1930–1939. [Google Scholar] [CrossRef] [Green Version]
  32. Scheiblin, D.A.; Gao, J.; Caplan, J.L.; Simirskii, V.N.; Czymmek, K.J.; Mathias, R.T.; Duncan, M.K. Beta-1 integrin is important for the structural maintenance and homeostasis of differentiating fiber cells. Int. J. Biochem. Cell Biol. 2014, 50, 132–145. [Google Scholar] [CrossRef] [Green Version]
  33. Shiels, A.; King, J.M.; Mackay, D.S.; Bassnett, S. Refractive Defects and Cataracts in Mice Lacking Lens Intrinsic Membrane Protein-2. Investig. Opthalmology Vis. Sci. 2007, 48, 500–508. [Google Scholar] [CrossRef] [Green Version]
  34. Gokhin, D.S.; Nowak, R.B.; Kim, N.E.; Arnett, E.E.; Chen, A.C.; Sah, R.L.; Clark, J.I.; Fowler, V.M. Tmod1 and CP49 Synergize to Control the Fiber Cell Geometry, Transparency, and Mechanical Stiffness of the Mouse Lens. PLoS ONE 2012, 7, e48734. [Google Scholar] [CrossRef] [PubMed]
  35. Schindelin, J.; Arganda-Carreras, I.; Frise, E.; Kaynig, V.; Longair, M.; Pietzsch, T.; Preibisch, S.; Rueden, C.; Saalfeld, S.; Schmid, B.; et al. Fiji: An open-source platform for biological-image analysis. Nat. Methods 2012, 9, 676–682. [Google Scholar] [CrossRef] [PubMed] [Green Version]
  36. Mamuya, F.A.; Wang, Y.; Roop, V.H.; Scheiblin, D.A.; Zajac, J.C.; Duncan, M.K. The roles of αVintegrins in lensEMTand posterior capsular opacification. J. Cell. Mol. Med. 2014, 18, 656–670. [Google Scholar] [CrossRef] [PubMed]
  37. Desai, V.D.; Wang, Y.; Simirskii, V.; Duncan, M.K. CD44 expression is developmentally regulated in the mouse lens and increases in the lens epithelium after injury. Differentiation 2010, 79, 111–119. [Google Scholar] [CrossRef] [PubMed] [Green Version]
  38. Yates, A.D.; Achuthan, P.; Akanni, W.; Allen, J.; Alvarez-Jarreta, J.; Amode, M.R.; Armean, I.M.; Azov, A.G.; Bennett, R.; Bhai, J.; et al. Ensembl 2020. Nucleic Acids Res. 2020, 48, D682–D688. [Google Scholar] [CrossRef]
  39. Kim, D.; Paggi, J.M.; Park, C.; Bennett, C.; Salzberg, S.L. Graph-based genome alignment and genotyping with HISAT2 and HISAT-genotype. Nat. Biotechnol. 2019, 37, 907–915. [Google Scholar] [CrossRef]
  40. Anders, S.; Pyl, P.T.; Huber, W. HTSeq—A Python framework to work with high-throughput sequencing data. Bioinformatics 2015, 31, 166–169. [Google Scholar] [CrossRef] [Green Version]
  41. Robinson, M.D.; Oshlack, A. A scaling normalization method for differential expression analysis of RNA-seq data. Genome Biol. 2010, 11, R25. [Google Scholar] [CrossRef] [Green Version]
  42. Phipson, B.; Lee, S.; Majewski, I.J.; Alexander, W.S.; Smyth, G.K. Robust hyperparameter estimation protects against hypervariable genes and improves power to detect differential expression. Ann. Appl. Stat. 2016, 10, 946–963. [Google Scholar] [CrossRef]
  43. Chen, Y.; Lun, A.T.L.; Smyth, G.K. From reads to genes to pathways: Differential expression analysis of RNA-Seq experiments using Rsubread and the edgeR quasi-likelihood pipeline. F1000Research 2016, 5, 1438. [Google Scholar] [CrossRef] [Green Version]
  44. Manthey, A.L.; Terrell, A.M.; Lachke, S.A.; Polson, S.W.; Duncan, M.K. Development of novel filtering criteria to analyze RNA-sequencing data obtained from the murine ocular lens during embryogenesis. Genom. Data 2014, 2, 369–374. [Google Scholar] [CrossRef] [PubMed]
  45. Kanehisa, M.; Furumichi, M.; Tanabe, M.; Sato, Y.; Morishima, K. KEGG: New perspectives on genomes, pathways, diseases and drugs. Nucleic Acids Res. 2017, 45, D353–D361. [Google Scholar] [CrossRef] [PubMed] [Green Version]
  46. Tarca, A.L.; Draghici, S.; Khatri, P.; Hassan, S.S.; Mittal, P.; Kim, J.-S.; Kim, C.J.; Kusanovic, J.P.; Romero, R. A novel signaling pathway impact analysis. Bioinformatics 2008, 25, 75–82. [Google Scholar] [CrossRef] [PubMed] [Green Version]
  47. Draghici, S.; Khatri, P.; Tarca, A.L.; Amin, K.; Done, A.; Voichita, C.; Georgescu, C.; Romero, R. A systems biology approach for pathway level analysis. Genome Res. 2007, 17, 1537–1545. [Google Scholar] [CrossRef] [PubMed] [Green Version]
  48. Ahsan, S.; Drăghici, S. Identifying Significantly Impacted Pathways and Putative Mechanisms with iPathwayGuide. Curr. Protoc. Bioinform. 2017, 57, 7.15.1–7.15.30. [Google Scholar] [CrossRef]
  49. Ashburner, M.; Ball, C.A.; Blake, J.A.; Botstein, D.; Butler, H.; Cherry, J.M.; Davis, A.P.; Dolinski, K.; Dwight, S.S.; Eppig, J.T.; et al. Gene ontology: Tool for the unification of biology. Nat. Genet. 2000, 25, 25–29. [Google Scholar] [CrossRef] [Green Version]
  50. A Reed, N.; Oh, D.-J.; Czymmek, K.J.; Duncan, M.K. An immunohistochemical method for the detection of proteins in the vertebrate lens. J. Immunol. Methods 2001, 253, 243–252. [Google Scholar] [CrossRef]
  51. Shihan, M.H.; Novo, S.G.; Le Marchand, S.J.; Wang, Y.; Duncan, M.K. A simple method for quantitating confocal fluorescent images. Biochem. Biophys. Rep. 2021, 25, 100916. [Google Scholar] [CrossRef]
  52. Novo, S.G. Injury Drives Inflammation, then Fibrosis: The Response of the Lens Epithelium to Cataract Surgery Dissertation in Partial Fulfillment of the Ph.D. In Biological Sciences; University of Delaware: Newark, DE, USA, 2022; in press; Available online: https://udspace.udel.edu/ (accessed on 24 October 2022).
  53. Fujimoto, Y.; Kuramoto, N.; Yoneyama, M.; Azuma, Y.-T. Interleukin-19 as an Immunoregulatory Cytokine. Curr. Mol. Pharmacol. 2020, 14, 191–199. [Google Scholar] [CrossRef]
  54. Kuroda, K.O.; Meaney, M.J.; Uetani, N.; Fortin, Y.; Ponton, A.; Kato, T. ERK-FosB signaling in dorsal MPOA neurons plays a major role in the initiation of parental behavior in mice. Mol. Cell. Neurosci. 2007, 36, 121–131. [Google Scholar] [CrossRef]
  55. Granet, C.; Vico, A.G.L.; Alexandre, C.; Lafage-Proust, M.-H. MAP and src kinases control the induction of AP-1 members in response to changes in mechanical environment in osteoblastic cells. Cell. Signal. 2002, 14, 679–688. [Google Scholar] [CrossRef]
  56. Tyssowski, K.; DeStefino, N.R.; Cho, J.-H.; Dunn, C.J.; Poston, R.G.; Carty, C.E.; Jones, R.D.; Chang, S.M.; Romeo, P.; Wurzelmann, M.K.; et al. Different Neuronal Activity Patterns Induce Different Gene Expression Programs. Neuron 2018, 98, 530–546.e11. [Google Scholar] [CrossRef] [PubMed] [Green Version]
  57. Tullai, J.W.; Schaffer, M.E.; Mullenbrock, S.; Sholder, G.; Kasif, S.; Cooper, G.M. Immediate-Early and Delayed Primary Response Genes Are Distinct in Function and Genomic Architecture. J. Biol. Chem. 2007, 282, 23981–23995. [Google Scholar] [CrossRef] [Green Version]
  58. Schippert, R.; Burkhardt, E.; Feldkaemper, M.; Schaeffel, F. Relative Axial Myopia inEgr-1(ZENK) Knockout Mice. Investig. Opthalmology Vis. Sci. 2007, 48, 11–17. [Google Scholar] [CrossRef] [PubMed] [Green Version]
  59. Nakajima, T.; Belusko, P.; Walkup, R.D.; Azuma, M.; Shearer, T.R. Involvement of Egr-1 in lens epithelial cell death induced by selenite. Exp. Eye Res. 2006, 82, 874–878. [Google Scholar] [CrossRef] [PubMed]
  60. Tian, R.; Xu, Y.; Dou, W.-W.; Zhang, H. Bioinformatics analysis of microarray data to explore the key genes involved in HSF4 mutation-induced cataract. Int. J. Ophthalmol. 2018, 11, 910–917. [Google Scholar] [CrossRef] [PubMed]
  61. Wang, Y.; Terrell, A.M.; Riggio, B.A.; Anand, D.; Lachke, S.; Duncan, M.K. β1-Integrin Deletion From the Lens Activates Cellular Stress Responses Leading to Apoptosis and Fibrosis. Investig. Opthalmology Vis. Sci. 2017, 58, 3896–3922. [Google Scholar] [CrossRef] [Green Version]
  62. Shihan, M.H.; Kanwar, M.; Wang, Y.; Jackson, E.E.; Faranda, A.P.; Duncan, M.K. Fibronectin has multifunctional roles in posterior capsular opacification (PCO). Matrix Biol. 2020, 90, 79–108. [Google Scholar] [CrossRef]
  63. Bhattacharyya, S.; Wu, M.; Fang, F.; Tourtellotte, W.; Feghali-Bostwick, C.; Varga, J. Early growth response transcription factors: Key mediators of fibrosis and novel targets for anti-fibrotic therapy. Matrix Biol. 2011, 30, 235–242. [Google Scholar] [CrossRef] [Green Version]
  64. Jones, W.; Rodriguez, J.; Bassnett, S. Targeted deletion of fibrillin-1 in the mouse eye results in ectopia lentis and other ocular phenotypes associated with Marfan syndrome. Dis. Model. Mech. 2019, 12, dmm037283. [Google Scholar] [CrossRef] [Green Version]
  65. De Maria, A.; Wilmarth, P.A.; David, L.L.; Bassnett, S. Proteomic Analysis of the Bovine and Human Ciliary Zonule. Investig. Opthalmology Vis. Sci. 2017, 58, 573–585. [Google Scholar] [CrossRef] [PubMed]
  66. Brown, J.R.; Ye, H.; Bronson, R.T.; Dikkes, P.; Greenberg, M.E. A Defect in Nurturing in Mice Lacking the Immediate Early Gene fosB. Cell 1996, 86, 297–309. [Google Scholar] [CrossRef] [Green Version]
  67. de Iongh, R.; Wederell, E.; Lovicu, F.; McAvoy, J. Transforming Growth Factor-β-Induced Epithelial-Mesenchymal Transition in the Lens: A Model for Cataract Formation. Cells Tissues Organs 2005, 179, 43–55. [Google Scholar] [CrossRef]
  68. Leigh, T.; Scalia, R.G.; Autieri, M.V. Resolution of inflammation in immune and nonimmune cells by interleukin-19. Am. J. Physiol. Physiol. 2020, 319, C457–C464. [Google Scholar] [CrossRef]
  69. Presicce, P.; Park, C.-W.; Senthamaraikannan, P.; Bhattacharyya, S.; Jackson, C.; Kong, F.; Rueda, C.M.; DeFranco, E.; Miller, L.A.; Hildeman, D.A.; et al. IL-1 signaling mediates intrauterine inflammation and chorio-decidua neutrophil recruitment and activation. JCI Insight 2018, 3, e98306. [Google Scholar] [CrossRef] [PubMed] [Green Version]
  70. Smith, S.; Wu, P.W.; Seo, J.J.; Fernando, T.; Jin, M.; Contreras, J.; Montano, E.N.; Gabhann, J.N.; Cunningham, K.; Widaa, A.; et al. IL-16/miR-125a axis controls neutrophil recruitment in pristane-induced lung inflammation. JCI Insight 2018, 3, e120798. [Google Scholar] [CrossRef] [PubMed] [Green Version]
  71. Simon, L.S. Role and regulation of cyclooxygenase-2 during inflammation. Am. J. Med. 1999, 106, 37S–42S. [Google Scholar] [CrossRef]
  72. Lucchini, A.C.; Gachanja, N.N.; Rossi, A.G.; Dorward, D.A.; Lucas, C.D. Epithelial Cells and Inflammation in Pulmonary Wound Repair. Cells 2021, 10, 339. [Google Scholar] [CrossRef]
  73. Chi, Z.; Melendez, A.J. Role of Cell Adhesion Molecules and Immune-Cell Migration in the Initiation, Onset and Development of Atherosclerosis. Cell Adhes. Migr. 2007, 1, 171–175. [Google Scholar] [CrossRef] [Green Version]
  74. Camilleri, M. Leaky gut: Mechanisms, measurement and clinical implications in humans. Gut 2019, 68, 1516–1526. [Google Scholar] [CrossRef]
  75. Naik, S.; Larsen, S.; Gomez, N.C.; Alaverdyan, K.; Sendoel, A.; Yuan, S.; Polak, L.; Kulukian, A.; Chai, S.; Fuchs, E. Inflammatory memory sensitizes skin epithelial stem cells to tissue damage. Nature 2017, 550, 475–480. [Google Scholar] [CrossRef] [PubMed]
  76. Eldred, J.A.; Dawes, L.J.; Wormstone, I.M. The lens as a model for fibrotic disease. Philos. Trans. R. Soc. B Biol. Sci. 2011, 366, 1301–1319. [Google Scholar] [CrossRef] [PubMed] [Green Version]
  77. Gregg, J.; Fraizer, G. Transcriptional Regulation of EGR1 by EGF and the ERK Signaling Pathway in Prostate Cancer Cells. Genes Cancer 2011, 2, 900–909. [Google Scholar] [CrossRef] [PubMed] [Green Version]
  78. Fujioka, S.; Niu, J.; Schmidt, C.; Sclabas, G.M.; Peng, B.; Uwagawa, T.; Li, Z.; Evans, D.B.; Abbruzzese, J.L.; Chiao, P.J. NF-κB and AP-1 Connection: Mechanism of NF-κB-Dependent Regulation of AP-1 Activity. Mol. Cell. Biol. 2004, 24, 7806–7819. [Google Scholar] [CrossRef] [PubMed] [Green Version]
  79. Peroval, M.Y.; Boyd, A.C.; Young, J.R.; Smith, A.L. A Critical Role for MAPK Signalling Pathways in the Transcriptional Regulation of Toll Like Receptors. PLoS ONE 2013, 8, e51243. [Google Scholar] [CrossRef] [Green Version]
  80. Dulle, J.E.; Fort, P.E. Crystallins and neuroinflammation: The glial side of the story. Biochim. et Biophys. Acta (BBA)-Gen. Subj. 2016, 1860, 278–286. [Google Scholar] [CrossRef] [Green Version]
  81. Shirai, K.; Saika, S.; Okada, Y.; Miyamoto, T.; Ueyama, T.; Ohnishi, Y. Transcriptional activation in lens epithelial cells following an ocular blunt trauma. J. Cataract Refract. Surg. 2005, 31, 1226–1230. [Google Scholar] [CrossRef]
  82. Shirai, K.; Okada, Y.; Saika, S.; Senba, E.; Ohnishi, Y. Expression of Transcription Factor AP-1 in Rat Lens Epithelial Cells during Wound Repair. Exp. Eye Res. 2001, 73, 461–468. [Google Scholar] [CrossRef]
  83. Tang, J.; Salzman, I.J.; Sable, M.D. Traumatic cataract formation after vigorous ocular massage. J. Cataract Refract. Surg. 2003, 29, 1641–1642. [Google Scholar] [CrossRef]
  84. Gremida, A.; Kassem, I.; Traish, A. Anterior capsular rupture following blunt ocular injury. Digit. J. Ophthalmol. 2011, 17, 66–68. [Google Scholar] [CrossRef]
  85. Lovicu, F.J.; Schulz, M.W.; Hales, A.M.; Vincent, L.N.; Overbeek, P.A.; Chamberlain, C.G.; McAvoy, J.W. Tgfβ induces morphological and molecular changes similar to human anterior subcapsular cataract. Br. J. Ophthalmol. 2002, 86, 220–226. Available online: https://www.ncbi.nlm.nih.gov/pmc/articles/PMC1771017/ (accessed on 12 October 2021). [CrossRef] [PubMed]
  86. Allen, A.; Maddala, R.; Eldawy, C.; Rao, P.V. Mechanical Load and Piezo1 Channel Regulated Myosin II Activity in Mouse Lenses. Int. J. Mol. Sci. 2022, 23, 4710. [Google Scholar] [CrossRef] [PubMed]
  87. Shishido, S.; Bã¶nig, H.; Kim, Y.-M. Role of Integrin Alpha4 in Drug Resistance of Leukemia. Front. Oncol. 2014, 4, 99. [Google Scholar] [CrossRef] [Green Version]
  88. Wu, X.; Hu, J.; Li, G.; Li, Y.; Zhang, J.; Wang, F.; Hu, L.; Fan, Z.; Lü, S.; Ding, G.; et al. Biomechanical stress regulates mammalian tooth replacement via the integrin β1-RUNX2-Wnt pathway. EMBO J. 2019, 39, e102374. [Google Scholar] [CrossRef]
  89. Ramachandran, A.; Gong, E.M.; Pelton, K.; Ranpura, S.A.; Mulone, M.; Seth, A.; Gomez, P.; Adam, R.M. FosB Regulates Stretch-Induced Expression of Extracellular Matrix Proteins in Smooth Muscle. Am. J. Pathol. 2011, 179, 2977–2989. [Google Scholar] [CrossRef] [PubMed]
  90. Baron, V.T.; Pio, R.; Jia, Z.; Mercola, D. Early Growth Response 3 regulates genes of inflammation and directly activates IL6 and IL8 expression in prostate cancer. Br. J. Cancer 2015, 112, 755–764. [Google Scholar] [CrossRef] [PubMed] [Green Version]
  91. Bahrami, S.; Drabløs, F. Gene regulation in the immediate-early response process. Adv. Biol. Regul. 2016, 62, 37–49. [Google Scholar] [CrossRef] [PubMed] [Green Version]
  92. Andreucci, J.J.; Grant, D.; Cox, D.M.; Tomc, L.K.; Prywes, R.; Goldhamer, D.J.; Rodrigues, N.; Bédard, P.-A.; McDermott, J.C. Composition and Function of AP-1 Transcription Complexes during Muscle Cell Differentiation. J. Biol. Chem. 2002, 277, 16426–16432. [Google Scholar] [CrossRef] [Green Version]
  93. Cervantes-Madrid, D.L.; Nagi, S.; Gustafsson, A.A. FosB transcription factor regulates COX-2 expression in colorectal cancer cells without affecting PGE2 expression. Oncol. Lett. 2017, 13, 1411–1416. [Google Scholar] [CrossRef] [Green Version]
  94. Shin, S.Y.; Lee, J.M.; Lim, Y.; Lee, Y.H. Transcriptional regulation of the growth-regulated oncogene α gene by early growth response protein-1 in response to tumor necrosis factor α stimulation. Biochim. et Biophys. Acta 2013, 1829, 1066–1074. [Google Scholar] [CrossRef]
  95. Veremeyko, T.; Yung, A.W.Y.; Anthony, D.C.; Strekalova, T.; Ponomarev, E.D. Early Growth Response Gene-2 Is Essential for M1 and M2 Macrophage Activation and Plasticity by Modulation of the Transcription Factor CEBPβ. Front. Immunol. 2018, 9, 2515. [Google Scholar] [CrossRef] [PubMed]
  96. Zhou, L.; Xue, C.; Chen, Z.; Jiang, W.; He, S.; Zhang, X. c-Fos is a mechanosensor that regulates inflammatory responses and lung barrier dysfunction during ventilator-induced acute lung injury. BMC Pulm. Med. 2022, 22, 9. [Google Scholar] [CrossRef] [PubMed]
  97. Zenz, R.; Eferl, R.; Scheinecker, C.; Redlich, K.; Smolen, J.; Schonthaler, H.B.; Kenner, L.; Tschachler, E.; Wagner, E.F. Activator protein 1 (Fos/Jun) functions in inflammatory bone and skin disease. Arthritis Res. Ther. 2007, 10, 201. [Google Scholar] [CrossRef] [PubMed] [Green Version]
  98. Kelz, M.B.; Kuszak, J.R.; Yang, Y.; Ma, W.; Steffen, C.; Al-Ghoul, K.; Zhang, Y.J.; Chen, J.; Nestler, E.J.; Spector, A. Deltafosb-induced cataract. Invest. Ophthalmol. Vis. Sci. 2000, 41, 3523–3538. Available online: https://www.ncbi.nlm.nih.gov/pubmed/11006248 (accessed on 16 September 2022). [PubMed]
  99. McClung, C.A.; Nestler, E.J. Regulation of gene expression and cocaine reward by CREB and ΔFosB. Nat. Neurosci. 2003, 6, 1208–1215. [Google Scholar] [CrossRef]
  100. Nestler, E.J. Transcriptional mechanisms of addiction: Role of ΔFosB. Philos. Trans. R. Soc. B Biol. Sci. 2008, 363, 3245–3255. [Google Scholar] [CrossRef]
Figure 1. Advaita iPathway analysis of genes differentially expressed at 6 h PCS in LECs. (A) Volcano plot of genes (represented by either a blue dot for negative fold change or red dot for positive fold change) whose expression was statistically different in 6 h PCS LECs. Yellow dot represents Il19. (B) Impact analysis of the 6 h PCS DEGs predicting that the KEGG pathway “cytokine-cytokine receptor interaction” (p-value of 1.120 × 10⁻⁸) (yellow dot) is the most significantly impacted pathway. While other impacted KEGG pathways are represented by the other dots with black dots being non-significant KEGG pathways and red dots being significant KEGG pathways. (C) Bar graph showing which cytokine-cytokine receptor interaction genes are differentially expressed in LECs at 6 h PCS. (D) Bar graph showing the “epithelial cell migration” (p-value = 9.600 × 10⁻⁵) genes differentially expressed in 6 h PCS LECs. (E) Bar graph showing the DEGs implicated in the “epithelial to mesenchymal transition” (p-value = 0.003) pathway.
Cells 11 03456 g001
Figure 2. MAPK signaling is acutely activated in LECs after lens injury (A) Bar graph of Advaita iPathway analysis of genes differentially expressed in LECs at 6 h PCS associated with MAPK signaling. (B) Immunostaining of pERK1/2 (green) in LECs isolated either immediately after lens fiber cell removal (0 h) or 1, 3 or 6 h later. Blue represents DNA. Scale bar = 35 μm (C) Quantitiation of total pERK1/2 levels in LECs obtained from three independent biological replicates (D) Quantitation of nuclear pERK1/2 levels in LECs obtained from three biological replicates. * represents p ≤ 0.05; ** represents p ≤ 0.01. The red dots and green squares in C & D both represent the individual biological replicate values for their corresponding bar in the bar graph.
Cells 11 03456 g002
Figure 3. Expression dynamics of select IETFs as revealed by bulk RNAseq expression profiling performed between 0–120 h PCS. (A) mRNA expression time course for FosB. (B) mRNA expression time course for Fos (cFos). (C) mRNA expression time course for Egr1. (D) mRNA expression time course for JunB. (E) mRNA expression time course for Jun (cJun). The Y axis represents fold expression level in comparison to levels observed in naïve LECs.
Cells 11 03456 g003
Figure 4. Protein expression of select IETFs in injured mouse lens epithelial cells at various times post lens fiber cell removal. (A) Immunolocalization of each studied IETF during the first 120 h (5 days) PCS. Red represents the IETF of interest, Blue represents DNA/cell nuclei. Scale bar = 70 μm. (B) Bar graphs representing quantification of the data shown in panel A. FosB * p-value ≤ 0.0001; cFos * p-value ≤ 0.0001; Egr1 * p-value ≤ 0.002 ** p-value ≤ 0.0001; JunB * p-value ≤ 0.0001; cJun * p-value ≤ 0.0001. The black dots in B represent the individual biological replicates for each bar in the bar graph.
Cells 11 03456 g004
Figure 5. Investigation of the effect of 6 h ex vivo culture on Egr1 and FosB levels in LECs by qRT-PCR (A) Egr1 mRNA levels significantly upregulate in LECs after six hours of ex vivo culture (* p-value ≤ 0.01) (B) FosB mRNA levels signficantly upregulate in LECs after six hours of ex vivo culture (* p-value ≤ 0.025) FC-fold change from RNA levels obtained from LECs immediately after isolation.
Cells 11 03456 g005
Figure 6. Egr1KO LECs attenuate a portion of their inflammatory response PCS but the fibrotic response was not affected. (A) Immunofluorescence analysis of the proinflammatory mediators Cxcl1, Cox2 and S100a9 (red) in LECs from wild type and Egr1KO mice at 24 h PCS. Blue = DNA, Scale bar = 70 μm. (B) Immunofluorescence analysis of the fibrotic markers Gremlin1 (green) and Tenascin C (red) in LECs from wild type and Egr1KO mice at 48 h PCS. Blue = DNA, Scale bar = 70 μm. (C) Quantitation of the data shown in panels A and B. Cxcl1 and Cox2, * represents p ≤ 0.01; S100a9, p = 0.26; Gremlin 1, p = 0.84; Tenascin C, p = 0.42. The black dots in C represent the individual biological replicates for each bar in the bar graph.
Cells 11 03456 g006
Figure 7. Advaita iPathway analysis of differentially expressed pathways/genes between 6 h Egr1KO and 6 h WT LECs. (A) Impact analysis of the DEGs suggest that the KEGG pathway map “antigen processing and presentation” (p-value = 4.147 × 10⁻⁶) (yellow dot) is the most significantly impacted pathway in the 6 h LECs. Other impacted KEGG pathways are represented by the other dots with black dots being non-significant KEGG pathways and red dots being significant KEGG pathways. (B) Bar graph showing the antigen processing and presentation genes that are differentially expressed in the 6H Egr1KO LECs. (C) Bar graph showing the cell adhesion molecules (p-value = 0.003) pathway of genes differentially expressed in the 6H Egr1KO LECs. (D) Bar graph showing the cytokine-cytokine receptor interaction (p-value = 0.003) pathway of genes differentially expressed in the 6H Egr1KO LECs. (E) Bar graph showing the ECM receptor interaction (p-value = 0.045) pathway of genes differentially expressed in the 6H Egr1KO LECs.
Cells 11 03456 g007
Figure 8. Creation of mice lacking the FosB gene from the lens (FosBcKO) and characterization of its lens phenotype. (A) Diagram of the floxed FosB allele before and after cre recombinase mediated deletion. The FosB allele used in this study is flanked by 2 Lox p sites (green triangles) around exons 2 and 3. After recombination, the FosB allele has exons 2 and 3 excised. Location of the genotyping primers used to confirm successful excision is indicated by FW and RV. (B) PCR analysis of lens DNA obtained from FosBcKO mice showing successful removal of exons 2 and 3. (C) Protein validation of the absence of the FosB protein (Red) in FosBcKO LECs via immunofluorescence at 6H PCS (Scale bar 70 µm) (Blue is DNA). (D) Quantification of the protein validation experiment in (C) * p-value < 0.0001. (E) Grid analysis, dark field imaging (Scale bar 50 µm) and H&E staining of the FosBcKO lens (right images) compared to the Wild type lens (left images) (Scale bar 100 µm). The black arrows are utilized to point out the disorganization in the transition zone of the lens. (F) Quantification of lens measurements obtained from the FosBcKO lens showing that they were of similar size to wildtype.
Cells 11 03456 g008
Figure 9. Inflammatory mediator protein expression in FosBcKO LECs compared to Wild Type at 24 h PCS. (A) Immunofluorescent staining for the proinflammatory mediators Cxcl1 and Cox2 (red) at 24 h PCS. Blue is DNA and Scale bar = 70 µm. (B) Quantification of Cxcl1 levels in LECs at 24 h PCS by immunofluorescence p = 0.97. (C) Quantification of Cox2 levels in LECs at 24 H PCS by immunofluorescence * represents p-value ≤ 0.01. The black dots in B & C represent the individual biological replicates for each bar in the bar graph.
Cells 11 03456 g009
Figure 10. Fibrotic marker protein expression in FosBcKO LECs at 72 h PCS via immunofluorescence. (A) The fibrotic markers, Gremlin1 and Tenascin C (red) in wild type and and FosBcKO LECs at 72 h PCS. Blue = DNA, Scale bar = 70 μm. (B) Quantitation of Tenascin C protein levels in LECs at 72 h PCS analyzed by immunofluorescence * p-value ≤ 0.05. (C) Quantitation of Gremlin1 protein levels in LECs at 72 h PCS analyzed by immunofluorescence p = 0.99. The black dots in B & C represent the individual biological replicates for each bar in the bar graph.
Cells 11 03456 g010
Figure 11. Advaita iPathway analysis of differentially expressed pathways/genes between 6 h FosBcKO and 6 h WT LECs. (A) Impact analysis of the DEGs suggest that the KEGG pathway map “cytokine-cytokine receptor interaction” (p-value = 1.655 × 10⁻⁶) (yellow dot) is the most significantly impacted pathway in the 6 h LECs. Other impacted KEGG pathways are represented by the other dots with black dots being non-significant KEGG pathways and red dots being significant KEGG pathways. (B) Bar graph showing the cytokine-cytokine receptor interaction genes that are differentially expressed in the 6 h FosBcKO LECs. (C) Bar graph showing the cell adhesion molecules (p-value = 7.754 × 10⁻⁶) pathway of genes differentially expressed in the 6 h FosBcKO LECs. (D) Bar graph showing the ECM-receptor interaction (p-value = 4.252 × 10⁻⁵) pathway of genes differentially expressed in the 6 h FosBcKO LECs. (E) Bar graph showing the complement and coagulation cascades (p-value = 4.528 × 10⁻⁵) pathway of genes differentially expressed in the 6 h FosBcKO LECs.
Cells 11 03456 g011
Table 1. Top 20 most upregulated genes in mouse LECs at 6 h PCS.
Gene SymbolGene NameWild Type 0H FPKMWild Type 6H FPKMFold ChangeFDR
Il19Interleukin 190.003.38753.974.39 × 10−3
Krtap4-16Keratin associated protein 4–160.002.14427.683.14 × 10−3
Csf3Colony Stimulating Factor 30.1121.34232.911.31 × 10−2
Il6Interleukin 60.078.55149.034.61 × 10−2
FosbFBJ osteosarcoma oncogene B1.89198.30130.499.36 × 10−3
Ptx3Pentraxin 31.08105.47120.935.05 × 10−3
Esm1Endothelial cell-specific molecule 10.1612.5296.904.56 × 10−3
IqcnIQ motif containing N0.168.6667.981.58 × 10−2
C2cd4bC2 calcium-dependent domain containing 4B0.158.1765.468.63 × 10−3
Emp1Epithelial membrane protein 11.8576.3651.284.39 × 10−5
Ifi202bInterferon activated gene 202B0.093.6447.329.48 × 10−3
ArcActivity regulated cytoskeletal associated protein5.64183.8239.943.64 × 10−3
Ptgs2Prostaglandin-endoperoxide synthase 20.6520.9639.627.93 × 10−3
PlaurPlasminogen activator, urokinase receptor0.185.5436.694.17 × 10−2
Klf2Kruppel-like factor 21.1428.1730.601.11 × 10−3
Htr1d5-hydroxytrptamine receptor 1D0.5413.0629.372.39 × 10−5
Rnf125Ring finger protein 1250.184.1727.651.60 × 10−3
F3Coagulation factor III1.9743.9127.013.80 × 10−3
LifLeukemia inhibitory factor1.5033.1026.401.41 × 10−3
Fgl2Fibrinogen-like protein 20.5611.7826.393.12 × 10−2
Table 2. The expression of classic fibrotic markers does not significantly change in mouse LECs by 6 h PCS.
Gene SymbolGene NameWild Type 0 h FPKMWild Type
6 h FPKM
Fold ChangeFDR
Col1a1Collagen, type I, alpha 11.537.245.802.14 × 10−1
TncTenascin C0.651.102.103.43 × 10−1
Acta2α Smooth Muscle Actin53.1763.901.487.06 × 10−1
ItgavIntegrin alpha V27.5531.571.427.71 × 10−2
VtnVitronectin23.5727.601.416.02 × 10−1
Fn1Fibronectin 12.792.16−1.039.70 × 10−1
Itgb1Integrin beta 156.7956.591.244.17 × 10−1
Table 3. IETFs differentially expressed in wildtype mouse LECs at 6 h PCS.
Gene SymbolGene NameWild Type
0 h FPKM
Wild Type 6 h FPKMFold ChangeFDR
FosbFBJ osteosarcoma oncogene B1.89198.30130.499.36 × 10−3
Klf2Kruppel-like factor 21.1428.1730.601.11 × 10−3
Nr4a1Nuclear receptor subfamily 4, group A, member 18.67105.2815.143.35 × 10−2
Zfp36Zinc finger protein 3613.93163.1014.567.59 × 10−3
Ier2Immediate early response 210.16111.5413.661.43 × 10−2
Egr3Early growth response 31.2613.4013.092.40 × 10−2
Ier5Immediate early response 55.5555.8212.305.95 × 10−5
Egr1Early growth response 133.41328.8912.103.09 × 10−2
Atf3Activating transcription factor 333.02268.9610.173.76 × 10−2
Ier3Immediate early response 33.4528.179.942.35 × 10−4
JunbJun B proto-oncogene20.98160.079.512.97 × 10−3
MaffV-maf musculoaponeurotic fibrosarcoma oncogene family, protein F12.5589.648.821.31 × 10−4
Klf4Kruppel-like factor 425.06166.328.213.38 × 10−3
Egr2Early growth response 20.885.497.614.84 × 10−2
Table 4. Topmost upregulated DEGS in Egr1KO LECs at 6 h PCS.
Gene SymbolGene NameWild Type
6 h FPKM
Egr1KO
6 h FPKM
Fold ChangeFDR
Pebp4Phosphatidylethanolamine binding protein 40.142.1814.583.33 × 10−3
Dio3Deiodinase, iodothyronine type III0.383.298.569.90 × 10−4
H2-AaHistocompatibility 2, class II antigen A, alpha0.372.887.674.98 × 10−3
H2-Eb1Histocompatibility 2, class II antigen E beta0.876.637.501.23 × 10−2
Cd74CD74 antigen4.7724.045.022.73 × 10−2
Cxcl1Chemokine (C-X-C motif) ligand 115.1168.714.557.51 × 10−7
Fbn2Fibrillin 20.602.654.422.60 × 10−3
Il3raInterleukin 3 receptor, alpha chain 0.713.174.412.79 × 10−2
Bmp2Bone morphogenetic protein 25.3723.644.405.02 × 10−4
Slc6a13Solute carrier family 6, member 132.6011.314.343.62 × 10−3
Table 5. Topmost downregulated DEGs seen in Egr1KO LECs at 6 h PCS.
Gene CodeGene NameWild Type
6 h FPKM
Egr1KO
6 h FPKM
Fold ChangeFDR
SstSomatostatin 6.710.13−39.554.98 × 10−3
Krt5Keratin 514.060.64−21.812.89 × 10−2
C1ql2Complement component 14.940.68−7.089.20 × 10−3
Rit2Ras-like without CAAX 23.510.52−6.664.24 × 10−2
Zfp804aZinc finger protein 804A2.420.37−6.322.22 × 10−2
Col6a3Collagen, type VI, alpha 336.995.97−6.193.91 × 10−3
Spc25SPC2514.502.88−5.022.14 × 10−3
Map2k3osMitogen-activated protein kinase kinase 3, opposite strand4.040.77−5.012.89 × 10−2
Rab7bRAB7B, member Ras oncogene family4.881.01−4.792.22 × 10−2
Galnt13Polypeptide N-acetylgalactosaminyltransferase132.760.64−4.252.22 × 10−2
Table 6. Egr1KO LECs express elevated levels of genes that encode zonule associated proteins at 6 h PCS.
Gene Code.Gene NameWild Type
6 h FPKM
Egr1KO
6 h FPKM
Fold ChangeFDR
Fbn2Fibrillin 20.602.654.422.60 × 10−3
Fbn1Fibrillin 18.2730.343.671.55 × 10−2
Col18a1Collagen, type XVIII, alpha 121.0971.663.402.79 × 10−2
Ltbp2Latent transforming growth factor beta binding protein 26.5421.563.302.70 × 10−2
Ltbp1Latent transforming growth factor beta binding protein 16.5417.412.665.22 × 10−3
Table 7. Top most upregulated DEGs in FosBcKO LECs at 6 h PCS.
Gene CodeGene NameWild Type 6 h FPKMFosBcKO 6 h FPKMFold ChangeFDR
Dio3Deiodinase, iodothyronine type III0.3910.7527.004.19 × 10−24
Pebp4Phosphatidylethanolamine binding protein 40.144.1126.884.75 × 10−12
Clec14aC-type lectin domain family 14, member a0.092.4824.752.60 × 10−8
Edn3Endothelin 30.223.7617.001.78 × 10−8
Foxi3Forkhead box i30.8312.4614.801.39 × 10−10
Kcnj13Potassium inwardly rectifying channel, subfamily J, member 130.7411.1314.746.61 × 10−8
Defb9Defensin beta 90.8012.0214.462.14 × 10−7
Fbn2Fibrillin 20.618.8114.273.60 × 10−14
Dsg2Desmoglein 20.365.0713.786.46 × 10−24
Gpx3Glutathione peroxidase 355.77735.9013.191.38 × 10−14
Table 8. Top most downregulated DEGs in FosBcKO LECs at 6 h PCS.
Gene CodeGene NameWild Type 6 h FPKMFosBcKO 6 h FPKMFold ChangeFDR
Slc29a4Solute carrier family 296.890.87−7.862.95 × 10−4
Sox30SRY box 303.170.43−7.241.17 × 10−3
Gjb3Gap junction protein, beta 34.370.62−7.062.73 × 10−2
Cdcp3CUB domain containing protein 38.711.60−5.431.54 × 10−8
Gjb4Gap junction protein, beta 48.021.52−5.293.36 × 10−3
H1f8H1.8 linker histone35.696.96−5.131.18 × 10−3
CdsnCorneodesmosin3.160.75−4.211.12 × 10−4
Alpk2Alpha-kinase 23.240.78−4.165.48 × 10−3
Asb5Ankyrin repeat and SOCs box-containing 56.021.45−4.165.48 × 10−3
Cd109CD109 antigen4.251.06−4.011.71 × 10−2
Table 9. Genes encoding zonule components that are upregulated in FosBcKO LECs at 6 h PCS compared to wildtype.
Gene CodeGene NameWild Type
6 h FPKM
FosBcKO
6 h FPKM
Fold ChangeFDR
Fbn2Fibrillin 20.618.8114.273.60 × 10−14
Fbn1Fibrillin 18.52105.4612.386.38 × 10−11
Col18a1Collagen, type XVIII, alpha 121.68233.5310.771.43 × 10−9
Ltbp2Latent transforming growth factor beta binding protein 26.7272.0410.712.55 × 10−10
Nid2Nidogen 21.5916.9010.584.08 × 10−10
Efemp1Epidermal growth factor-containing fibulin-like extracellular matrix protein 1 18.34135.347.374.46 × 10−12
PrelpProline arginine-rich end leucine-rich repeat14.4483.965.813.11 × 10−11
Col9a2Collagen, type IX, alpha 26.4134.695.411.78 × 10−8
Hmcn1Hemicentin 10.954.204.411.09 × 10−10
Ltbp1Latent transforming growth factor beta binding protein 1 6.7524.793.671.32 × 10−10
MegfMultiple EGF-like domains 61.274.393.454.86 × 10−5
Loxl1Lysyl oxidase-like 126.1264.472.476.21 × 10−4
Ltbp3Latent transforming growth factor beta binding protein 323.9052.782.211.58 × 10−4
CtsdCathepsin D31.8470.162.204.60 × 10−5
Timp3Tissue inhibitor of metalloproteinase 394.83198.212.091.40 × 10−2
Tgfb3Transforming growth factor, beta 32.835.742.031.21 × 10−2
AgrnAgrin8.3716.962.031.42 × 10−3
Publisher’s Note: MDPI stays neutral with regard to jurisdictional claims in published maps and institutional affiliations.

