Review

Assaying Microglia Functions In Vitro

UK Dementia Research Institute (UK DRI), School of Medicine, Cardiff University, Cardiff CF10 3AT, UK
*
Author to whom correspondence should be addressed.
Cells 2022, 11(21), 3414; https://doi.org/10.3390/cells11213414
Submission received: 7 October 2022 / Revised: 20 October 2022 / Accepted: 25 October 2022 / Published: 28 October 2022
(This article belongs to the Special Issue Pluripotent Stem Cells for Disease Modelling)

Abstract

:
Microglia, the main immune modulators of the central nervous system, have key roles in both the developing and adult brain. These functions include shaping healthy neuronal networks, carrying out immune surveillance, mediating inflammatory responses, and disposing of unwanted material. A wide variety of pathological conditions present with microglia dysregulation, highlighting the importance of these cells in both normal brain function and disease. Studies into microglial function in the context of both health and disease thus have the potential to provide tremendous insight across a broad range of research areas. In vitro culture of microglia, using primary cells, cell lines, or induced pluripotent stem cell derived microglia, allows researchers to generate reproducible, robust, and quantifiable data regarding microglia function. A broad range of assays have been successfully developed and optimised for characterizing microglial morphology, mediation of inflammation, endocytosis, phagocytosis, chemotaxis and random motility, and mediation of immunometabolism. This review describes the main functions of microglia, compares existing protocols for measuring these functions in vitro, and highlights common pitfalls and future areas for development. We aim to provide a comprehensive methodological guide for researchers planning to characterise microglial functions within a range of contexts and in vitro models.

Graphical Abstract

1. Introduction

Microglia are brain-resident macrophages and act as the main immune modulator cells of the central nervous system (CNS). In the healthy adult brain they are formed with a small cell body and numerous branched processes or ramifications (Sierra et al., 2016). Microglia, which make up ~0.5–16.6% of the total cell population in the human brain [1], display a great deal of heterogeneity in vivo regarding age, sex, and location within the CNS. This includes variation in cell density, morphology, and function [1,2,3]. These cells, previously thought to be largely quiescent within the healthy adult brain, are now known to have complex roles during both development and in maintaining normal brain homeostasis [4]. Microglia are highly versatile, with the ability to rapidly adapt both their morphology and function in response to environmental cues [5].
During development, microglia have key roles in shaping healthy neuronal networks [6]. This includes secreting factors important for neurogenesis [7], promoting oligodendrocyte survival and differentiation [8,9], initiating programmed cell death of neurons and neuronal precursors [10,11,12,13], engulfing synapses [14,15,16], as well as promoting axonal fasciculation and limiting axon outgrowth [17,18]. Within the adult brain, microglia continue to control neurogenesis and modulate neuronal activity, while also carrying out immune surveillance, mediating inflammatory responses, and disposing of unwanted material [6,19].
In vitro microglia cultures provide an incredibly valuable tool to study the functions of these cells, both in the context of health and disease. In vitro models of microglia can be broadly categorised as immortalised microglial cell lines, primary isolated cell cultures from either rodents, macaque or humans, and induced pluripotent stem cell (iPSC) derived microglia-like cells. Each model has advantages and disadvantages, and none successfully recapitulates all characteristics of adult human homeostatic microglia, as is reviewed elsewhere [20,21]. In brief, in vitro microglia appear more “activated”, secreting a greater number of cytokines when compared with their in vivo counterparts. Furthermore, the transcriptomic signature of in vitro microglia differs significantly from in vivo models. These changes likely arise following a lack of signalling between microglia and other CNS cells, which helps microglia retain a more “homeostatic” phenotype [22,23]. Choosing a cell model for functional assays should be informed by the research questions and availability of equipment and expertise.

2. Markers for Microglia

The expression profile of microglia is shaped by the local micro-environment and their unique ontogeny. Although they are considered the ‘macrophages of the CNS’, microglia originate from precursors of the primitive yolk sac via PU.1, IRF8 and CSF1R dependent pathways [24,25]. Commonly microglia are characterised using techniques such as RT-qPCR, flow cytometry or immunofluorescence with a range of validated markers which include; IBA1, CD11B, CD45, CD14, CX3CR1, GPR34, MERTK, C1Q, TREM2, SALL1, GLUT5, GAS6, CD68, TMEM119 and P2RY12, which are summarised in Table 1 [26,27,28]. Although these markers are useful in confirming microglia phenotype, they have also shown to be expressed by macrophages with the exception of TMEM119. This is vital in helping to differentiate microglia from macrophages, and subsequently TMEM119 is unique to microglia in the healthy CNS. Despite this, TMEM119 has been shown to be present on some non-CNS cells such as follicular dendritic cells of the spleen and tonsils. Additional popular microglia markers include IBA-1 and P2RY12. Both of these markers are expressed by microglia and macrophages, with expression of P2RY12 on macrophages shown to be much lower than microglia expression [29]. This indicates that neither of these markers can be used to distinguish between microglia and macrophages [30]. Regardless, IBA-1 is of this IBA-1 is useful for visualizing microglia morphology, as staining extends through the slender protrusions of ramified microglia [31]. Furthermore, IBA-1 expression has been shown to be upregulated during phagocytosis and migration processes due to its interaction with actin, which has led it to be considered a good marker for the initial stages of inflammatory microglia activation [32].
Further confirmation of microglia can be shown through the absence of certain markers. For instance, expression of CD206 is characteristic for periventricular macrophages, choroid plexus macrophages and meningeal macrophages, but not microglia, allowing the cell types to be distinguished from one another [25]. Relative quantification of markers can also be useful in confirming cell phenotype. Most notable is CD45 expression, in which perivascular and infiltrating macrophages show high expression while microglia expression is low [33]. However, expression of CD45 on microglia has been shown to increase in models of inflammation and ageing [34]. Indeed, microglia are highly reactive cells constantly surveying for changes in the micro-environment. Upon detection of a stimulus microglia undergo phenotypic changes that can be characterised using various markers. Most commonly, lysosomal marker CD68 is used to detect phagocytic activity [35]. Other markers including IBA1, CD14, CD45, CD11B and CX3CR1 have been shown to be upregulated in various microglia inflammatory models [36,37]. Contrary to this, slight reductions in TMEM119 and P2RY12 mRNA have been noted in pro-inflammatory microglia [30,38].
It is important to be wary of some marker discrepancies across microglia models, some key changes have been summarised in Table 1. Although no single marker has shown to be exclusively expressed by microglia, multiple proteins are useful in the confirmation of microglia phenotype, most commonly used TMEM119 and P2RY12.

3. Morphology

Microglial morphology, first described in pioneering research by Pío del Río-Hortega in 1919 [57], is incredibly fluid, with microglia constantly altering their structure in response to external stimuli [58]. Microglia structure and function are tightly coupled, with structural changes likely rendering microglia more efficient at carrying out whichever action is required [58]. Within the healthy, adult CNS, “homeostatic” microglia present with small round cell bodies surrounded by extensive, branching processes. This morphology is known as ramified, and microglia use their long processes or ramifications to continuously survey their immediate environment [4]. Upon detection of an insult (e.g., damaged synapse, misfolded protein) microglia retract their processes and take on a more amoeboid shape, indicative of “activation”. This “activated” state is accompanied by proinflammatory cytokine secretion and increased phagocytic activity [5]. Microglia morphology can be seen to change drastically during both physiological and pathological ageing, as well as in response to a variety of different neurological conditions [58,59].
Histological staining with various markers can accurately delineate the cytoplasm and processes of microglia, with confocal microscopy often used to obtain high quality Z-stack images of these cells. While both fluorescence and 3,3′-diaminobenzidine can be used to obtain images, fluorescence staining often allows for superior visualization of microglial processes, and is therefore preferred [60]. Fluorescence staining for microglia area often incorporates antibodies against IBA1, although other markers that accurately highlight cell structures can also be used [60].
Having obtained a clear image highlighting microglial structure, a variety of image analysis software can be used to perform semi-automated quantification of morphological characteristics. While in vitro monocultured microglia morphology can be quantified using either 2D or 3D images, 3D analysis reduces the likelihood of cell structure misrepresentation. Imaris is one such software [61]. Using Imaris (Oxford Instruments), microglial surfaces can be reconstructed in 3D from Z-stack images prior to quantification of various morphological characteristics (including cell surface area and volume) [62]. Sholl analysis, which provides a measure describing how ramified the microglia are, can also be performed using Imaris filament reconstruction mode [62]. While incredibly useful when characterising microglial morphology, Imaris is unfortunately a paid software and therefore may not be accessible to all researchers. Image J, a free alternative software, can also be used to characterise microglial structure. Several image J plugins exist which can be used to measure and describe microglial morphology according to metrics such as degree of ramification, cell complexity and cell shape [60]. Sholl analysis can also be performed using Image J [63]. However, when comparing Imaris against several ImageJ analysis pipelines to analyse dendrites within Drosophila models, Imaris appeared to generate data most comparable to that obtained with manual tracing [64]. In addition to these widely used software’s, other scripts exist freely online to quantify microglial morphology, although they may require more advanced programming skills [65,66,67,68,69].
To conclude, an understanding of microglial morphology can act as a powerful tool when looking to understand the biology of these cells, and a variety of different semi-automated software exist to aid morphological quantification. However, researchers should be careful not to infer function from morphology, particularly as microglial morphology is highly diverse and transient [70]. Furthermore, it should be noted that isolated microglia never achieve the morphological complexity of microglia observed in situ [20].

4. Neuroinflammation

4.1. Overview of Neuroinflammation

Microglia are the major mediators of the inflammatory response in the CNS. Neuroinflammation is initiated following binding of either damage-associated molecular patterns (DAMPs), pathogen-associated molecular patterns (PAMPs), or neurodegeneration-associated molecular patterns (NAMPs) by pattern-recognition receptors (PRRs) on microglia [71,72]. PRRs include but are not limited to Toll-like receptors (TLRs) and inflammasome-forming nucleotide binding oligomerization domain (nod)-like receptors (NLRs) [71]. TLR activation results in NFκB translocation to the nucleus and pro-inflammatory gene expression [73]. NLR receptor binding ultimately leads to formation of the cytosolic multiprotein inflammasome complex, and the production and release of inflammatory cytokines IL-1β and IL-18 [74,75]. Within the large family of NLR receptors, NLRP3, which can be activated by both DAMPs and PAMPs, is most highly expressed on microglia [76].
In brief, binding of ligands to pro-inflammatory PRRs on microglia results in the release of numerous mediators of the inflammatory response including cytokines (e.g., TNF-α, IL-6), chemokines (e.g., MCP-1, RANTES), nitric oxide synthase (NOS2) and reactive oxygen species (ROS) [71]. Following a pro-inflammatory response to stimulus, e.g., bacterial infection, immune resolution is usually achieved by microglia releasing anti-inflammatory cytokines (e.g., TGF-β and IL-10) that inhibit proinflammatory cytokine release and promote tissue regeneration [77]. While the initial pro-inflammatory response is crucial to defend the brain following insult or injury; chronic, sustained pro-inflammatory responses can exacerbate damage, and is a characteristic feature of several diseases [78]. ‘Activation states’, or profiles of microglia gene/protein expression, are highly context-dependent, model-dependent, and disease-dependent. Transcriptomics and proteomic profiling have shown us that there are not just two or three possible activation states, but instead innumerable distinct activation states [79,80].

4.2. Stimuli Used in Neuroinflammation Assays

Several stimuli are utilised by researchers in order to induce an inflammatory response prior to characterization. The most well-studied microglial activator in vitro is the bacterial cell wall component lipopolysaccharide (LPS), which acts via TLR4, and is suggested to induce a pro-inflammatory phenotype [81]. However, as most CNS insults to which microglia respond will not be driven by bacterial infection, LPS cannot be considered the most relevant stimuli when examining effects of either neurodegenerative disease, healthy aging, or many other conditions. For this reason, more endogenous pro-inflammatory mediators such as IFNγ plus TNF-α, are being increasingly utilised to study microglial activation [81]. Activation of inflammasome formation via NLRP3 is a two-step process. First, cells are usually primed by using a TLR agonist (e.g., LPS) followed by treatment with an activator (e.g., ATP, nigericin) to complete activation [82,83].

4.3. Functional Assays for Microglia-Mediated Neuroinflammation

To assess cytokine or chemokines secreted by microglia in vitro, it is common to collect conditioned cell media to perform assays. A summary of the different techniques used to quantify cytokine release from microglia, as well as pros and cons of each technique, is presented in Table 2. The most commonly used methods to quantify cytokine and chemokines are traditional antibody sandwich enzyme-linked immunosorbent assays (ELISAs) and multiplex arrays [84]. Multiplex arrays allow detection of multiple cytokines and chemokines simultaneously within a single sample. They are usually either chemiluminescence, electrochemiluminescence or bead-based [84]. Chemiluminescence and electrochemiluminescence multiplex assays consist of multiple specific capture antibodies at multiple spots (one antibody per spot), which can then be used to detect multiple cytokines in the same sample at the corresponding spots. With bead-based assays, separate capture antibodies are conjugated to bead sets and multiplexed. A graphical summary further explaining how these assays work can be seen in Figure 1.
ROS and nitric oxide, other key mediators of the microglial inflammatory response, can be measured using several easy to use, relatively cheap, commercially available kits [81,85,86]. These kits provide only limited information, detecting specific radical species such as O2−. For more in depth analysis, spin trap techniques and Electronic Paramagnetic Resonance (EPR) spectroscopy can be used. However, EPR spectroscopy is an expensive and highly specialised technique, thus limiting its use in many lab settings [87].
To conclude, when performing in vitro assays for neuroinflammatory effects of microglia, a variety of assays exist that focus on different types of inflammatory effects. Key considerations include choosing the most appropriate stimulus for the research question. The most commonly used stimulus, LPS, may be considered less-physiologically relevant when attempting to model non-bacterial driven neuroinflammation. Furthermore, choosing a relevant stimulus concentration and exposure time can be difficult, due to a lack of consensus in the literature. Future studies comparing the inflammatory reactions of microglia to different immune-relevant stimuli would help the field identify the most physiological stimulus, concentration, and exposure conditions.

5. Endocytosis

5.1. Overview of Endocytosis

The endocytic pathway is required for effective sorting and recycling of cellular components and is the mechanism by which cells internalise external or plasma membrane bound cargos. However, the role and impact of the endocytic pathway is far more wide reaching. Like all cells microglia require efficient endocytosis and employ it in the internalisation of nutrients, antigen presentation, motility, lipid homeostasis, synapse pruning and membrane receptor regulation [88,89]. One of the main roles microglia perform is phagocytosis, a specialised form of endocytosis, and this cargo internalised via phagocytosis requires sorting via endocytic compartments.
Endocytosis can be split into clathrin mediated endocytosis (CME), macropinocytosis and phagocytosis (Figure 2). Each pathway internalises different cargoes and uses distinct molecular regulators. CME, first discovered over 50 years ago [90], allows the internalisation of particles between 60–120 nm in diameter and requires clathrin, dynamin and endophilin as key regulating proteins [91]. Macropinocytosis, first observed in 1931 [92], enables cells including microglia to enclose and ingest large volumes of extracellular medium in a nonselective manner, therefore taking in nutrients and exogenous antigens, and is important in antigen presentation [93,94]. This process is actin-dependent and allows cargo of over 200 nm in diameter to enter the cell [95]. Finally, phagocytosis is used by microglia to uptake foreign particles in large vesicles that can be greater than 500 nm in diameter [96,97]. Microglial phagocytosis will be discussed in more detail in Section 6.
Once cargoes are internalised, they are then shuttled to the early endosome to begin the intracellular trafficking process. Cargo can then be passed onto either the sorting endosome, where cargoes can be recycled back to the plasma membrane, or to the late endosome, which marks cargos for eventual degradation.

5.2. Functional Assays for Endocytosis

Microglia, like other cell types, can be assessed for endosomal network properties such as number of early/late/recycling endosomes, cellular positioning of endosomes and size of different endosomal compartments using immunocytochemistry or electron microscopy [98,99,100,101,102]. Endosomal network changes can be indicative of endosomal traffic jams or improper sorting [103,104]. Commonly used markers of the early endosome include EEA1 and RAB5, whereas the recycling endosome is marked by RAB11 and the late endosome RAB7 [105]. To give a more dynamic assessment of these processes, fluorescently tagged constructs of these markers have been employed to mark and watch endosomal populations in real time [106]. One consideration when studying microglia is the ability to effectively transfect or transduce them in order to allow expression of such constructs given their phagocytic nature [107,108].
Endocytosis is a dynamic process, and in vitro studies can take advantage of this through the use of live imaging to quantify uptake and turnover of specific cargoes over time. Such cargos can be used to distinguish different forms of endocytosis. For example, CME can be investigated using transferrin or epidermal growth factor labelled with pHrodo or permanent fluorescent dyes, using similar methodology to phagocytosis assays, as will be discussed in more detail later [98,109,110,111,112]. An advantage of using pHrodo labelled bioparticles is that they will only fluoresce in acidic compartments which therefore reduces background fluorescence and indicates inclusion in endosomes. Whereas methods for assessing phagocytosis, as described in Section 6, and CME by cargo specificity is relatively straight forward measuring macropinocytosis is more difficult. Dextrans can be used to help differentiate macropinocytosis only if very large dextrans (2,000,000 Da) are used, concentrations are titered carefully, and limits are set on the size of endocytic structure included in analysis [93,95,113]. Smaller dextran particles can be used to investigate CME. For all endocytic uptake assays, careful consideration of controls should be employed to ensure that the endocytic uptake mechanism is as expected. For example, dynasore or pitstop 2 can be used to block CME by blocking the GTPase activity of dynamin and interfering with clathrin terminal domain, respectively [95,114,115]. Cytochalasin D can be used to depolymerise F-actin and can therefore inhibit both micropinocytosis and phagocytosis, and Amiloride can be used to block macropinocytosis through inhibition of Na+/H+ exchange [116,117].
In neurodegenerative diseases such as Alzheimer’s and Parkinson’s Disease, microglia endocytose specific misfolded proteins such as β-amyloid, tau, and α-synuclein [118,119,120,121]. These aggregated proteins may be prepared as small oligomeric species associated with greatest cytotoxicity [122], or they may be fibrillised into large insoluble fibrillar aggregates, which are associated with characteristic histological pathologies [123]. Such proteins of interest can be labelled with fluorescent tags and uptake quantified through imaging. However, caution should be used when labelling these preparations and proper characterisation of aggregates should be undertaken as it is likely that this alters their folding capabilities. Another consideration when doing such experiments is the form of the aggregate-prone protein assembly that the microglia are exposed to, i.e., monomeric, oligomeric or fibrillar, as this will affect both the mode of uptake and the microglia phenotypic response [118,124,125]. Uptake of β-amyloid and tau oligomers is by clathrin-mediated endocytosis and macropinocytosis [126], as these assemblies have been shown experimentally to be 10–50 nm diameter [127,128]. Large fibrillar aggregates of β-amyloid are phagocytosed by microglia, and can be assayed using fluorescent-labelled recombinant fibrils [123,126]. Phagocytosis is discussed in detail in Section 6.
In conclusion, it is possible to investigate the different endocytic pathways through the careful choice of cargo ensuring the correct size for the pathway of interest. This should always be coupled with control compounds, e.g., dynasore to further validate results. Where aggregate-prone proteins such as β-amyloid are used for endocytic uptake experiments, they require full characterisation so that the experimenter is certain of the species being used, as this will impact the pathway of uptake.

6. Phagocytosis

6.1. Overview of Phagocytosis

Phagocytosis is an important function of microglia during development and disease. Phagocytosis is defined as the recognition and ingestion of particles larger than 0.5 µm [129]. Microglia are professional phagocytes and can quickly and efficiently clear up apoptotic cells, cell and myelin debris, aggregated proteins, invading micro-organisms, and complement-tagged synapses of live neurons [130]. The process of phagocytosis is initiated by recognition of the target ‘cargo’ by microglia phagocytic receptors. There is a diverse array of phagocytic receptors, and each selectively recognises a specific molecular pattern on a microorganism or apoptotic cell, or an opsonin molecule coating the target (e.g., IgG, C1q) [129]. Phagocytosis receptors become active only when several cluster together within the plane of the membrane, due to engagement with the target, and this triggers a cascade of intracellular signalling that result in re-organization of the actin cytoskeleton to protrude the plasma membrane around the cargo in a ‘phagocytic cup’ structure or ‘pseudopod’ [129]. The phagocytic cup grows until the leading edges fuse together to fully engulf and internalise the cargo into a ’phagosome’ [131]. The phagosome matures by a sequence of fusion and fission events with early and late endosome, causing increasing acidification of the compartment and the recycling of receptors back to the plasma membrane [131]. Lysosomes fuse with the phagosome to enable the cargo to be degraded by lysosomal hydrolases, and then degradation products are released directly into the cytosol, or secreted into the extracellular space within exosomes [130]. The biology of phagocytosis is reviewed elsewhere in more detail [129,130,131]. Phagocytosis can be assayed in vitro by adding a fluorescent-labelled substrate or “cargo” to the microglia cell culture model, and allowing the cells to engulf the material at 37 °C for a period of time. An end-point assay may be performed at a single time-point, or the phagocytosis events may be detected in the live cells at multiple time-points to allow the real-time kinetics to be studied. Table 3 compares the different types of detection instrument that can used, including references for example assays. An overview of phagocytosis, as well as different phagocytic cargos that can be used in assays, is shown in Figure 2.

6.2. Cargo Used in Microglia Phagocytosis Assays

Phagocytosis of different cargo can result in different phenotypic outcomes for the microglia. For example, phagocytosis of bacteria generally leads to pro-inflammatory activation and slow degradation that allows antigens to be preserved for presentation, conversely recognition of apoptotic cells suppresses inflammation and cargo is rapidly degraded [131]. Phenotypic outcomes of phagocytosis may be mainly mediated by phagocytic receptor-mediated signalling [129]. Therefore, cargo-specificity is an important consideration for designing a strategy to experimentally interrogate phagocytosis. Researchers that wish to largely avoid cargo-specific responses may turn to polystyrene or latex beads [132], although the receptors involved with unopsonised bead uptake have not been characterised. Often the use of several cargoes is informative. For example, one study determined that TREM2 missense mutations impaired microglia phagocytosis of apoptotic cells but not E. coli or Zymosan (a yeast cell wall glucan) [133].
E. coli and Zymosan bioparticles are popularly used for phagocytosis studies due to their being commercially available conjugated to a pH-sensitive dye, offering convenience and homogeneity. E. coli is recognised by scavenger receptors such as BAI1 and MARCO, and PRRs such as CD14 and SR-A, whereas Zymosan is primarily recognised by Dectin-1 (CLEC7A) receptors [129]. Zymosan bioparticles are large (approx. 4 μm), enabling easy study of the co-localization of phagosome-associated proteins [134]. The main disadvantage of these cargo is that they are pathogens, and therefore of limited physiological relevance to the study of development and neurodegeneration.
Microglial phagocytosis of apoptotic cells, also known as “efferocytosis”, is important in both development and disease. Apoptotic cells universally expose a phosphatidylserine “eat-me” signal, recognised directly by TREM2 and GPR56 receptors, and indirectly (with specific opsonins) by other microglial receptors including MERTK, MEGF10, αVβ3/5 integrin, LRP1, and complement receptors [135]. A simple model of efferocytosis involves measuring the uptake of carboxylate microbeads, which are believed to bind the same receptors as phosphatidylserine due to the negative charge [136]. Various models of apoptotic neurons have been developed for phagocytosis assays using neuronal cancer cell lines: human SH-SY5Y, murine Neuro-2a and rat PC12 cells. These were killed by protocols including UV-irradiation [137], paraformaldehyde [138], staurosporine [139], okadaic acid [140], or oxygen-glucose deprivation [141].
Myelin debris is also cleared by microglia via phagocytosis. Microglial receptors for myelin include MERTK, AXL and TREM2 [142], and complement-opsonised myelin is recognised by CR3 and SR-A [143]. Myelin debris can be purified by sucrose gradient fractionation of mouse or human homogenised brain tissue, labelled with a fluorescent dye, and applied to microglia cell cultures [144,145].
Microglia phagocytose the presynaptic terminals of viable neurons in a process known as “synaptic pruning”, which is normally highly active during development to refine neuronal circuits, and appears to be reactivated in multiple models of neurological disease [146,147]. Synapse phagocytosis is often assayed in vitro by preparing fluorescent labelled synaptosomes and synaptoneurosomes, and presenting to microglia as cargo. Synaptosomes are resealed presynaptic terminals, which are pinched off during homogenization of neurons and retain some functionality. A small proportion remain attached to a resealed postsynaptic terminal, these are referred to as synaptoneurosomes [148]. Synaptosomes and synaptoneurosomes can be obtained from homogenised rodent brain, human post-mortem brain tissue, or iPSC-derived cortical neurons, and enriched by Percoll or sucrose density gradient fractionation [123,138,149,150]. However, a disadvantage of this method is that no prep is pure, there will be significant contamination with lysed cell membranes, some myelin debris and mitochondria [148]. Therefore, it is questionable whether microglia respond to synaptosome preparations similarly to intact neurons.

6.3. General Considerations for Phagocytosis Assay Development

Other important considerations for phagocytosis assay development include the duration of phagocytosis (if not using a kinetic assay) and the ratio of cargo particles to microglia. Phagocytosis needs to be captured at a point in time where the rate of phagocytic uptake is constant, and the signal has not yet reached saturation, this should be determined experimentally by testing multiple cargo doses and incubation times. Saturation occurs when additional uptake of particles contributes to a weaker increase in fluorescence signal, so will be affected by instrument sensitivity, resolution and dynamic range [154]. Saturation will be achieved more rapidly if the ratio of cargo particles to microglia is high, and cargo particles are small [155]. Other factors that affect the phagocytic capability of the in vitro microglia cell model should also be considered and controlled, such as the inclusion or exclusion of serum from the media [153], and the duration of in vitro culture prior to assaying [156]. Appropriate negative controls should be used to determine the amount of specific phagocytosis measured versus background signal. Pre-incubating the cells with actin cytoskeleton inhibitor cytochalasin D and maintaining it in the media should inhibit phagocytosis by approximately 90% [138].
The accuracy and reproducibility of the data can be improved by sampling more cell events or capturing more image fields. However, if live cells are measured then increasing the sampling could lead to unacceptably long delay in data capture. Therefore, sampling depth needs to be balanced by speed. Instruments with higher levels of automation can improve processing speed and additionally have the benefit of reducing operator bias. Image-based methods with the ability to resolve intracellular structures (recommend 40X magnification or higher) allow for more phagocytosis parameters to be measured, which can improve detection accuracy.
Finally, consideration should be given to the choice of fluorescent labels in the assay. To allow intracellular events to be detected, the microglial cells are usually stained with a fluorescent chemical or lectin dye to highlight the whole cell body, or else they are fluorescently labelled with an antibody for a microglia-specific marker after phagocytosis has occurred. For high-content imaging, microglia staining is particularly important to ensure that cells are ‘segmented’ accurately in the automated image analysis pipeline. Furthermore, cargo can be labelled prior to phagocytosis with a permanently fluorescent dye (e.g., Alexa Fluor-488) or a pH-sensitive dye (e.g., pHrodo iFL Red). pH-sensitive dyes are weakly fluorescent at neutral pH and increase their fluorescence with reduced pH, such as occurs with phagosome acidification [157]. This can improve discrimination of phagocytosed cargo from external membrane-bound cargo, however the user needs to be aware that defective phagosome acidification can affect the signal of a pH-sensitive dye, in addition to the mechanics of phagocytic uptake. This phenomenon can be exploited by co-labelling cargo with pHrodo Red and Alexa Fluor488 in order to assay phagosomal pH [158]. Permanently fluorescent dyes are not altered by endosome acidification, therefore distinguishing between external bound particles and phagocytosed particles is more challenging. This can be aided by the addition of trypan blue to quench extracellular fluorescence [159].
To conclude, phagocytosis assays can provide important insights into the effect of chemical or genetic manipulations upon microglia function. Phagocytic cargo should be chosen carefully with the intended biological question in mind, and ideally several types should be tested. Flow cytometry and imaging readouts are commonly used, and robust data can be obtained from relatively inexpensive equipment if the assay is carefully optimised. However, high-content imaging is advantageous when the perturbation of phagocytosis is expected to be subtle, because it more accurately quantifies the amount of phagocytosed material per cell.

7. Chemotaxis and Random Mobility

7.1. Overview of Chemotaxis and Random Mobility

Microglia are highly dynamic cells that are constantly in motion. In their resting state, healthy microglia extend and retract their processes constantly to survey their local neuronal network, whilst largely retaining their cell body in the same position and maintaining distance from other microglia [4]. This “surveillance behaviour” is a form of undirected motility and governed by mechanisms independent from chemotaxis [160]. Chemotaxis is a specific form of directed motility whereby cells move towards or extend their processes towards the emitter of a secreted chemoattractant molecule, up a concentration gradient. The term is often used to more broadly encompass all forms of directional migration [161], and will be used interchangeably with directional migration here. Brain lesions caused by trauma, infection, or neurodegenerative disease result in the localised production of chemoattractants CCL21 and CX3CL1 by neurons and astrocytes, and MCP-1/CCL2 and SDF-1α/CXCL12 by activated microglia adjacent to the lesion [162]. Microglia in the vicinity of the damaged region initially just extend their processes towards these signals, and over a period of many hours some microglia cell bodies migrate to the injury site, with the aim of containing and clearing the damage [4,163]. Damaged cells also release purines such as ATP, ADP and UDP, which strongly promote microglia motility but cannot be strictly considered as chemoattractants because their effect is not directional, they only increase the speed of movement (in any direction), which is known as chemokinesis [164].

7.2. Functional Assays for Chemotaxis
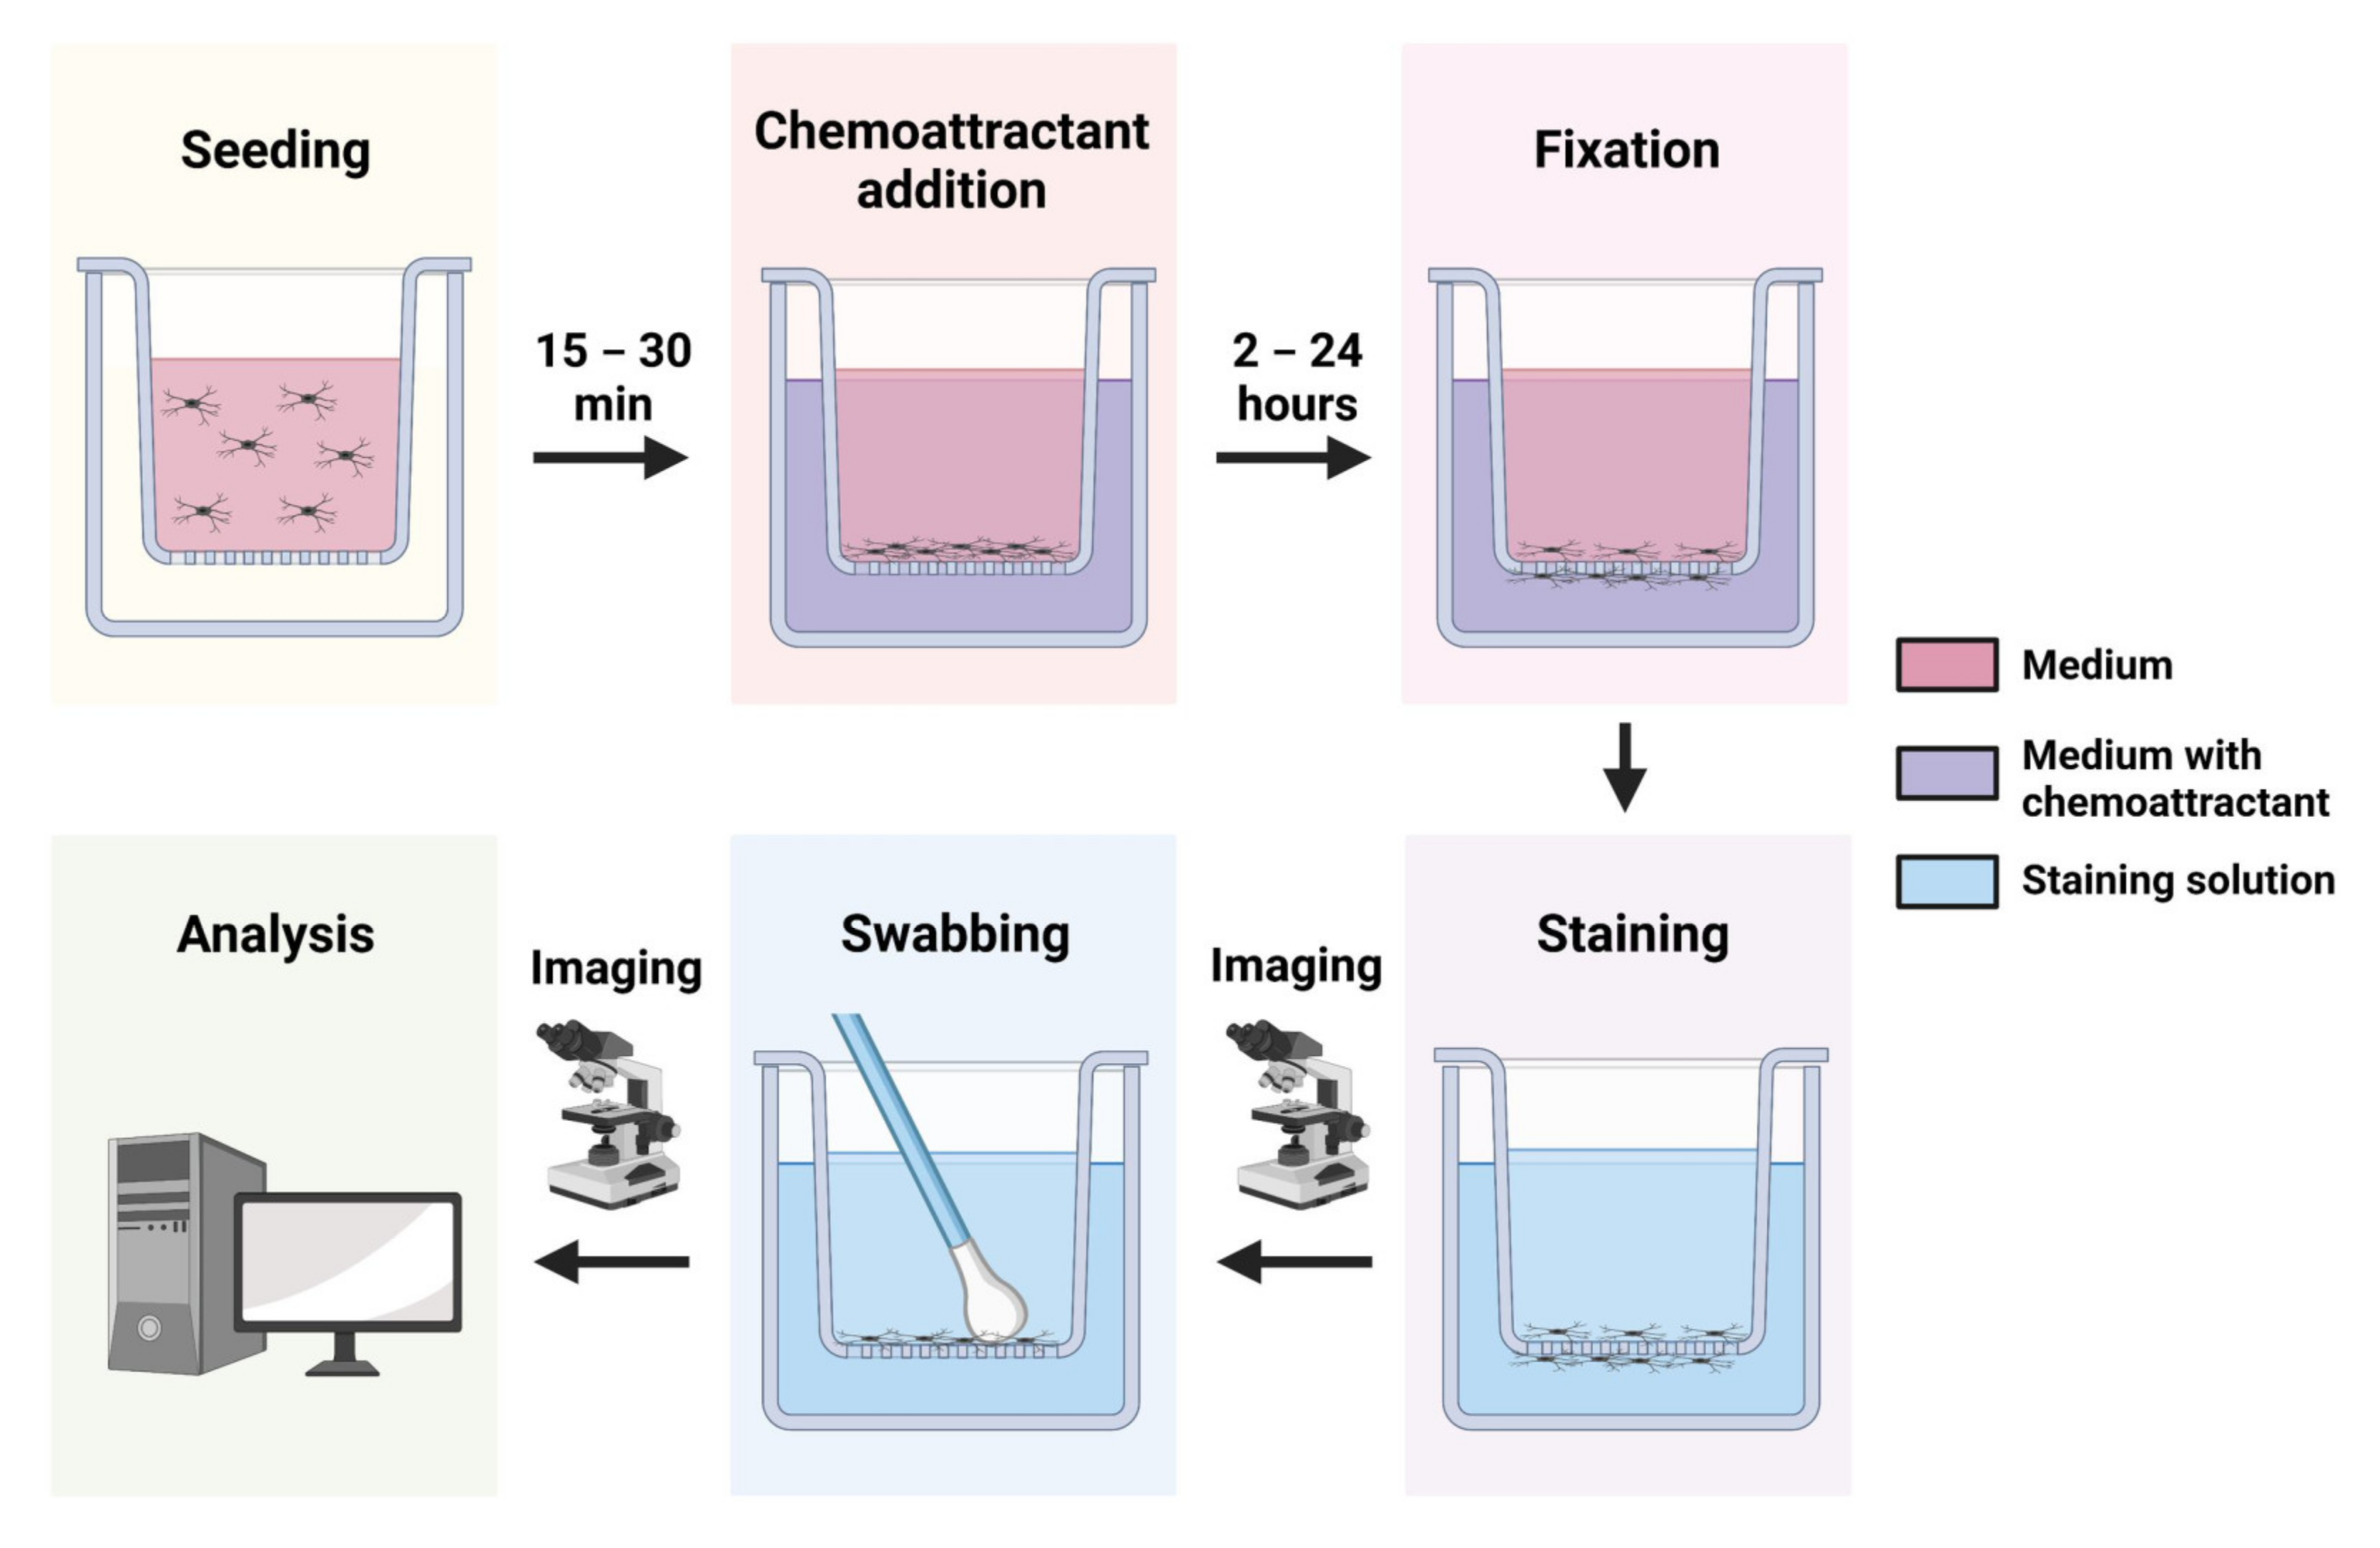
Methods of assaying macrophage chemotaxis in vitro have been reviewed extensively elsewhere, and would apply to microglia [161,165]. Here, we will focus on the chemotaxis assay most commonly used in microglia research: transwell assays. Other methods such as the Dunn chemotaxis assay [166] and microfluidics [167] have been used on microglia and are also worth considering. These are excellent methods for assessing chemotaxis and distinguishing chemotaxis from other types of cell motility, but have the limitation of being very low-throughput, only allowing one or two conditions to be tested [161,165]. True microfluidic set-ups are also custom-made for each experiment, and require access to 3D-printing equipment [165].

Transwell Assays

Transwell assays are adapted from the original Boyden chamber, which is a well containing chemoattractant solution, with cells placed in an insert with a porous membrane base that is in contact with the chemoattractant [165]. Due to the small size of the membrane pores, a steep chemoattractant gradient is maintained for hours, but the microglia are able to migrate through the pores and onto the underside of the insert. In a traditional fixed endpoint transwell assay (Figure 3—Transwell assay workflow), the cells are allowed to migrate for a set period of time and then fixed and stained with dyes for easy visualization, e.g., Hoechst [123] or crystal violet [166]. It is possible to monitor kinetics in specially modified 96-well plate transwell set-ups, such as the IncuCyte chemotaxis assay and the xCELLigence impendence assay [165,168].
In microglia literature the transwell assay is by far the most popular chemotaxis method. Mouse microglia migration towards ATP [166], ADP [166], CCL2 [169], CCL19 [140], CCL21 [140], Tau [170], and α-Synuclein [171] has been assayed by this method, amongst numerous other examples. Human microglia including iPSC models have also been tested, with ADP [123,138], C5a [138], and Aβ1-42 [172] as ‘chemoattractants’. The advantages of transwells are that they are the most scalable method currently available and can be performed in 96-well plates. Transwell assays are easy to use, simple to analyse, and require minimal optimization. However, the fixed endpoint assays do not provide kinetic information and have very limited throughput. Microglia are lifted from their culture plate immediately prior to the assay, which may alter their activation state and behaviour. Furthermore, it is not easy to reliably distinguish chemokinesis (increased non-directional motility) from chemotaxis with the transwell method. Researchers have tried to diagnose chemokinetic versus chemotactic behaviour via a ‘checkerboard analysis’, but this method is considered to be extremely flawed by some (as discussed in [161]). Therefore, to ascertain whether a molecule-of-interest is a true chemoattractant, it would be advisable to validate with a Dunn chemotaxis assay or under-agarose assay or microfluidic set-up.

7.3. Functional Assays for Random Motility

The undirected or ‘random’ motility of microglia is important for their homeostatic surveillance of the brain environment. Random motility employs similar downstream cytoskeletal effectors to chemotaxis, however the upstream signalling appears to be distinct, being P2Y12-independent [160]. Therefore, they are not a substitute for chemotaxis assays, but can provide complementary information about the effect of an intervention on microglia motility. Here, we consider two methods to study non-directional motility: direct imaging, and scratch assays/exclusion stamps.

7.3.1. Direct Imaging

Direct time-lapse imaging of cultures can be used to track the movements of individual cells and cell processes moving randomly in culture. Microglia are visualised with a fluorescence reporter or live-cell stain. Monocultures can be monitored, however microglia motility is blunted in the absence of neurons [173], so the method is more effective in vivo or with more complex in vitro models, e.g., co-cultures of microglia with neurons. Analysis of baseline process motility can be performed on binarised images with custom MATLAB scripts, essentially examining all process additions and process retractions of a microglia between pairs of consecutive time points [160,174]. More simple tracking of cell soma movements can be performed manually with ImageJ [173]. Alternatively, some image analysis software such as Imaris are capable of automated cell soma tracking and process detection, and has been used for in vivo and in vitro microglia [175,176]. The advantages of this technique is that it truly measures microglia surveillance behaviour with little disturbance, and the output can be rich in detail with many single-cell parameters measured. The limitations are that it requires automated time-lapse microscopy, and is data-intensive and time-consuming to analyse, even with good cell-tracking software.

7.3.2. Scratch Assays/Exclusion Stamps

Wound-healing scratch assays involve a fine linear scratch being drawn through a dense monolayer of cells in culture, and live imaging is used to monitor the width of the scratch as cells migrate into it, or the number of individual invading cells. Scratch assays may damage cells, but no chemotactic gradient is sustained in the well, therefore closure of the wound is governed by random motility [177]. Scratching of cultures is usually done with a plastic pipette tip and a steady hand, however more reproducible scratches in 96-well format can be achieved with an IncuCyte WoundMaker tool [176]. Exclusion stamps (e.g., iBidi, Oris) are a variation of the scratch assay method, where a silicon stamp is inserted into a well prior to cell plating, and removed after cell attachment has occurred, leaving a space for the cells to randomly migrate into [178]. The advantages of scratch and exclusion-stamp assays are that they do not require specialist equipment or software, can be adapted for high-throughput screening, and are an effective model of undirected migration in microglia monocultures, which are likely to be fairly static at equilibrium [177]. The main limitations are that a larger number of cells are needed relative to other methods, at a much higher density than is physiological, and several days of imaging are required [177].
In conclusion, microglia motility can be chemotactic–directed towards a stimulus–or random/undirected. Easy medium-throughput assays are available for measuring chemotaxis and random motility–transwells for the former, and scratch assays for the latter–but these have limitations that should be weighed up. A more detailed study of motility should include multiple complementary assays, and consideration given to the biological relevance of any stimuli. Kinetic information is particularly important for motility studies, therefore it is advantageous to use a good time-lapse imaging microscope with environmental control.

8. Microglial Immunometabolism

8.1. Overview of Microglial Immunometabolism

Microglia are highly plastic cells, displaying rapid physiological changes in response to a wide variety of external stimuli. Functionally, these changes include gross morphological changes, release of inflammatory and anti-inflammatory molecules, phagocytosis, endocytosis, chemotaxis and migration to sites of injury. Executing these processes requires energy from metabolism [179,180,181]. The dependence of immune functions on cellular metabolic pathways can be described using the term immunometabolism. Alongside changes in metabolism, activation of microglia can result in changes to mitochondrial structure, with LPS treatment shown to result in mitochondrial fragmentation, indicative of reduced OXPHOS [182,183,184].
Microglia are capable of generating energy via both glycolytic and oxidative metabolism [185,186]. These cells are able to perform rapid ‘immuno-metabolic switching’ from oxidative metabolism to glycolysis in order to meet a sudden increase in energy demand [179,181,187]. Oxidative phosphorylation (OXPHOS) involves shuttling of the pyruvate generated from glucose to mitochondria, where it is converted into acetyl coenzyme A, and enters the tricarboxylic acid cycle. Glycolysis begins with the uptake of glucose into cells via various glucose transporters [54,188,189]. This glucose is then enzymatically converted to pyruvate, then lactate, in order to generate adenosine triphosphate (ATP). Glycolysis occurs considerably faster than OXPHOS, but is much less efficient: generating 20-fold less ATP. For this reason, glycolysis is often used by cells in response to a high, transient energy demand [179,181].
For microglia, increased demand often occurs following recognition of an external stimuli, such as DAMPs, PAMPs, or NAMPs [180]. ATP is required for reorganization of the actin cytoskeleton: critical for cell morphological changes, phagocytosis and cell migration [190]. Furthermore, other by-products of metabolism such as ROS, fatty acids, amino acids and nucleotides are required for phagocytosis and the production of cytokines [191].
Sustained glycolysis results in increased mitochondrial membrane potential (ΔΨm), and likewise increased reliance on OXPHOS results in a decrease in ΔΨm [192]. In macrophages, this has been suggested to occur because when cells are relying on glycolysis to generate ATP, protons generated in the electron transport chain are no longer being used by mitochondrial ATP synthase during OXPHOS [192,193]. While ΔΨm is for the most part highly regulated by cells, defects in this parameter can have detrimental consequences regarding immunometabolism and cell health [194].

8.2. Functional Assays for Immunometabolism

A wide variety of assays exist that can be used to examine mitochondrial function in vitro, which have been reviewed extensively elsewhere [195,196,197]. The most common methods will be discussed below.
The Agilent Seahorse XF analyser acts as an incredibly powerful tool for examining mitochondrial function [195,196]. This machine works by using solid-state probes at the bottom of a custom 96-well plate to measure both levels of O2 and pH within cell media in real time. From these measurements, the Seahorse can calculate both oxygen consumption rate (OCR) and extracellular acidification rate (ECAR) within a culture. Kits are available which allow the study of specific subsets of cellular metabolism, e.g., the Mito Stress Test measures a variety of parameters related to OXPHOS, and the Glycolytic Stress Test, which does the same for glycolysis. These kits work by providing a variety of respiratory modulators, which are added to cells sequentially by the machine whilst OCR and ECAR measurements are taking place. When considering both equipment and reagent costs, Seahorse assays can be expensive to run. However, data obtained is robust and multiparametric, and the analysis software is easy to use. Furthermore, assays can be easily personalised to reflect specific research questions. Practical considerations when performing Seahorse assays include data normalization to accurate cell counts: small differences in cell number can cause significant differences in readings. In addition, care must be taken to ensure all media and modulators are at neutral pH prior to the assay, as the assay is sensitive to small changes in pH.
An additional method to examine mitochondrial function in vitro is to assay ΔΨm [197]. Several fluorescent probes exist for this purpose, with the most commonly used being tetramethylrhodamine methyl ester (TMRM) [198]. Most ΔΨm probes are substrates for multidrug resistance transporters on the mitochondrial membrane, and their level of accumulation in mitochondria is directly proportional to ΔΨm. While a marked decrease in ΔΨm can indicate poor cell health, it can also indicate reduced OXPHOS [192], which should be assessed with an additional assay, e.g., Seahorse.
Immunometabolism can be indirectly assayed by visualizing mitochondrial network structure, using fluorescent staining (e.g., Mitotracker), immunocytochemistry or electron microscopy [197]. Within cells, the mitochondrial network constantly undergoes fusion and fission events, reflecting changes in their function and status [199]. For this reason, identification of mitochondrial morphology followed by characterization of the size and shape of these organelles can provide significant information regarding their bioenergetics.
Immunometabolism can be more comprehensively assessed with metabolomics. Metabolomics characterises and quantifies the metabolome: the total set of metabolites, substrates, intermediates and products of cellular metabolism. This process requires the use of mass-spectrometry in conjunction with liquid or gas chromatography and/or nuclear-magnetic resonance. While this technique is expensive and requires specialist equipment and expertise, it generates a large quantity of data about the current state of metabolic processes within a culture. However, it should be noted that metabolism is a highly dynamic process, and metabolomics only provides a snapshot at one point in time [195].
The importance of immunometabolic switching with regard to microglia function highlights the value of studying this process when investigating microglial phenotypes in vitro. Using more than one method to assess mitochondrial function in vitro is advised for more robust conclusions.

9. Conclusions

It is clear that microglia exhibit numerous important and complex functions within the brain. Fortunately, a large number of well-developed methods exist by which to measure each of these functions in vitro. When choosing which method to use for assessing each function, it is important to take into consideration the research aims.
Upon selecting stimuli or cargo, the most relevant choice should be used. In addition, future studies should aim to move the field towards more physiologically relevant stimuli when studying microglia activation. Broadly, accuracy and reproducibility of the data can be improved by having sufficient technical replicates, and sampling more cell events for flow cytometry, or capturing more image fields for microscopy readouts. Moreover, performing multiple assays for one or more related functions can provide a more nuanced picture of the effect of an experimental perturbation.
We hope that this review will provide microglia researchers with all the information they require to perform a comprehensive evaluation of this highly important cell type.

Author Contributions

E.M. contributed to the conception and design of the work, as well as writing and editing the manuscript. N.C.-R. and H.H.-R. contributed to study design, writing and editing. B.S. and N.S. contributed to writing and editing. R.O. contributed by designing and creating figures and the graphical abstract. All authors have read and agreed to the published version of the manuscript.

Funding

E.M., B.S., R.O., N.S. and H.H.-R. were all funded by the UK-DRI (Project reference UK DRI-DSI2020-IPMAR). The main UK-DRI funders are Medical Research Council, Alzheimer’s Research UK, and the Alzheimer’s society. N.C.-R. was funded by an Alzheimer’s Research UK Research Fellowship (project reference ARUK-RF2020A-004).

Institutional Review Board Statement

Not applicable.

Informed Consent Statement

Not applicable.

Data Availability Statement

Information on the data underpinning the results presented here, including how to access them, can be found in the Cardiff University data catalogue at http://doi.org/10.17035/d.2022.0228053760.

Acknowledgments

All figures and the graphical abstract were created with BioRender.com (accessed on 6 October 2022).

Conflicts of Interest

The authors declare no conflict of interest. The funders had no role in the design of the study; in the collection, analyses, or interpretation of data; in the writing of the manuscript; or in the decision to publish the results.

References

  1. Mittelbronn, M.; Dietz, K.; Schluesener, H.J.; Meyermann, R. Local distribution of microglia in the normal adult human central nervous system differs by up to one order of magnitude. Acta Neuropathol. 2001, 101, 249–255. [Google Scholar] [CrossRef] [PubMed]
  2. Tan, Y.L.; Yuan, Y.; Tian, L. Microglial regional heterogeneity and its role in the brain. Mol. Psychiatry 2020, 25, 351–367. [Google Scholar] [CrossRef] [PubMed] [Green Version]
  3. Menassa, D.A.; Muntslag, T.A.O.; Martin-Estebané, M.; Barry-Carroll, L.; Chapman, M.A.; Adorjan, I.; Tyler, T.; Turnbull, B.; Rose-Zerilli, M.J.J.; Nicoll, J.A.R.; et al. The spatiotemporal dynamics of microglia across the human lifespan. Dev. Cell 2022, 57, 2127–2139.e6. [Google Scholar] [CrossRef] [PubMed]
  4. Nimmerjahn, A.; Kirchhoff, F.; Helmchen, F. Resting microglial cells are highly dynamic surveillants of brain parenchyma in vivo. Science 2005, 308, 1314–1318. [Google Scholar] [CrossRef] [PubMed] [Green Version]
  5. Parakalan, R.; Jiang, B.; Nimmi, B.; Janani, M.; Jayapal, M.; Lu, J.; Tay, S.S.; Ling, E.A.; Dheen, S.T. Transcriptome analysis of amoeboid and ramified microglia isolated from the corpus callosum of rat brain. BMC Neurosci. 2012, 13, 64. [Google Scholar] [CrossRef] [Green Version]
  6. Li, Q.; Barres, B.A. Microglia and macrophages in brain homeostasis and disease. Nat. Rev. Immunol. 2018, 18, 225–242. [Google Scholar] [CrossRef]
  7. Ueno, M.; Fujita, Y.; Tanaka, T.; Nakamura, Y.; Kikuta, J.; Ishii, M.; Yamashita, T. Layer V cortical neurons require microglial support for survival during postnatal development. Nat. Neurosci. 2013, 16, 543–551. [Google Scholar] [CrossRef]
  8. Hagemeyer, N.; Hanft, K.M.; Akriditou, M.A.; Unger, N.; Park, E.S.; Stanley, E.R.; Staszewski, O.; Dimou, L.; Prinz, M. Microglia contribute to normal myelinogenesis and to oligodendrocyte progenitor maintenance during adulthood. Acta Neuropathol. 2017, 134, 441–458. [Google Scholar] [CrossRef] [Green Version]
  9. Miron, V.E.; Boyd, A.; Zhao, J.W.; Yuen, T.J.; Ruckh, J.M.; Shadrach, J.L.; van Wijngaarden, P.; Wagers, A.J.; Williams, A.; Franklin, R.J.M.; et al. M2 microglia and macrophages drive oligodendrocyte differentiation during CNS remyelination. Nat. Neurosci. 2013, 16, 1211–1218. [Google Scholar] [CrossRef] [Green Version]
  10. Marín-Teva, J.L.; Dusart, I.; Colin, C.; Gervais, A.; van Rooijen, N.; Mallat, M. Microglia promote the death of developing Purkinje cells. Neuron 2004, 41, 535–547. [Google Scholar] [CrossRef]
  11. Wakselman, S.; Béchade, C.; Roumier, A.; Bernard, D.; Triller, A.; Bessis, A. Developmental neuronal death in hippocampus requires the microglial CD11b integrin and DAP12 immunoreceptor. J. Neurosci. 2008, 28, 8138–8143. [Google Scholar] [CrossRef] [PubMed] [Green Version]
  12. Cunningham, C.L.; Martínez-Cerdeño, V.; Noctor, S.C. Microglia regulate the number of neural precursor cells in the developing cerebral cortex. J. Neurosci. 2013, 33, 4216–4233. [Google Scholar] [CrossRef] [PubMed] [Green Version]
  13. Sierra, A.; Encinas, J.M.; Deudero, J.J.; Chancey, J.H.; Enikolopov, G.; Overstreet-Wadiche, L.S.; Tsirka, S.E.; Maletic-Savatic, M. Microglia shape adult hippocampal neurogenesis through apoptosis-coupled phagocytosis. Cell Stem Cell 2010, 7, 483–495. [Google Scholar] [CrossRef] [Green Version]
  14. Schafer, D.P.; Lehrman, E.K.; Kautzman, A.G.; Koyama, R.; Mardinly, A.R.; Yamasaki, R.; Ransohoff, R.M.; Greenberg, M.E.; Barres, B.A.; Stevens, B. Microglia sculpt postnatal neural circuits in an activity and complement-dependent manner. Neuron 2012, 74, 691–705. [Google Scholar] [CrossRef] [PubMed] [Green Version]
  15. Paolicelli, R.C.; Bolasco, G.; Pagani, F.; Maggi, L.; Scianni, M.; Panzanelli, P.; Giustetto, M.; Ferreira, T.A.; Guiducci, E.; Dumas, L.; et al. Synaptic pruning by microglia is necessary for normal brain development. Science 2011, 333, 1456–1458. [Google Scholar] [CrossRef] [PubMed] [Green Version]
  16. Hoshiko, M.; Arnoux, I.; Avignone, E.; Yamamoto, N.; Audinat, E. Deficiency of the microglial receptor CX3CR1 impairs postnatal functional development of thalamocortical synapses in the barrel cortex. J. Neurosci. 2012, 32, 15106–15111. [Google Scholar] [CrossRef] [PubMed] [Green Version]
  17. Pont-Lezica, L.; Beumer, W.; Colasse, S.; Drexhage, H.; Versnel, M.; Bessis, A. Microglia shape corpus callosum axon tract fasciculation: Functional impact of prenatal inflammation. Eur. J. Neurosci. 2014, 39, 1551–1557. [Google Scholar] [CrossRef]
  18. Squarzoni, P.; Oller, G.; Hoeffel, G.; Pont-Lezica, L.; Rostaing, P.; Low, D.; Bessis, A.; Ginhoux, F.; Garel, S. Microglia modulate wiring of the embryonic forebrain. Cell Rep. 2014, 8, 1271–1279. [Google Scholar] [CrossRef] [Green Version]
  19. Augusto-Oliveira, M.; Arrifano, G.P.; Lopes-Araújo, A.; Santos-Sacramento, L.; Takeda, P.Y.; Anthony, D.C.; Malva, J.O.; Crespo-Lopez, M.E. What Do Microglia Really Do in Healthy Adult Brain? Cells 2019, 8, 1293. [Google Scholar] [CrossRef] [Green Version]
  20. Gumbs, S.B.H.; Kübler, R.; Gharu, L.; Schipper, P.J.; Borst, A.L.; Snijders, G.; Ormel, P.R.; van Berlekom, A.B.; Wensing, A.M.J.; de Witte, L.D.; et al. Human microglial models to study HIV infection and neuropathogenesis: A literature overview and comparative analyses. J. Neurovirol. 2022, 28, 64–91. [Google Scholar] [CrossRef]
  21. Timmerman, R.; Burm, S.M.; Bajramovic, J.J. An Overview of in vitro Methods to Study Microglia. Front. Cell Neurosci. 2018, 12, 242. [Google Scholar] [CrossRef] [PubMed]
  22. Cadiz, M.P.; Jensen, T.D.; Sens, J.P.; Zhu, K.; Song, W.M.; Zhang, B.; Ebbert, M.; Chang, R.; Fryer, J.D. Culture shock: Microglial heterogeneity, activation, and disrupted single-cell microglial networks in vitro. Mol. Neurodegener. 2022, 17, 26. [Google Scholar] [CrossRef] [PubMed]
  23. Dubbelaar, M.L.; Kracht, L.; Eggen, B.J.L.; Boddeke, E. The Kaleidoscope of Microglial Phenotypes. Front. Immunol. 2018, 9, 1753. [Google Scholar] [CrossRef] [PubMed]
  24. Ginhoux, F.; Prinz, M. Origin of microglia: Current concepts and past controversies. Cold Spring Harb. Perspect. Biol. 2015, 7, a020537. [Google Scholar] [CrossRef] [Green Version]
  25. Böttcher, C.; Schlickeiser, S.; Sneeboer, M.A.M.; Kunkel, D.; Knop, A.; Paza, E.; Fidzinski, P.; Kraus, L.; Snijders, G.J.L.; Kahn, R.S.; et al. Human microglia regional heterogeneity and phenotypes determined by multiplexed single-cell mass cytometry. Nat. Neurosci. 2019, 22, 78–90. [Google Scholar] [CrossRef]
  26. Butovsky, O.; Jedrychowski, M.P.; Moore, C.S.; Cialic, R.; Lanser, A.J.; Gabriely, G.; Koeglsperger, T.; Dake, B.; Wu, P.M.; Doykan, C.E.; et al. Identification of a unique TGF-β-dependent molecular and functional signature in microglia. Nat. Neurosci. 2014, 17, 131–143. [Google Scholar] [CrossRef] [Green Version]
  27. Butovsky, O.; Weiner, H.L. Microglial signatures and their role in health and disease. Nat. Rev. Neurosci. 2018, 19, 622–635. [Google Scholar] [CrossRef]
  28. Jurga, A.M.; Paleczna, M.; Kuter, K.Z. Overview of General and Discriminating Markers of Differential Microglia Phenotypes. Front. Cell Neurosci. 2020, 14, 198. [Google Scholar] [CrossRef]
  29. Walker, D.G.; Tang, T.M.; Mendsaikhan, A.; Tooyama, I.; Serrano, G.E.; Sue, L.I.; Beach, T.G.; Lue, L.F. Patterns of Expression of Purinergic Receptor P2RY12, a Putative Marker for Non-Activated Microglia, in Aged and Alzheimer’s Disease Brains. Int. J. Mol. Sci. 2020, 21, 678. [Google Scholar] [CrossRef] [Green Version]
  30. Satoh, J.; Kino, Y.; Asahina, N.; Takitani, M.; Miyoshi, J.; Ishida, T.; Saito, Y. TMEM119 marks a subset of microglia in the human brain. Neuropathology 2016, 36, 39–49. [Google Scholar] [CrossRef]
  31. Hendrickx, D.A.E.; van Eden, C.G.; Schuurman, K.G.; Hamann, J.; Huitinga, I. Staining of HLA-DR, Iba1 and CD68 in human microglia reveals partially overlapping expression depending on cellular morphology and pathology. J. Neuroimmunol. 2017, 309, 12–22. [Google Scholar] [CrossRef] [PubMed]
  32. Shi, F.J.; Xie, H.; Zhang, C.Y.; Qin, H.F.; Zeng, X.W.; Lou, H.; Zhang, L.; Xu, G.T.; Zhang, J.F.; Xu, G.X. Is Iba-1 protein expression a sensitive marker for microglia activation in experimental diabetic retinopathy? Int. J. Ophthalmol. 2021, 14, 200–208. [Google Scholar] [CrossRef] [PubMed]
  33. Honarpisheh, P.; Lee, J.; Banerjee, A.; Blasco-Conesa, M.P.; d’Aigle, J.; Mamun, A.A.; Ritzel, R.M.; Chauhan, A.; Ganesh, B.P.; McCullough, L.D. Potential caveats of putative microglia-specific markers for assessment of age-related cerebrovascular neuroinflammation. J. Neuroinflammation 2020, 17, 366. [Google Scholar] [CrossRef] [PubMed]
  34. Rangaraju, S.; Raza, S.A.; Li, N.X.; Betarbet, R.; Dammer, E.B.; Duong, D.; Lah, J.J.; Seyfried, N.T.; Levey, A.I. Differential Phagocytic Properties of CD45 (low) Microglia and CD45 (high) Brain Mononuclear Phagocytes-Activation and Age-Related Effects. Front. Immunol. 2018, 9, 405. [Google Scholar] [CrossRef] [Green Version]
  35. Li, B.; Bedard, K.; Sorce, S.; Hinz, B.; Dubois-Dauphin, M.; Krause, K.H. NOX4 expression in human microglia leads to constitutive generation of reactive oxygen species and to constitutive IL-6 expression. J. Innate. Immun. 2009, 1, 570–581. [Google Scholar] [CrossRef]
  36. Lier, J.; Streit, W.J.; Bechmann, I. Beyond Activation: Characterizing Microglial Functional Phenotypes. Cells 2021, 10, 2236. [Google Scholar] [CrossRef]
  37. Uff, C.E.G.; Patel, K.; Yeung, C.; Yip, P.K. Advances in Visualizing Microglial Cells in Human Central Nervous System Tissue. Biomolecules 2022, 12, 603. [Google Scholar] [CrossRef]
  38. Haynes, S.E.; Hollopeter, G.; Yang, G.; Kurpius, D.; Dailey, M.E.; Gan, W.B.; Julius, D. The P2Y12 receptor regulates microglial activation by extracellular nucleotides. Nat. Neurosci. 2006, 9, 1512–1519. [Google Scholar] [CrossRef]
  39. Sousa, C.; Golebiewska, A.; Poovathingal, S.K.; Kaoma, T.; Pires-Afonso, Y.; Martina, S.; Coowar, D.; Azuaje, F.; Skupin, A.; Balling, R.; et al. Single-cell transcriptomics reveals distinct inflammation-induced microglia signatures. EMBO Rep. 2018, 19, e46171. [Google Scholar] [CrossRef]
  40. Hovens, I.; Nyakas, C.; Schoemaker, R. A novel method for evaluating microglial activation using ionized calcium-binding adaptor protein-1 staining: Cell body to cell size ratio. Neuroimmunol. Neuroinflammation 2014, 1, 82–88. [Google Scholar] [CrossRef]
  41. Dennis, J.; Morgan, M.K.; Graf, M.R.; Fuss, B. P2Y12 receptor expression is a critical determinant of functional responsiveness to ATX’s MORFO domain. Purinergic Signal. 2012, 8, 181–190. [Google Scholar] [CrossRef] [PubMed] [Green Version]
  42. Mazzeo, A.; Porta, M.; Beltramo, E. Characterization of an Immortalized Human Microglial Cell Line as a Tool for the Study of Diabetic Retinopathy. Int. J. Mol. Sci. 2022, 23, 5745. [Google Scholar] [CrossRef] [PubMed]
  43. Weinstein, J.R.; Quan, Y.; Hanson, J.F.; Colonna, L.; Iorga, M.; Honda, S.; Shibuya, K.; Shibuya, A.; Elkon, K.B.; Möller, T. IgM-Dependent Phagocytosis in Microglia Is Mediated by Complement Receptor 3, Not Fcα/μ Receptor. J. Immunol. 2015, 195, 5309–5317. [Google Scholar] [CrossRef] [Green Version]
  44. Janda, E.; Boi, L.; Carta, A.R. Microglial Phagocytosis and Its Regulation: A Therapeutic Target in Parkinson’s Disease? Front. Mol. Neurosci. 2018, 11, 144. [Google Scholar] [CrossRef] [Green Version]
  45. Nguyen, A.T.; Wang, K.; Hu, G.; Wang, X.; Miao, Z.; Azevedo, J.A.; Suh, E.; Van Deerlin, V.M.; Choi, D.; Roeder, K.; et al. APOE and TREM2 regulate amyloid-responsive microglia in Alzheimer’s disease. Acta Neuropathol. 2020, 140, 477–493. [Google Scholar] [CrossRef]
  46. Owens, R.; Grabert, K.; Davies, C.L.; Alfieri, A.; Antel, J.P.; Healy, L.M.; McColl, B.W. Divergent Neuroinflammatory Regulation of Microglial TREM Expression and Involvement of NF-κB. Front. Cell Neurosci. 2017, 11, 56. [Google Scholar] [CrossRef] [Green Version]
  47. Iwasaki, H.; Somoza, C.; Shigematsu, H.; Duprez, E.A.; Iwasaki-Arai, J.; Mizuno, S.; Arinobu, Y.; Geary, K.; Zhang, P.; Dayaram, T.; et al. Distinctive and indispensable roles of PU.1 in maintenance of hematopoietic stem cells and their differentiation. Blood 2005, 106, 1590–1600. [Google Scholar] [CrossRef] [PubMed] [Green Version]
  48. Kuehn, S.; Reinehr, S.; Stute, G.; Rodust, C.; Grotegut, P.; Hensel, A.T.; Dick, H.B.; Joachim, S.C. Interaction of complement system and microglia activation in retina and optic nerve in a NMDA damage model. Mol. Cell Neurosci. 2018, 89, 95–106. [Google Scholar] [CrossRef] [PubMed]
  49. Brain Tissue Expression of MERTK—Summary—The Human Protein Atlas. Available online: https://www.proteinatlas.org/ENSG00000153208-MERTK/brain (accessed on 5 October 2022).
  50. Chung, W.S.; Clarke, L.E.; Wang, G.X.; Stafford, B.K.; Sher, A.; Chakraborty, C.; Joung, J.; Foo, L.C.; Thompson, A.; Chen, C.; et al. Astrocytes mediate synapse elimination through MEGF10 and MERTK pathways. Nature 2013, 504, 394–400. [Google Scholar] [CrossRef] [PubMed] [Green Version]
  51. Healy, L.M.; Perron, G.; Won, S.Y.; Michell-Robinson, M.A.; Rezk, A.; Ludwin, S.K.; Moore, C.S.; Hall, J.A.; Bar-Or, A.; Antel, J.P. MerTK Is a Functional Regulator of Myelin Phagocytosis by Human Myeloid Cells. J. Immunol. 2016, 196, 3375–3384. [Google Scholar] [CrossRef]
  52. Colonna, M.; Butovsky, O. Microglia Function in the Central Nervous System During Health and Neurodegeneration. Annu. Rev. Immunol. 2017, 35, 441–468. [Google Scholar] [CrossRef] [PubMed]
  53. Buttgereit, A.; Lelios, I.; Yu, X.; Vrohlings, M.; Krakoski, N.R.; Gautier, E.L.; Nishinakamura, R.; Becher, B.; Greter, M. Sall1 is a transcriptional regulator defining microglia identity and function. Nat. Immunol. 2016, 17, 1397–1406. [Google Scholar] [CrossRef] [PubMed]
  54. Wang, L.; Pavlou, S.; Du, X.; Bhuckory, M.; Xu, H.; Chen, M. Glucose transporter 1 critically controls microglial activation through facilitating glycolysis. Mol. Neurodegener. 2019, 14, 2. [Google Scholar] [CrossRef] [PubMed] [Green Version]
  55. Gilchrist, S.E.; Pennelli, G.M.; Hafizi, S. Gas6/TAM Signalling Negatively Regulates Inflammatory Induction of GM-CSF in Mouse Brain Microglia. Cells 2021, 10, 3281. [Google Scholar] [CrossRef]
  56. Liu, Y.; Walter, S.; Stagi, M.; Cherny, D.; Letiembre, M.; Schulz-Schaeffer, W.; Heine, H.; Penke, B.; Neumann, H.; Fassbender, K. LPS receptor (CD14): A receptor for phagocytosis of Alzheimer’s amyloid peptide. Brain 2005, 128, 1778–1789. [Google Scholar] [CrossRef] [Green Version]
  57. Sierra, A.; de Castro, F.; Del Río-Hortega, J.; Rafael Iglesias-Rozas, J.; Garrosa, M.; Kettenmann, H. The “Big-Bang” for modern glial biology: Translation and comments on Pío del Río-Hortega 1919 series of papers on microglia. Glia 2016, 64, 1801–1840. [Google Scholar] [CrossRef]
  58. Savage, J.C.; Carrier, M.; Tremblay, M. Morphology of Microglia Across Contexts of Health and Disease. Methods Mol. Biol. 2019, 2034, 13–26. [Google Scholar] [CrossRef]
  59. Stopper, L.; Bălşeanu, T.A.; Cătălin, B.; Rogoveanu, O.C.; Mogoantă, L.; Scheller, A. Microglia morphology in the physiological and diseased brain—From fixed tissue to in vivo conditions. Rom. J. Morphol. Embryol. 2018, 59, 7–12. [Google Scholar]
  60. Young, K.; Morrison, H. Quantifying Microglia Morphology from Photomicrographs of Immunohistochemistry Prepared Tissue Using ImageJ. J. Vis. Exp. 2018, 136, 57648. [Google Scholar] [CrossRef] [Green Version]
  61. Bosch, L.F.P.; Kierdorf, K. The Shape of μ-How Morphological Analyses Shape the Study of Microglia. Front. Cell Neurosci. 2022, 16, 942462. [Google Scholar] [CrossRef]
  62. Althammer, F.; Ferreira-Neto, H.C.; Rubaharan, M.; Roy, R.K.; Patel, A.A.; Murphy, A.; Cox, D.N.; Stern, J.E. Three-dimensional morphometric analysis reveals time-dependent structural changes in microglia and astrocytes in the central amygdala and hypothalamic paraventricular nucleus of heart failure rats. J. Neuroinflammation 2020, 17, 221. [Google Scholar] [CrossRef]
  63. Srinivasan, A.; Ferland, R.J. AutoSholl allows for automation of Sholl analysis independent of user tracing. J. Neurosci. Methods 2020, 331, 108529. [Google Scholar] [CrossRef] [PubMed]
  64. Nguyen, C.; Thompson-Peer, K.L. Comparing Automated Morphology Quantification Software on Dendrites of Uninjured and Injured Drosophila Neurons. Neuroinformatics 2021, 19, 703–717. [Google Scholar] [CrossRef] [PubMed]
  65. Heindl, S.; Gesierich, B.; Benakis, C.; Llovera, G.; Duering, M.; Liesz, A. Automated Morphological Analysis of Microglia After Stroke. Front. Cell Neurosci. 2018, 12, 106. [Google Scholar] [CrossRef] [PubMed]
  66. Xiao, H.; Peng, H. APP2: Automatic tracing of 3D neuron morphology based on hierarchical pruning of a gray-weighted image distance-tree. Bioinformatics 2013, 29, 1448–1454. [Google Scholar] [CrossRef]
  67. Megjhani, M.; Rey-Villamizar, N.; Merouane, A.; Lu, Y.; Mukherjee, A.; Trett, K.; Chong, P.; Harris, C.; Shain, W.; Roysam, B. Population-scale three-dimensional reconstruction and quantitative profiling of microglia arbors. Bioinformatics 2015, 31, 2190–2198. [Google Scholar] [CrossRef] [Green Version]
  68. York, E.M.; LeDue, J.M.; Bernier, L.P.; MacVicar, B.A. 3DMorph Automatic Analysis of Microglial Morphology in Three Dimensions from Ex Vivo and In Vivo Imaging. eNeuro 2018, 5, 0266-18. [Google Scholar] [CrossRef] [Green Version]
  69. Abdolhoseini, M.; Kluge, M.G.; Walker, F.R.; Johnson, S.J. Segmentation, Tracing, and Quantification of Microglial Cells from 3D Image Stacks. Sci. Rep. 2019, 9, 8557. [Google Scholar] [CrossRef] [Green Version]
  70. Davis, B.M.; Salinas-Navarro, M.; Cordeiro, M.F.; Moons, L.; De Groef, L. Characterizing microglia activation: A spatial statistics approach to maximize information extraction. Sci. Rep. 2017, 7, 1576. [Google Scholar] [CrossRef] [Green Version]
  71. Rodríguez-Gómez, J.A.; Kavanagh, E.; Engskog-Vlachos, P.; Engskog, M.K.R.; Herrera, A.J.; Espinosa-Oliva, A.M.; Joseph, B.; Hajji, N.; Venero, J.L.; Burguillos, M.A. Microglia: Agents of the CNS Pro-Inflammatory Response. Cells 2020, 9, 1717. [Google Scholar] [CrossRef]
  72. Deczkowska, A.; Keren-Shaul, H.; Weiner, A.; Colonna, M.; Schwartz, M.; Amit, I. Disease-Associated Microglia: A Universal Immune Sensor of Neurodegeneration. Cell 2018, 173, 1073–1081. [Google Scholar] [CrossRef] [PubMed]
  73. Kawai, T.; Akira, S. Signaling to NF-kappaB by Toll-like receptors. Trends Mol. Med. 2007, 13, 460–469. [Google Scholar] [CrossRef] [PubMed]
  74. Saresella, M.; La Rosa, F.; Piancone, F.; Zoppis, M.; Marventano, I.; Calabrese, E.; Rainone, V.; Nemni, R.; Mancuso, R.; Clerici, M. The NLRP3 and NLRP1 inflammasomes are activated in Alzheimer’s disease. Mol. Neurodegener 2016, 11, 23. [Google Scholar] [CrossRef] [PubMed] [Green Version]
  75. Bauernfeind, F.G.; Horvath, G.; Stutz, A.; Alnemri, E.S.; MacDonald, K.; Speert, D.; Fernandes-Alnemri, T.; Wu, J.; Monks, B.G.; Fitzgerald, K.A.; et al. Cutting edge: NF-kappaB activating pattern recognition and cytokine receptors license NLRP3 inflammasome activation by regulating NLRP3 expression. J. Immunol. 2009, 183, 787–791. [Google Scholar] [CrossRef] [Green Version]
  76. Nizami, S.; Hall-Roberts, H.; Warrier, S.; Cowley, S.A.; Di Daniel, E. Microglial inflammation and phagocytosis in Alzheimer’s disease: Potential therapeutic targets. Br. J. Pharmacol. 2019, 176, 3515–3532. [Google Scholar] [CrossRef] [Green Version]
  77. Franco, R.; Fernández-Suárez, D. Alternatively activated microglia and macrophages in the central nervous system. Prog. Neurobiol. 2015, 131, 65–86. [Google Scholar] [CrossRef]
  78. Guo, S.; Wang, H.; Yin, Y. Microglia Polarization From M1 to M2 in Neurodegenerative Diseases. Front. Aging Neurosci. 2022, 14, 815347. [Google Scholar] [CrossRef]
  79. Martinez, F.O.; Gordon, S. The M1 and M2 paradigm of macrophage activation: Time for reassessment. F1000Prime Rep. 2014, 6, 13. [Google Scholar] [CrossRef] [Green Version]
  80. Ransohoff, R.M. A polarizing question: Do M1 and M2 microglia exist? Nat. Neurosci. 2016, 19, 987–991. [Google Scholar] [CrossRef]
  81. Lively, S.; Schlichter, L.C. Microglia Responses to Pro-inflammatory Stimuli (LPS, IFNγ+TNFα) and Reprogramming by Resolving Cytokines (IL-4, IL-10). Front. Cell Neurosci. 2018, 12, 215. [Google Scholar] [CrossRef] [Green Version]
  82. Zhang, Y.; Hou, B.; Liang, P.; Lu, X.; Wu, Y.; Zhang, X.; Fan, Y.; Liu, Y.; Chen, T.; Liu, W.; et al. TRPV1 channel mediates NLRP3 inflammasome-dependent neuroinflammation in microglia. Cell Death Dis. 2021, 12, 1159. [Google Scholar] [CrossRef] [PubMed]
  83. Broz, P.; Dixit, V.M. Inflammasomes: Mechanism of assembly, regulation and signalling. Nat. Rev. Immunol. 2016, 16, 407–420. [Google Scholar] [CrossRef]
  84. Leng, S.X.; McElhaney, J.E.; Walston, J.D.; Xie, D.; Fedarko, N.S.; Kuchel, G.A. ELISA and multiplex technologies for cytokine measurement in inflammation and aging research. J. Gerontol. A Biol. Sci. Med. Sci. 2008, 63, 879–884. [Google Scholar] [CrossRef] [PubMed] [Green Version]
  85. Gardiner, B.; Dougherty, J.A.; Ponnalagu, D.; Singh, H.; Angelos, M.; Chen, C.A.; Khan, M. Measurement of Oxidative Stress Markers In Vitro Using Commercially Available Kits. In Measuring Oxidants and Oxidative Stress in Biological Systems; Berliner, L.J., Parinandi, N.L., Eds.; Springer: Berlin/Heidelberg, Germany, 2020; pp. 39–60. [Google Scholar] [CrossRef]
  86. Domínguez-Punaro Mde, L.; Segura, M.; Contreras, I.; Lachance, C.; Houde, M.; Lecours, M.P.; Olivier, M.; Gottschalk, M. In vitro characterization of the microglial inflammatory response to Streptococcus suis, an important emerging zoonotic agent of meningitis. Infect Immun. 2010, 78, 5074–5085. [Google Scholar] [CrossRef] [Green Version]
  87. Nawab, A.; Nichols, A.; Klug, R.; Shapiro, J.I.; Sodhi, K. Spin Trapping: A Review for the Study of Obesity Related Oxidative Stress and Na(+)/K(+)-ATPase. J. Clin. Cell Immunol. 2017, 8, 505. [Google Scholar] [CrossRef] [Green Version]
  88. Solé-Domènech, S.; Cruz, D.L.; Capetillo-Zarate, E.; Maxfield, F.R. The endocytic pathway in microglia during health, aging and Alzheimer’s disease. Ageing Res. Rev. 2016, 32, 89–103. [Google Scholar] [CrossRef] [Green Version]
  89. Liu, Y.J.; Zhang, T.; Cheng, D.; Yang, J.; Chen, S.; Wang, X.; Li, X.; Duan, D.; Lou, H.; Zhu, L.; et al. Late endosomes promote microglia migration via cytosolic translocation of immature protease cathD. Sci. Adv. 2020, 6, eaba5783. [Google Scholar] [CrossRef] [PubMed]
  90. Goldstein, J.L.; Anderson, R.G.; Brown, M.S. Coated pits, coated vesicles, and receptor-mediated endocytosis. Nature 1979, 279, 679–685. [Google Scholar] [CrossRef]
  91. Kaksonen, M.; Roux, A. Mechanisms of clathrin-mediated endocytosis. Nat. Rev. Mol. Cell Biol. 2018, 19, 313–326. [Google Scholar] [CrossRef]
  92. Lewis, W.H. Pinocytosis. Johns Hopkins Hosp. Bull. 1931, 49, 17–27. [Google Scholar]
  93. Chen, C.; Li, H.Q.; Liu, Y.J.; Guo, Z.F.; Wu, H.J.; Li, X.; Lou, H.F.; Zhu, L.; Wang, D.; Li, X.M.; et al. A novel size-based sorting mechanism of pinocytic luminal cargoes in microglia. J. Neurosci. 2015, 35, 2674–2688. [Google Scholar] [CrossRef] [PubMed]
  94. Kerr, M.C.; Teasdale, R.D. Defining macropinocytosis. Traffic 2009, 10, 364–371. [Google Scholar] [CrossRef] [PubMed]
  95. Rennick, J.J.; Johnston, A.P.R.; Parton, R.G. Key principles and methods for studying the endocytosis of biological and nanoparticle therapeutics. Nat. Nanotechnol. 2021, 16, 266–276. [Google Scholar] [CrossRef] [PubMed]
  96. Baranov, M.V.; Kumar, M.; Sacanna, S.; Thutupalli, S.; van den Bogaart, G. Modulation of Immune Responses by Particle Size and Shape. Front. Immunol. 2020, 11, 607945. [Google Scholar] [CrossRef]
  97. Gordon, S. Phagocytosis: The Legacy of Metchnikoff. Cell 2016, 166, 1065–1068. [Google Scholar] [CrossRef] [Green Version]
  98. Botté, A.; Lainé, J.; Xicota, L.; Heiligenstein, X.; Fontaine, G.; Kasri, A.; Rivals, I.; Goh, P.; Faklaris, O.; Cossec, J.C.; et al. Ultrastructural and dynamic studies of the endosomal compartment in Down syndrome. Acta Neuropathol. Commun. 2020, 8, 89. [Google Scholar] [CrossRef]
  99. Bonet-Ponce, L.; Beilina, A.; Williamson, C.D.; Lindberg, E.; Kluss, J.H.; Saez-Atienzar, S.; Landeck, N.; Kumaran, R.; Mamais, A.; Bleck, C.K.E.; et al. LRRK2 mediates tubulation and vesicle sorting from lysosomes. Sci. Adv. 2020, 6, eabb2454. [Google Scholar] [CrossRef]
  100. Knupp, A.; Mishra, S.; Martinez, R.; Braggin, J.E.; Szabo, M.; Kinoshita, C.; Hailey, D.W.; Small, S.A.; Jayadev, S.; Young, J.E. Depletion of the AD Risk Gene SORL1 Selectively Impairs Neuronal Endosomal Traffic Independent of Amyloidogenic APP Processing. Cell Rep. 2020, 31, 107719. [Google Scholar] [CrossRef]
  101. Kwart, D.; Gregg, A.; Scheckel, C.; Murphy, E.A.; Paquet, D.; Duffield, M.; Fak, J.; Olsen, O.; Darnell, R.B.; Tessier-Lavigne, M. A Large Panel of Isogenic APP and PSEN1 Mutant Human iPSC Neurons Reveals Shared Endosomal Abnormalities Mediated by APP β-CTFs, Not Aβ. Neuron 2019, 104, 256–270.e5. [Google Scholar] [CrossRef]
  102. Cataldo, A.M.; Peterhoff, C.M.; Troncoso, J.C.; Gomez-Isla, T.; Hyman, B.T.; Nixon, R.A. Endocytic pathway abnormalities precede amyloid beta deposition in sporadic Alzheimer’s disease and Down syndrome: Differential effects of APOE genotype and presenilin mutations. Am. J. Pathol. 2000, 157, 277–286. [Google Scholar] [CrossRef]
  103. Small, S.A.; Simoes-Spassov, S.; Mayeux, R.; Petsko, G.A. Endosomal Traffic Jams Represent a Pathogenic Hub and Therapeutic Target in Alzheimer’s Disease. Trends Neurosci. 2017, 40, 592–602. [Google Scholar] [CrossRef] [PubMed]
  104. Van Acker, Z.P.; Bretou, M.; Annaert, W. Endo-lysosomal dysregulations and late-onset Alzheimer’s disease: Impact of genetic risk factors. Mol. Neurodegener. 2019, 14, 20. [Google Scholar] [CrossRef] [PubMed] [Green Version]
  105. Szabo, M.P.; Mishra, S.; Knupp, A.; Young, J.E. The role of Alzheimer’s disease risk genes in endolysosomal pathways. Neurobiol. Dis. 2022, 162, 105576. [Google Scholar] [CrossRef] [PubMed]
  106. Ecker, M.; Redpath, G.M.I.; Nicovich, P.R.; Rossy, J. Quantitative visualization of endocytic trafficking through photoactivation of fluorescent proteins. Mol. Biol. Cell 2021, 32, 892–902. [Google Scholar] [CrossRef] [PubMed]
  107. Dräger, N.M.; Sattler, S.M.; Huang, C.T.; Teter, O.M.; Leng, K.; Hashemi, S.H.; Hong, J.; Aviles, G.; Clelland, C.D.; Zhan, L.; et al. A CRISPRi/a platform in human iPSC-derived microglia uncovers regulators of disease states. Nat. Neurosci. 2022, 25, 1149–1162. [Google Scholar] [CrossRef] [PubMed]
  108. Maes, M.E.; Colombo, G.; Schulz, R.; Siegert, S. Targeting microglia with lentivirus and AAV: Recent advances and remaining challenges. Neurosci. Lett. 2019, 707, 134310. [Google Scholar] [CrossRef] [PubMed]
  109. Mandrekar, S.; Jiang, Q.; Lee, C.Y.; Koenigsknecht-Talboo, J.; Holtzman, D.M.; Landreth, G.E. Microglia mediate the clearance of soluble Abeta through fluid phase macropinocytosis. J. Neurosci. 2009, 29, 4252–4262. [Google Scholar] [CrossRef] [Green Version]
  110. Mamais, A.; Kluss, J.H.; Bonet-Ponce, L.; Landeck, N.; Langston, R.G.; Smith, N.; Beilina, A.; Kaganovich, A.; Ghosh, M.C.; Pellegrini, L.; et al. Mutations in LRRK2 linked to Parkinson disease sequester Rab8a to damaged lysosomes and regulate transferrin-mediated iron uptake in microglia. PLoS Biol. 2021, 19, e3001480. [Google Scholar] [CrossRef]
  111. Narayan, P.; Sienski, G.; Bonner, J.M.; Lin, Y.T.; Seo, J.; Baru, V.; Haque, A.; Milo, B.; Akay, L.A.; Graziosi, A.; et al. PICALM Rescues Endocytic Defects Caused by the Alzheimer’s Disease Risk Factor APOE4. Cell Rep. 2020, 33, 108224. [Google Scholar] [CrossRef]
  112. Connor-Robson, N.; Booth, H.; Martin, J.G.; Gao, B.; Li, K.; Doig, N.; Vowles, J.; Browne, C.; Klinger, L.; Juhasz, P.; et al. An integrated transcriptomics and proteomics analysis reveals functional endocytic dysregulation caused by mutations in LRRK2. Neurobiol. Dis. 2019, 127, 512–526. [Google Scholar] [CrossRef]
  113. Wang, J.T.; Teasdale, R.D.; Liebl, D. Macropinosome quantitation assay. MethodsX 2014, 1, 36–41. [Google Scholar] [CrossRef] [PubMed]
  114. Macia, E.; Ehrlich, M.; Massol, R.; Boucrot, E.; Brunner, C.; Kirchhausen, T. Dynasore, a cell-permeable inhibitor of dynamin. Dev. Cell 2006, 10, 839–850. [Google Scholar] [CrossRef] [PubMed] [Green Version]
  115. Von Kleist, L.; Stahlschmidt, W.; Bulut, H.; Gromova, K.; Puchkov, D.; Robertson, M.J.; MacGregor, K.A.; Tomilin, N.; Pechstein, A.; Chau, N.; et al. Role of the clathrin terminal domain in regulating coated pit dynamics revealed by small molecule inhibition. Cell 2011, 146, 471–484. [Google Scholar] [CrossRef] [PubMed] [Green Version]
  116. Brenner, S.L.; Korn, E.D. Substoichiometric concentrations of cytochalasin D inhibit actin polymerization. Additional evidence for an F-actin treadmill. J. Biol. Chem. 1979, 254, 9982–9985. [Google Scholar] [CrossRef]
  117. Gladhaug, I.P.; Christoffersen, T. Amiloride inhibits constitutive internalization and increases the surface number of epidermal growth factor receptors in intact rat hepatocytes. J. Cell Physiol. 1990, 143, 188–195. [Google Scholar] [CrossRef]
  118. Scheiblich, H.; Dansokho, C.; Mercan, D.; Schmidt, S.V.; Bousset, L.; Wischhof, L.; Eikens, F.; Odainic, A.; Spitzer, J.; Griep, A.; et al. Microglia jointly degrade fibrillar alpha-synuclein cargo by distribution through tunneling nanotubes. Cell 2021, 184, 5089–5106.e21. [Google Scholar] [CrossRef]
  119. Park, J.Y.; Kim, K.S.; Lee, S.B.; Ryu, J.S.; Chung, K.C.; Choo, Y.K.; Jou, I.; Kim, J.; Park, S.M. On the mechanism of internalization of alpha-synuclein into microglia: Roles of ganglioside GM1 and lipid raft. J. Neurochem. 2009, 110, 400–411. [Google Scholar] [CrossRef]
  120. Lin, Y.T.; Seo, J.; Gao, F.; Feldman, H.M.; Wen, H.L.; Penney, J.; Cam, H.P.; Gjoneska, E.; Raja, W.K.; Cheng, J.; et al. APOE4 Causes Widespread Molecular and Cellular Alterations Associated with Alzheimer’s Disease Phenotypes in Human iPSC-Derived Brain Cell Types. Neuron 2018, 98, 1141–1154.e7. [Google Scholar] [CrossRef] [Green Version]
  121. Maguire, E.; Menzies, G.E.; Phillips, T.; Sasner, M.; Williams, H.M.; Czubala, M.A.; Evans, N.; Cope, E.L.; Sims, R.; Howell, G.R.; et al. PIP2 depletion and altered endocytosis caused by expression of Alzheimer’s disease-protective variant PLCγ2 R522. Embo J. 2021, 40, e105603. [Google Scholar] [CrossRef]
  122. Wells, C.; Brennan, S.; Keon, M.; Ooi, L. The role of amyloid oligomers in neurodegenerative pathologies. Int. J. Biol. Macromol. 2021, 181, 582–604. [Google Scholar] [CrossRef]
  123. Abud, E.M.; Ramirez, R.N.; Martinez, E.S.; Healy, L.M.; Nguyen, C.H.H.; Newman, S.A.; Yeromin, A.V.; Scarfone, V.M.; Marsh, S.E.; Fimbres, C.; et al. iPSC-Derived Human Microglia-like Cells to Study Neurological Diseases. Neuron 2017, 94, 278–293.e9. [Google Scholar] [CrossRef] [PubMed]
  124. Hoffmann, A.; Ettle, B.; Bruno, A.; Kulinich, A.; Hoffmann, A.C.; von Wittgenstein, J.; Winkler, J.; Xiang, W.; Schlachetzki, J.C.M. Alpha-synuclein activates BV2 microglia dependent on its aggregation state. Biochem. Biophys. Res. Commun. 2016, 479, 881–886. [Google Scholar] [CrossRef] [PubMed]
  125. Sondag, C.M.; Dhawan, G.; Combs, C.K. Beta amyloid oligomers and fibrils stimulate differential activation of primary microglia. J. Neuroinflammation 2009, 6, 1. [Google Scholar] [CrossRef] [PubMed] [Green Version]
  126. Ries, M.; Sastre, M. Mechanisms of Aβ Clearance and Degradation by Glial Cells. Front. Aging Neurosci. 2016, 8, 160. [Google Scholar] [CrossRef] [Green Version]
  127. Joshi, P.; Riffel, F.; Satoh, K.; Enomoto, M.; Qamar, S.; Scheiblich, H.; Villacampa, N.; Kumar, S.; Theil, S.; Parhizkar, S.; et al. Differential interaction with TREM2 modulates microglial uptake of modified Aβ species. Glia 2021, 69, 2917–2932. [Google Scholar] [CrossRef]
  128. Das, R.; Balmik, A.A.; Chinnathambi, S. Phagocytosis of full-length Tau oligomers by Actin-remodeling of activated microglia. J. Neuroinflammation 2020, 17, 10. [Google Scholar] [CrossRef] [Green Version]
  129. Freeman, S.A.; Grinstein, S. Phagocytosis: Receptors, signal integration, and the cytoskeleton. Immunol. Rev. 2014, 262, 193–215. [Google Scholar] [CrossRef]
  130. Kono, R.; Ikegaya, Y.; Koyama, R. Phagocytic Glial Cells in Brain Homeostasis. Cells 2021, 10, 1348. [Google Scholar] [CrossRef]
  131. Fountain, A.; Inpanathan, S.; Alves, P.; Verdawala, M.B.; Botelho, R.J. Phagosome maturation in macrophages: Eat, digest, adapt, and repeat. Adv. Biol. Regul. 2021, 82, 100832. [Google Scholar] [CrossRef]
  132. Bhattacherjee, A.; Daskhan, G.C.; Bains, A.; Watson, A.E.S.; Eskandari-Sedighi, G.; St Laurent, C.D.; Voronova, A.; Macauley, M.S. Increasing phagocytosis of microglia by targeting CD33 with liposomes displaying glycan ligands. J. Control. Release 2021, 338, 680–693. [Google Scholar] [CrossRef]
  133. Garcia-Reitboeck, P.; Phillips, A.; Piers, T.M.; Villegas-Llerena, C.; Butler, M.; Mallach, A.; Rodrigues, C.; Arber, C.E.; Heslegrave, A.; Zetterberg, H.; et al. Human Induced Pluripotent Stem Cell-Derived Microglia-Like Cells Harboring TREM2 Missense Mutations Show Specific Deficits in Phagocytosis. Cell Rep. 2018, 24, 2300–2311. [Google Scholar] [CrossRef] [PubMed]
  134. Lee, H.; Flynn, R.; Sharma, I.; Haberman, E.; Carling, P.J.; Nicholls, F.J.; Stegmann, M.; Vowles, J.; Haenseler, W.; Wade-Martins, R.; et al. LRRK2 Is Recruited to Phagosomes and Co-recruits RAB8 and RAB10 in Human Pluripotent Stem Cell-Derived Macrophages. Stem Cell Rep. 2020, 14, 940–955. [Google Scholar] [CrossRef]
  135. Butler, C.A.; Popescu, A.S.; Kitchener, E.J.A.; Allendorf, D.H.; Puigdellívol, M.; Brown, G.C. Microglial phagocytosis of neurons in neurodegeneration, and its regulation. J. Neurochem. 2021, 158, 621–639. [Google Scholar] [CrossRef]
  136. Neniskyte, U.; Neher, J.J.; Brown, G.C. Neuronal death induced by nanomolar amyloid β is mediated by primary phagocytosis of neurons by microglia. J. Biol. Chem. 2011, 286, 39904–39913. [Google Scholar] [CrossRef] [PubMed] [Green Version]
  137. Muth, C.; Hartmann, A.; Sepulveda-Falla, D.; Glatzel, M.; Krasemann, S. Phagocytosis of Apoptotic Cells Is Specifically Upregulated in ApoE4 Expressing Microglia in vitro. Front. Cell Neurosci. 2019, 13, 181. [Google Scholar] [CrossRef] [PubMed]
  138. Hall-Roberts, H.; Agarwal, D.; Obst, J.; Smith, T.B.; Monzón-Sandoval, J.; Di Daniel, E.; Webber, C.; James, W.S.; Mead, E.; Davis, J.B.; et al. TREM2 Alzheimer’s variant R47H causes similar transcriptional dysregulation to knockout, yet only subtle functional phenotypes in human iPSC-derived macrophages. Alzheimers Res. Ther. 2020, 12, 151. [Google Scholar] [CrossRef]
  139. Atagi, Y.; Liu, C.C.; Painter, M.M.; Chen, X.F.; Verbeeck, C.; Zheng, H.; Li, X.; Rademakers, R.; Kang, S.S.; Xu, H.; et al. Apolipoprotein E Is a Ligand for Triggering Receptor Expressed on Myeloid Cells 2 (TREM2). J. Biol. Chem. 2015, 290, 26043–26050. [Google Scholar] [CrossRef] [Green Version]
  140. Takahashi, K.; Rochford, C.D.; Neumann, H. Clearance of apoptotic neurons without inflammation by microglial triggering receptor expressed on myeloid cells-2. J. Exp. Med. 2005, 201, 647–657. [Google Scholar] [CrossRef] [Green Version]
  141. Kawabori, M.; Kacimi, R.; Kauppinen, T.; Calosing, C.; Kim, J.Y.; Hsieh, C.L.; Nakamura, M.C.; Yenari, M.A. Triggering receptor expressed on myeloid cells 2 (TREM2) deficiency attenuates phagocytic activities of microglia and exacerbates ischemic damage in experimental stroke. J. Neurosci. 2015, 35, 3384–3396. [Google Scholar] [CrossRef] [Green Version]
  142. Rios-Doria, J.; Favata, M.; Lasky, K.; Feldman, P.; Lo, Y.; Yang, G.; Stevens, C.; Wen, X.; Sehra, S.; Katiyar, K.; et al. A Potent and Selective Dual Inhibitor of AXL and MERTK Possesses Both Immunomodulatory and Tumor-Targeted Activity. Front. Oncol. 2020, 10, 598477. [Google Scholar] [CrossRef]
  143. Reichert, F.; Rotshenker, S. Complement-receptor-3 and scavenger-receptor-AI/II mediated myelin phagocytosis in microglia and macrophages. Neurobiol. Dis. 2003, 12, 65–72. [Google Scholar] [CrossRef]
  144. Andreone, B.J.; Przybyla, L.; Llapashtica, C.; Rana, A.; Davis, S.S.; van Lengerich, B.; Lin, K.; Shi, J.; Mei, Y.; Astarita, G.; et al. Alzheimer’s-associated PLCγ2 is a signaling node required for both TREM2 function and the inflammatory response in human microglia. Nat. Neurosci. 2020, 23, 927–938. [Google Scholar] [CrossRef] [PubMed]
  145. Hendrickx, D.A.; Schuurman, K.G.; van Draanen, M.; Hamann, J.; Huitinga, I. Enhanced uptake of multiple sclerosis-derived myelin by THP-1 macrophages and primary human microglia. J. Neuroinflammation 2014, 11, 64. [Google Scholar] [CrossRef] [Green Version]
  146. Sokolova, D.; Childs, T.; Hong, S. Insight into the role of phosphatidylserine in complement-mediated synapse loss in Alzheimer’s disease. Fac. Rev. 2021, 10, 19. [Google Scholar] [CrossRef] [PubMed]
  147. Weinhard, L.; di Bartolomei, G.; Bolasco, G.; Machado, P.; Schieber, N.L.; Neniskyte, U.; Exiga, M.; Vadisiute, A.; Raggioli, A.; Schertel, A.; et al. Microglia remodel synapses by presynaptic trogocytosis and spine head filopodia induction. Nat. Commun. 2018, 9, 1228. [Google Scholar] [CrossRef] [PubMed] [Green Version]
  148. Gylys, K.H.; Fein, J.A.; Yang, F.; Cole, G.M. Enrichment of presynaptic and postsynaptic markers by size-based gating analysis of synaptosome preparations from rat and human cortex. Cytom. A 2004, 60, 90–96. [Google Scholar] [CrossRef] [PubMed] [Green Version]
  149. Bido, S.; Muggeo, S.; Massimino, L.; Marzi, M.J.; Giannelli, S.G.; Melacini, E.; Nannoni, M.; Gambarè, D.; Bellini, E.; Ordazzo, G.; et al. Microglia-specific overexpression of α-synuclein leads to severe dopaminergic neurodegeneration by phagocytic exhaustion and oxidative toxicity. Nat. Commun. 2021, 12, 6237. [Google Scholar] [CrossRef]
  150. Sellgren, C.M.; Sheridan, S.D.; Gracias, J.; Xuan, D.; Fu, T.; Perlis, R.H. Patient-specific models of microglia-mediated engulfment of synapses and neural progenitors. Mol. Psychiatry 2017, 22, 170–177. [Google Scholar] [CrossRef] [Green Version]
  151. Benetatos, J.; Bennett, R.E.; Evans, H.T.; Ellis, S.A.; Hyman, B.T.; Bodea, L.G.; Götz, J. PTEN activation contributes to neuronal and synaptic engulfment by microglia in tauopathy. Acta Neuropathol. 2020, 140, 7–24. [Google Scholar] [CrossRef] [Green Version]
  152. Marschallinger, J.; Iram, T.; Zardeneta, M.; Lee, S.E.; Lehallier, B.; Haney, M.S.; Pluvinage, J.V.; Mathur, V.; Hahn, O.; Morgens, D.W.; et al. Lipid-droplet-accumulating microglia represent a dysfunctional and proinflammatory state in the aging brain. Nat. Neurosci. 2020, 23, 194–208. [Google Scholar] [CrossRef]
  153. Bohlen, C.J.; Bennett, F.C.; Tucker, A.F.; Collins, H.Y.; Mulinyawe, S.B.; Barres, B.A. Diverse Requirements for Microglial Survival, Specification, and Function Revealed by Defined-Medium Cultures. Neuron 2017, 94, 759–773.e8. [Google Scholar] [CrossRef] [PubMed]
  154. Hall-Roberts, H.; Di Daniel, E.; James, W.S.; Davis, J.B.; Cowley, S.A. In Vitro Quantitative Imaging Assay for Phagocytosis of Dead Neuroblastoma Cells by iPSC-Macrophages. J. Vis. Exp. 2021, 168, e62217. [Google Scholar] [CrossRef] [PubMed]
  155. Gu, B.J.; Sun, C.; Fuller, S.; Skarratt, K.K.; Petrou, S.; Wiley, J.S. A quantitative method for measuring innate phagocytosis by human monocytes using real-time flow cytometry. Cytom. A 2014, 85, 313–321. [Google Scholar] [CrossRef]
  156. Caldeira, C.; Oliveira, A.F.; Cunha, C.; Vaz, A.R.; Falcão, A.S.; Fernandes, A.; Brites, D. Microglia change from a reactive to an age-like phenotype with the time in culture. Front. Cell Neurosci. 2014, 8, 152. [Google Scholar] [CrossRef] [PubMed]
  157. Miksa, M.; Komura, H.; Wu, R.; Shah, K.G.; Wang, P. A novel method to determine the engulfment of apoptotic cells by macrophages using pHrodo succinimidyl ester. J. Immunol. Methods 2009, 342, 71–77. [Google Scholar] [CrossRef] [PubMed] [Green Version]
  158. Nunes-Hasler, P.; Maschalidi, S.; Lippens, C.; Castelbou, C.; Bouvet, S.; Guido, D.; Bermont, F.; Bassoy, E.Y.; Page, N.; Merkler, D.; et al. STIM1 promotes migration, phagosomal maturation and antigen cross-presentation in dendritic cells. Nat. Commun. 2017, 8, 1852. [Google Scholar] [CrossRef] [Green Version]
  159. Nuutila, J.; Lilius, E.M. Flow cytometric quantitative determination of ingestion by phagocytes needs the distinguishing of overlapping populations of binding and ingesting cells. Cytom. A 2005, 65, 93–102. [Google Scholar] [CrossRef] [PubMed]
  160. Madry, C.; Kyrargyri, V.; Arancibia-Cárcamo, I.L.; Jolivet, R.; Kohsaka, S.; Bryan, R.M.; Attwell, D. Microglial Ramification, Surveillance, and Interleukin-1β Release Are Regulated by the Two-Pore Domain K(+) Channel THIK-1. Neuron 2018, 97, 299–312.e6. [Google Scholar] [CrossRef]
  161. Frow, E.K.; Reckless, J.; Grainger, D.J. Tools for anti-inflammatory drug design: In vitro models of leukocyte migration. Med. Res. Rev. 2004, 24, 276–298. [Google Scholar] [CrossRef]
  162. Kettenmann, H.; Hanisch, U.K.; Noda, M.; Verkhratsky, A. Physiology of microglia. Physiol. Rev. 2011, 91, 461–553. [Google Scholar] [CrossRef]
  163. Miller, E.B.; Zhang, P.; Ching, K.; Pugh, E.N., Jr.; Burns, M.E. In vivo imaging reveals transient microglia recruitment and functional recovery of photoreceptor signaling after injury. Proc. Natl. Acad. Sci. USA 2019, 116, 16603–16612. [Google Scholar] [CrossRef] [PubMed]
  164. Isfort, K.; Ebert, F.; Bornhorst, J.; Sargin, S.; Kardakaris, R.; Pasparakis, M.; Bähler, M.; Schwerdtle, T.; Schwab, A.; Hanley, P.J. Real-time imaging reveals that P2Y2 and P2Y12 receptor agonists are not chemoattractants and macrophage chemotaxis to complement C5a is phosphatidylinositol 3-kinase (PI3K)- and p38 mitogen-activated protein kinase (MAPK)-independent. J. Biol. Chem. 2011, 286, 44776–44787. [Google Scholar] [CrossRef] [PubMed] [Green Version]
  165. Rumianek, A.N.; Greaves, D.R. How Have Leukocyte In Vitro Chemotaxis Assays Shaped Our Ideas about Macrophage Migration? Biology 2020, 9, 439. [Google Scholar] [CrossRef] [PubMed]
  166. Honda, S.; Sasaki, Y.; Ohsawa, K.; Imai, Y.; Nakamura, Y.; Inoue, K.; Kohsaka, S. Extracellular ATP or ADP induce chemotaxis of cultured microglia through Gi/o-coupled P2Y receptors. J. Neurosci. 2001, 21, 1975–1982. [Google Scholar] [CrossRef] [Green Version]
  167. Cho, H.; Hashimoto, T.; Wong, E.; Hori, Y.; Wood, L.B.; Zhao, L.; Haigis, K.M.; Hyman, B.T.; Irimia, D. Microfluidic chemotaxis platform for differentiating the roles of soluble and bound amyloid-β on microglial accumulation. Sci. Rep. 2013, 3, 1823. [Google Scholar] [CrossRef] [Green Version]
  168. Lelli, A.; Gervais, A.; Colin, C.; Chéret, C.; Ruiz de Almodovar, C.; Carmeliet, P.; Krause, K.H.; Boillée, S.; Mallat, M. The NADPH oxidase Nox2 regulates VEGFR1/CSF-1R-mediated microglial chemotaxis and promotes early postnatal infiltration of phagocytes in the subventricular zone of the mouse cerebral cortex. Glia 2013, 61, 1542–1555. [Google Scholar] [CrossRef]
  169. Zhang, J.; Gong, X.; Xiong, H. Significant higher-level C-C motif chemokine ligand 2/3 and chemotactic power in cerebral white matter than grey matter in rat and human. Eur. J. Neurosci. 2021, 54, 4088–4100. [Google Scholar] [CrossRef]
  170. Das, R.; Chinnathambi, S. Microglial remodeling of actin network by Tau oligomers, via G protein-coupled purinergic receptor, P2Y12R-driven chemotaxis. Traffic 2021, 22, 153–170. [Google Scholar] [CrossRef]
  171. Wang, S.; Chu, C.H.; Stewart, T.; Ginghina, C.; Wang, Y.; Nie, H.; Guo, M.; Wilson, B.; Hong, J.S.; Zhang, J. α-Synuclein, a chemoattractant, directs microglial migration via H2O2-dependent Lyn phosphorylation. Proc. Natl. Acad. Sci. USA 2015, 112, E1926–E1935. [Google Scholar] [CrossRef] [Green Version]
  172. Ryu, J.K.; Cho, T.; Choi, H.B.; Wang, Y.T.; McLarnon, J.G. Microglial VEGF receptor response is an integral chemotactic component in Alzheimer’s disease pathology. J. Neurosci. 2009, 29, 3–13. [Google Scholar] [CrossRef] [Green Version]
  173. Haenseler, W.; Sansom, S.N.; Buchrieser, J.; Newey, S.E.; Moore, C.S.; Nicholls, F.J.; Chintawar, S.; Schnell, C.; Antel, J.P.; Allen, N.D.; et al. A Highly Efficient Human Pluripotent Stem Cell Microglia Model Displays a Neuronal-Co-culture-Specific Expression Profile and Inflammatory Response. Stem Cell Rep. 2017, 8, 1727–1742. [Google Scholar] [CrossRef]
  174. Kyrargyri, V.; Attwell, D.; Jolivet, R.B.; Madry, C. Analysis of Signaling Mechanisms Regulating Microglial Process Movement. Methods Mol. Biol. 2019, 2034, 191–205. [Google Scholar] [CrossRef] [PubMed]
  175. Hefendehl, J.K.; Neher, J.J.; Sühs, R.B.; Kohsaka, S.; Skodras, A.; Jucker, M. Homeostatic and injury-induced microglia behavior in the aging brain. Aging Cell 2014, 13, 60–69. [Google Scholar] [CrossRef] [PubMed]
  176. Jairaman, A.; McQuade, A.; Granzotto, A.; Kang, Y.J.; Chadarevian, J.P.; Gandhi, S.; Parker, I.; Smith, I.; Cho, H.; Sensi, S.L.; et al. TREM2 regulates purinergic receptor-mediated calcium signaling and motility in human iPSC-derived microglia. Elife 2022, 11, e73021. [Google Scholar] [CrossRef] [PubMed]
  177. Liang, C.C.; Park, A.Y.; Guan, J.L. In vitro scratch assay: A convenient and inexpensive method for analysis of cell migration in vitro. Nat. Protoc. 2007, 2, 329–333. [Google Scholar] [CrossRef] [PubMed] [Green Version]
  178. Robichon, K.; Patel, V.; Connor, B.; La Flamme, A.C. Clozapine reduces infiltration into the CNS by targeting migration in experimental autoimmune encephalomyelitis. J. Neuroinflammation 2020, 17, 53. [Google Scholar] [CrossRef] [Green Version]
  179. Fairley, L.H.; Wong, J.H.; Barron, A.M. Mitochondrial Regulation of Microglial Immunometabolism in Alzheimer’s Disease. Front. Immunol. 2021, 12, 624538. [Google Scholar] [CrossRef]
  180. Culmsee, C.; Michels, S.; Scheu, S.; Arolt, V.; Dannlowski, U.; Alferink, J. Mitochondria, Microglia, and the Immune System-How Are They Linked in Affective Disorders? Front. Psychiatry 2018, 9, 739. [Google Scholar] [CrossRef] [Green Version]
  181. Devanney, N.A.; Stewart, A.N.; Gensel, J.C. Microglia and macrophage metabolism in CNS injury and disease: The role of immunometabolism in neurodegeneration and neurotrauma. Exp. Neurol. 2020, 329, 113310. [Google Scholar] [CrossRef]
  182. Pereira, O.R., Jr.; Ramos, V.M.; Cabral-Costa, J.V.; Kowaltowski, A.J. Changes in mitochondrial morphology modulate LPS-induced loss of calcium homeostasis in BV-2 microglial cells. J. Bioenerg. Biomembr. 2021, 53, 109–118. [Google Scholar] [CrossRef]
  183. Park, J.; Choi, H.; Kim, B.; Chae, U.; Lee, D.G.; Lee, S.R.; Lee, S.; Lee, H.S.; Lee, D.S. Peroxiredoxin 5 (Prx5) decreases LPS-induced microglial activation through regulation of Ca(2+)/calcineurin-Drp1-dependent mitochondrial fission. Free Radic. Biol. Med. 2016, 99, 392–404. [Google Scholar] [CrossRef]
  184. Park, J.; Choi, H.; Min, J.S.; Park, S.J.; Kim, J.H.; Park, H.J.; Kim, B.; Chae, J.I.; Yim, M.; Lee, D.S. Mitochondrial dynamics modulate the expression of pro-inflammatory mediators in microglial cells. J. Neurochem. 2013, 127, 221–232. [Google Scholar] [CrossRef] [PubMed]
  185. Ghosh, S.; Castillo, E.; Frias, E.S.; Swanson, R.A. Bioenergetic regulation of microglia. Glia 2018, 66, 1200–1212. [Google Scholar] [CrossRef] [PubMed]
  186. Zhang, Y.; Chen, K.; Sloan, S.A.; Bennett, M.L.; Scholze, A.R.; O’Keeffe, S.; Phatnani, H.P.; Guarnieri, P.; Caneda, C.; Ruderisch, N.; et al. An RNA-sequencing transcriptome and splicing database of glia, neurons, and vascular cells of the cerebral cortex. J. Neurosci. 2014, 34, 11929–11947. [Google Scholar] [CrossRef] [PubMed] [Green Version]
  187. Piers, T.M.; Cosker, K.; Mallach, A.; Johnson, G.T.; Guerreiro, R.; Hardy, J.; Pocock, J.M. A locked immunometabolic switch underlies TREM2 R47H loss of function in human iPSC-derived microglia. FASEB J. 2020, 34, 2436–2450. [Google Scholar] [CrossRef] [Green Version]
  188. Kalsbeek, M.J.; Mulder, L.; Yi, C.X. Microglia energy metabolism in metabolic disorder. Mol. Cell Endocrinol. 2016, 438, 27–35. [Google Scholar] [CrossRef]
  189. Sasaki, A.; Yamaguchi, H.; Horikoshi, Y.; Tanaka, G.; Nakazato, Y. Expression of glucose transporter 5 by microglia in human gliomas. Neuropathol. Appl. Neurobiol. 2004, 30, 447–455. [Google Scholar] [CrossRef]
  190. Brusco, J.; Haas, K. Interactions between mitochondria and the transcription factor myocyte enhancer factor 2 (MEF2) regulate neuronal structural and functional plasticity and metaplasticity. J. Physiol. 2015, 593, 3471–3481. [Google Scholar] [CrossRef] [Green Version]
  191. Geng, J.; Sun, X.; Wang, P.; Zhang, S.; Wang, X.; Wu, H.; Hong, L.; Xie, C.; Li, X.; Zhao, H.; et al. Kinases Mst1 and Mst2 positively regulate phagocytic induction of reactive oxygen species and bactericidal activity. Nat. Immunol. 2015, 16, 1142–1152. [Google Scholar] [CrossRef] [Green Version]
  192. Mills, E.L.; Kelly, B.; Logan, A.; Costa, A.S.H.; Varma, M.; Bryant, C.E.; Tourlomousis, P.; Däbritz, J.H.M.; Gottlieb, E.; Latorre, I.; et al. Succinate Dehydrogenase Supports Metabolic Repurposing of Mitochondria to Drive Inflammatory Macrophages. Cell 2016, 167, 457–470.e13. [Google Scholar] [CrossRef] [Green Version]
  193. Nair, S.; Sobotka, K.S.; Joshi, P.; Gressens, P.; Fleiss, B.; Thornton, C.; Mallard, C.; Hagberg, H. Lipopolysaccharide-induced alteration of mitochondrial morphology induces a metabolic shift in microglia modulating the inflammatory response in vitro and in vivo. Glia 2019, 67, 1047–1061. [Google Scholar] [CrossRef] [PubMed]
  194. Lin, M.M.; Liu, N.; Qin, Z.H.; Wang, Y. Mitochondrial-derived damage-associated molecular patterns amplify neuroinflammation in neurodegenerative diseases. Acta Pharmacol. Sin. 2022, 43, 2439–2447. [Google Scholar] [CrossRef]
  195. Voss, K.; Hong, H.S.; Bader, J.E.; Sugiura, A.; Lyssiotis, C.A.; Rathmell, J.C. A guide to interrogating immunometabolism. Nat. Rev. Immunol. 2021, 21, 637–652. [Google Scholar] [CrossRef] [PubMed]
  196. Mookerjee, S.A.; Gerencser, A.A.; Nicholls, D.G.; Brand, M.D. Quantifying intracellular rates of glycolytic and oxidative ATP production and consumption using extracellular flux measurements. J. Biol. Chem. 2017, 292, 7189–7207. [Google Scholar] [CrossRef] [PubMed] [Green Version]
  197. Connolly, N.M.C.; Theurey, P.; Adam-Vizi, V.; Bazan, N.G.; Bernardi, P.; Bolaños, J.P.; Culmsee, C.; Dawson, V.L.; Deshmukh, M.; Duchen, M.R.; et al. Guidelines on experimental methods to assess mitochondrial dysfunction in cellular models of neurodegenerative diseases. Cell Death Differ. 2018, 25, 542–572. [Google Scholar] [CrossRef] [Green Version]
  198. Scaduto, R.C., Jr.; Grotyohann, L.W. Measurement of mitochondrial membrane potential using fluorescent rhodamine derivatives. Biophys. J. 1999, 76, 469–477. [Google Scholar] [CrossRef] [Green Version]
  199. Glancy, B.; Kim, Y.; Katti, P.; Willingham, T.B. The Functional Impact of Mitochondrial Structure Across Subcellular Scales. Front. Physiol. 2020, 11, 541040. [Google Scholar] [CrossRef]
Figure 1. Overview of arrays for quantifying cytokine release. (A) ELISA: a 96 well plate is coated with a capture antibody specific to an antigen within the protein of interest, e.g., one specific cytokine/chemokine. Next, staining with another antibody that binds to the protein of interest and that is conjugated to an enzyme (e.g., streptavidin/biotin) allows detection/quantification of protein (Kohl and Ascoli, 2017). (B) Chemiluminescence arrays: multiple specific biotin-conjugated detection antibodies are added to each well, thus allowing quantification of multiple cytokines following the addition of horseradish peroxidase-conjugated streptavidin and measurement of luminescence. (C) Electrochemiluminescence arrays: each detection antibody, instead of being conjugated to biotin, is conjugated to a proprietary tag that is excited with emission beams in the electric field. (D) Bead based multiplex arrays: use proprietary bead sets that can be distinguished from each other via flow cytometry (due to varying size/fluorescence of bead types). Each type of bead comes conjugated to an antibody specific to one of the proteins of interest. Next, either streptavidin or fluorescence labelled antibodies are added that bind specifically to each cytokine-antibody complex on the bead sets. Using a flow cytometer, up to 25 cytokines in the same sample can be measured with commercial kits; or up to 100 with custom-conjugation [84].
Cells 11 03414 g001
Figure 2. Schematic of methods for assaying endocytosis and phagocytosis. (A,B) Pathways and cargoes of endocytosis. The size of particle determines the pathway utilised, indicated by colour on the schematic. Clathrin-mediated endocytosis (<120 nm) is shown in orange. Macropinocytosis (>200 nm) is shown in yellow. Phagocytosis (>500 nm) is shown in pink. (C) Inhibitors used in endocytic assays. (D) Mechanisms of endocytic pathways. Blue indicates relative acidity of compartments. The lysosome is pH 4.5–5.0. Endosomal protein biomarkers are also indicated.
Cells 11 03414 g002
Figure 3. Transwell assay workflow. Microglia are seeded into transwells and can be left to adhere to the membrane for up to 30 min. A defined chemoattractant is then added to the bottom chamber and microglia are allowed to migrate through the membrane for a defined timespan. Cells are fixed and stained. Light microscopy at a low magnification is used to image the inserts allowing visualization of all cells either side of the membrane. The inserts are then swabbed on the top side with a cotton wool bud to remove the unmigrated cells, and imaged again to visualise migrated cells only. Image analysis software is used to count cells, and the result is expressed as a ratio or percentage of migrated cells (after swabbing) relative to the total cell population (before swabbing).
Cells 11 03414 g003
Table 1. Common microglia identity markers. TMEM119—Transmembrane protein 119; IBA1—Ionized calcium binding adaptor molecule 1; P2RY12—P2Y Purinergic receptor 12; CD11B—Cluster of differentiation 11B; CD45—Cluster of differentiation 45; CD68—Cluster of differentiation 68; TREM2—Triggering receptor expressed on myeloid cells 2; PU.1—Transcription factor PU.1; C1QA—Complement Component 1 subunit Q A chain; GPR34—G protein coupled receptor 34; MERTK—MER proto oncogene tyrosine kinase; CX3CR1—C-X3-C chemokine receptor 1; SALL1—Sal like protein 1; GLUT5—Glucose transporter 5; GAS6—Growth arrest specific 6; CD14—Cluster of differentiation 14.
MarkerFunctionExpression in CNS Cell Types and Microglial ModelsExpression after Proinflammatory StimulationReferences
TMEM119Currently uncertainMicroglia. Highly conserved. Low mRNA in some iPS models.Downregulated[26,30,39]
IBA1Binds calcium and actin supporting the cytoskeleton and membrane rufflingMicroglia.Upregulated[40]
P2RY12Detects nucleotides such a ATP following injuryMicroglia and oligodendrocyte precursor cells. Low mRNA in some iPS models.Downregulated[26,38,41]
CD11BAn integrin for complement receptor 3 (CR3), used for phagocytosis of complement-coated cargoMicroglia. Some have shown to be absent on the HMC3 cell line.Upregulated[34,42,43]
CD45Receptor protein tyrosine phosphate involved with T cell signalling and proliferationMicroglia.Upregulated[34,35]
CD68Lysosomal markerMicroglia. Some have shown to be absent on the HMC3 cell line.Unchanged[26,42,44]
TREM2Key in development and maintenance of the brain with a role in synaptic pruning and
immune response
Microglia.Downregulated[34,39,45,46]
PU.1Transcription factor determining myeloid lineageMicroglia.Unchanged[47]
C1QAOpsonin that triggers the classical complement cascadeMicroglia.Upregulated[26,48]
MERTKTransduces signals, involved in cell survival,
migration and phagocytosis
Microglia, astrocytes, rod
photoreceptor cells and
oligodendrocyte precursor cell.
Downregulated[39,49,50,51]
CX3CR1Involved in the immune response, inflammation, cell adhesion, chemotaxis and migrationMicroglia.Upregulated[26,52]
SALL1Transcriptional master regulator of microglia identity and non-inflammatory functionsMicroglia, oligodendrocytes, and astrocytes.Downregulated[27,39,53]
GLUT5Fructose transporterMicroglia and some neuronal populations.Upregulated[54]
GAS6Simulates cell proliferation and shown to blunt inflammatory response of LPSMicroglia, fibroblasts and
astrocytes.
No information available[55]
CD14Co receptor for TLR4 and TLR7/9Microglia.Upregulated[26,56]
Table 2. Summary of the different techniques used to quantify cytokine release from microglia, as well as pros and cons of each technique and examples of products. ELISA = enzyme-linked immunosorbent assay.
Type of AssayMax Cytokines/AssayProsConsExamples
Double antibody sandwich ELISA1Most widely used & best validated, highly quantitative, reproducibleMeasures only a single
protein/sample, dynamic range narrow in relation to other cytokine assays
R&D Systems® ELISA Kits, Abcam ELISA Kits, Invitrogen ELISA kits
Multiplex chemiluminescent arrays9Efficiency (time & cost), easier to do multiple timepoints, higher dynamic range than
traditional ELISA, less sample needed, allows evaluation of one inflammatory molecule in the context of multiple others
May require specialist paid software to analyse results (e.g., Quansys Q-plex™
requires Q-view software)
Quansys Q-Plex™
(Oxford Biosystems), Luminex® Multiplex Assays (Thermofisher), Multiplex Immunoassays (Bio-Rad)
Multiplex
electrochemiluminescence arrays
10Efficiency (time & cost), lack of enzymatic or
fluorescent detection system avoids
time-dependent signal decay, less sample needed, allows evaluation of one inflammatory molecule in the context of multiple others
Expensive, requires specialist equipmentMeso Scale Discovery (MSD)
Flow cytometric bead-based multiplex arrays100Efficiency (time & cost), compatible with standard flow cytometers, allows evaluation of one inflammatory molecule in the context of multiple others, free analysis software, cheapest method per sample/cytokine, easier to do multiple timepoints, less sample needed Less tested compared to
traditional sandwich ELISA
BD Cytometric Bead Array (BD Biosciences), LEGENDplex™
(BioLegend)
Table 3. Comparing types of instrument used to measure phagocytosis. +: low; ++: medium, +++: high; ID: Instrument-dependent; N/A: not applicable; Y: yes.
Spectro-PhotometerFluorescence
Microscope
(No Automation)
Time-Lapse
Fluorescence
Microscope
High-Content
Imaging System
Flow CytometerImaging Flow Cytometer
Sensitivity+ID+++++++++++
MagnificationN/AID+++++N/A++
Multiple data parameters+ID++++++++
Unbiased data collection+++++++++++++++
Unbiased data analysis+++++++++++++
Speed+++++++++++
Cell viability++++++++++++
Real-time kineticsYN/AYYN/AN/A
Single-cell analysisN/AYIDYYY
Example instrumentSpectraMax
(Molecular Devices)
LSM700 (Zeiss)Incucyte ZOOM (Sartorius)Opera Phenix (Perkin Elmer)FACS Calibur (Becton
Dickinson)
Amnis
ImageStreamX Mk II (Luminex)
Assay references[151][152][153][138,144][133,145][123,137]
Publisher’s Note: MDPI stays neutral with regard to jurisdictional claims in published maps and institutional affiliations.

