
Single Cell Transcriptomics to Understand HSC Heterogeneity and Its Evolution upon Aging

Abstract
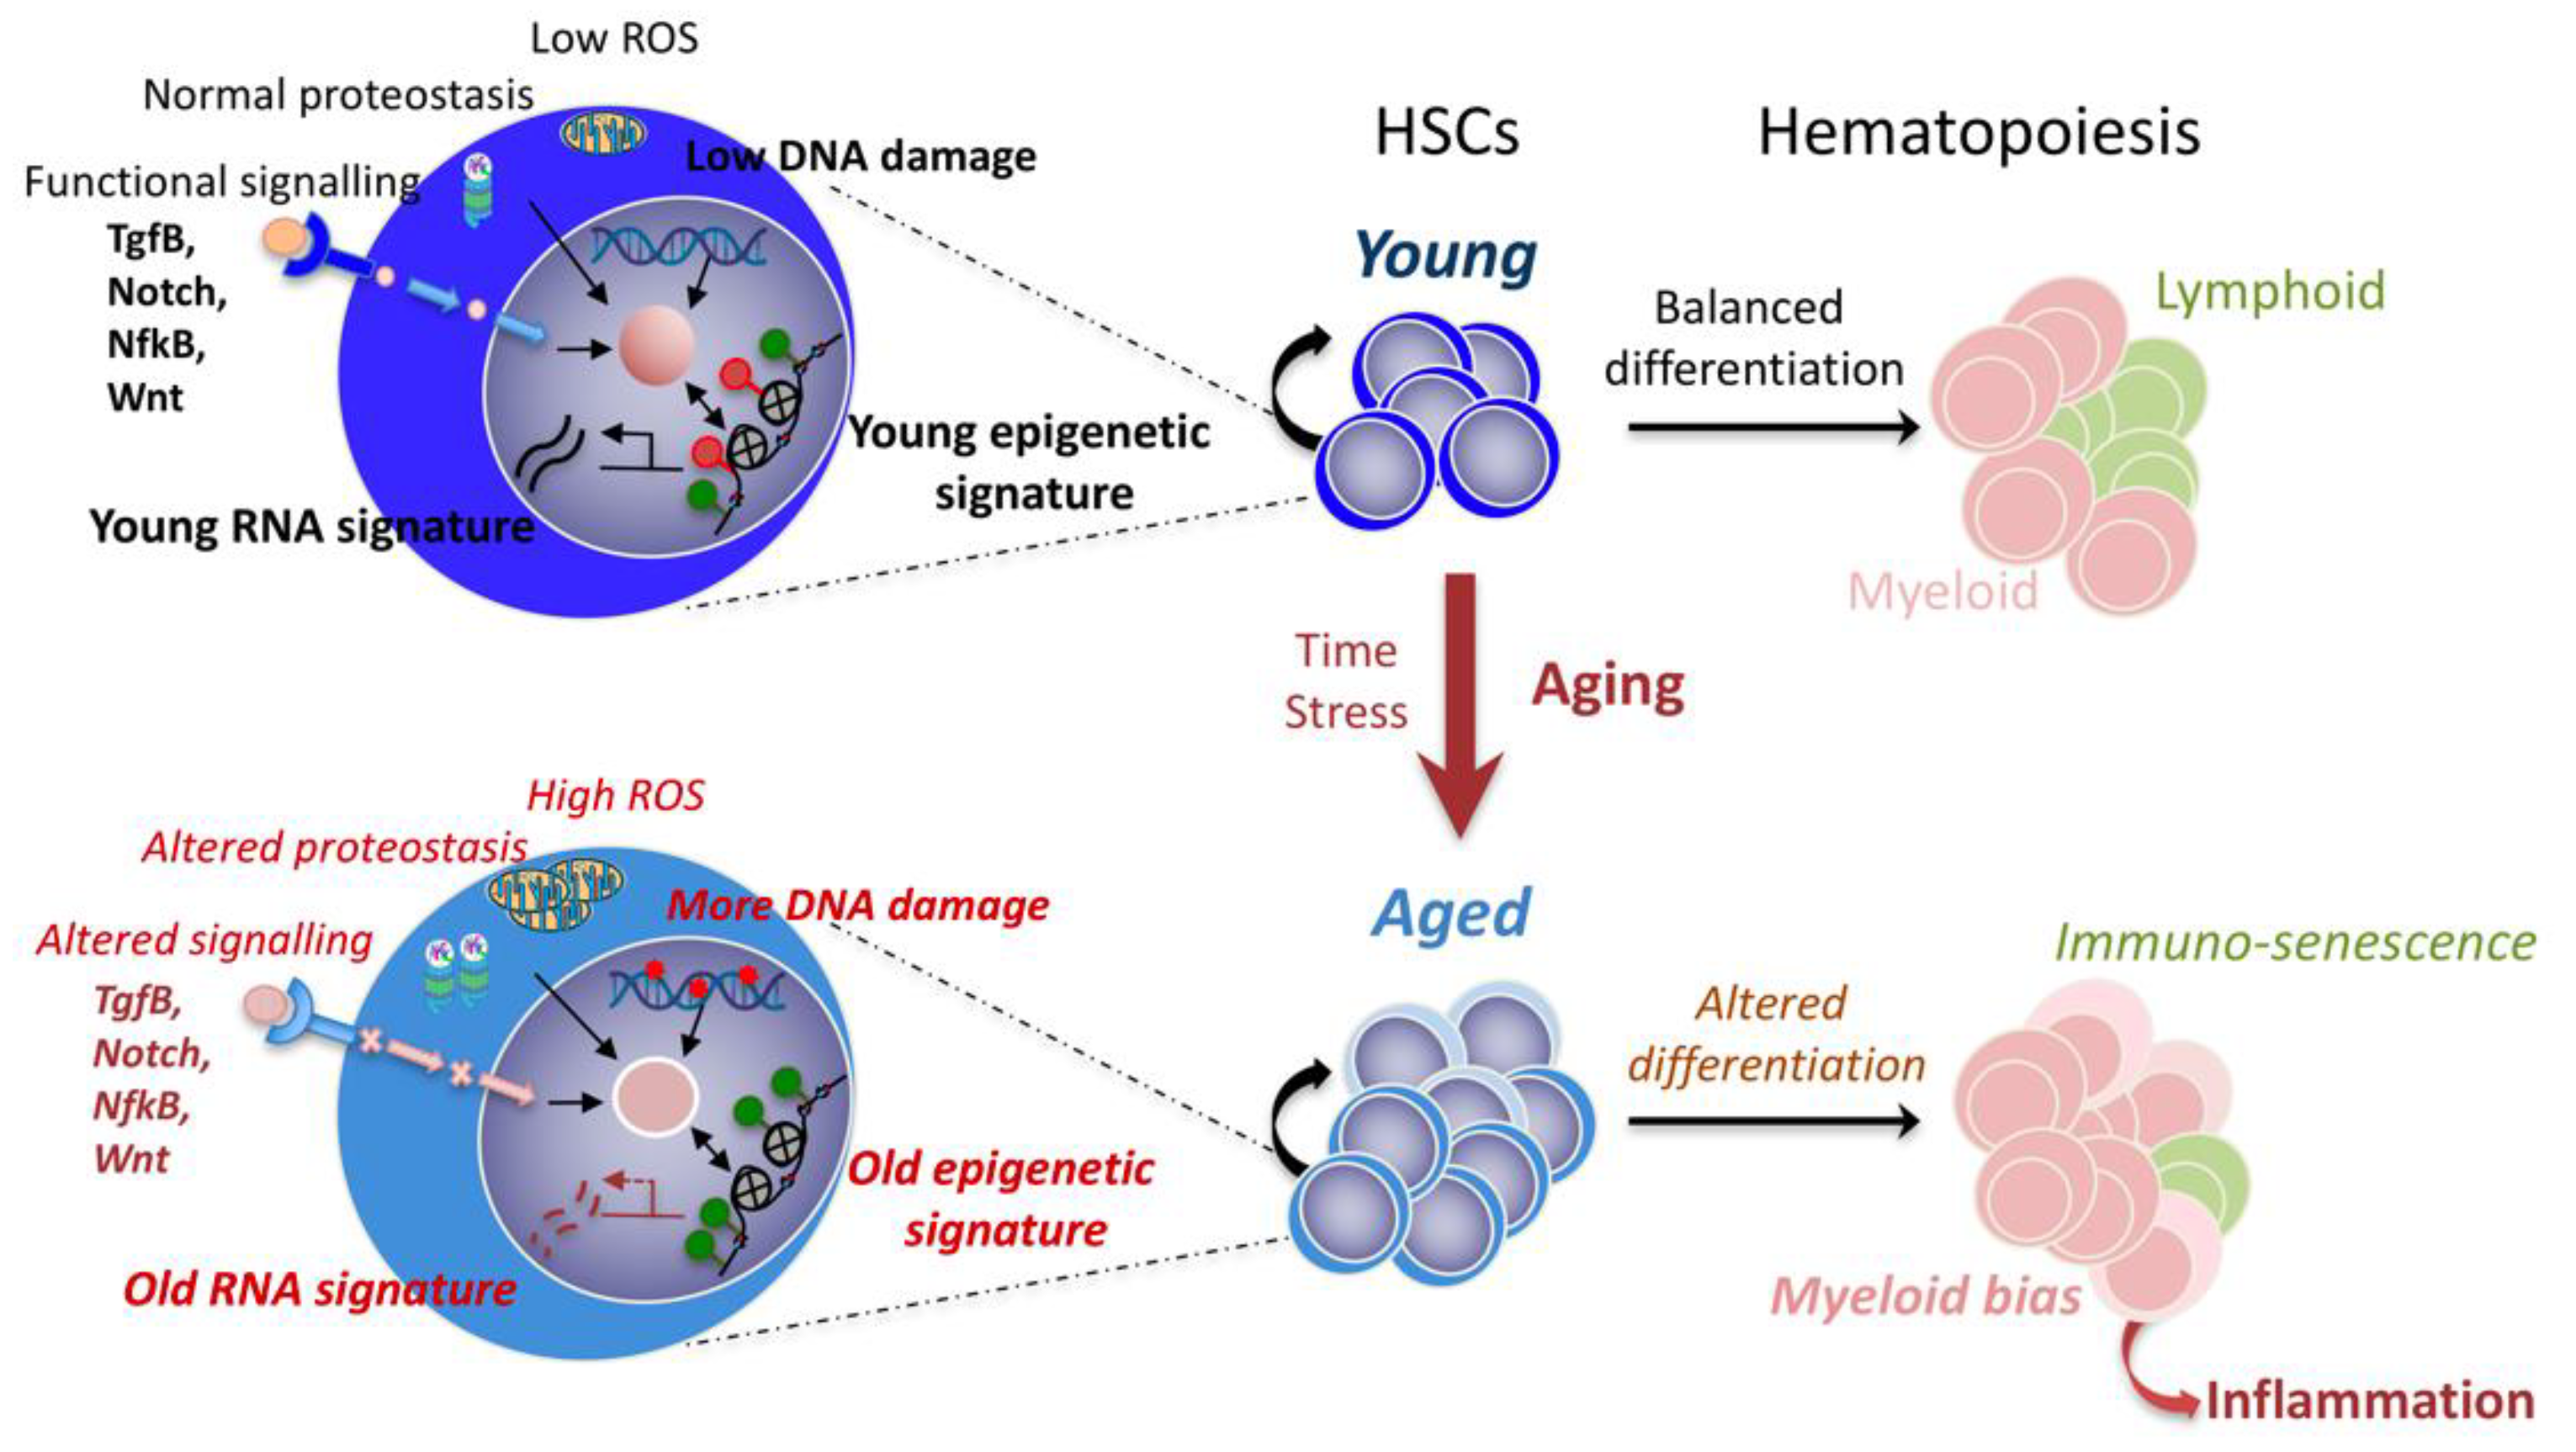
:1. Introduction: Problematic of HSC Aging
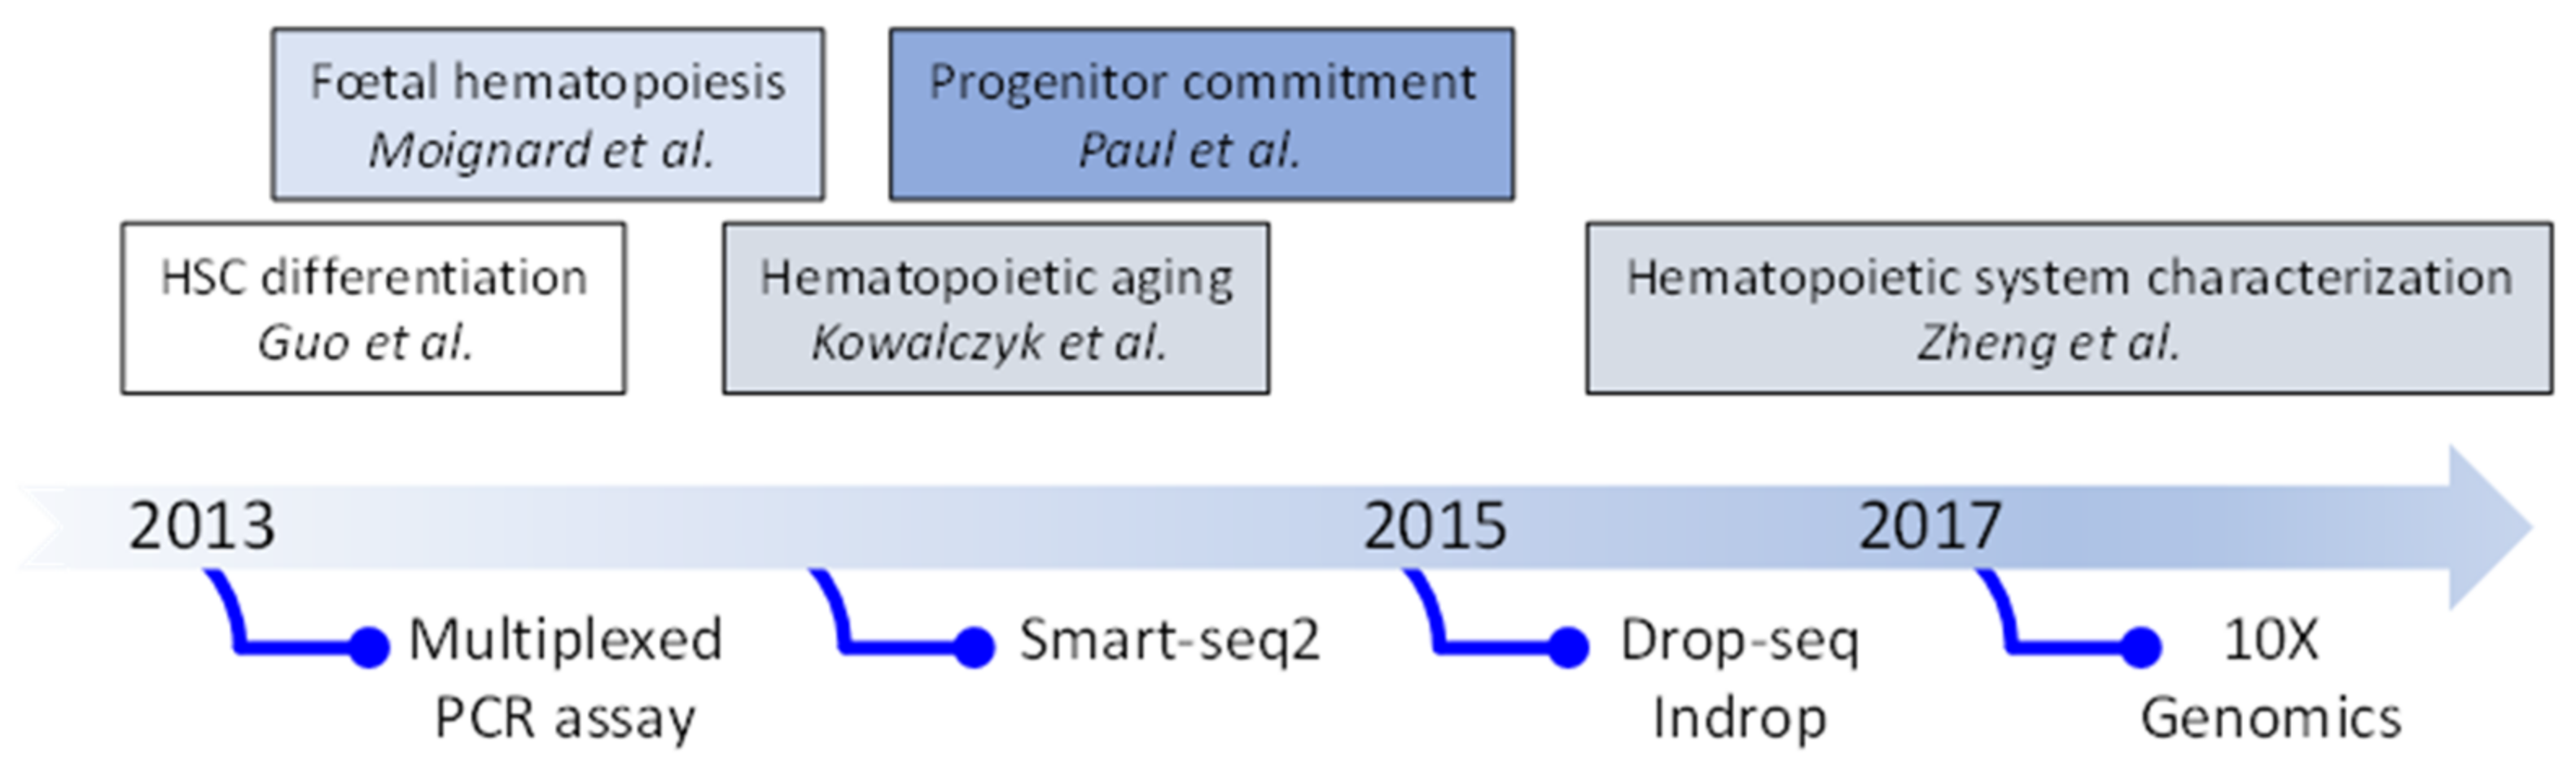
2. Evolution of Single Cell Transcriptomic Studies: From Quantitative PCR (qPCR) to Single-Cell (scRNA-Seq)
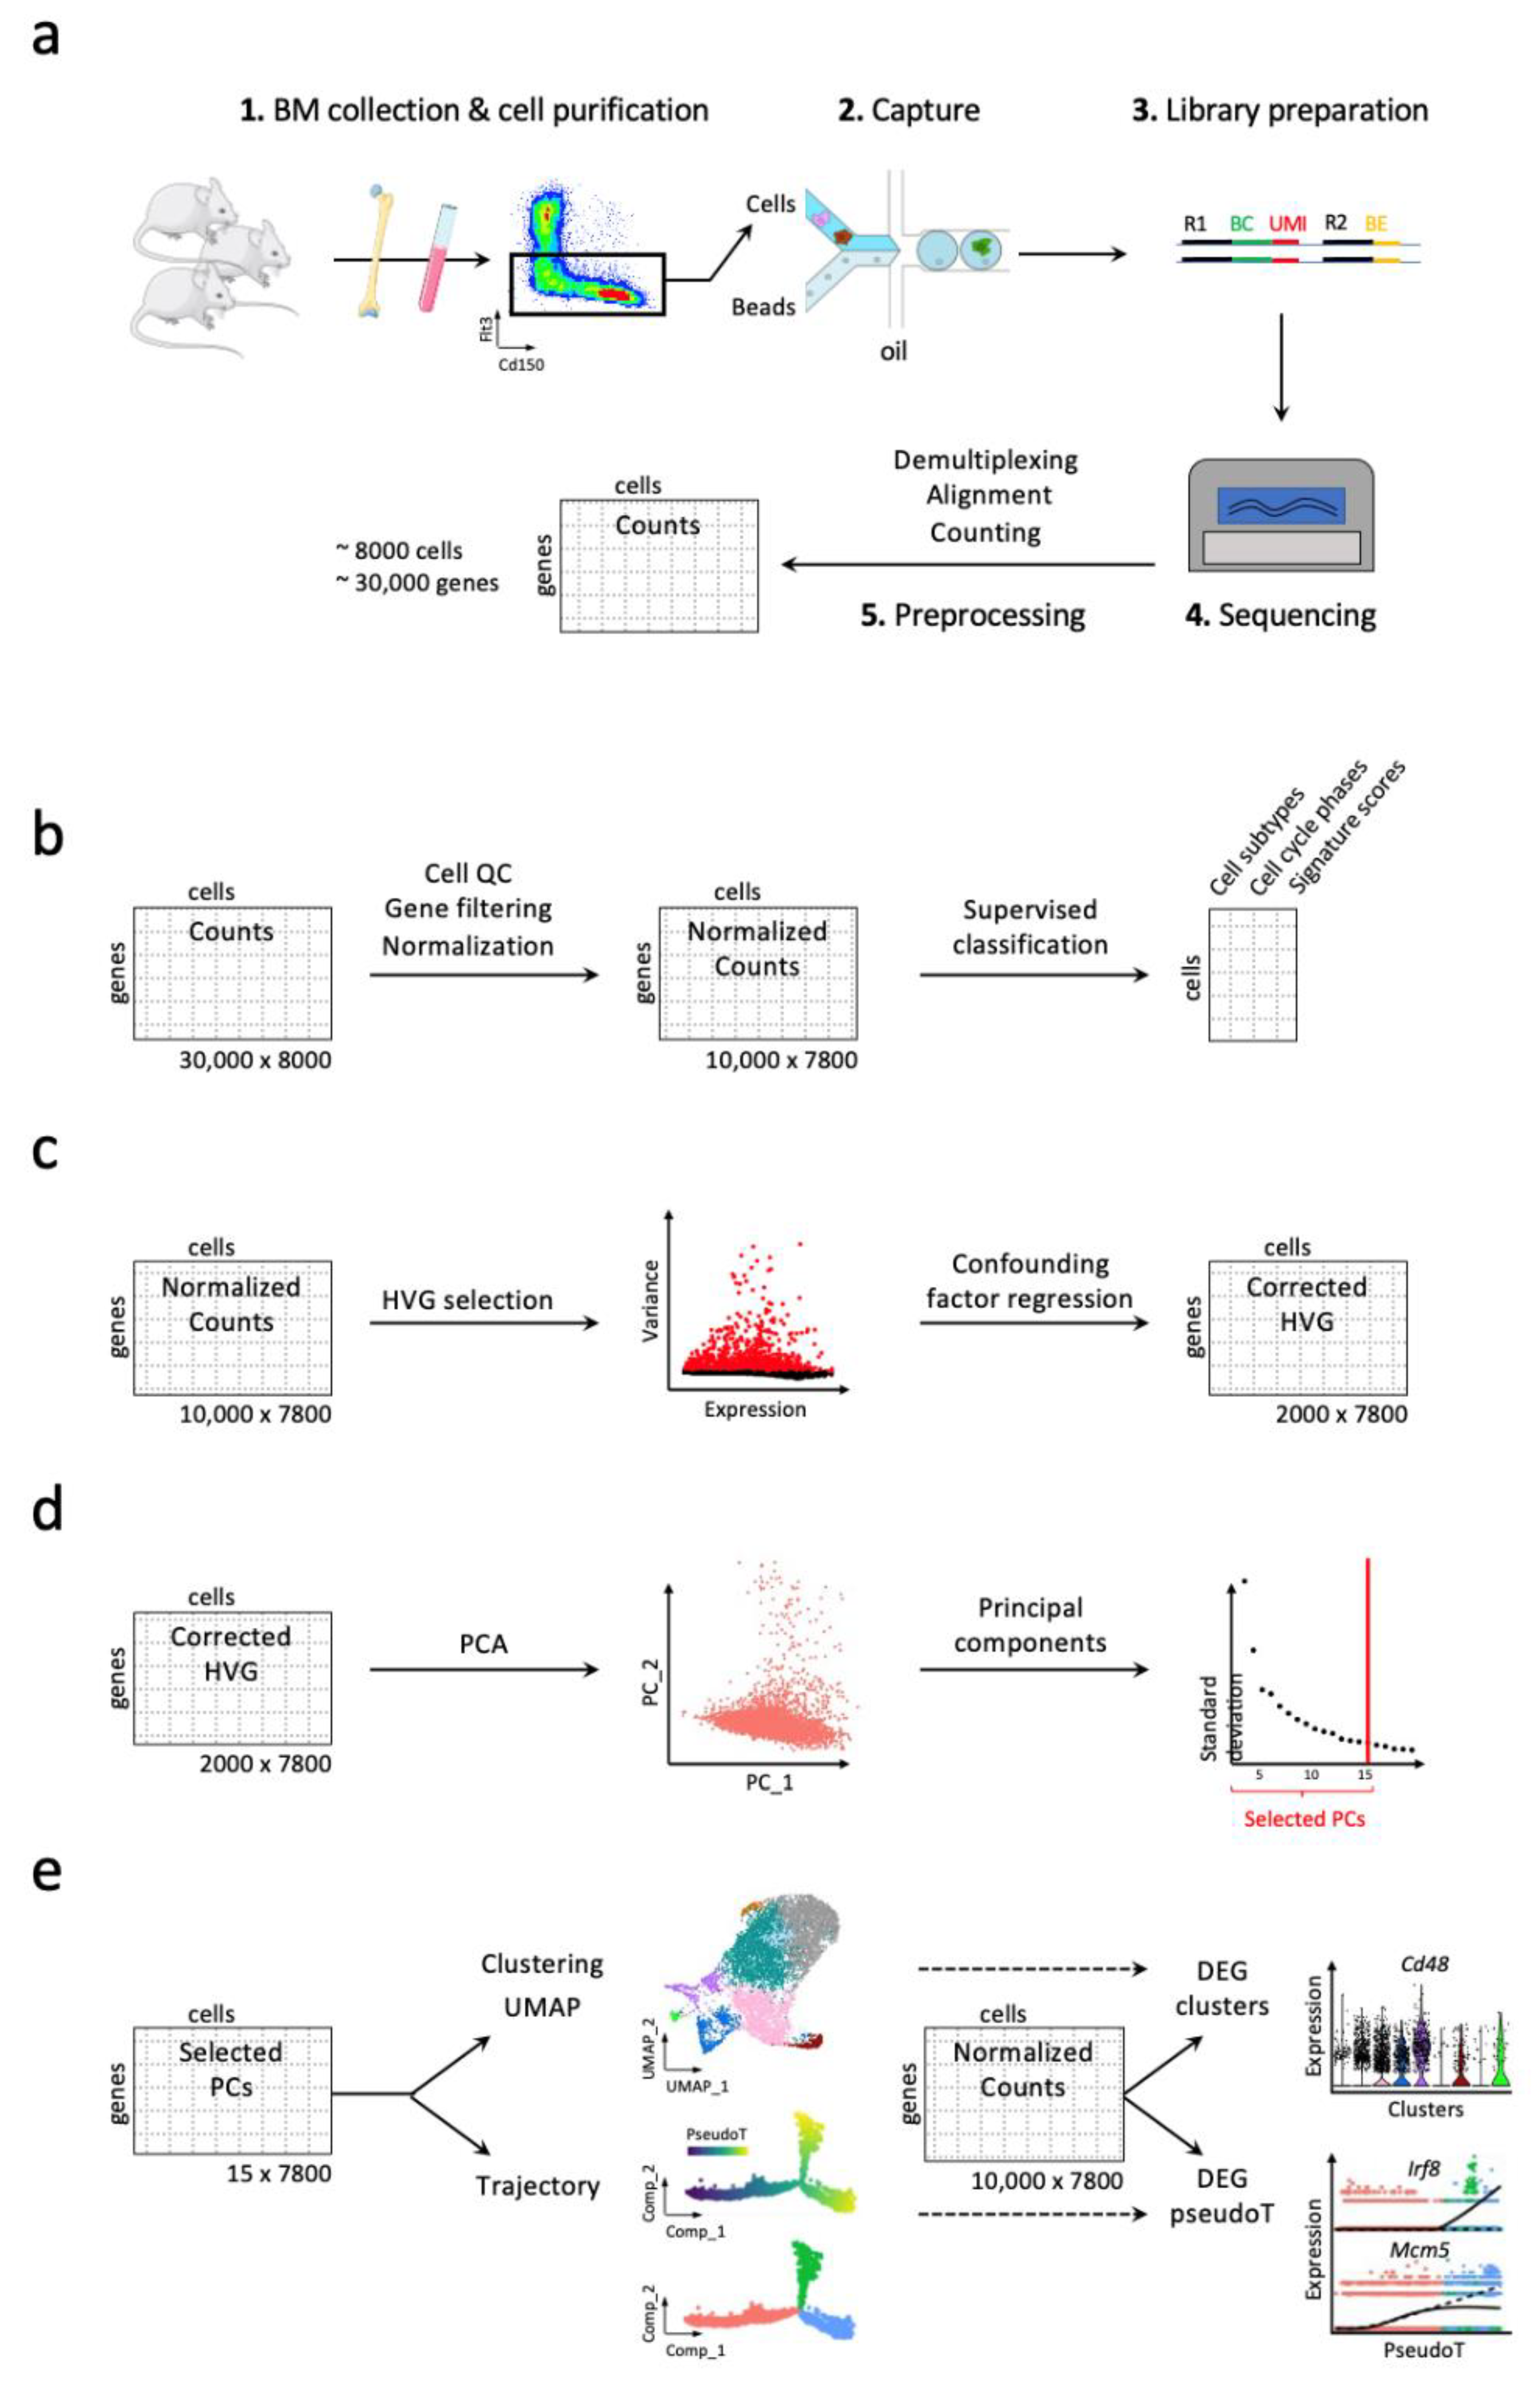
3. Workflow for Studying Hematopoiesis in Mice
3.1. Handling High Dimensionality of Raw scRNA-Seq Data
3.2. Discrete and Continuous Analyses of the Cell Heterogeneity and Gene Marker Identification
3.3. Addressing Batch Effect
4. Understanding HSC Heterogeneity to Grasp Aged HSC Deregulations
5. Coupling the Transcriptome to the Cell Fate
6. Network-Based Dynamic Modeling: A Successful Approach to Decipher Hematopoiesis
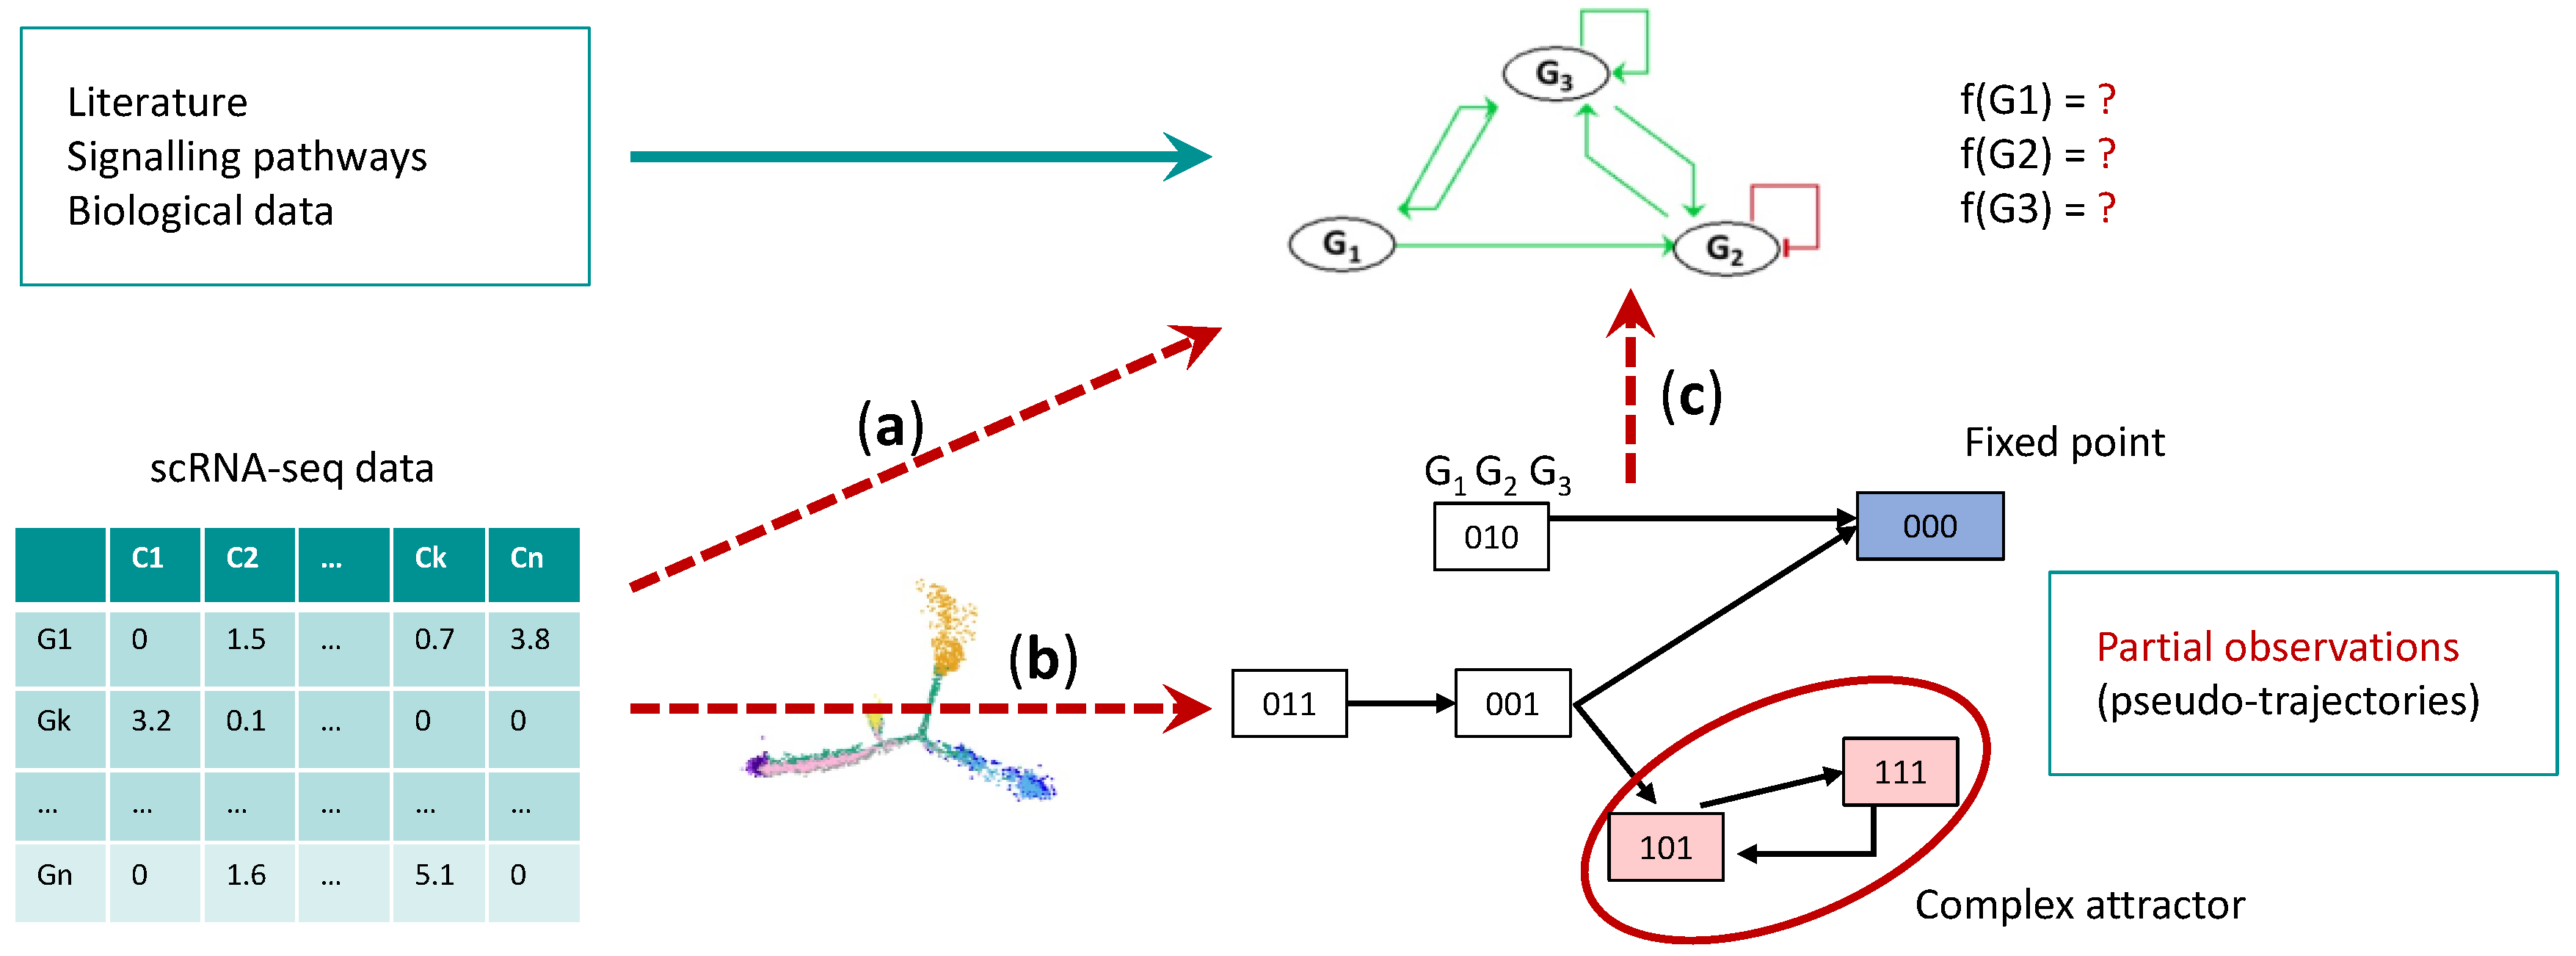
7. Single Cell Data and Boolean Networks Inference to Understand HSC Aging
7.1. Gene Regulatory Network Inference
7.2. Boolean Network Inference
8. Conclusions
Funding
Institutional Review Board Statement
Informed Consent Statement
Data Availability Statement
Conflicts of Interest
Abbreviations
| ARCH | Age-related clonal hematopoiesis |
| ATAC-seq | Assay for transposase-accessible chromatin with high throughput sequencing |
| BM | Bone marrow |
| BN | Boolean network |
| CCND2 | Cyclin D2 |
| CDC42 | Cell division cycle 42 |
| CDK6 | Cyclin-dependent kinase 6 |
| CDKN1A | Cyclin dependent kinase inhibitor 1A |
| CEBPA | CCAAT/enhancer-binding protein alpha |
| ChIP-seq | Chromatin immunoprecipitation followed by sequencing |
| CITE-seq | Cellular indexing of transcriptomes and epitopes by sequencing |
| CMP | Common myeloid progenitor |
| CRISPR-seq | Clustered regularly interspaced short palindromic repeats sequencing |
| DEG | Differentially expressed genes |
| DNA | Deoxyribonucleic acid |
| Drop-seq | Droplet-sequencing |
| EGR1 | Early growth response protein 1 |
| FACS | Fluorescence-activated cell sorting |
| GMP | Granulocyte-monocyte progenitor |
| HES1 | Hairy and enhancer of split-1 |
| HSC | Hematopoietic stem cell |
| HSPC | Hematopoietic stem and progenitor cell |
| HVG | Highly variable genes |
| JAK | Janus kinase |
| KLF | Krüppel-like factor |
| LTHSC | Long-term hematopoietic stem cell |
| MEP | Megakaryocytes-erythrocyte progenitor |
| MPP | Multipotent progenitor |
| MSC | Mesenchymal stromal cells |
| NF-kB | Nuclear factor kappa B |
| PCA | Principal component analysis |
| ROS | Reactive oxyygen species |
| RNA | Ribonucleic acid |
| scRNA-seq | single-cell RNA sequencing |
| STAT | Signal transducers and activators of transcription |
| STHSC | Short-term hematopoietic stem cell |
| TF | Transcription factor |
| TGF-β | Transforming Growth Factor Beta |
| t-SNE | t-distributed stochastic neighbor embedding |
| UMAP | Uniform Manifold Approximation and Projection |
Appendix A. Boolean Network Modeling Toolbox

References
- Spangrude, G.J.; Heimfeld, S.; Weissman, I.L. Purification and characterization of mouse hematopoietic stem cells. Science 1988, 241, 58–62. [Google Scholar] [CrossRef] [PubMed]
- Geiger, H.; Zheng, Y. Cdc42 and aging of hematopoietic stem cells. Curr. Opin. Hematol. 2013, 20, 295–300. [Google Scholar] [CrossRef] [PubMed] [Green Version]
- de Haan, G.; Lazare, S.S. Aging of hematopoietic stem cells. Blood 2018, 131, 479–487. [Google Scholar] [CrossRef] [PubMed] [Green Version]
- Mejia-Ramirez, E.; Florian, M.C. Understanding intrinsic hematopoietic stem cell aging. Haematologica 2020, 105, 22–37. [Google Scholar] [CrossRef] [PubMed]
- Yamashita, M.; Iwama, A. Aging and Clonal Behavior of Hematopoietic Stem Cells. Int. J. Mol. Sci. 2022, 23, 1948. [Google Scholar] [CrossRef] [PubMed]
- Shlush, L.I. Age-related clonal hematopoiesis. Blood 2018, 131, 496–504. [Google Scholar] [CrossRef] [PubMed] [Green Version]
- Steensma, D.P.; Bejar, R.; Jaiswal, S.; Lindsley, R.C.; Sekeres, M.A.; Hasserjian, R.P.; Ebert, B.L. Clonal hematopoiesis of indeterminate potential and its distinction from myelodysplastic syndromes. Blood 2015, 126, 9–16. [Google Scholar] [CrossRef] [PubMed] [Green Version]
- Shlush, L.I.; Zandi, S.; Mitchell, A.; Chen, W.C.; Brandwein, J.M.; Gupta, V.; Kennedy, J.A.; Schimmer, A.D.; Schuh, A.C.; Yee, K.W.; et al. Identification of pre-leukaemic haematopoietic stem cells in acute leukaemia. Nature 2014, 506, 328–333. [Google Scholar] [CrossRef] [Green Version]
- Xie, M.; Lu, C.; Wang, J.; McLellan, M.D.; Johnson, K.J.; Wendl, M.C.; McMichael, J.F.; Schmidt, H.K.; Yellapantula, V.; Miller, C.A.; et al. Age-related mutations associated with clonal hematopoietic expansion and malignancies. Nat. Med. 2014, 20, 1472–1478. [Google Scholar] [CrossRef]
- Jaiswal, S.; Natarajan, P.; Silver, A.J.; Gibson, C.J.; Bick, A.G.; Shvartz, E.; McConkey, M.; Gupta, N.; Gabriel, S.; Ardissino, D.; et al. Clonal Hematopoiesis and Risk of Atherosclerotic Cardiovascular Disease. N. Engl. J. Med. 2017, 377, 111–121. [Google Scholar] [CrossRef]
- Rossi, D.J.; Bryder, D.; Zahn, J.M.; Ahlenius, H.; Sonu, R.; Wagers, A.J.; Weissman, I.L. Cell intrinsic alterations underlie hematopoietic stem cell aging. Proc. Natl. Acad. Sci. USA 2005, 102, 9194–9199. [Google Scholar] [CrossRef] [PubMed] [Green Version]
- Sanjuan-Pla, A.; Macaulay, I.C.; Jensen, C.T.; Woll, P.S.; Luis, T.C.; Mead, A.; Moore, S.; Carella, C.; Matsuoka, S.; Jones, T.B.; et al. Platelet-biased stem cells reside at the apex of the haematopoietic stem-cell hierarchy. Nature 2013, 502, 232–236. [Google Scholar] [CrossRef] [PubMed]
- Gekas, C.; Graf, T. CD41 expression marks myeloid-biased adult hematopoietic stem cells and increases with age. Blood 2013, 121, 4463–4472. [Google Scholar] [CrossRef] [Green Version]
- Chambers, S.M.; Boles, N.C.; Lin, K.Y.; Tierney, M.P.; Bowman, T.V.; Bradfute, S.B.; Chen, A.J.; Merchant, A.A.; Sirin, O.; Weksberg, D.C.; et al. Hematopoietic fingerprints: An expression database of stem cells and their progeny. Cell Stem Cell 2007, 1, 578–591. [Google Scholar] [CrossRef] [Green Version]
- Noda, S.; Ichikawa, H.; Miyoshi, H. Hematopoietic stem cell aging is associated with functional decline and delayed cell cycle progression. Biochem. Biophys. Res. Commun. 2009, 383, 210–215. [Google Scholar] [CrossRef] [PubMed]
- Li, X.; Zeng, X.; Xu, Y.; Wang, B.; Zhao, Y.; Lai, X.; Qian, P.; Huang, H. Mechanisms and rejuvenation strategies for aged hematopoietic stem cells. J. Hematol. Oncol. 2020, 13, 31. [Google Scholar] [CrossRef]
- Zhang, L.; Mack, R.; Breslin, P.; Zhang, J. Molecular and cellular mechanisms of aging in hematopoietic stem cells and their niches. J. Hematol. Oncol. 2020, 13, 157. [Google Scholar] [CrossRef]
- SanMiguel, J.M.; Young, K.; Trowbridge, J.J. Hand in hand: Intrinsic and extrinsic drivers of aging and clonal hematopoiesis. Exp. Hematol. 2020, 91, 1–9. [Google Scholar] [CrossRef]
- Djeghloul, D.; Kuranda, K.; Kuzniak, I.; Barbieri, D.; Naguibneva, I.; Choisy, C.; Bories, J.C.; Dosquet, C.; Pla, M.; Vanneaux, V.; et al. Age-Associated Decrease of the Histone Methyltransferase SUV39H1 in HSC Perturbs Heterochromatin and B Lymphoid Differentiation. Stem Cell Rep. 2016, 6, 970–984. [Google Scholar] [CrossRef] [Green Version]
- Poplineau, M.; Vernerey, J.; Platet, N.; N’Guyen, L.; Herault, L.; Esposito, M.; Saurin, A.J.; Guilouf, C.; Iwama, A.; Duprez, E. PLZF limits enhancer activity during hematopoietic progenitor aging. Nucleic Acids Res. 2019, 47, 4509–4520. [Google Scholar] [CrossRef]
- Itokawa, N.; Oshima, M.; Koide, S.; Takayama, N.; Kuribayashi, W.; Nakajima-Takagi, Y.; Aoyama, K.; Yamazaki, S.; Yamaguchi, K.; Furukawa, Y.; et al. Epigenetic traits inscribed in chromatin accessibility in aged hematopoietic stem cells. Nat. Commun. 2022, 13, 2691. [Google Scholar] [CrossRef] [PubMed]
- Kramer, A.; Challen, G.A. The epigenetic basis of hematopoietic stem cell aging. Semin. Hematol. 2017, 54, 19–24. [Google Scholar] [CrossRef] [PubMed] [Green Version]
- Svendsen, A.; Yang, D.; Lazare, S.; Zwart, E.; Ausema, A.; de Haan, G.; Bystrykh, L. A Comprehensive Transcriptome Signature of Murine Hematopoietic Stem Cell Aging. Blood 2021, 138, 439–451. [Google Scholar] [CrossRef] [PubMed]
- Busque, L.; Patel, J.P.; Figueroa, M.E.; Vasanthakumar, A.; Provost, S.; Hamilou, Z.; Mollica, L.; Li, J.; Viale, A.; Heguy, A.; et al. Recurrent somatic TET2 mutations in normal elderly individuals with clonal hematopoiesis. Nat. Genet. 2012, 44, 1179–1181. [Google Scholar] [CrossRef] [PubMed]
- Corces-Zimmerman, M.R.; Hong, W.J.; Weissman, I.L.; Medeiros, B.C.; Majeti, R. Preleukemic mutations in human acute myeloid leukemia affect epigenetic regulators and persist in remission. Proc. Natl. Acad. Sci. USA 2014, 111, 2548–2553. [Google Scholar] [CrossRef] [Green Version]
- Challen, G.A.; Sun, D.; Jeong, M.; Luo, M.; Jelinek, J.; Berg, J.S.; Bock, C.; Vasanthakumar, A.; Gu, H.; Xi, Y.; et al. Dnmt3a is essential for hematopoietic stem cell differentiation. Nat. Genet. 2011, 44, 23–31. [Google Scholar] [CrossRef] [PubMed] [Green Version]
- Jeong, M.; Park, H.J.; Celik, H.; Ostrander, E.L.; Reyes, J.M.; Guzman, A.; Rodriguez, B.; Lei, Y.; Lee, Y.; Ding, L.; et al. Loss of Dnmt3a Immortalizes Hematopoietic Stem Cells In Vivo. Cell Rep. 2018, 23, 1–10. [Google Scholar] [CrossRef] [Green Version]
- Cai, Z.; Kotzin, J.J.; Ramdas, B.; Chen, S.; Nelanuthala, S.; Palam, L.R.; Pandey, R.; Mali, R.S.; Liu, Y.; Kelley, M.R.; et al. Inhibition of Inflammatory Signaling in Tet2 Mutant Preleukemic Cells Mitigates Stress-Induced Abnormalities and Clonal Hematopoiesis. Cell Stem Cell 2018, 23, 833–849.e5. [Google Scholar] [CrossRef] [Green Version]
- Akashi, K.; Traver, D.; Miyamoto, T.; Weissman, I.L. A clonogenic common myeloid progenitor that gives rise to all myeloid lineages. Nature 2000, 404, 193–197. [Google Scholar] [CrossRef]
- Adolfsson, J.; Mansson, R.; Buza-Vidas, N.; Hultquist, A.; Liuba, K.; Jensen, C.T.; Bryder, D.; Yang, L.; Borge, O.J.; Thoren, L.A.; et al. Identification of Flt3+ lympho-myeloid stem cells lacking erythro-megakaryocytic potential a revised road map for adult blood lineage commitment. Cell 2005, 121, 295–306. [Google Scholar] [CrossRef]
- Oguro, H.; Ding, L.; Morrison, S.J. SLAM family markers resolve functionally distinct subpopulations of hematopoietic stem cells and multipotent progenitors. Cell Stem Cell 2013, 13, 102–116. [Google Scholar] [CrossRef] [PubMed] [Green Version]
- Doulatov, S.; Notta, F.; Eppert, K.; Nguyen, L.T.; Ohashi, P.S.; Dick, J.E. Revised map of the human progenitor hierarchy shows the origin of macrophages and dendritic cells in early lymphoid development. Nat. Immunol. 2010, 11, 585–593. [Google Scholar] [CrossRef] [PubMed]
- Guo, G.; Luc, S.; Marco, E.; Lin, T.W.; Peng, C.; Kerenyi, M.A.; Beyaz, S.; Kim, W.; Xu, J.; Das, P.P.; et al. Mapping cellular hierarchy by single-cell analysis of the cell surface repertoire. Cell Stem Cell 2013, 13, 492–505. [Google Scholar] [CrossRef] [PubMed] [Green Version]
- Moignard, V.; Woodhouse, S.; Haghverdi, L.; Lilly, A.J.; Tanaka, Y.; Wilkinson, A.C.; Buettner, F.; Macaulay, I.C.; Jawaid, W.; Diamanti, E.; et al. Decoding the regulatory network of early blood development from single-cell gene expression measurements. Nat. Biotechnol. 2015, 33, 269–276. [Google Scholar] [CrossRef] [Green Version]
- Jaitin, D.A.; Kenigsberg, E.; Keren-Shaul, H.; Elefant, N.; Paul, F.; Zaretsky, I.; Mildner, A.; Cohen, N.; Jung, S.; Tanay, A.; et al. Massively parallel single-cell RNA-seq for marker-free decomposition of tissues into cell types. Science 2014, 343, 776–779. [Google Scholar] [CrossRef] [Green Version]
- Paul, F.; Arkin, Y.; Giladi, A.; Jaitin, D.A.; Kenigsberg, E.; Keren-Shaul, H.; Winter, D.; Lara-Astiaso, D.; Gury, M.; Weiner, A.; et al. Transcriptional Heterogeneity and Lineage Commitment in Myeloid Progenitors. Cell 2015, 163, 1663–1677. [Google Scholar] [CrossRef] [Green Version]
- Kowalczyk, M.S.; Tirosh, I.; Heckl, D.; Rao, T.N.; Dixit, A.; Haas, B.J.; Schneider, R.K.; Wagers, A.J.; Ebert, B.L.; Regev, A. Single-cell RNA-seq reveals changes in cell cycle and differentiation programs upon aging of hematopoietic stem cells. Genome Res. 2015, 25, 1860–1872. [Google Scholar] [CrossRef] [Green Version]
- Picelli, S.; Bjorklund, A.K.; Faridani, O.R.; Sagasser, S.; Winberg, G.; Sandberg, R. Smart-seq2 for sensitive full-length transcriptome profiling in single cells. Nat. Methods 2013, 10, 1096–1098. [Google Scholar] [CrossRef]
- Macosko, E.Z.; Basu, A.; Satija, R.; Nemesh, J.; Shekhar, K.; Goldman, M.; Tirosh, I.; Bialas, A.R.; Kamitaki, N.; Martersteck, E.M.; et al. Highly Parallel Genome-wide Expression Profiling of Individual Cells Using Nanoliter Droplets. Cell 2015, 161, 1202–1214. [Google Scholar] [CrossRef] [Green Version]
- Klein, A.M.; Mazutis, L.; Akartuna, I.; Tallapragada, N.; Veres, A.; Li, V.; Peshkin, L.; Weitz, D.A.; Kirschner, M.W. Droplet barcoding for single-cell transcriptomics applied to embryonic stem cells. Cell 2015, 161, 1187–1201. [Google Scholar] [CrossRef]
- Zheng, G.X.; Terry, J.M.; Belgrader, P.; Ryvkin, P.; Bent, Z.W.; Wilson, R.; Ziraldo, S.B.; Wheeler, T.D.; McDermott, G.P.; Zhu, J.; et al. Massively parallel digital transcriptional profiling of single cells. Nat. Commun. 2017, 8, 14049. [Google Scholar] [CrossRef] [PubMed] [Green Version]
- Kharchenko, P.V. The triumphs and limitations of computational methods for scRNA-seq. Nat. Methods 2021, 18, 723–732. [Google Scholar] [CrossRef] [PubMed]
- Tian, L.; Dong, X.; Freytag, S.; Le Cao, K.A.; Su, S.; JalalAbadi, A.; Amann-Zalcenstein, D.; Weber, T.S.; Seidi, A.; Jabbari, J.S.; et al. Benchmarking single cell RNA-sequencing analysis pipelines using mixture control experiments. Nat. Methods 2019, 16, 479–487. [Google Scholar] [CrossRef] [PubMed]
- Butler, A.; Hoffman, P.; Smibert, P.; Papalexi, E.; Satija, R. Integrating single-cell transcriptomic data across different conditions, technologies, and species. Nat. Biotechnol. 2018, 36, 411–420. [Google Scholar] [CrossRef]
- Satija, R.; Farrell, J.A.; Gennert, D.; Schier, A.F.; Regev, A. Spatial reconstruction of single-cell gene expression data. Nat. Biotechnol. 2015, 33, 495–502. [Google Scholar] [CrossRef] [Green Version]
- Stuart, T.; Butler, A.; Hoffman, P.; Hafemeister, C.; Papalexi, E.; Mauck, W.M., 3rd; Hao, Y.; Stoeckius, M.; Smibert, P.; Satija, R. Comprehensive Integration of Single-Cell Data. Cell 2019, 177, 1888–1902.e21. [Google Scholar] [CrossRef]
- Wolf, F.A.; Angerer, P.; Theis, F.J. SCANPY: Large-scale single-cell gene expression data analysis. Genome Biol. 2018, 19, 15. [Google Scholar] [CrossRef] [Green Version]
- Luecken, M.D.; Theis, F.J. Current best practices in single-cell RNA-seq analysis: A tutorial. Mol. Syst. Biol. 2019, 15, e8746. [Google Scholar] [CrossRef]
- Chen, H.; Albergante, L.; Hsu, J.Y.; Lareau, C.A.; Lo Bosco, G.; Guan, J.; Zhou, S.; Gorban, A.N.; Bauer, D.E.; Aryee, M.J.; et al. Single-cell trajectories reconstruction, exploration and mapping of omics data with STREAM. Nat. Commun. 2019, 10, 1903. [Google Scholar] [CrossRef] [Green Version]
- Qiu, X.; Mao, Q.; Tang, Y.; Wang, L.; Chawla, R.; Pliner, H.A.; Trapnell, C. Reversed graph embedding resolves complex single-cell trajectories. Nat. Methods 2017, 14, 979–982. [Google Scholar] [CrossRef]
- Cao, J.; Spielmann, M.; Qiu, X.; Huang, X.; Ibrahim, D.M.; Hill, A.J.; Zhang, F.; Mundlos, S.; Christiansen, L.; Steemers, F.J.; et al. The single-cell transcriptional landscape of mammalian organogenesis. Nature 2019, 566, 496–502. [Google Scholar] [CrossRef] [PubMed]
- Haghverdi, L.; Buttner, M.; Wolf, F.A.; Buettner, F.; Theis, F.J. Diffusion pseudotime robustly reconstructs lineage branching. Nat. Methods 2016, 13, 845–848. [Google Scholar] [CrossRef] [PubMed] [Green Version]
- Saelens, W.; Cannoodt, R.; Todorov, H.; Saeys, Y. A comparison of single-cell trajectory inference methods. Nat. Biotechnol. 2019, 37, 547–554. [Google Scholar] [CrossRef] [PubMed]
- Nestorowa, S.; Hamey, F.K.; Pijuan Sala, B.; Diamanti, E.; Shepherd, M.; Laurenti, E.; Wilson, N.K.; Kent, D.G.; Gottgens, B. A single-cell resolution map of mouse hematopoietic stem and progenitor cell differentiation. Blood 2016, 128, e20–e31. [Google Scholar] [CrossRef] [PubMed] [Green Version]
- Herault, L.; Poplineau, M.; Mazuel, A.; Platet, N.; Remy, E.; Duprez, E. Single-cell RNA-seq reveals a concomitant delay in differentiation and cell cycle of aged hematopoietic stem cells. BMC Biol. 2021, 19, 19. [Google Scholar] [CrossRef]
- Wolf, F.A.; Hamey, F.K.; Plass, M.; Solana, J.; Dahlin, J.S.; Gottgens, B.; Rajewsky, N.; Simon, L.; Theis, F.J. PAGA: Graph abstraction reconciles clustering with trajectory inference through a topology preserving map of single cells. Genome Biol. 2019, 20, 59. [Google Scholar] [CrossRef] [Green Version]
- van Dijk, D.; Sharma, R.; Nainys, J.; Yim, K.; Kathail, P.; Carr, A.J.; Burdziak, C.; Moon, K.R.; Chaffer, C.L.; Pattabiraman, D.; et al. Recovering Gene Interactions from Single-Cell Data Using Data Diffusion. Cell 2018, 174, 716–729.e27. [Google Scholar] [CrossRef] [Green Version]
- Eraslan, G.; Simon, L.M.; Mircea, M.; Mueller, N.S.; Theis, F.J. Single-cell RNA-seq denoising using a deep count autoencoder. Nat. Commun. 2019, 10, 390. [Google Scholar] [CrossRef] [Green Version]
- Holland, C.H.; Tanevski, J.; Perales-Paton, J.; Gleixner, J.; Kumar, M.P.; Mereu, E.; Joughin, B.A.; Stegle, O.; Lauffenburger, D.A.; Heyn, H.; et al. Robustness and applicability of transcription factor and pathway analysis tools on single-cell RNA-seq data. Genome Biol. 2020, 21, 36. [Google Scholar] [CrossRef] [Green Version]
- Aibar, S.; Gonzalez-Blas, C.B.; Moerman, T.; Huynh-Thu, V.A.; Imrichova, H.; Hulselmans, G.; Rambow, F.; Marine, J.C.; Geurts, P.; Aerts, J.; et al. SCENIC: Single-cell regulatory network inference and clustering. Nat. Methods 2017, 14, 1083–1086. [Google Scholar] [CrossRef]
- Hou, W.; Ji, Z.; Ji, H.; Hicks, S.C. A systematic evaluation of single-cell RNA-sequencing imputation methods. Genome Biol. 2020, 21, 218. [Google Scholar] [CrossRef]
- Baran, Y.; Bercovich, A.; Sebe-Pedros, A.; Lubling, Y.; Giladi, A.; Chomsky, E.; Meir, Z.; Hoichman, M.; Lifshitz, A.; Tanay, A. MetaCell: Analysis of single-cell RNA-seq data using K-nn graph partitions. Genome Biol. 2019, 20, 206. [Google Scholar] [CrossRef] [PubMed] [Green Version]
- Bilous, M.; Tran, L.; Cianciaruso, C.; Gabriel, A.; Michel, H.; Carmona, S.J.; Pittet, M.J.; Gfeller, D. Metacells untangle large and complex single-cell transcriptome networks. BMC Bioinform. 2022, 23, 336. [Google Scholar] [CrossRef] [PubMed]
- Svensson, V.; Vento-Tormo, R.; Teichmann, S.A. Exponential scaling of single-cell RNA-seq in the past decade. Nat. Protoc. 2018, 13, 599–604. [Google Scholar] [CrossRef] [PubMed]
- Stoeckius, M.; Zheng, S.; Houck-Loomis, B.; Hao, S.; Yeung, B.Z.; Mauck, W.M., 3rd; Smibert, P.; Satija, R. Cell Hashing with barcoded antibodies enables multiplexing and doublet detection for single cell genomics. Genome Biol. 2018, 19, 224. [Google Scholar] [CrossRef] [Green Version]
- Johnson, W.E.; Li, C.; Rabinovic, A. Adjusting batch effects in microarray expression data using empirical Bayes methods. Biostatistics 2007, 8, 118–127. [Google Scholar] [CrossRef]
- Hafemeister, C.; Satija, R. Normalization and variance stabilization of single-cell RNA-seq data using regularized negative binomial regression. Genome Biol. 2019, 20, 296. [Google Scholar] [CrossRef] [Green Version]
- Luecken, M.D.; Buttner, M.; Chaichoompu, K.; Danese, A.; Interlandi, M.; Mueller, M.F.; Strobl, D.C.; Zappia, L.; Dugas, M.; Colome-Tatche, M.; et al. Benchmarking atlas-level data integration in single-cell genomics. Nat. Methods 2022, 19, 41–50. [Google Scholar] [CrossRef]
- Argelaguet, R.; Cuomo, A.S.E.; Stegle, O.; Marioni, J.C. Computational principles and challenges in single-cell data integration. Nat. Biotechnol. 2021, 39, 1202–1215. [Google Scholar] [CrossRef]
- Poplineau, M.; Platet, N.; Mazuel, A.; Herault, L.; N’Guyen, L.; Koide, S.; Nakajima-Takagi, Y.; Kuribayashi, W.; Carbuccia, N.; Haboub, L.; et al. Non-canonical EZH2 drives retinoic acid resistance of variant acute promyelocytic leukemias. Blood 2022, in press. [Google Scholar] [CrossRef]
- Haas, S.; Trumpp, A.; Milsom, M.D. Causes and Consequences of Hematopoietic Stem Cell Heterogeneity. Cell Stem Cell 2018, 22, 627–638. [Google Scholar] [CrossRef] [PubMed] [Green Version]
- Zhang, Y.; Gao, S.; Xia, J.; Liu, F. Hematopoietic Hierarchy—An Updated Roadmap. Trends Cell Biol. 2018, 28, 976–986. [Google Scholar] [CrossRef] [PubMed]
- Laurenti, E.; Gottgens, B. From haematopoietic stem cells to complex differentiation landscapes. Nature 2018, 553, 418–426. [Google Scholar] [CrossRef] [PubMed]
- Herman, J.S.; Sagar; Grun, D. FateID infers cell fate bias in multipotent progenitors from single-cell RNA-seq data. Nat. Methods 2018, 15, 379–386. [Google Scholar] [CrossRef] [PubMed]
- Rodriguez-Fraticelli, A.E.; Wolock, S.L.; Weinreb, C.S.; Panero, R.; Patel, S.H.; Jankovic, M.; Sun, J.; Calogero, R.A.; Klein, A.M.; Camargo, F.D. Clonal analysis of lineage fate in native haematopoiesis. Nature 2018, 553, 212–216. [Google Scholar] [CrossRef]
- Notta, F.; Zandi, S.; Takayama, N.; Dobson, S.; Gan, O.I.; Wilson, G.; Kaufmann, K.B.; McLeod, J.; Laurenti, E.; Dunant, C.F.; et al. Distinct routes of lineage development reshape the human blood hierarchy across ontogeny. Science 2016, 351, aab2116. [Google Scholar] [CrossRef] [Green Version]
- Velten, L.; Haas, S.F.; Raffel, S.; Blaszkiewicz, S.; Islam, S.; Hennig, B.P.; Hirche, C.; Lutz, C.; Buss, E.C.; Nowak, D.; et al. Human haematopoietic stem cell lineage commitment is a continuous process. Nat. Cell Biol. 2017, 19, 271–281. [Google Scholar] [CrossRef] [Green Version]
- Waddington, C.H.; Kacser, H. The Strategy of the Genes: A Discussion of Some Aspects of Theoretical Biology; Allen & Unwin: Crows Nest, Australia, 1957; pp. 42–46. [Google Scholar]
- Buenrostro, J.D.; Corces, M.R.; Lareau, C.A.; Wu, B.; Schep, A.N.; Aryee, M.J.; Majeti, R.; Chang, H.Y.; Greenleaf, W.J. Integrated Single-Cell Analysis Maps the Continuous Regulatory Landscape of Human Hematopoietic Differentiation. Cell 2018, 173, 1535–1548.e16. [Google Scholar] [CrossRef] [Green Version]
- Young, K.; Borikar, S.; Bell, R.; Kuffler, L.; Philip, V.; Trowbridge, J.J. Progressive alterations in multipotent hematopoietic progenitors underlie lymphoid cell loss in aging. J. Exp. Med. 2016, 213, 2259–2267. [Google Scholar] [CrossRef] [Green Version]
- Grover, A.; Sanjuan-Pla, A.; Thongjuea, S.; Carrelha, J.; Giustacchini, A.; Gambardella, A.; Macaulay, I.; Mancini, E.; Luis, T.C.; Mead, A.; et al. Single-cell RNA sequencing reveals molecular and functional platelet bias of aged haematopoietic stem cells. Nat. Commun. 2016, 7, 11075. [Google Scholar] [CrossRef] [Green Version]
- Mann, M.; Mehta, A.; de Boer, C.G.; Kowalczyk, M.S.; Lee, K.; Haldeman, P.; Rogel, N.; Knecht, A.R.; Farouq, D.; Regev, A.; et al. Heterogeneous Responses of Hematopoietic Stem Cells to Inflammatory Stimuli Are Altered with Age. Cell Rep. 2018, 25, 2992–3005.e5. [Google Scholar] [CrossRef] [PubMed] [Green Version]
- Fast, E.M.; Sporrij, A.; Manning, M.; Rocha, E.L.; Yang, S.; Zhou, Y.; Guo, J.; Baryawno, N.; Barkas, N.; Scadden, D.; et al. External signals regulate continuous transcriptional states in hematopoietic stem cells. eLife 2021, 10, e66512. [Google Scholar] [CrossRef] [PubMed]
- Sommerkamp, P.; Romero-Mulero, M.C.; Narr, A.; Ladel, L.; Hustin, L.; Schonberger, K.; Renders, S.; Altamura, S.; Zeisberger, P.; Jacklein, K.; et al. Mouse multipotent progenitor 5 cells are located at the interphase between hematopoietic stem and progenitor cells. Blood 2021, 137, 3218–3224. [Google Scholar] [CrossRef]
- Xia, S.; Zhang, X.; Zheng, S.; Khanabdali, R.; Kalionis, B.; Wu, J.; Wan, W.; Tai, X. An Update on Inflamm-Aging: Mechanisms, Prevention, and Treatment. J. Immunol. Res. 2016, 2016, 8426874. [Google Scholar] [CrossRef] [PubMed]
- Challen, G.A.; Boles, N.C.; Chambers, S.M.; Goodell, M.A. Distinct hematopoietic stem cell subtypes are differentially regulated by TGF-beta1. Cell Stem Cell 2010, 6, 265–278. [Google Scholar] [CrossRef] [Green Version]
- Qiu, J.; Papatsenko, D.; Niu, X.; Schaniel, C.; Moore, K. Divisional history and hematopoietic stem cell function during homeostasis. Stem Cell Rep. 2014, 2, 473–490. [Google Scholar] [CrossRef] [Green Version]
- Kirschner, K.; Chandra, T.; Kiselev, V.; Flores-Santa Cruz, D.; Macaulay, I.C.; Park, H.J.; Li, J.; Kent, D.G.; Kumar, R.; Pask, D.C.; et al. Proliferation Drives Aging-Related Functional Decline in a Subpopulation of the Hematopoietic Stem Cell Compartment. Cell Rep. 2017, 19, 1503–1511. [Google Scholar] [CrossRef] [PubMed] [Green Version]
- Desterke, C.; Bennaceur-Griscelli, A.; Turhan, A.G. EGR1 dysregulation defines an inflammatory and leukemic program in cell trajectory of human-aged hematopoietic stem cells (HSC). Stem Cell Res. Ther. 2021, 12, 419. [Google Scholar] [CrossRef]
- Passegue, E.; Wagner, E.F.; Weissman, I.L. JunB deficiency leads to a myeloproliferative disorder arising from hematopoietic stem cells. Cell 2004, 119, 431–443. [Google Scholar] [CrossRef] [Green Version]
- Santaguida, M.; Schepers, K.; King, B.; Sabnis, A.J.; Forsberg, E.C.; Attema, J.L.; Braun, B.S.; Passegue, E. JunB protects against myeloid malignancies by limiting hematopoietic stem cell proliferation and differentiation without affecting self-renewal. Cancer Cell 2009, 15, 341–352. [Google Scholar] [CrossRef]
- Cabezas-Wallscheid, N.; Buettner, F.; Sommerkamp, P.; Klimmeck, D.; Ladel, L.; Thalheimer, F.B.; Pastor-Flores, D.; Roma, L.P.; Renders, S.; Zeisberger, P.; et al. Vitamin A-Retinoic Acid Signaling Regulates Hematopoietic Stem Cell Dormancy. Cell 2017, 169, 807–823.e19. [Google Scholar] [CrossRef] [PubMed] [Green Version]
- Lauridsen, F.K.B.; Jensen, T.L.; Rapin, N.; Aslan, D.; Wilhelmson, A.S.; Pundhir, S.; Rehn, M.; Paul, F.; Giladi, A.; Hasemann, M.S.; et al. Differences in Cell Cycle Status Underlie Transcriptional Heterogeneity in the HSC Compartment. Cell Rep. 2018, 24, 766–780. [Google Scholar] [CrossRef] [PubMed] [Green Version]
- Florian, M.C.; Klose, M.; Sacma, M.; Jablanovic, J.; Knudson, L.; Nattamai, K.J.; Marka, G.; Vollmer, A.; Soller, K.; Sakk, V.; et al. Aging alters the epigenetic asymmetry of HSC division. PLoS Biol. 2018, 16, e2003389. [Google Scholar] [CrossRef] [PubMed] [Green Version]
- Buettner, F.; Natarajan, K.N.; Casale, F.P.; Proserpio, V.; Scialdone, A.; Theis, F.J.; Teichmann, S.A.; Marioni, J.C.; Stegle, O. Computational analysis of cell-to-cell heterogeneity in single-cell RNA-sequencing data reveals hidden subpopulations of cells. Nat. Biotechnol. 2015, 33, 155–160. [Google Scholar] [CrossRef]
- Jaiswal, S.; Ebert, B.L. Clonal hematopoiesis in human aging and disease. Science 2019, 366, eaan4673. [Google Scholar] [CrossRef]
- Regev, A.; Teichmann, S.A.; Lander, E.S.; Amit, I.; Benoist, C.; Birney, E.; Bodenmiller, B.; Campbell, P.; Carninci, P.; Clatworthy, M.; et al. The Human Cell Atlas. eLife 2017, 6, e27041. [Google Scholar] [CrossRef]
- Zheng, L.; Qin, S.; Si, W.; Wang, A.; Xing, B.; Gao, R.; Ren, X.; Wang, L.; Wu, X.; Zhang, J.; et al. Pan-cancer single-cell landscape of tumor-infiltrating T cells. Science 2021, 374, abe6474. [Google Scholar] [CrossRef]
- La Manno, G.; Soldatov, R.; Zeisel, A.; Braun, E.; Hochgerner, H.; Petukhov, V.; Lidschreiber, K.; Kastriti, M.E.; Lonnerberg, P.; Furlan, A.; et al. RNA velocity of single cells. Nature 2018, 560, 494–498. [Google Scholar] [CrossRef] [Green Version]
- Bergen, V.; Lange, M.; Peidli, S.; Wolf, F.A.; Theis, F.J. Generalizing RNA velocity to transient cell states through dynamical modeling. Nat. Biotechnol. 2020, 38, 1408–1414. [Google Scholar] [CrossRef]
- Bowman, T.V.; McCooey, A.J.; Merchant, A.A.; Ramos, C.A.; Fonseca, P.; Poindexter, A.; Bradfute, S.B.; Oliveira, D.M.; Green, R.; Zheng, Y.; et al. Differential mRNA processing in hematopoietic stem cells. Stem Cells 2006, 24, 662–670. [Google Scholar] [CrossRef]
- Bergen, V.; Soldatov, R.A.; Kharchenko, P.V.; Theis, F.J. RNA velocity-current challenges and future perspectives. Mol. Syst. Biol. 2021, 17, e10282. [Google Scholar] [CrossRef] [PubMed]
- Tak, T.; Eisele, A.S.; Perie, L. In Vivo Tracking of Hematopoietic Stem and Progenitor Cell Ontogeny by Cellular Barcoding. Methods Mol. Biol. 2021, 2308, 281–300. [Google Scholar] [CrossRef] [PubMed]
- Rodriguez-Fraticelli, A.E.; Camargo, F. Systems analysis of hematopoiesis using single-cell lineage tracing. Curr. Opin. Hematol. 2021, 28, 18–27. [Google Scholar] [CrossRef] [PubMed]
- Weinreb, C.; Rodriguez-Fraticelli, A.; Camargo, F.D.; Klein, A.M. Lineage tracing on transcriptional landscapes links state to fate during differentiation. Science 2020, 367, eaaw3381. [Google Scholar] [CrossRef] [PubMed]
- Rodriguez-Fraticelli, A.E.; Weinreb, C.; Wang, S.W.; Migueles, R.P.; Jankovic, M.; Usart, M.; Klein, A.M.; Lowell, S.; Camargo, F.D. Single-cell lineage tracing unveils a role for TCF15 in haematopoiesis. Nature 2020, 583, 585–589. [Google Scholar] [CrossRef] [PubMed]
- Yu, V.W.C.; Yusuf, R.Z.; Oki, T.; Wu, J.; Saez, B.; Wang, X.; Cook, C.; Baryawno, N.; Ziller, M.J.; Lee, E.; et al. Epigenetic Memory Underlies Cell-Autonomous Heterogeneous Behavior of Hematopoietic Stem Cells. Cell 2016, 167, 1310–1322.e17. [Google Scholar] [CrossRef] [Green Version]
- Whichard, Z.L.; Sarkar, C.A.; Kimmel, M.; Corey, S.J. Hematopoiesis and its disorders: A systems biology approach. Blood 2010, 115, 2339–2347. [Google Scholar] [CrossRef] [Green Version]
- Wichmann, H.E.; Loeffler, M.; Schmitz, S. A concept of hemopoietic regulation and its biomathematical realization. Blood Cells 1988, 14, 411–429. [Google Scholar]
- Mackey, M.C. Mathematical Models of Hematopoietic Cell Replication and Control; Prentice-Hall, Inc.: Hoboken, NJ, USA, 1997. [Google Scholar]
- Manesso, E.; Teles, J.; Bryder, D.; Peterson, C. Dynamical modelling of haematopoiesis: An integrated view over the system in homeostasis and under perturbation. J. R. Soc. Interface 2013, 10, 20120817. [Google Scholar] [CrossRef]
- Le Novere, N. Quantitative and logic modelling of molecular and gene networks. Nat. Rev. Genet. 2015, 16, 146–158. [Google Scholar] [CrossRef] [Green Version]
- Calzone, L.; Barillot, E.; Zinovyev, A. Logical versus kinetic modeling of biological networks: Applications in cancer research. Curr. Opin. Chem. Eng. 2018, 21, 22–31. [Google Scholar] [CrossRef]
- Albert, R.; Thakar, J. Boolean modeling: A logic-based dynamic approach for understanding signaling and regulatory networks and for making useful predictions. Wiley Interdiscip. Rev. Syst. Biol. Med. 2014, 6, 353–369. [Google Scholar] [CrossRef] [PubMed]
- Choi, M.; Shi, J.; Jung, S.H.; Chen, X.; Cho, K.H. Attractor landscape analysis reveals feedback loops in the p53 network that control the cellular response to DNA damage. Sci. Signal. 2012, 5, ra83. [Google Scholar] [CrossRef] [PubMed] [Green Version]
- Remy, E.; Rebouissou, S.; Chaouiya, C.; Zinovyev, A.; Radvanyi, F.; Calzone, L. A Modeling Approach to Explain Mutually Exclusive and Co-Occurring Genetic Alterations in Bladder Tumorigenesis. Cancer Res. 2015, 75, 4042–4052. [Google Scholar] [CrossRef] [PubMed] [Green Version]
- Naldi, A.; Carneiro, J.; Chaouiya, C.; Thieffry, D. Diversity and plasticity of Th cell types predicted from regulatory network modelling. PLoS Comput. Biol. 2010, 6, e1000912. [Google Scholar] [CrossRef]
- Cacace, E.; Collombet, S.; Thieffry, D. Logical modeling of cell fate specification-Application to T cell commitment. Curr. Top. Dev. Biol. 2020, 139, 205–238. [Google Scholar] [CrossRef] [PubMed]
- Rodriguez-Jorge, O.; Kempis-Calanis, L.A.; Abou-Jaoude, W.; Gutierrez-Reyna, D.Y.; Hernandez, C.; Ramirez-Pliego, O.; Thomas-Chollier, M.; Spicuglia, S.; Santana, M.A.; Thieffry, D. Cooperation between T cell receptor and Toll-like receptor 5 signaling for CD4(+) T cell activation. Sci. Signal. 2019, 12, eaar3641. [Google Scholar] [CrossRef] [PubMed] [Green Version]
- Kondratova, M.; Barillot, E.; Zinovyev, A.; Calzone, L. Modelling of Immune Checkpoint Network Explains Synergistic Effects of Combined Immune Checkpoint Inhibitor Therapy and the Impact of Cytokines in Patient Response. Cancers 2020, 12, 3600. [Google Scholar] [CrossRef]
- Krumsiek, J.; Marr, C.; Schroeder, T.; Theis, F.J. Hierarchical differentiation of myeloid progenitors is encoded in the transcription factor network. PLoS ONE 2011, 6, e22649. [Google Scholar] [CrossRef] [Green Version]
- Bonzanni, N.; Garg, A.; Feenstra, K.A.; Schutte, J.; Kinston, S.; Miranda-Saavedra, D.; Heringa, J.; Xenarios, I.; Gottgens, B. Hard-wired heterogeneity in blood stem cells revealed using a dynamic regulatory network model. Bioinformatics 2013, 29, i80–i88. [Google Scholar] [CrossRef] [Green Version]
- Collombet, S.; van Oevelen, C.; Ortega, J.L.S.; Abou-Jaoude, W.; Di Stefano, B.; Thomas-Chollier, M.; Graf, T.; Thieffry, D. Logical modeling of lymphoid and myeloid cell specification and transdifferentiation. Proc. Natl. Acad. Sci. USA 2017, 114, 5792–5799. [Google Scholar] [CrossRef] [PubMed]
- Enciso, J.; Mayani, H.; Mendoza, L.; Pelayo, R. Modeling the Pro-inflammatory Tumor Microenvironment in Acute Lymphoblastic Leukemia Predicts a Breakdown of Hematopoietic-Mesenchymal Communication Networks. Front. Physiol. 2016, 7, 349. [Google Scholar] [CrossRef] [PubMed] [Green Version]
- Ikonomi, N.; Kuhlwein, S.D.; Schwab, J.D.; Kestler, H.A. Awakening the HSC: Dynamic Modeling of HSC Maintenance Unravels Regulation of the TP53 Pathway and Quiescence. Front. Physiol. 2020, 11, 848. [Google Scholar] [CrossRef]
- Marbach, D.; Roy, S.; Ay, F.; Meyer, P.E.; Candeias, R.; Kahveci, T.; Bristow, C.A.; Kellis, M. Predictive regulatory models in Drosophila melanogaster by integrative inference of transcriptional networks. Genome Res. 2012, 22, 1334–1349. [Google Scholar] [CrossRef] [PubMed] [Green Version]
- Hu, X.; Hu, Y.; Wu, F.; Leung, R.W.T.; Qin, J. Integration of single-cell multi-omics for gene regulatory network inference. Comput. Struct. Biotechnol. J. 2020, 18, 1925–1938. [Google Scholar] [CrossRef]
- Pratapa, A.; Jalihal, A.P.; Law, J.N.; Bharadwaj, A.; Murali, T.M. Benchmarking algorithms for gene regulatory network inference from single-cell transcriptomic data. Nat. Methods 2020, 17, 147–154. [Google Scholar] [CrossRef]
- Huynh-Thu, V.A.; Irrthum, A.; Wehenkel, L.; Geurts, P. Inferring regulatory networks from expression data using tree-based methods. PLoS ONE 2010, 5, e12776. [Google Scholar] [CrossRef]
- Gao, N.P.; Ud-Dean, S.M.M.; Gandrillon, O.; Gunawan, R. SINCERITIES: Inferring gene regulatory networks from time-stamped single cell transcriptional expression profiles. Bioinformatics 2018, 34, 258–266. [Google Scholar] [CrossRef] [Green Version]
- Specht, A.T.; Li, J. LEAP: Constructing gene co-expression networks for single-cell RNA-sequencing data using pseudotime ordering. Bioinformatics 2017, 33, 764–766. [Google Scholar] [CrossRef] [Green Version]
- Chan, T.E.; Stumpf, M.P.H.; Babtie, A.C. Gene Regulatory Network Inference from Single-Cell Data Using Multivariate Information Measures. Cell Syst. 2017, 5, 251–267.e3. [Google Scholar] [CrossRef] [Green Version]
- Verny, L.; Sella, N.; Affeldt, S.; Singh, P.P.; Isambert, H. Learning causal networks with latent variables from multivariate information in genomic data. PLoS Comput. Biol. 2017, 13, e1005662. [Google Scholar] [CrossRef] [PubMed]
- Herrmann, F.; Gross, A.; Zhou, D.; Kestler, H.A.; Kuhl, M. A boolean model of the cardiac gene regulatory network determining first and second heart field identity. PLoS ONE 2012, 7, e46798. [Google Scholar] [CrossRef] [PubMed] [Green Version]
- Arguelaguet, R.; Lohoff, T.; Li, J.G.; Nakhuda, A.; Krueger, F.; Velten, L.; Clarck, S.J.; Reik, W. Decoding gene regulation in the mouse embryo using single-cell multi-omics. bioRxiv 2022. [Google Scholar] [CrossRef]
- Chevalier, S.; Froidevaux, C.; Paulevé, L.; Zinovyev, A. Synthesis of Boolean networks from biological dynamical constraints using answer-set programming. In Proceedings of the IEEE 31st Internationnal Conference on Tools with Artificial Intelligence, Portland, OR, USA, 4–6 November 2019; pp. 34–41. [Google Scholar]
- Ostrowski, M.; Pauleve, L.; Schaub, T.; Siegel, A.; Guziolowski, C. Boolean network identification from perturbation time series data combining dynamics abstraction and logic programming. Biosystems 2016, 149, 139–153. [Google Scholar] [CrossRef] [PubMed] [Green Version]
- Hamey, F.K.; Nestorowa, S.; Kinston, S.J.; Kent, D.G.; Wilson, N.K.; Gottgens, B. Reconstructing blood stem cell regulatory network models from single-cell molecular profiles. Proc. Natl. Acad. Sci. USA 2017, 114, 5822–5829. [Google Scholar] [CrossRef] [Green Version]
- Schwab, J.D.; Ikonomi, N.; Werle, S.D.; Weidner, F.M.; Geiger, H.; Kestler, H.A. Reconstructing Boolean network ensembles from single-cell data for unraveling dynamics in the aging of human hematopoietic stem cells. Comput. Struct. Biotechnol. J. 2021, 19, 5321–5332. [Google Scholar] [CrossRef]
- Herault, L.; Poplineau, M.; Duprez, E.; Remy, E. A novel Boolean network inference strategy to model early hematopoiesis aging. bioRxiv 2022. [Google Scholar] [CrossRef]


Publisher’s Note: MDPI stays neutral with regard to jurisdictional claims in published maps and institutional affiliations. |
© 2022 by the authors. Licensee MDPI, Basel, Switzerland. This article is an open access article distributed under the terms and conditions of the Creative Commons Attribution (CC BY) license (https://creativecommons.org/licenses/by/4.0/).
Share and Cite
Hérault, L.; Poplineau, M.; Remy, E.; Duprez, E. Single Cell Transcriptomics to Understand HSC Heterogeneity and Its Evolution upon Aging. Cells 2022, 11, 3125. https://doi.org/10.3390/cells11193125
Hérault L, Poplineau M, Remy E, Duprez E. Single Cell Transcriptomics to Understand HSC Heterogeneity and Its Evolution upon Aging. Cells. 2022; 11(19):3125. https://doi.org/10.3390/cells11193125
Chicago/Turabian StyleHérault, Léonard, Mathilde Poplineau, Elisabeth Remy, and Estelle Duprez. 2022. "Single Cell Transcriptomics to Understand HSC Heterogeneity and Its Evolution upon Aging" Cells 11, no. 19: 3125. https://doi.org/10.3390/cells11193125