
The EXTREME Regimen Associating Cetuximab and Cisplatin Favors Head and Neck Cancer Cell Death and Immunogenicity with the Induction of an Anti-Cancer Immune Response
 , , and
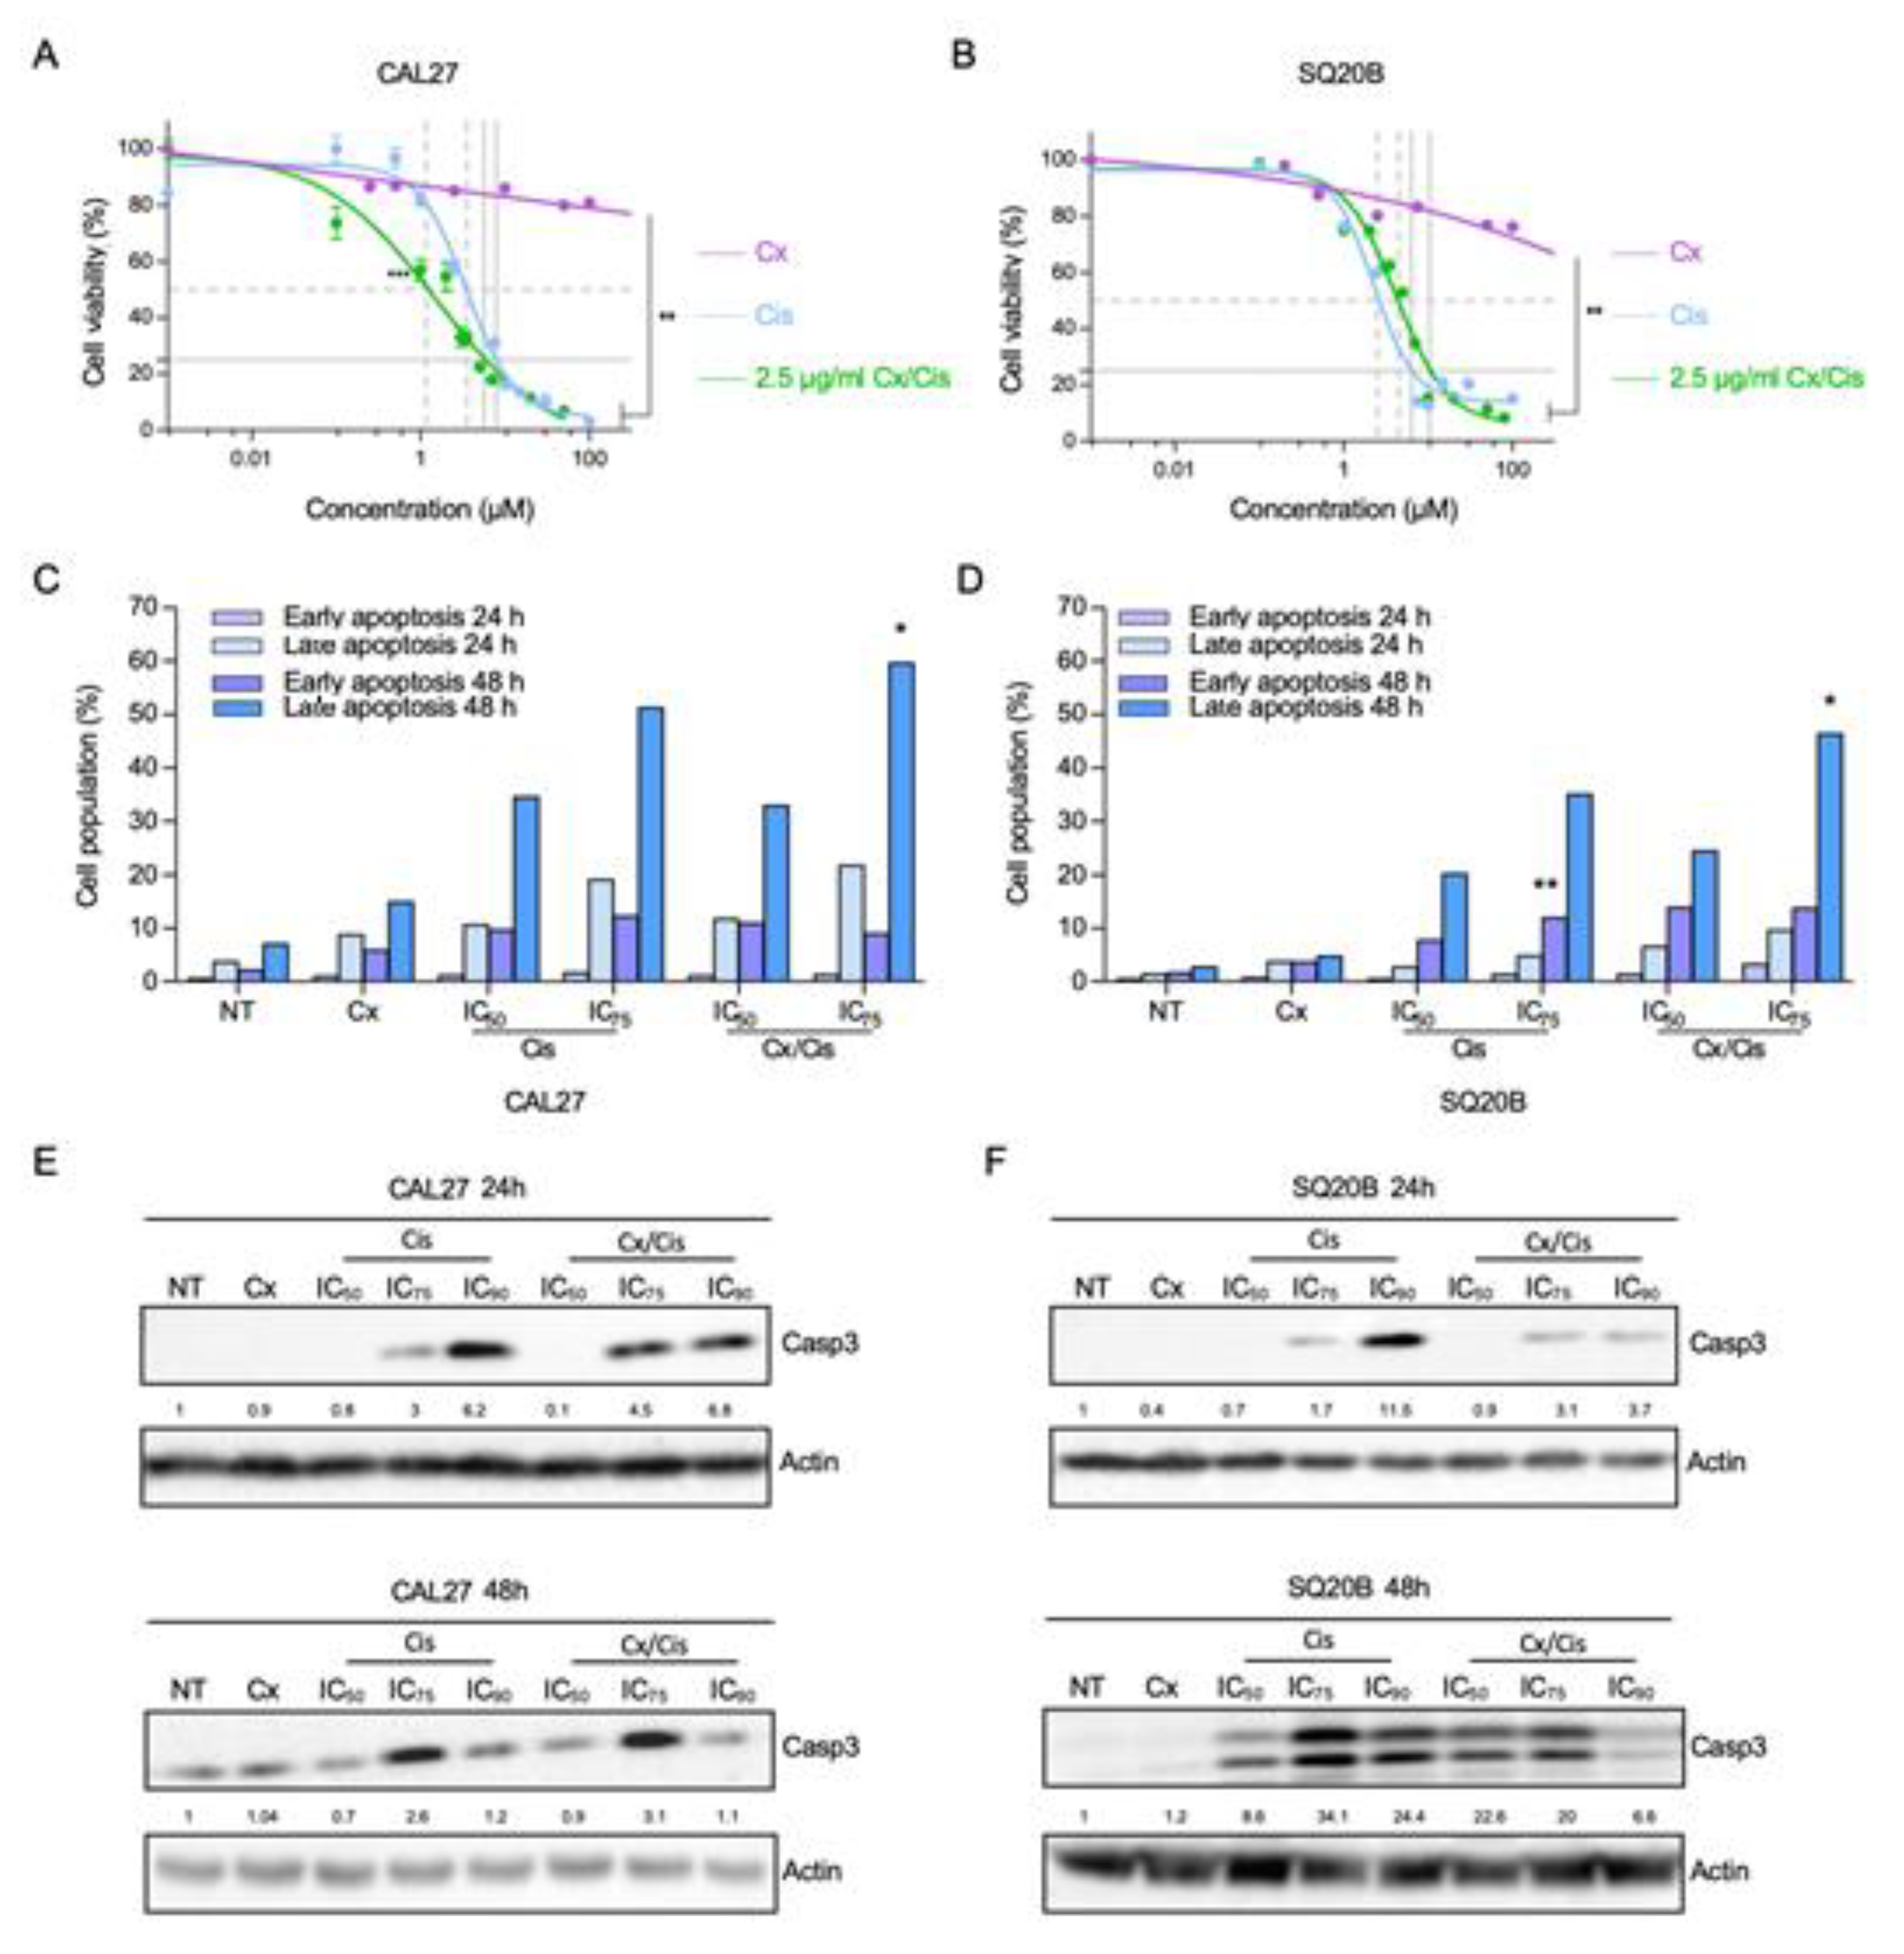
Abstract
:1. Introduction
2. Materials and Methods
2.1. Cell Lines and Reagents
2.2. In Vitro Cell Survival Analysis
2.3. Annexin V and PI Flow Cytometry
2.4. Gene Expression Assays
2.5. SDS-PAGE and Western Blot Analysis
2.6. Biotinylation and Immunoprecipitation of Cell Surface Proteins
2.7. Immunofluorescence Staining
2.8. Generation of hEGFR-MOC2 Clones
2.9. Vaccination Assay
2.10. Statistical Analysis
3. Results
3.1. Cetuximab and Cisplatin Inhibit HNSCC Cell Cycle and Trigger Apoptotic Cell Death
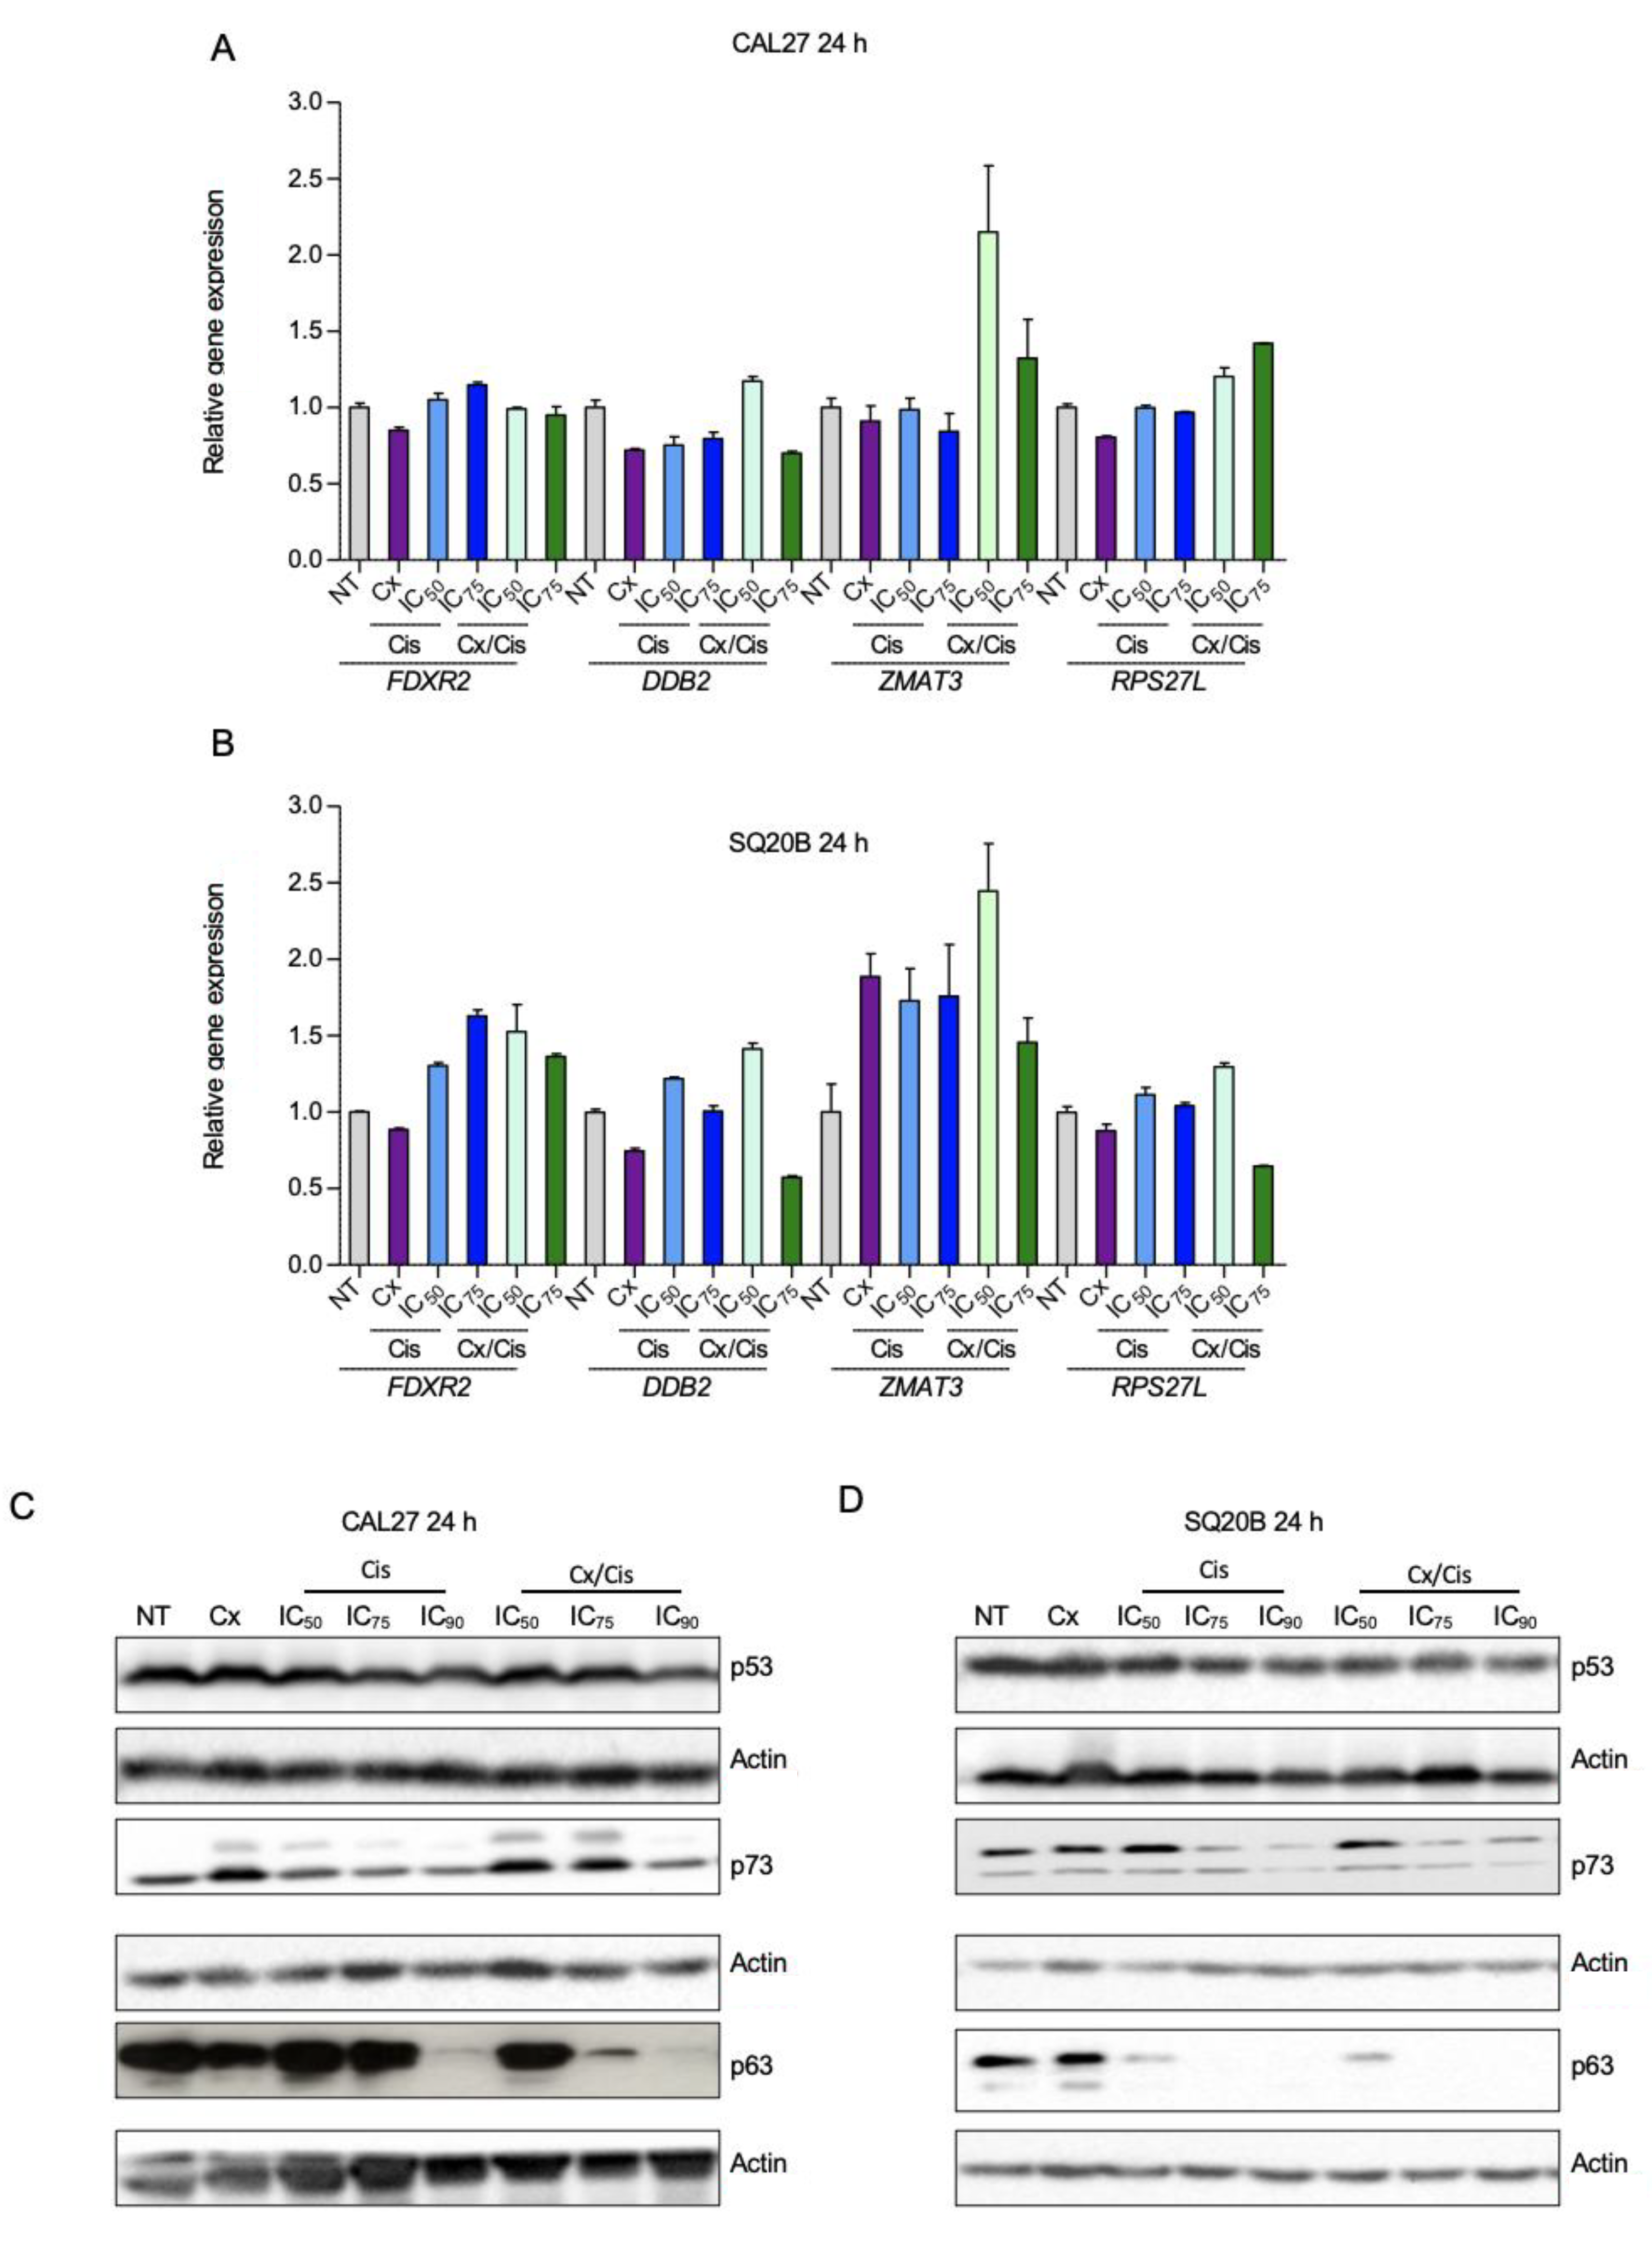
3.2. p53-Independent Induction of Apoptosis
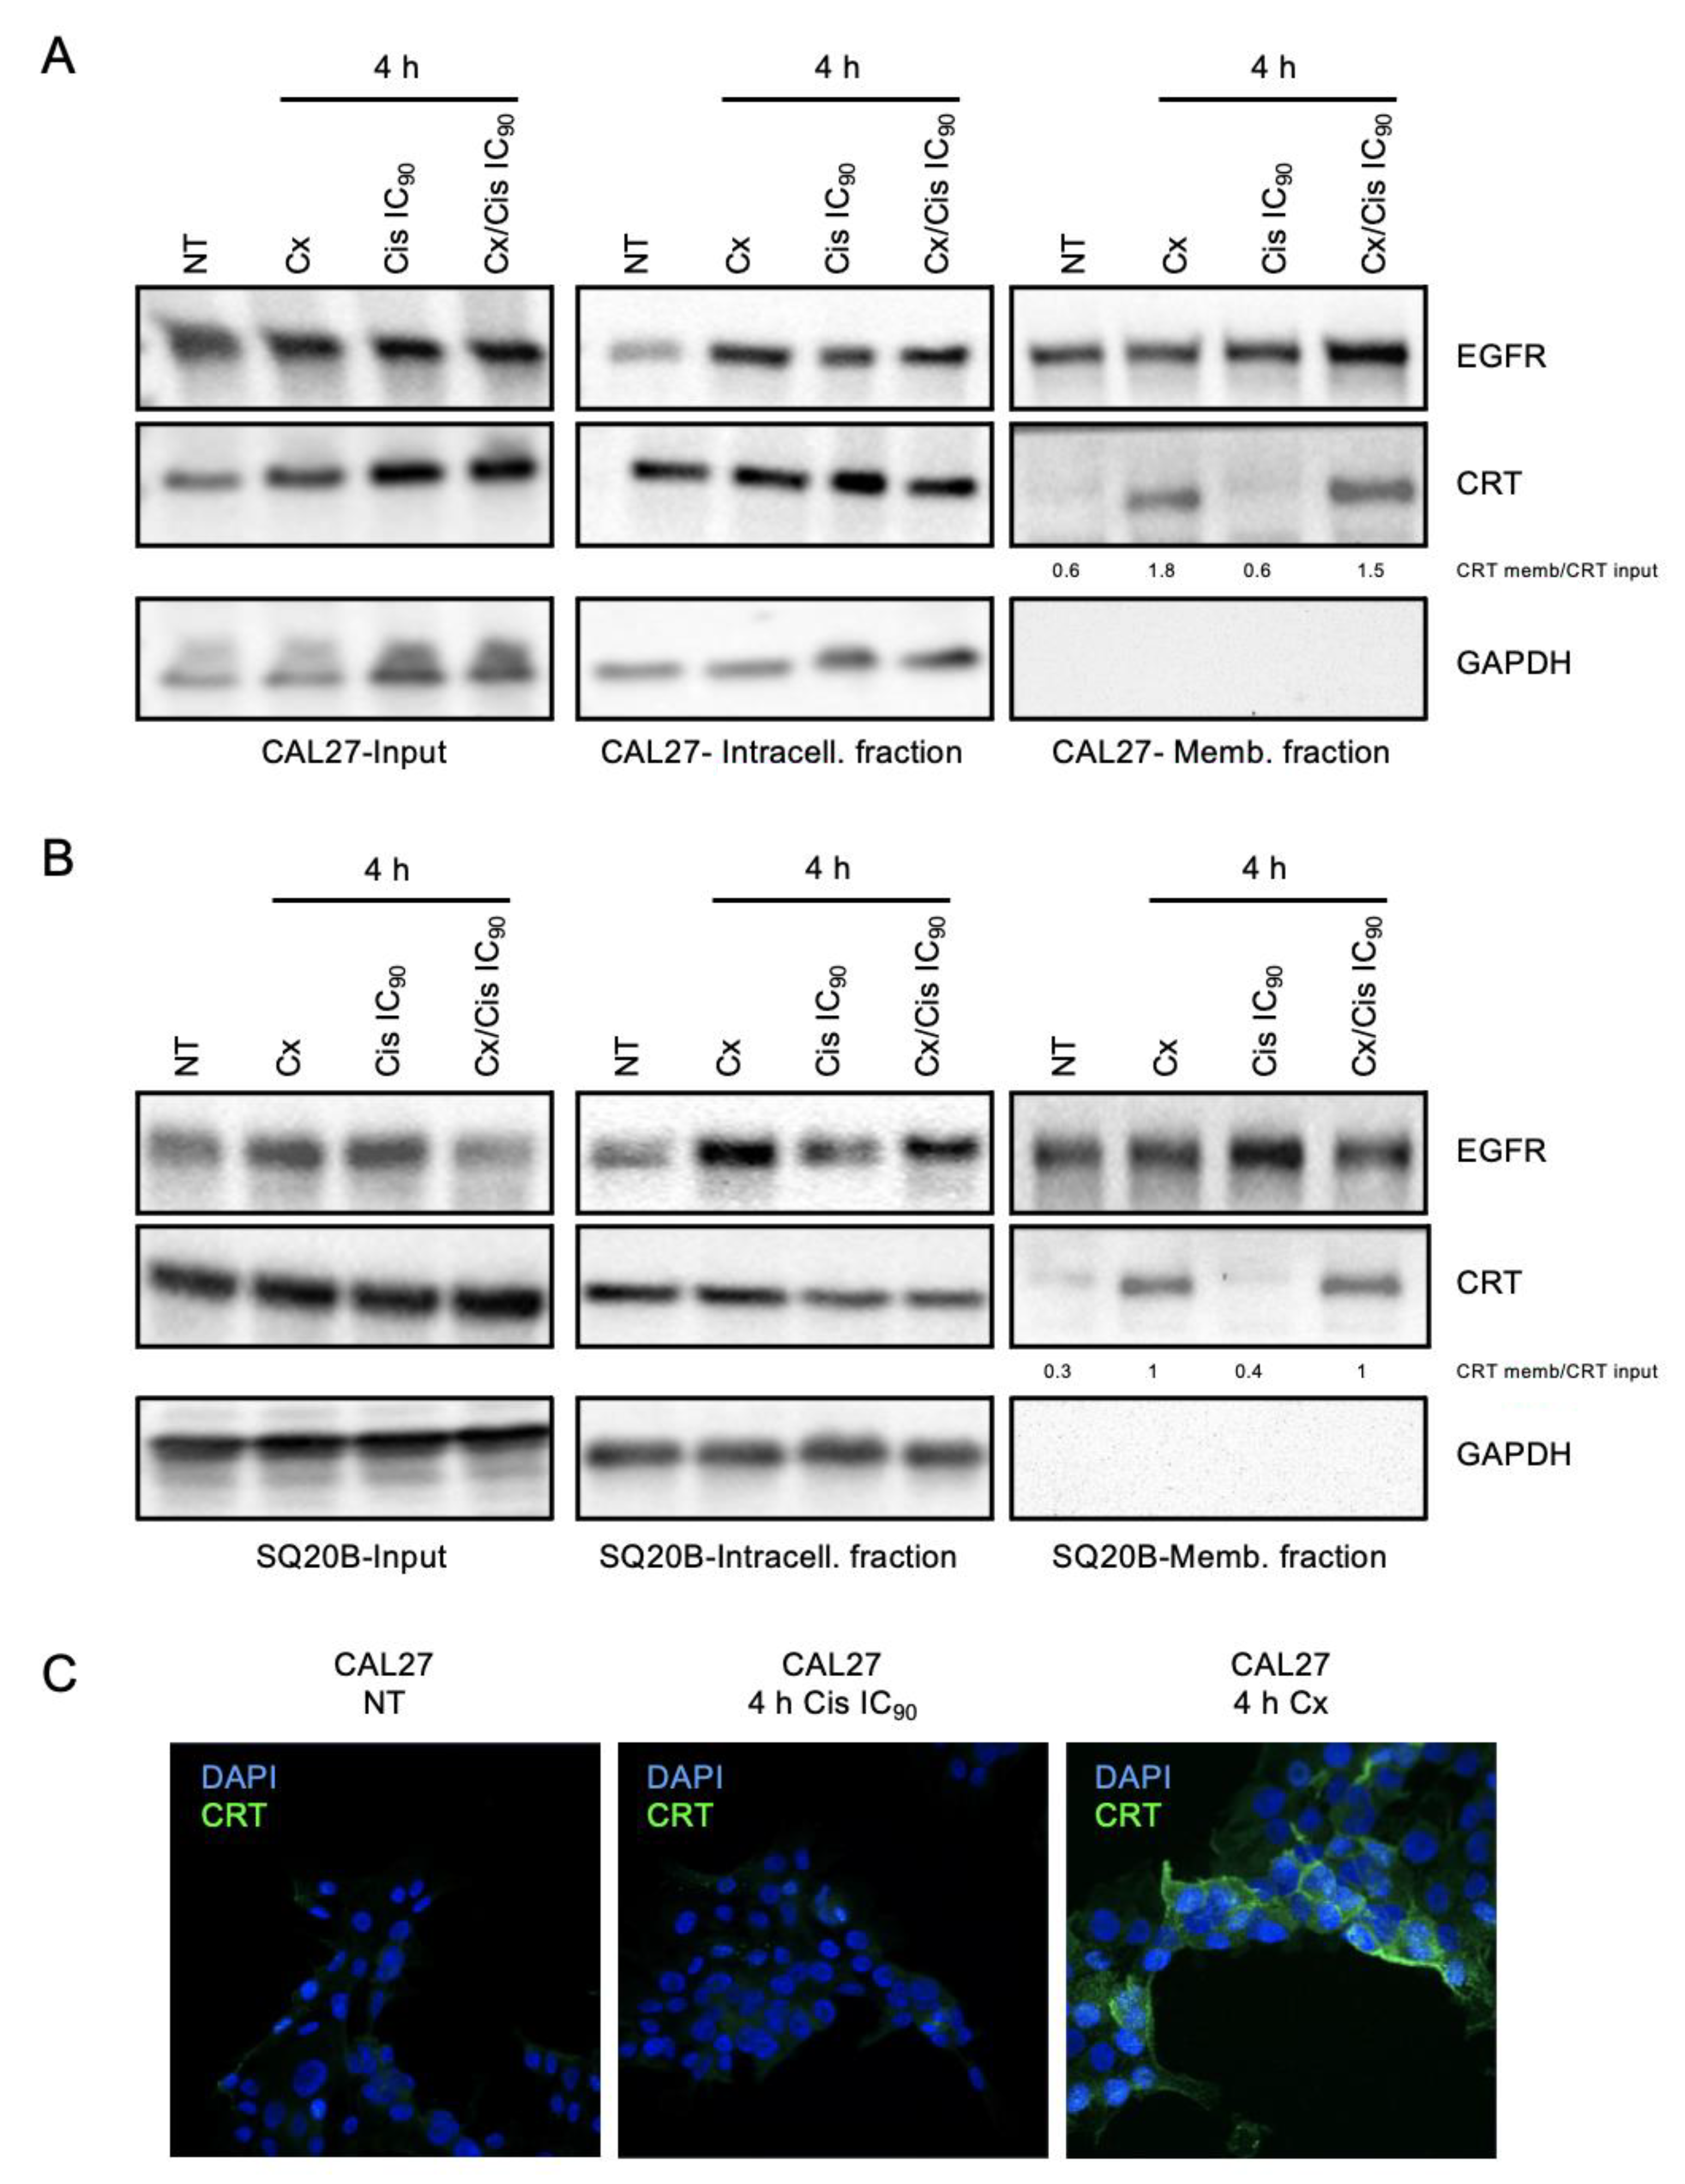
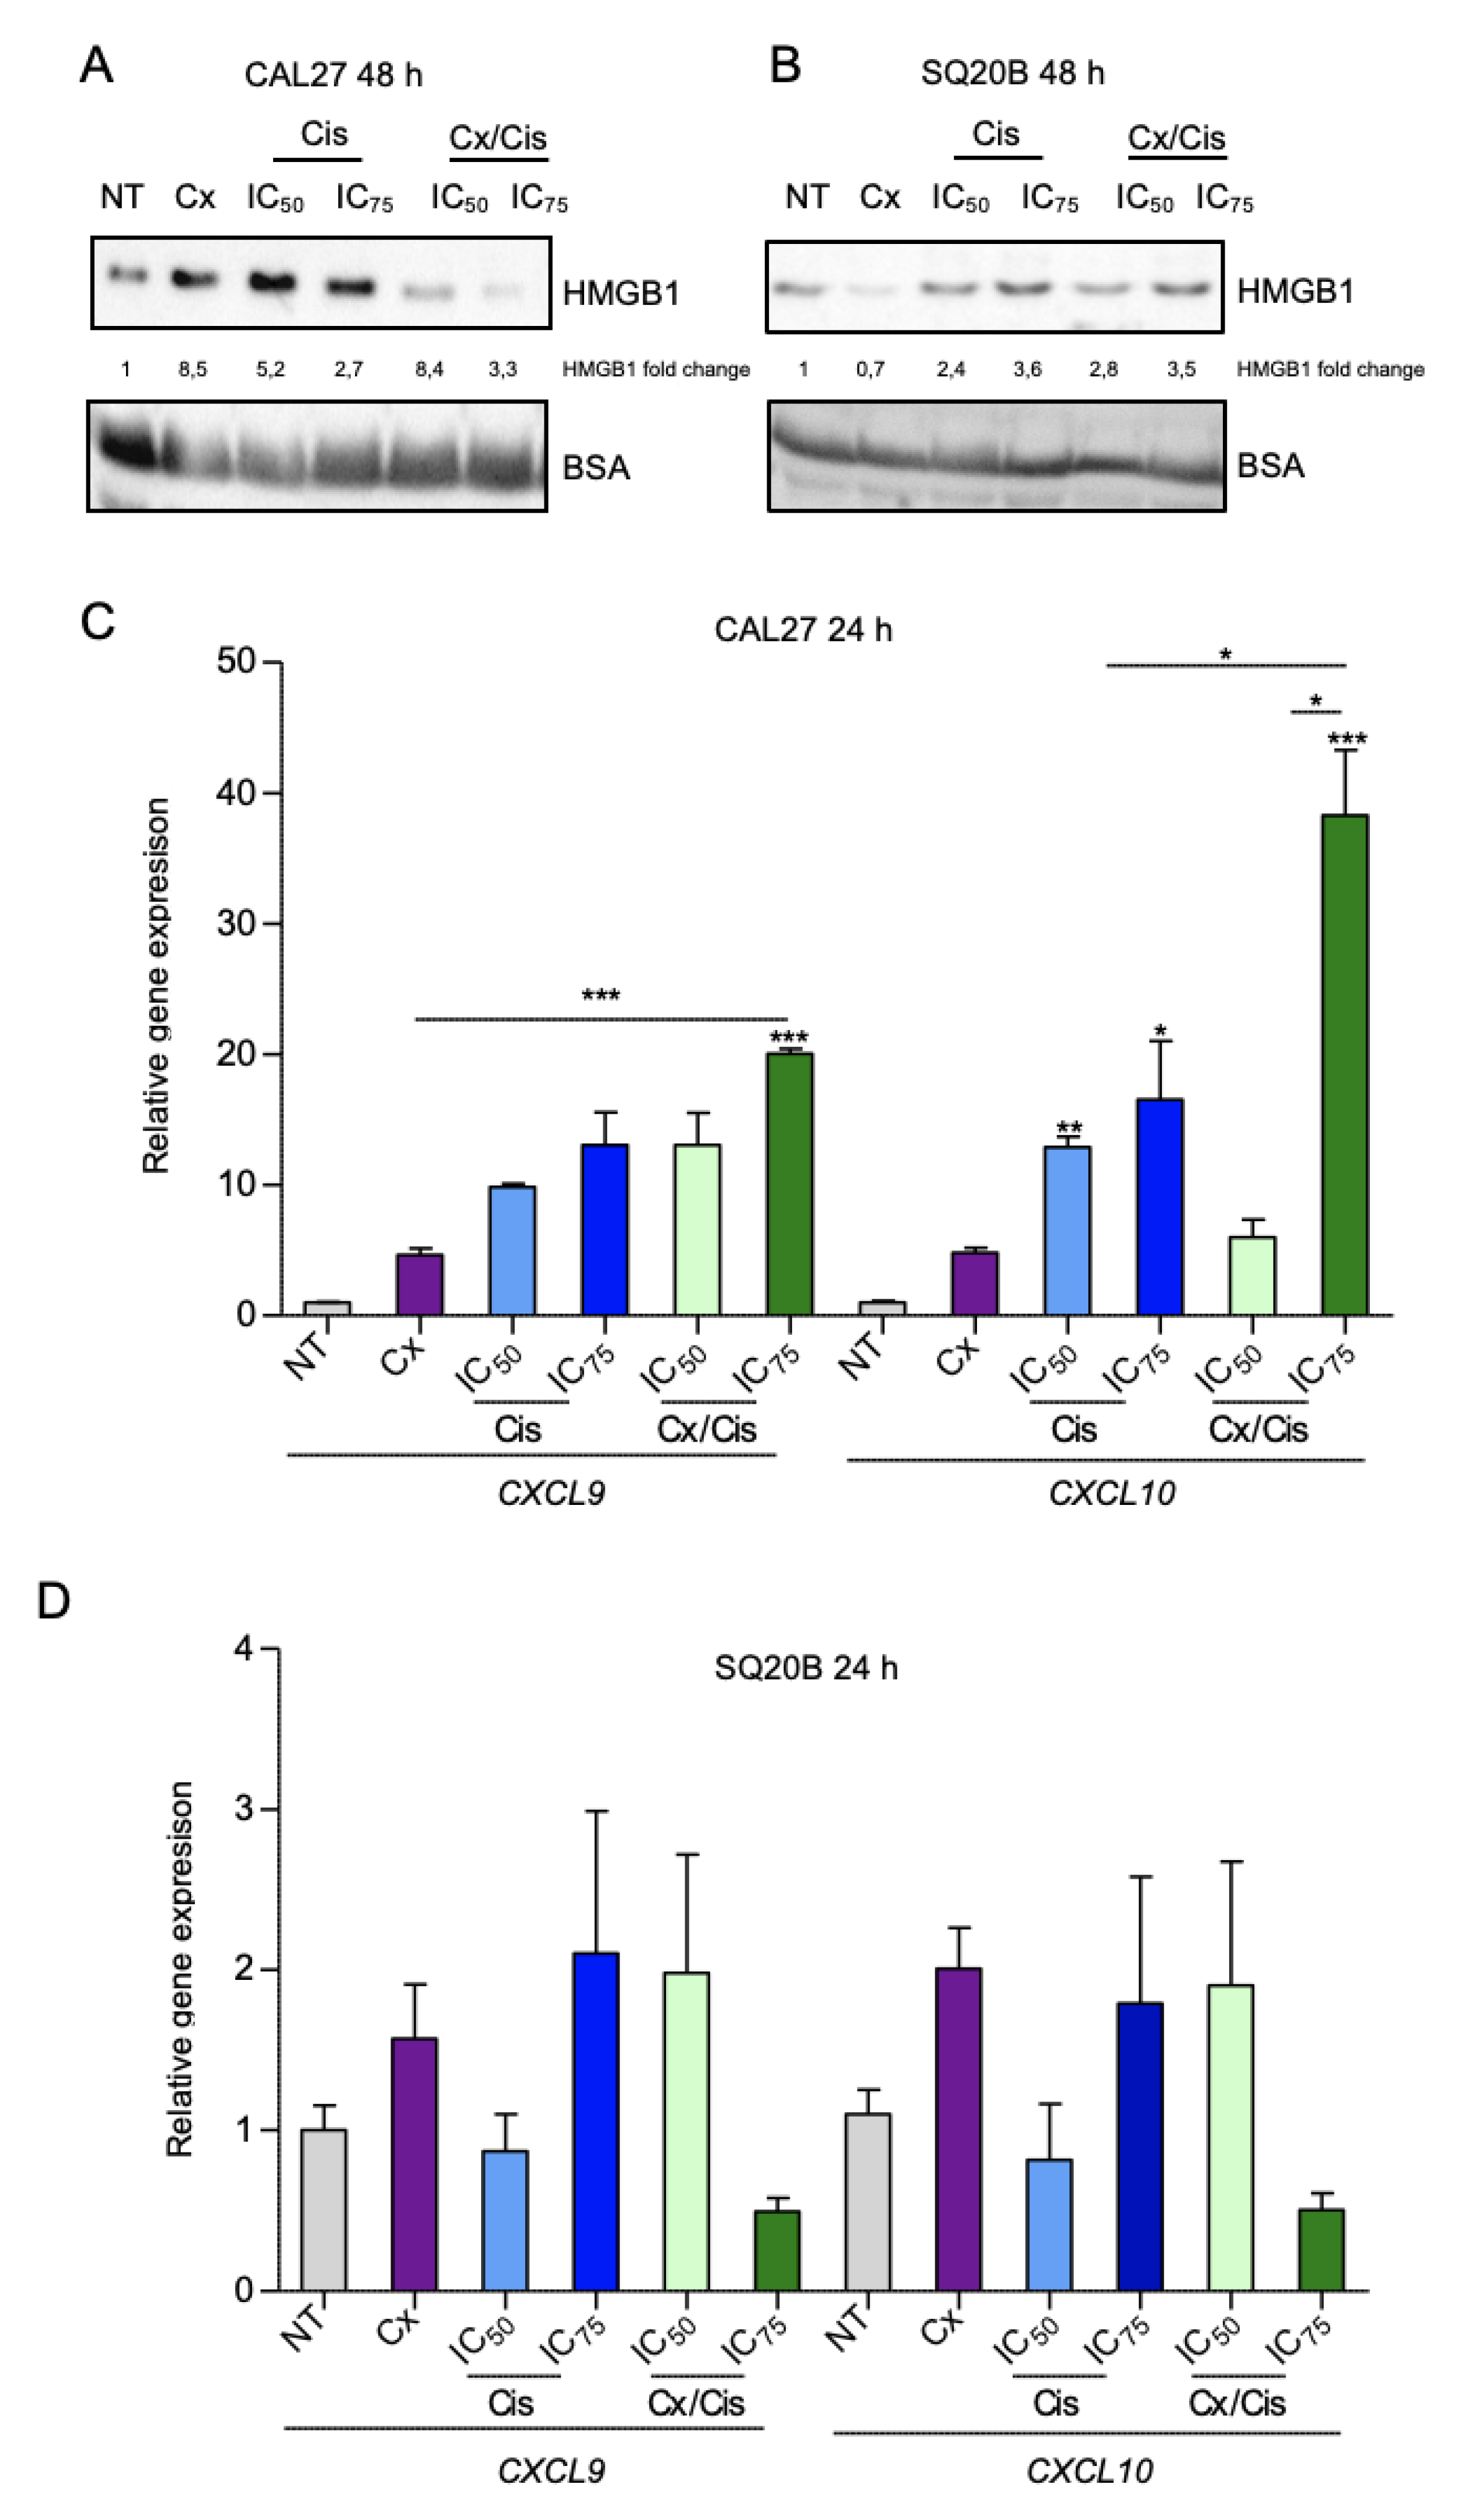
3.3. Danger-Associated Molecular Patterns Are Emitted by HNSCC Cells upon Cetuximab and/or Cisplatin Treatment
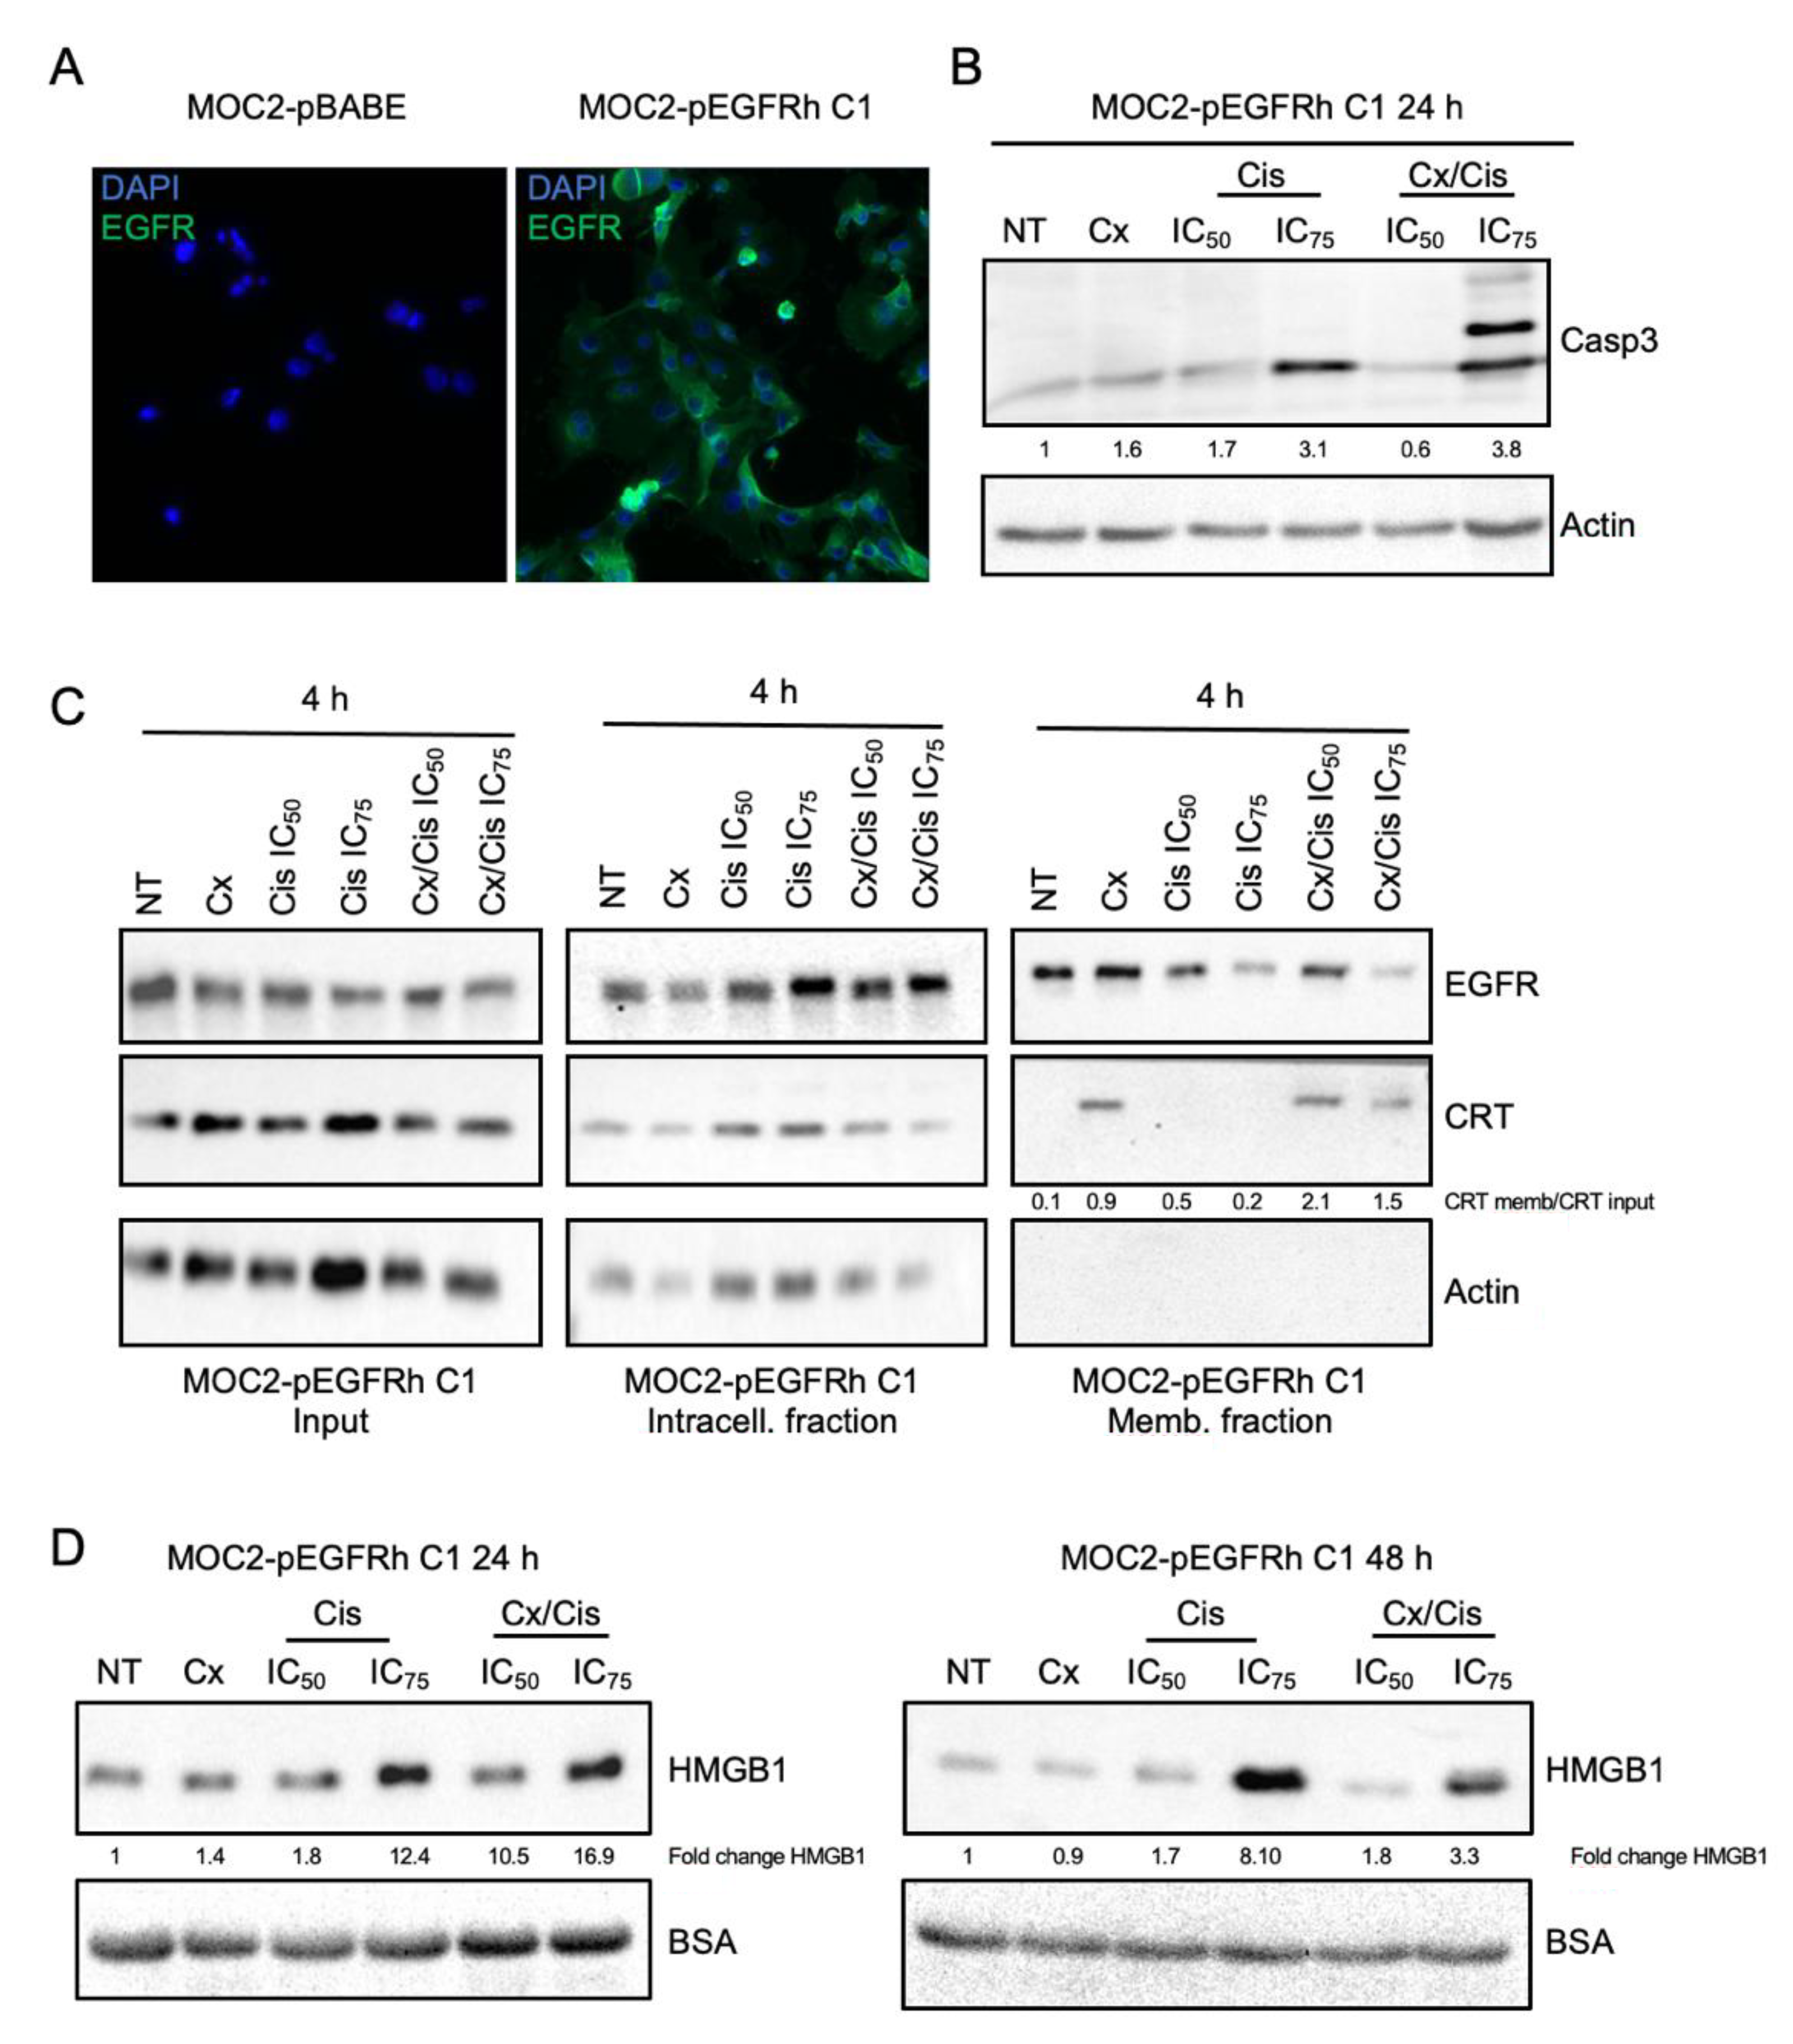
3.4. Cetuximab +/− Cisplatin Trigger DAMPs Emission in Murine Head and Neck Carcinoma Cells
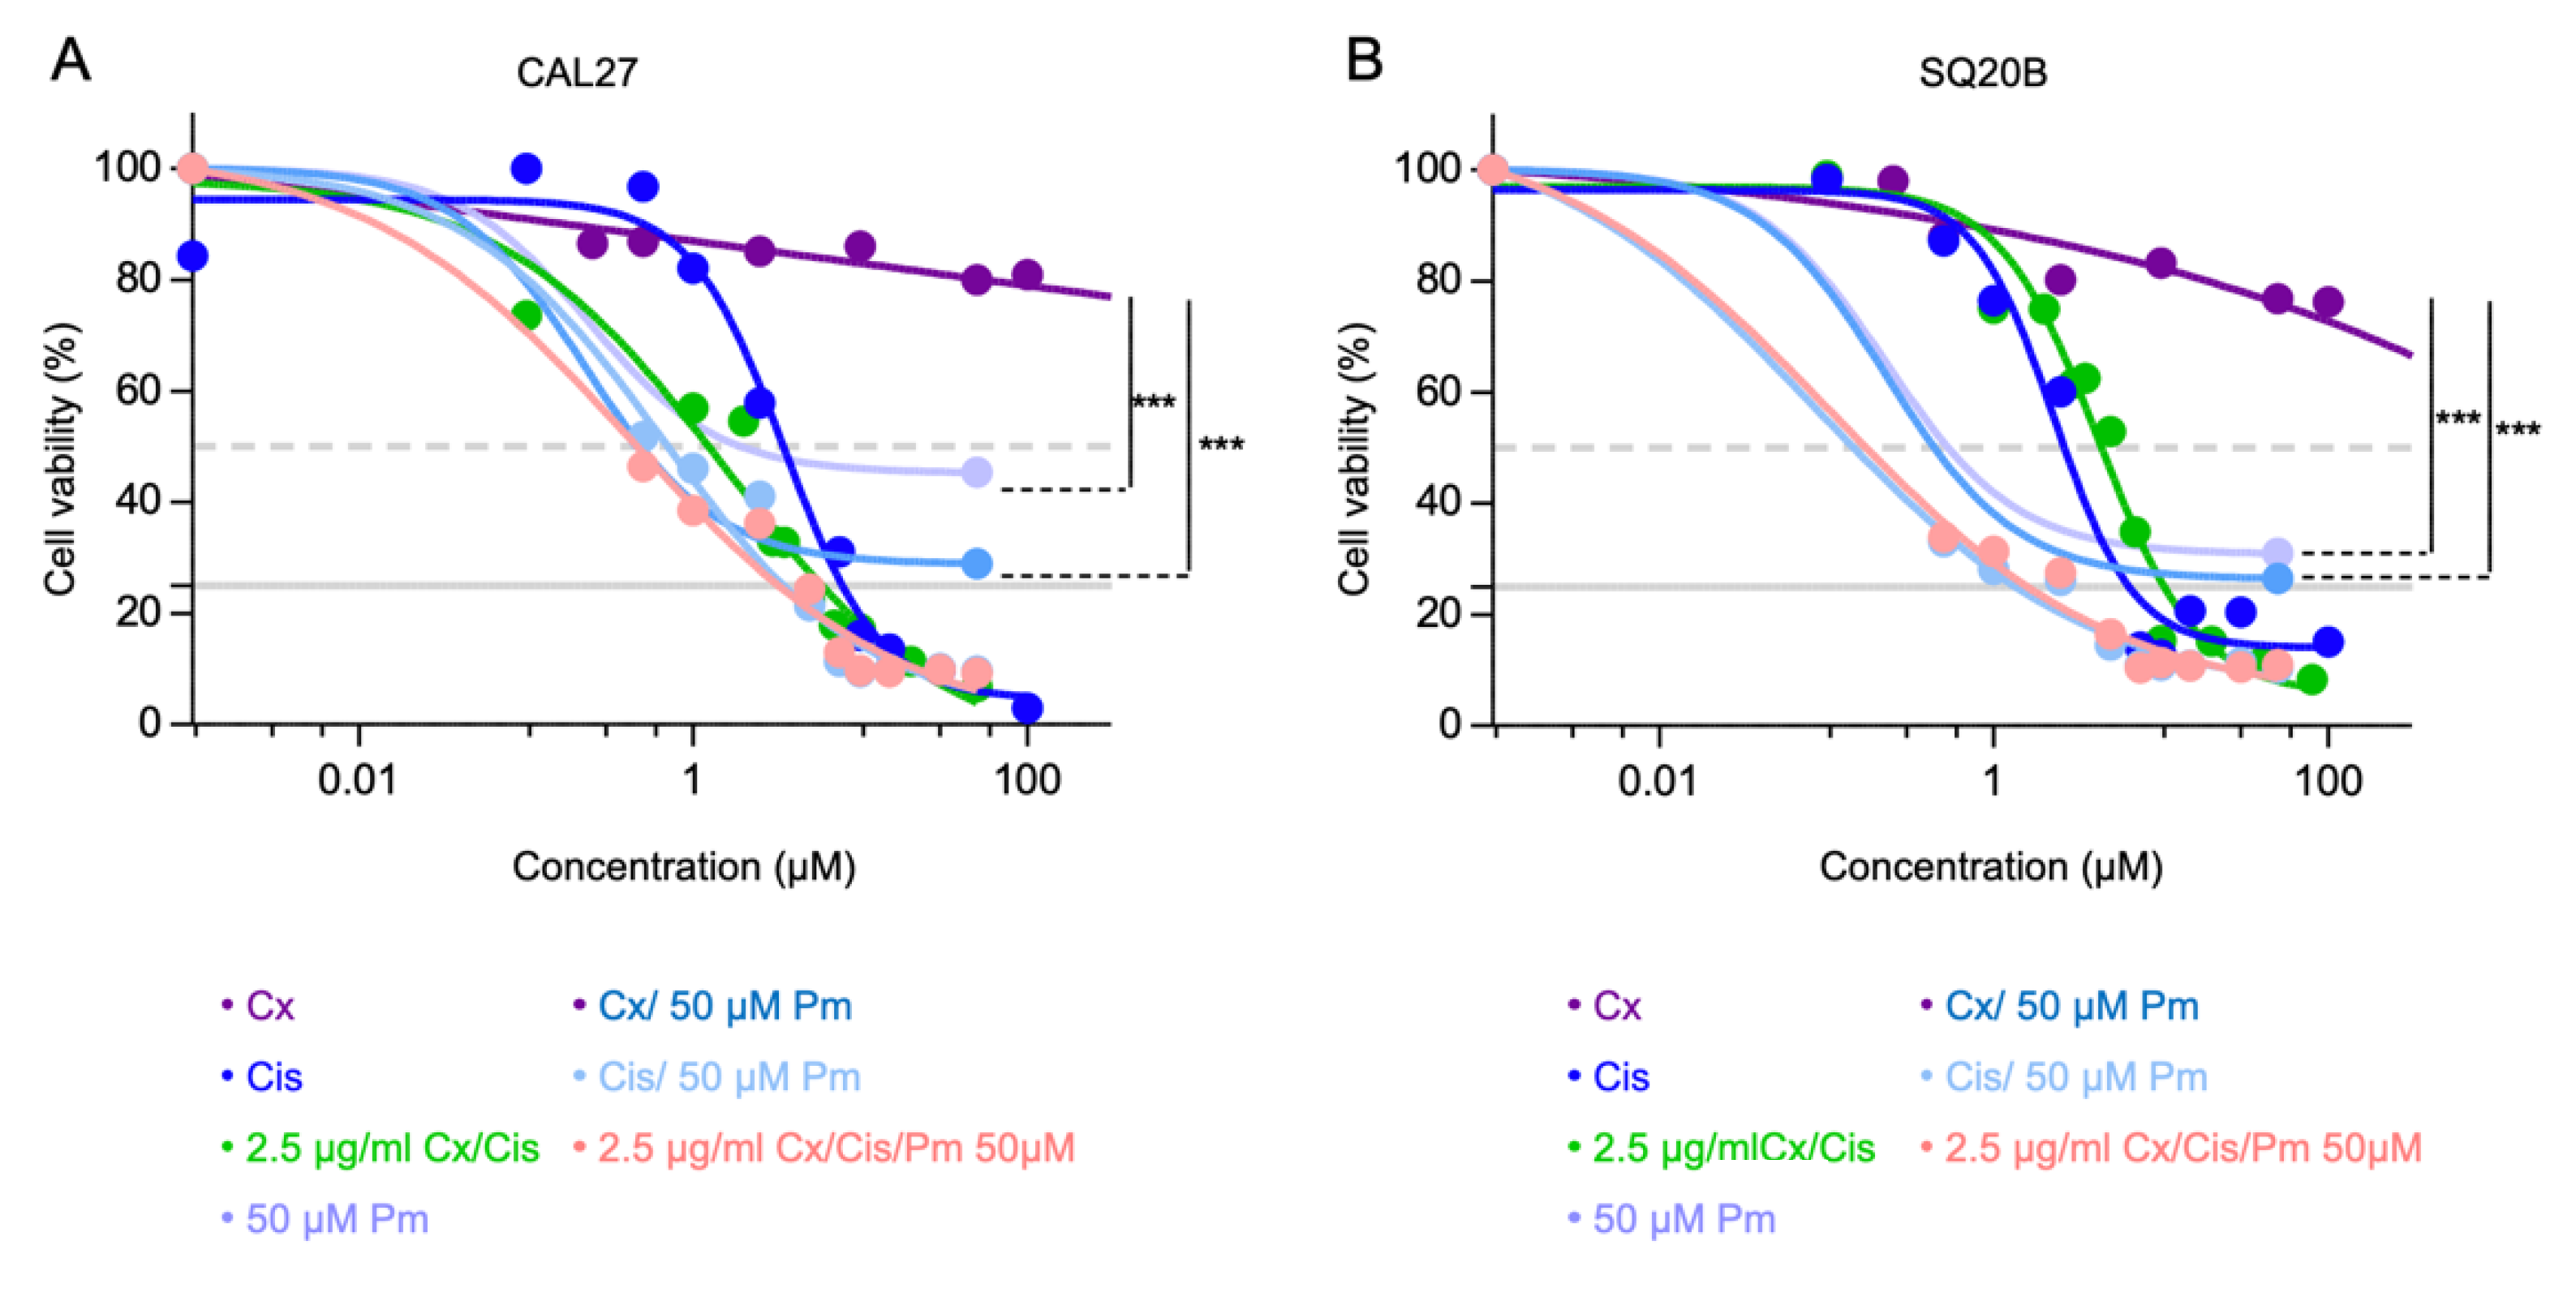
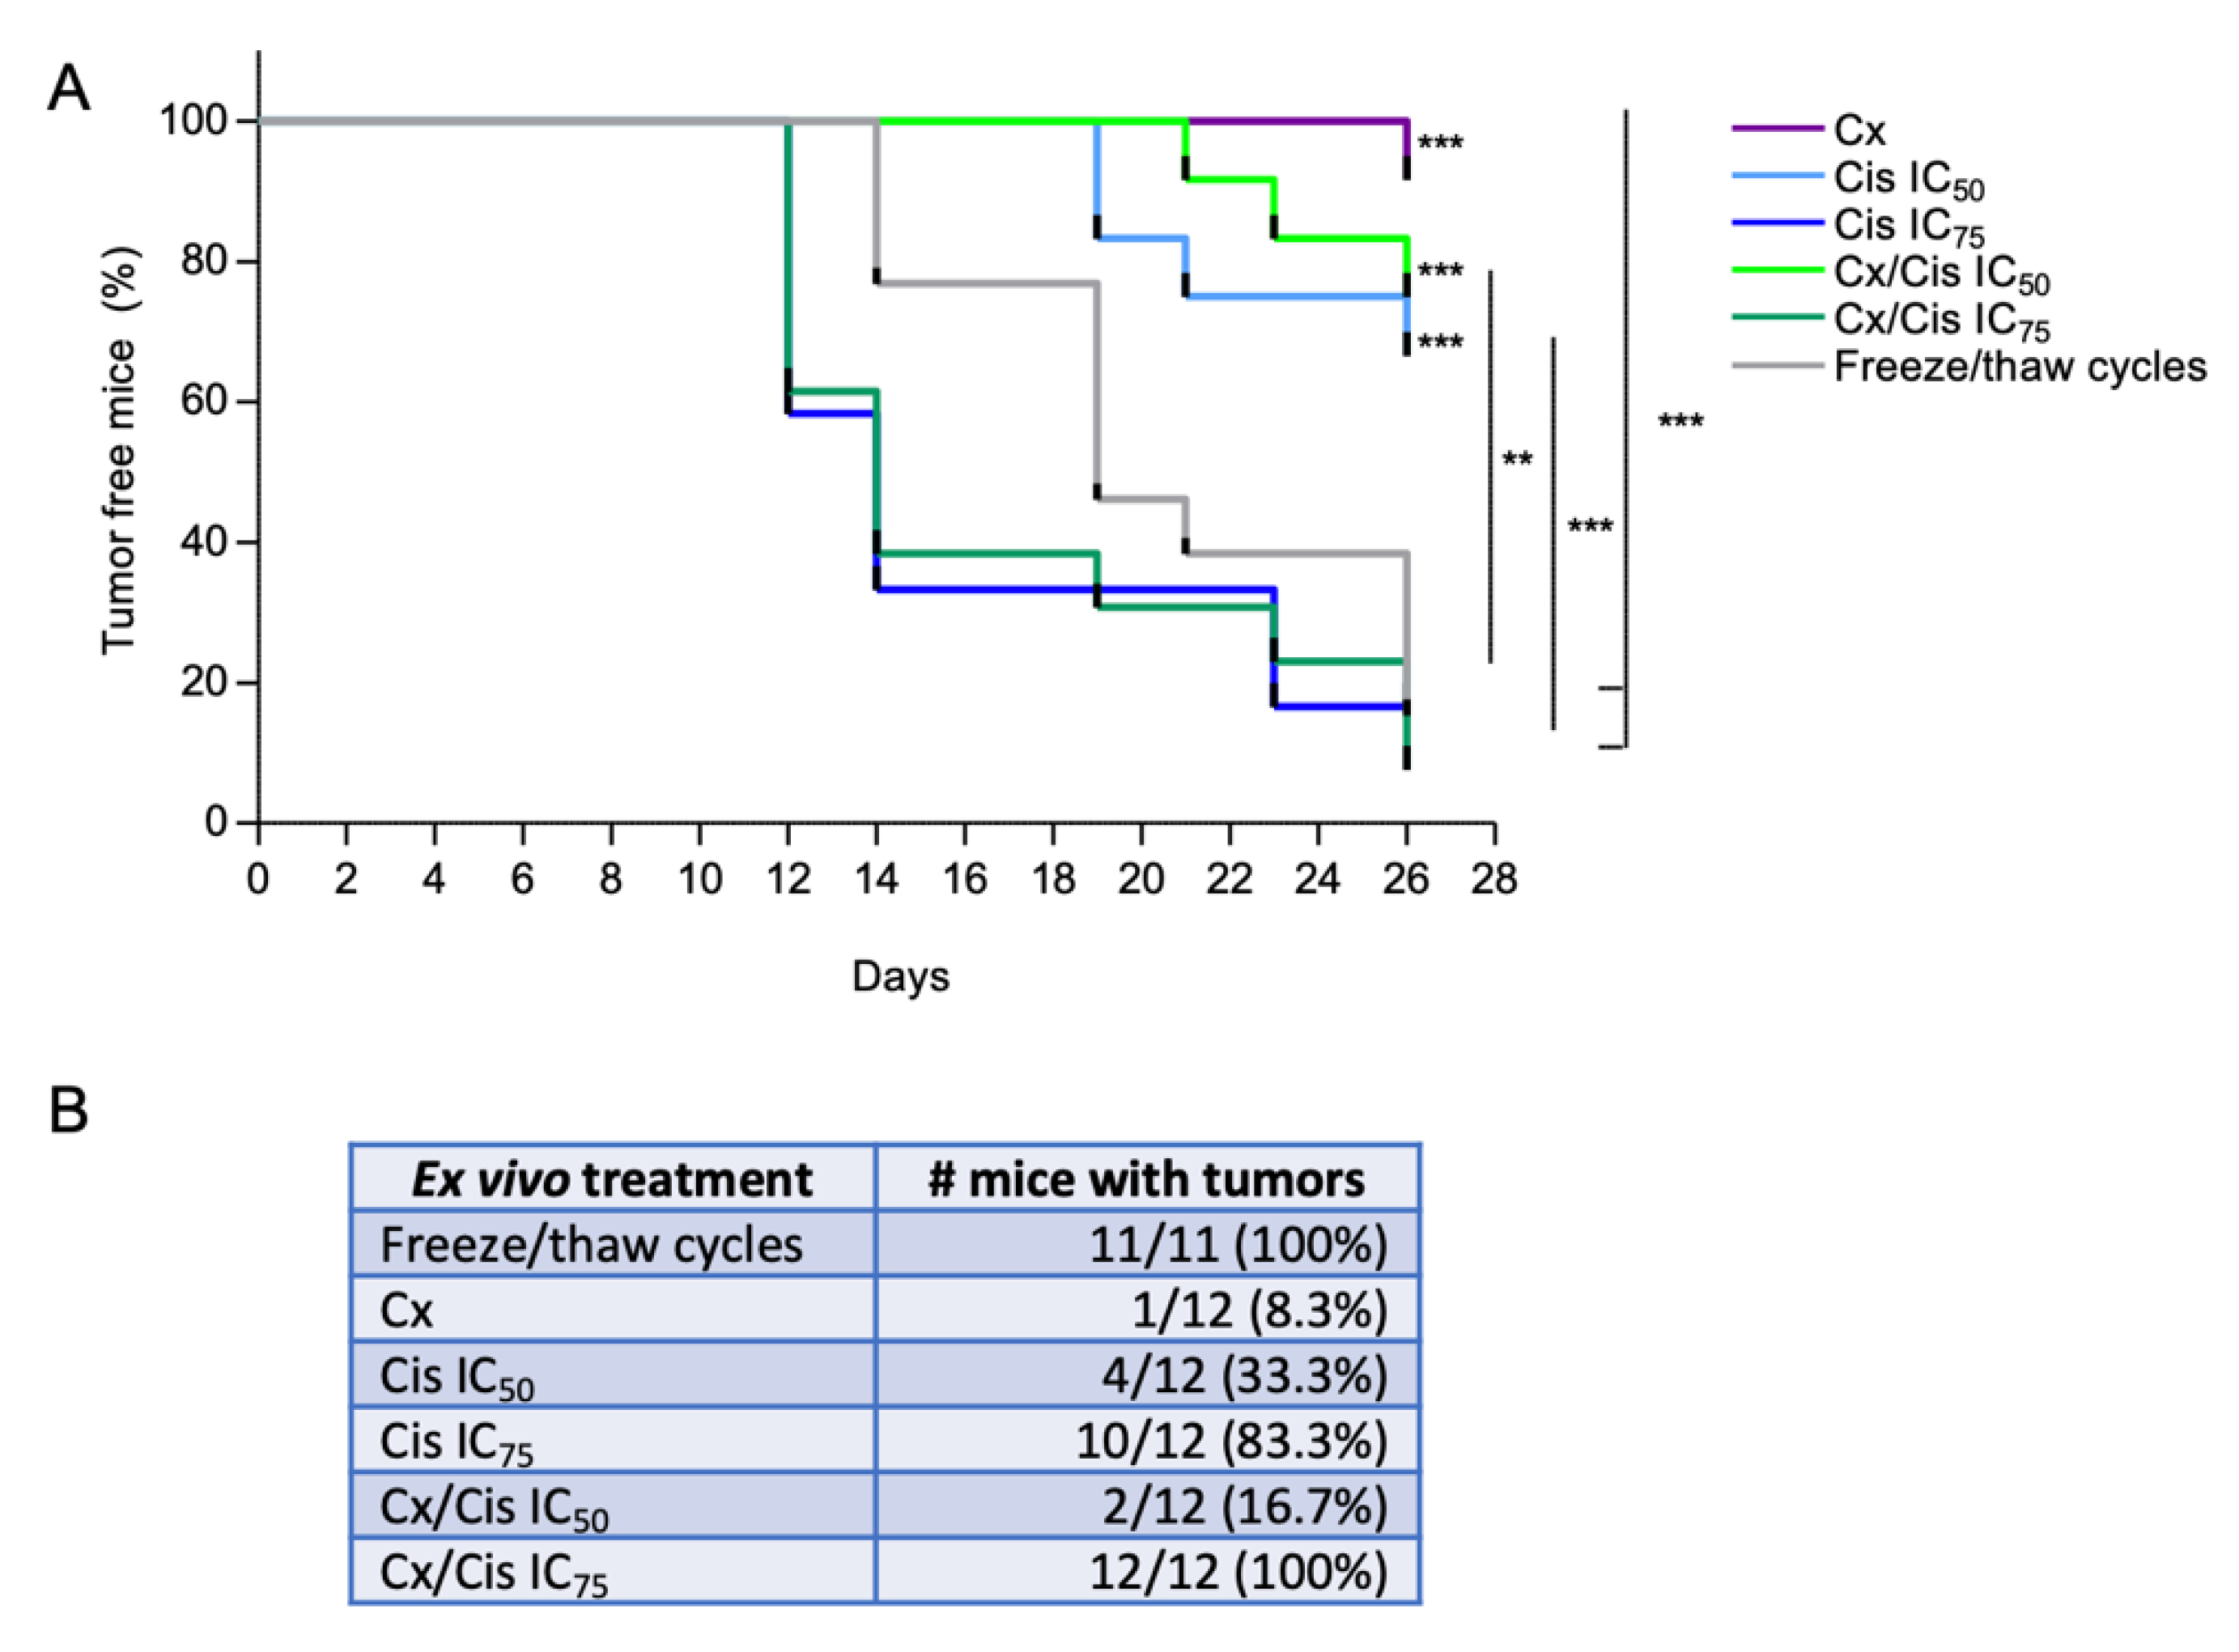
3.5. Induction of Bona Fide ICD by Cetuximab +/− IC50 of Cisplatin
4. Discussion
Supplementary Materials
Author Contributions
Funding
Institutional Review Board Statement
Informed Consent Statement
Data Availability Statement
Acknowledgments
Conflicts of Interest
References
- Johnson, D.E.; Burtness, B.; Leemans, C.R.; Lui, V.W.Y.; Bauman, J.E.; Grandis, J.R. Head and Neck Squamous Cell Carcinoma. Nat. Rev. Dis. Primer 2020, 6, 1–22. [Google Scholar] [CrossRef]
- Bray, F.; Ferlay, J.; Soerjomataram, I.; Siegel, R.L.; Torre, L.A.; Jemal, A. Global Cancer Statistics 2018: GLOBOCAN Estimates of Incidence and Mortality Worldwide for 36 Cancers in 185 Countries. CA. Cancer J. Clin. 2018, 68, 394–424. [Google Scholar] [CrossRef] [PubMed]
- Picon, H.; Guddati, A.K. Mechanisms of Resistance in Head and Neck Cancer. Am. J. Cancer Res. 2020, 10, 2742–2751. [Google Scholar] [PubMed]
- Pontes, F.; Garcia, A.R.; Domingues, I.; João Sousa, M.; Felix, R.; Amorim, C.; Salgueiro, F.; Mariano, M.; Teixeira, M. Survival Predictors and Outcomes of Patients with Recurrent and/or Metastatic Head and Neck Cancer Treated with Chemotherapy plus Cetuximab as First-Line Therapy: A Real-World Retrospective Study. Cancer Treat. Res. Commun. 2021, 27, 100375. [Google Scholar] [CrossRef]
- Vermorken, J.B.; Mesia, R.; Rivera, F.; Remenar, E.; Kawecki, A.; Rottey, S.; Erfan, J.; Zabolotnyy, D.; Kienzer, H.-R.; Cupissol, D.; et al. Platinum-Based Chemotherapy plus Cetuximab in Head and Neck Cancer. N. Engl. J. Med. 2008, 359, 1116–1127. [Google Scholar] [CrossRef]
- Rivera, F.; García-Castaño, A.; Vega, N.; Vega-Villegas, M.E.; Gutiérrez-Sanz, L. Cetuximab in Metastatic or Recurrent Head and Neck Cancer: The EXTREME Trial. Expert Rev. Anticancer Ther. 2009, 9, 1421–1428. [Google Scholar] [CrossRef]
- Muraro, E.; Fanetti, G.; Lupato, V.; Giacomarra, V.; Steffan, A.; Gobitti, C.; Vaccher, E.; Franchin, G. Cetuximab in Locally Advanced Head and Neck Squamous Cell Carcinoma: Biological Mechanisms Involved in Efficacy, Toxicity and Resistance. Crit. Rev. Oncol. Hematol. 2021, 164, 103424. [Google Scholar] [CrossRef]
- Coliat, P.; Ramolu, L.; Jégu, J.; Gaiddon, C.; Jung, A.C.; Pencreach, E. Constitutive or Induced HIF-2 Addiction Is Involved in Resistance to Anti-EGFR Treatment and Radiation Therapy in HNSCC. Cancers 2019, 11, 1607. [Google Scholar] [CrossRef]
- Job, S.; de Reyniès, A.; Heller, B.; Weiss, A.; Guérin, E.; Macabre, C.; Ledrappier, S.; Bour, C.; Wasylyk, C.; Etienne-Selloum, N.; et al. Preferential Response of Basal-Like Head and Neck Squamous Cell Carcinoma Cell Lines to EGFR-Targeted Therapy Depending on EREG-Driven Oncogenic Addiction. Cancers 2019, 11, 795. [Google Scholar] [CrossRef]
- Licona, C.; Delhorme, J.-B.; Riegel, G.; Vidimar, V.; Cerón-Camacho, R.; Boff, B.; Venkatasamy, A.; Tomasetto, C.; da Silva Figueiredo Celestino Gomes, P.; Rognan, D.; et al. Anticancer Activity of Ruthenium and Osmium Cyclometalated Compounds: Identification of ABCB1 and EGFR as Resistance Mechanisms. Inorg. Chem. Front. 2020, 7, 678–688. [Google Scholar] [CrossRef]
- Alsahafi, E.; Begg, K.; Amelio, I.; Raulf, N.; Lucarelli, P.; Sauter, T.; Tavassoli, M. Clinical Update on Head and Neck Cancer: Molecular Biology and Ongoing Challenges. Cell Death Dis. 2019, 10, 540. [Google Scholar] [CrossRef] [PubMed]
- Ortiz-Cuaran, S.; Bouaoud, J.; Karabajakian, A.; Fayette, J.; Saintigny, P. Precision Medicine Approaches to Overcome Resistance to Therapy in Head and Neck Cancers. Front. Oncol. 2021, 11, 614332. [Google Scholar] [CrossRef] [PubMed]
- Ferris, R.L.; Blumenschein, G.; Fayette, J.; Guigay, J.; Colevas, A.D.; Licitra, L.; Harrington, K.; Kasper, S.; Vokes, E.E.; Even, C.; et al. Nivolumab for Recurrent Squamous-Cell Carcinoma of the Head and Neck. N. Engl. J. Med. 2016, 375, 1856–1867. [Google Scholar] [CrossRef] [PubMed]
- Seiwert, T.Y.; Burtness, B.; Mehra, R.; Weiss, J.; Berger, R.; Eder, J.P.; Heath, K.; McClanahan, T.; Lunceford, J.; Gause, C.; et al. Safety and Clinical Activity of Pembrolizumab for Treatment of Recurrent or Metastatic Squamous Cell Carcinoma of the Head and Neck (KEYNOTE-012): An Open-Label, Multicentre, Phase 1b Trial. Lancet Oncol. 2016, 17, 956–965. [Google Scholar] [CrossRef]
- Bagaev, A.; Kotlov, N.; Nomie, K.; Svekolkin, V.; Gafurov, A.; Isaeva, O.; Osokin, N.; Kozlov, I.; Frenkel, F.; Gancharova, O.; et al. Conserved Pan-Cancer Microenvironment Subtypes Predict Response to Immunotherapy. Cancer Cell 2021, 39, 845–865.e7. [Google Scholar] [CrossRef]
- Mueller, C.G.; Gaiddon, C.; Venkatasamy, A. Current Clinical and Pre-Clinical Imaging Approaches to Study the Cancer-Associated Immune System. Front. Immunol. 2021, 12, 716860. [Google Scholar] [CrossRef]
- Dunn, G.P.; Old, L.J.; Schreiber, R.D. The Three Es of Cancer Immunoediting. Annu. Rev. Immunol. 2004, 22, 329–360. [Google Scholar] [CrossRef]
- Munhoz, R.R.; Postow, M.A. Recent Advances in Understanding Antitumor Immunity. F1000Research 2016, 5, 2545. [Google Scholar] [CrossRef]
- Markov, O.V.; Mironova, N.L.; Vlasov, V.V.; Zenkova, M.A. Molecular and Cellular Mechanisms of Antitumor Immune Response Activation by Dendritic Cells. Acta Naturae 2016, 8, 17–30. [Google Scholar] [CrossRef]
- Elmusrati, A.; Wang, J.; Wang, C.-Y. Tumor Microenvironment and Immune Evasion in Head and Neck Squamous Cell Carcinoma. Int. J. Oral Sci. 2021, 13, 24. [Google Scholar] [CrossRef]
- Wan, Y.Y. Regulatory T Cells: Immune Suppression and Beyond. Cell. Mol. Immunol. 2010, 7, 204–210. [Google Scholar] [CrossRef] [PubMed]
- Pan, Y.; Yu, Y.; Wang, X.; Zhang, T. Tumor-Associated Macrophages in Tumor Immunity. Front. Immunol. 2020, 11, 583084. [Google Scholar] [CrossRef] [PubMed]
- Yang, Y.; Li, C.; Liu, T.; Dai, X.; Bazhin, A.V. Myeloid-Derived Suppressor Cells in Tumors: From Mechanisms to Antigen Specificity and Microenvironmental Regulation. Front. Immunol. 2020, 11, 1371. [Google Scholar] [CrossRef] [PubMed]
- Solomon, B.; Young, R.J.; Rischin, D. Head and Neck Squamous Cell Carcinoma: Genomics and Emerging Biomarkers for Immunomodulatory Cancer Treatments. Semin. Cancer Biol. 2018, 52, 228–240. [Google Scholar] [CrossRef] [PubMed]
- Galluzzi, L.; Vitale, I.; Warren, S.; Adjemian, S.; Agostinis, P.; Martinez, A.B.; Chan, T.A.; Coukos, G.; Demaria, S.; Deutsch, E.; et al. Consensus Guidelines for the Definition, Detection and Interpretation of Immunogenic Cell Death. J. Immunother. Cancer 2020, 8, e000337. [Google Scholar] [CrossRef] [PubMed]
- Kepp, O.; Senovilla, L.; Vitale, I.; Vacchelli, E.; Adjemian, S.; Agostinis, P.; Apetoh, L.; Aranda, F.; Barnaba, V.; Bloy, N.; et al. Consensus Guidelines for the Detection of Immunogenic Cell Death. Oncoimmunology 2014, 3, e955691. [Google Scholar] [CrossRef] [PubMed]
- Galluzzi, L.; Vitale, I.; Aaronson, S.A.; Abrams, J.M.; Adam, D.; Agostinis, P.; Alnemri, E.S.; Altucci, L.; Amelio, I.; Andrews, D.W.; et al. Molecular Mechanisms of Cell Death: Recommendations of the Nomenclature Committee on Cell Death 2018. Cell Death Differ. 2018, 25, 486–541. [Google Scholar] [CrossRef]
- Limagne, E.; Nuttin, L.; Thibaudin, M.; Jacquin, E.; Aucagne, R.; Bon, M.; Revy, S.; Barnestein, R.; Ballot, E.; Truntzer, C.; et al. MEK Inhibition Overcomes Chemoimmunotherapy Resistance by Inducing CXCL10 in Cancer Cells. Cancer Cell 2022, 40, 136–152.e12. [Google Scholar] [CrossRef]
- Jung, A.C.; Moinard-Butot, F.; Thibaudeau, C.; Gasser, G.; Gaiddon, C. Antitumor Immune Response Triggered by Metal-Based Photosensitizers for Photodynamic Therapy: Where Are We? Pharmaceutics 2021, 13, 1788. [Google Scholar] [CrossRef]
- Pozzi, C.; Cuomo, A.; Spadoni, I.; Magni, E.; Silvola, A.; Conte, A.; Sigismund, S.; Ravenda, P.S.; Bonaldi, T.; Zampino, M.G.; et al. The EGFR-Specific Antibody Cetuximab Combined with Chemotherapy Triggers Immunogenic Cell Death. Nat. Med. 2016, 22, 624–631. [Google Scholar] [CrossRef]
- Park, S.-J.; Ye, W.; Xiao, R.; Silvin, C.; Padget, M.; Hodge, J.W.; van Waes, C.; Schmitt, N.C. Cisplatin and Oxaliplatin Induce Similar Immunogenic Changes in Preclinical Models of Head and Neck Cancer. Oral Oncol. 2019, 95, 127–135. [Google Scholar] [CrossRef] [PubMed]
- Tissue-Specific Transcription Factor Pit-1/GHF-1 Binds to the c-Fos Serum Response Element and Activates c-Fos Transcription. Molecular Endocrinology. Oxford Academic. Available online: https://academic.oup.com/mend/article/13/5/742/2741697 (accessed on 27 July 2022).
- Gottardi, C.J.; Dunbar, L.A.; Caplan, M.J. Biotinylation and Assessment of Membrane Polarity: Caveats and Methodological Concerns. Am. J. Physiol.-Ren. Physiol. 1995, 268, F285–F295. [Google Scholar] [CrossRef] [PubMed]
- Obeid, M.; Tesniere, A.; Ghiringhelli, F.; Fimia, G.M.; Apetoh, L.; Perfettini, J.-L.; Castedo, M.; Mignot, G.; Panaretakis, T.; Casares, N.; et al. Calreticulin Exposure Dictates the Immunogenicity of Cancer Cell Death. Nat. Med. 2007, 13, 54–61. [Google Scholar] [CrossRef]
- Blanchet, A.; Bourgmayer, A.; Kurtz, J.-E.; Mellitzer, G.; Gaiddon, C. Isoforms of the P53 Family and Gastric Cancer: A Ménage à Trois for an Unfinished Affair. Cancers 2021, 13, 916. [Google Scholar] [CrossRef] [PubMed]
- Di Agostino, S.; Sorrentino, G.; Ingallina, E.; Valenti, F.; Ferraiuolo, M.; Bicciato, S.; Piazza, S.; Strano, S.; del Sal, G.; Blandino, G. YAP Enhances the Pro-Proliferative Transcriptional Activity of Mutant P53 Proteins. EMBO Rep. 2016, 17, 188–201. [Google Scholar] [CrossRef] [PubMed]
- Donehower, L.A.; Soussi, T.; Korkut, A.; Liu, Y.; Schultz, A.; Cardenas, M.; Li, X.; Babur, O.; Hsu, T.-K.; Lichtarge, O.; et al. Integrated Analysis of TP53 Gene and Pathway Alterations in The Cancer Genome Atlas. Cell Rep. 2019, 28, 1370–1384.e5. [Google Scholar] [CrossRef]
- Gaiddon, C.; Lokshin, M.; Ahn, J.; Zhang, T.; Prives, C. A Subset of Tumor-Derived Mutant Forms of P53 Down-Regulate P63 and P73 through a Direct Interaction with the P53 Core Domain. Mol. Cell. Biol. 2001, 21, 1874–1887. [Google Scholar] [CrossRef]
- Miller, J.J.; Gaiddon, C.; Storr, T. A Balancing Act: Using Small Molecules for Therapeutic Intervention of the P53 Pathway in Cancer. Chem. Soc. Rev. 2020, 49, 6995–7014. [Google Scholar] [CrossRef]
- Miller, J.J.; Blanchet, A.; Orvain, C.; Nouchikian, L.; Reviriot, Y.; Clarke, R.M.; Martelino, D.; Wilson, D.; Gaiddon, C.; Storr, T. Bifunctional Ligand Design for Modulating Mutant P53 Aggregation in Cancer. Chem. Sci. 2019, 10, 10802–10814. [Google Scholar] [CrossRef]
- Apetoh, L.; Ghiringhelli, F.; Tesniere, A.; Obeid, M.; Ortiz, C.; Criollo, A.; Mignot, G.; Maiuri, M.C.; Ullrich, E.; Saulnier, P.; et al. Toll-like Receptor 4–Dependent Contribution of the Immune System to Anticancer Chemotherapy and Radiotherapy. Nat. Med. 2007, 13, 1050–1059. [Google Scholar] [CrossRef]
- Tokunaga, R.; Zhang, W.; Naseem, M.; Puccini, A.; Berger, M.D.; Soni, S.; McSkane, M.; Baba, H.; Lenz, H.-J. CXCL9, CXCL10, CXCL11/CXCR3 Axis for Immune Activation—A Target for Novel Cancer Therapy. Cancer Treat. Rev. 2018, 63, 40–47. [Google Scholar] [CrossRef] [PubMed]
- Sung, F.L.; Poon, T.C.W.; Hui, E.P.; Ma, B.B.Y.; Liong, E.; To, K.F. Antitumor Effect and Enhancement of Cytotoxic Drug Activity by Cetuximab in Nasopharyngeal Carcinoma Cells. In Vivo 2005, 9, 237–245. [Google Scholar]
- Son, D.J.; Hong, J.E.; Ban, J.O.; Park, J.H.; Lee, H.L.; Gu, S.M.; Hwang, J.Y.; Jung, M.H.; Lee, D.W.; Han, S.-B.; et al. Synergistic Inhibitory Effects of Cetuximab and Cisplatin on Human Colon Cancer Cell Growth via Inhibition of the ERK-Dependent EGF Receptor Signaling Pathway. BioMed Res. Int. 2015, 2015, e397563. [Google Scholar] [CrossRef] [PubMed]
- Jiang, N.; Wang, D.; Hu, Z.; Shin, H.; Qian, G.; Rahman, M.; Zhang, H.; Amin, A.; Nannapaneni, S.; Wang, X.; et al. Combination of Anti-HER3 Antibody MM-121/SAR256212 and Cetuximab Inhibits Tumor Growth in Preclinical Models of Head and Neck Squamous Cell Carcinoma. Mol. Cancer Ther. 2014, 13, 1826–1836. [Google Scholar] [CrossRef]
- Hientz, K.; Mohr, A.; Bhakta-Guha, D.; Efferth, T. The Role of P53 in Cancer Drug Resistance and Targeted Chemotherapy. Oncotarget 2017, 8, 8921–8946. [Google Scholar] [CrossRef]
- Zhou, G.; Liu, Z.; Myers, J.N. TP53 Mutations in Head and Neck Squamous Cell Carcinoma and Their Impact on Disease Progression and Treatment Response. J. Cell. Biochem. 2016, 117, 2682–2692. [Google Scholar] [CrossRef]
- Jiang, Z.; Liu, Z.; Li, M.; Chen, C.; Wang, X. Immunogenomics Analysis Reveals That TP53 Mutations Inhibit Tumor Immunity in Gastric Cancer. Transl. Oncol. 2018, 11, 1171–1187. [Google Scholar] [CrossRef]
- Zhang, H.; Huang, Z.; Song, Y.; Yang, Z.; Shi, Q.; Wang, K.; Zhang, Z.; Liu, Z.; Cui, X.; Li, F. The TP53-Related Signature Predicts Immune Cell Infiltration, Therapeutic Response, and Prognosis in Patients with Esophageal Carcinoma. Front. Genet. 2021, 12, 607238. [Google Scholar] [CrossRef]
- Guo, G.; Yu, M.; Xiao, W.; Celis, E.; Cui, Y. Local Activation of P53 in the Tumor Microenvironment Overcomes Immune Suppression and Enhances Antitumor Immunity. Cancer Res. 2017, 77, 2292–2305. [Google Scholar] [CrossRef]
- Deb, S.P.; Muñoz, R.M.; Brown, D.R.; Subler, M.A.; Deb, S. Wild-Type Human P53 Activates the Human Epidermal Growth Factor Receptor Promoter. Oncogene 1994, 9, 1341–1349. [Google Scholar]
- Ludes-Meyers, J.H.; Subler, M.A.; Shivakumar, C.V.; Munoz, R.M.; Jiang, P.; Bigger, J.E.; Brown, D.R.; Deb, S.P.; Deb, S. Transcriptional Activation of the Human Epidermal Growth Factor Receptor Promoter by Human P53. Mol. Cell. Biol. 1996, 16, 6009–6019. [Google Scholar] [CrossRef] [PubMed]
- Sauer, L.; Gitenay, D.; Vo, C.; Baron, V.T. Mutant P53 Initiates a Feedback Loop That Involves Egr-1/EGF Receptor/ERK in Prostate Cancer Cells. Oncogene 2010, 29, 2628–2637. [Google Scholar] [CrossRef] [PubMed] [Green Version]
- Huang, S.; Benavente, S.; Armstrong, E.A.; Li, C.; Wheeler, D.L.; Harari, P.M. P53 Modulates Acquired Resistance to EGFR Inhibitors and Radiation. Cancer Res. 2011, 71, 7071–7079. [Google Scholar] [CrossRef] [PubMed]
- Bouali, S.; Chrétien, A.-S.; Ramacci, C.; Rouyer, M.; Marchal, S.; Galenne, T.; Juin, P.; Becuwe, P.; Merlin, J.-L. P53 and PTEN Expression Contribute to the Inhibition of EGFR Downstream Signaling Pathway by Cetuximab. Cancer Gene Ther. 2009, 16, 498–507. [Google Scholar] [CrossRef]
- Faridoni-Laurens, L.; Tourpin, S.; Alsafadi, S.; Barrois, M.; Temam, S.; Janot, F.; Koscielny, S.; Bosq, J.; Bénard, J.; Ahomadegbe, J.-C. Involvement of N-Terminally Truncated Variants of P73, DeltaTAp73, in Head and Neck Squamous Cell Cancer: A Comparison with P53 Mutations. Cell Cycle Georget. Tex 2008, 7, 1587–1596. [Google Scholar] [CrossRef]
- Gwosdz, C.; Balz, V.; Scheckenbach, K.; Bier, H. P53, P63 and P73 Expression in Squamous Cell Carcinomas of the Head and Neck and Their Response to Cisplatin Exposure. In Advances in Oto-Rhino-Laryngology; Bier, H., Ed.; KARGER: Basel, Switzerland, 2004; pp. 58–71. ISBN 978-3-8055-7789-2. [Google Scholar]
- Knickelbein, K.; Tong, J.-S.; Chen, D.; Wang, Y.-J.; Misale, S.; Bardelli, A.; Yu, J.; Zhang, L. Restoring PUMA Induction Overcomes KRAS-Mediated Resistance to Anti-EGFR Antibodies in Colorectal Cancer. Oncogene 2018, 37, 4599–4610. [Google Scholar] [CrossRef]
- Rocco, J.W.; Leong, C.-O.; Kuperwasser, N.; DeYoung, M.P.; Ellisen, L.W. P63 Mediates Survival in Squamous Cell Carcinoma by Suppression of P73-Dependent Apoptosis. Cancer Cell 2006, 9, 45–56. [Google Scholar] [CrossRef]
- Rocco, J.W. p63 and p73: Life and Death in Squamous Cell Carcinoma. Cell Cycle 2006, 5, 936–940. [Google Scholar] [CrossRef]
- Panaretakis, T.; Kepp, O.; Brockmeier, U.; Tesniere, A.; Bjorklund, A.-C.; Chapman, D.C.; Durchschlag, M.; Joza, N.; Pierron, G.; van Endert, P.; et al. Mechanisms of Pre-Apoptotic Calreticulin Exposure in Immunogenic Cell Death. EMBO J. 2009, 28, 578–590. [Google Scholar] [CrossRef]
- Martins, I.; Kepp, O.; Schlemmer, F.; Adjemian, S.; Tailler, M.; Shen, S.; Michaud, M.; Menger, L.; Gdoura, A.; Tajeddine, N.; et al. Restoration of the Immunogenicity of Cisplatin-Induced Cancer Cell Death by Endoplasmic Reticulum Stress. Oncogene 2011, 30, 1147–1158. [Google Scholar] [CrossRef]
- Sims, G.P.; Rowe, D.C.; Rietdijk, S.T.; Herbst, R.; Coyle, A.J. HMGB1 and RAGE in Inflammation and Cancer. Annu. Rev. Immunol. 2010, 28, 367–388. [Google Scholar] [CrossRef] [PubMed]
- Sistigu, A.; Yamazaki, T.; Vacchelli, E.; Chaba, K.; Enot, D.P.; Adam, J.; Vitale, I.; Goubar, A.; Baracco, E.E.; Remédios, C.; et al. Cancer Cell–Autonomous Contribution of Type I Interferon Signaling to the Efficacy of Chemotherapy. Nat. Med. 2014, 20, 1301–1309. [Google Scholar] [CrossRef] [PubMed]
- Judd, N.P.; Allen, C.T.; Winkler, A.E.; Uppaluri, R. Comparative Analysis of Tumor Infiltrating Lymphocytes in a Syngeneic Mouse Model of Oral Cancer. Octolaryngol.-Head Neck Surg. 2012, 147, 493–500. [Google Scholar] [CrossRef] [PubMed]
- Garrido, G.; Rabasa, A.; Sánchez, B.; López, M.V.; Blanco, R.; López, A.; Hernández, D.R.; Pérez, R.; Fernández, L.E. Induction of Immunogenic Apoptosis by Blockade of Epidermal Growth Factor Receptor Activation with a Specific Antibody. J. Immunol. Baltim. Md 1950 2011, 187, 4954–4966. [Google Scholar] [CrossRef]
- Galluzzi, L.; López-Soto, A.; Kumar, S.; Kroemer, G. Caspases Connect Cell-Death Signaling to Organismal Homeostasis. Immunity 2016, 44, 221–231. [Google Scholar] [CrossRef]
- Wu, J.; Waxman, D.J. Immunogenic Chemotherapy: Dose and Schedule Dependence and Combination with Immunotherapy. Cancer Lett. 2018, 419, 210–221. [Google Scholar] [CrossRef]
- Tatarova, Z.; Blumberg, D.C.; Korkola, J.E.; Heiser, L.M.; Muschler, J.L.; Schedin, P.J.; Ahn, S.W.; Mills, G.B.; Coussens, L.M.; Jonas, O.; et al. A Multiplex Implantable Microdevice Assay Identifies Synergistic Combinations of Cancer Immunotherapies and Conventional Drugs. Nat. Biotechnol. 2022, 1–11. [Google Scholar] [CrossRef]


Publisher’s Note: MDPI stays neutral with regard to jurisdictional claims in published maps and institutional affiliations. |
© 2022 by the authors. Licensee MDPI, Basel, Switzerland. This article is an open access article distributed under the terms and conditions of the Creative Commons Attribution (CC BY) license (https://creativecommons.org/licenses/by/4.0/).
Share and Cite
De Azevedo, J.; Mourtada, J.; Bour, C.; Devignot, V.; Schultz, P.; Borel, C.; Pencreach, E.; Mellitzer, G.; Gaiddon, C.; Jung, A.C. The EXTREME Regimen Associating Cetuximab and Cisplatin Favors Head and Neck Cancer Cell Death and Immunogenicity with the Induction of an Anti-Cancer Immune Response. Cells 2022, 11, 2866. https://doi.org/10.3390/cells11182866
De Azevedo J, Mourtada J, Bour C, Devignot V, Schultz P, Borel C, Pencreach E, Mellitzer G, Gaiddon C, Jung AC. The EXTREME Regimen Associating Cetuximab and Cisplatin Favors Head and Neck Cancer Cell Death and Immunogenicity with the Induction of an Anti-Cancer Immune Response. Cells. 2022; 11(18):2866. https://doi.org/10.3390/cells11182866
Chicago/Turabian StyleDe Azevedo, Justine, Jana Mourtada, Cyril Bour, Véronique Devignot, Philippe Schultz, Christian Borel, Erwan Pencreach, Georg Mellitzer, Christian Gaiddon, and Alain C. Jung. 2022. "The EXTREME Regimen Associating Cetuximab and Cisplatin Favors Head and Neck Cancer Cell Death and Immunogenicity with the Induction of an Anti-Cancer Immune Response" Cells 11, no. 18: 2866. https://doi.org/10.3390/cells11182866