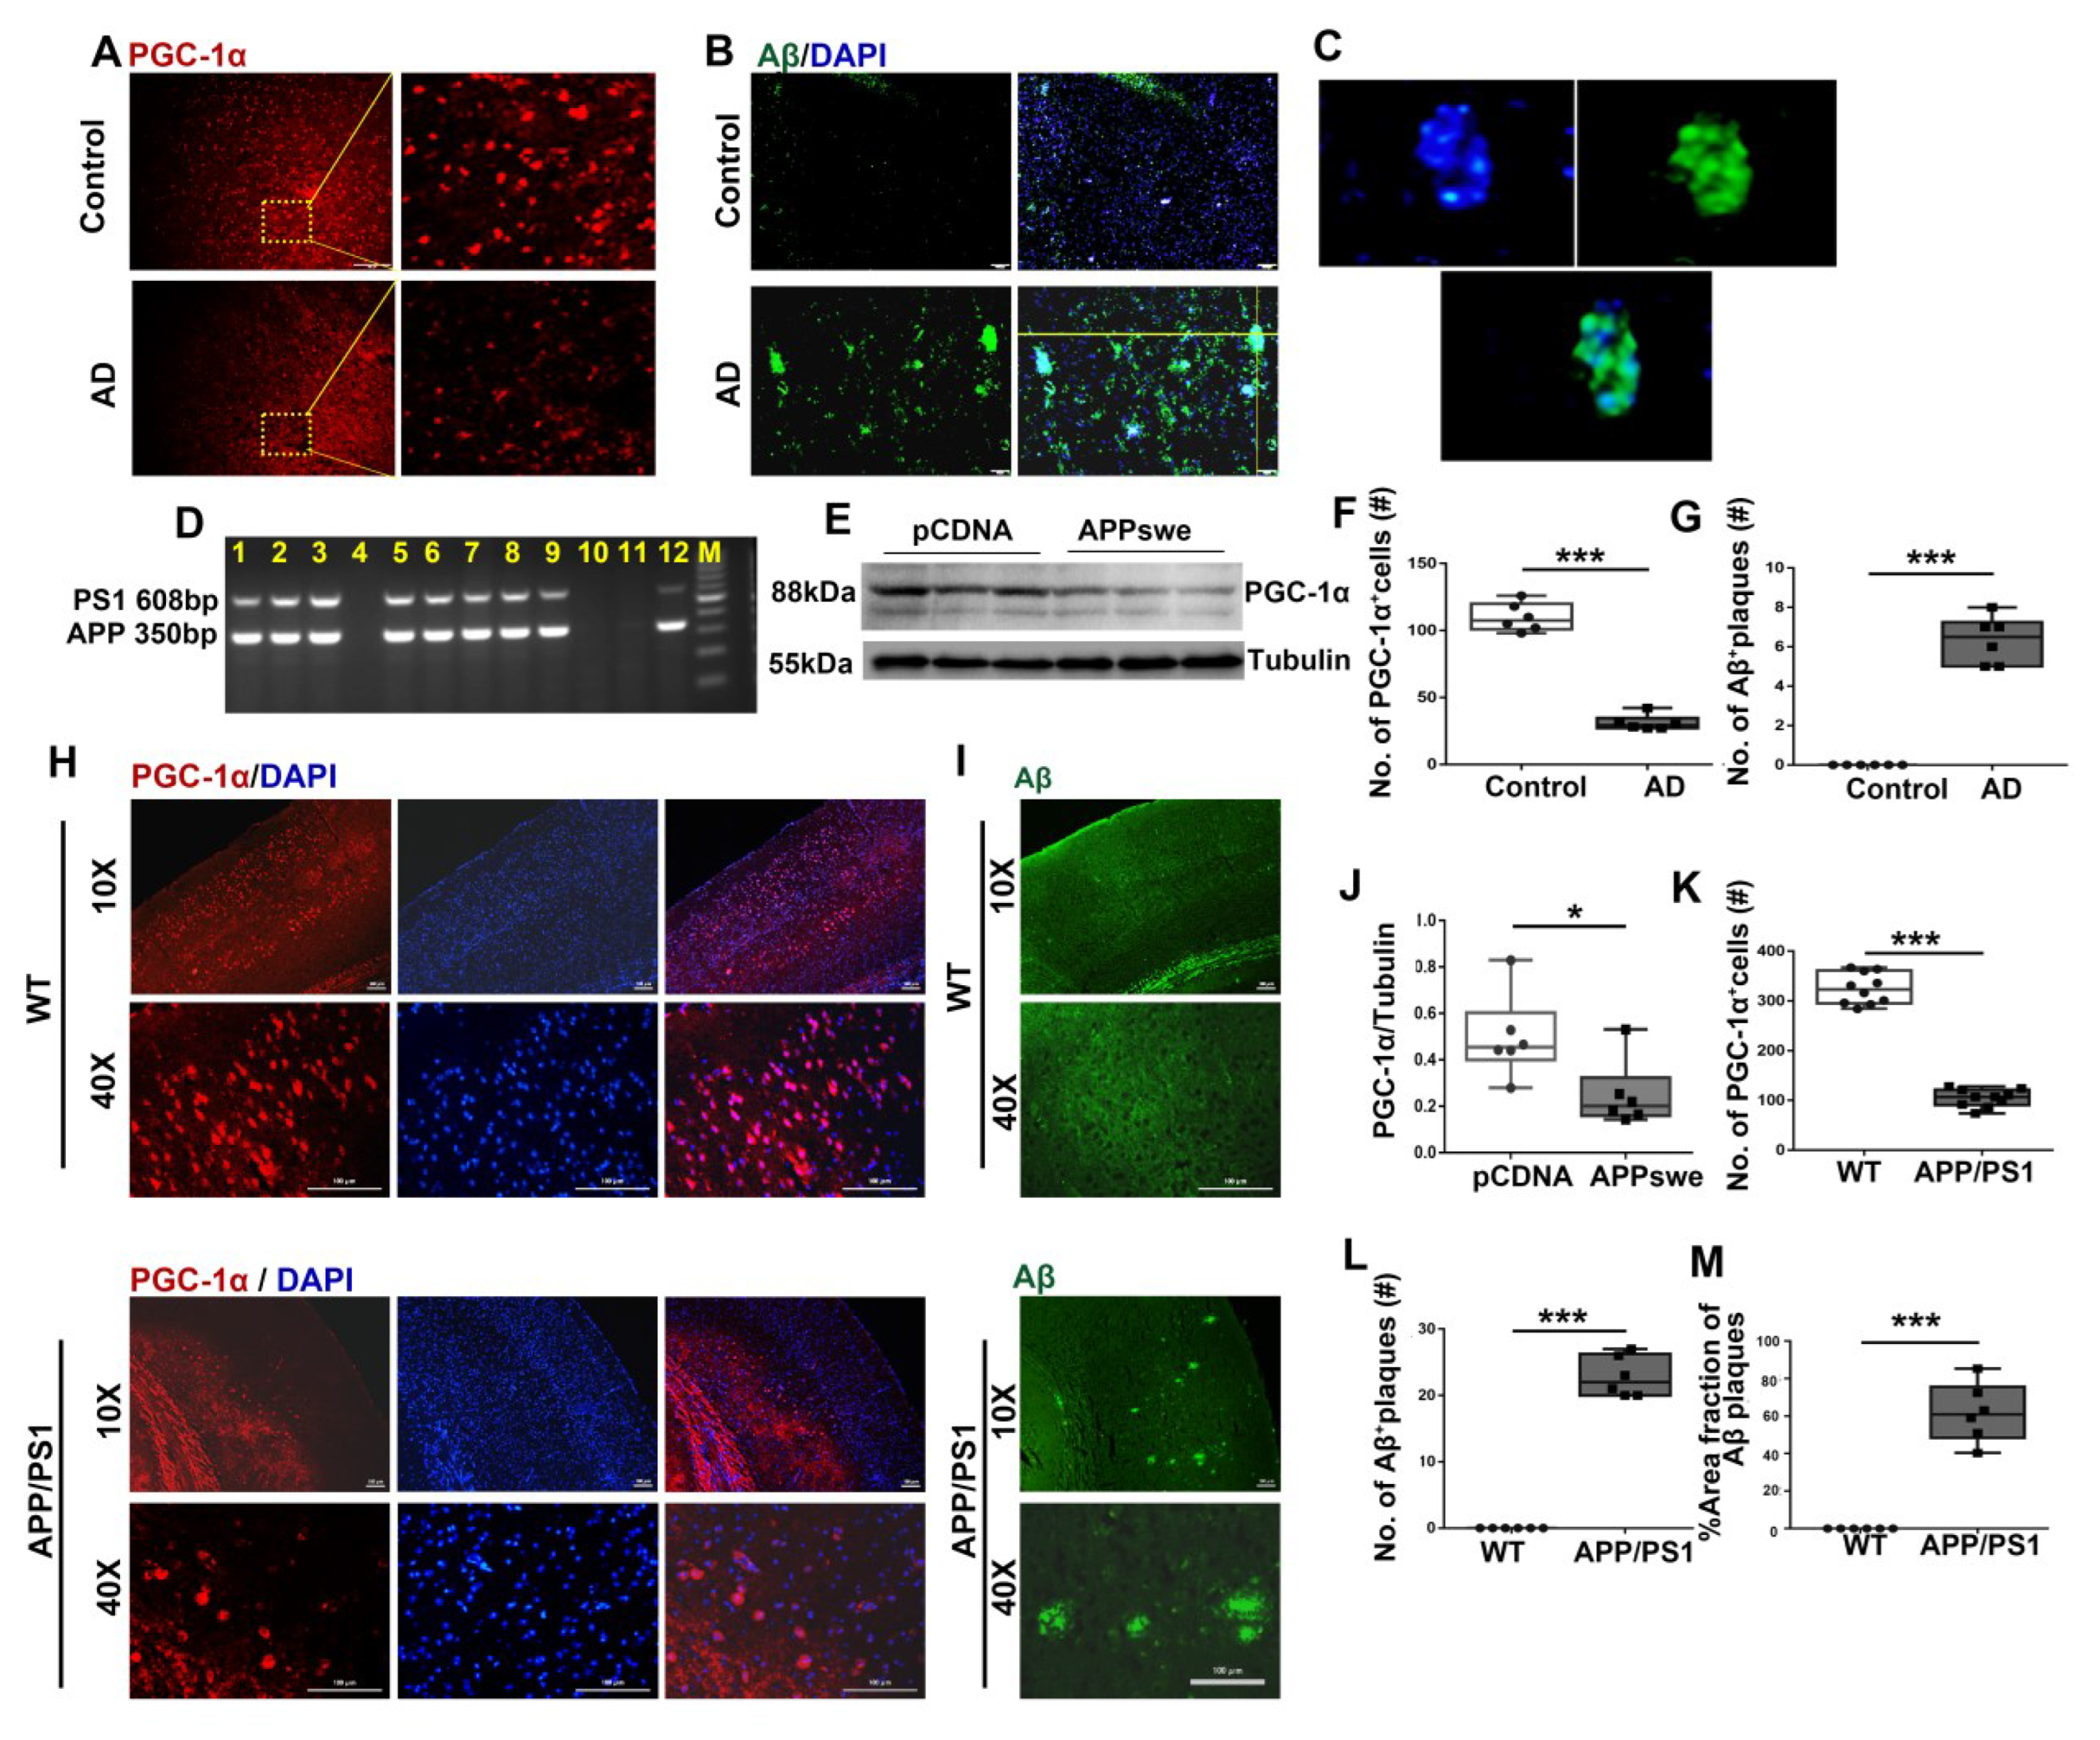
Figure 1.
A remarkable reduction in PGC-1a expression is observed in AD patients, cells and 2×Tg-AD mice. Expression patterns and qualification of (A,F) PGC-1a and (B,C,G) Aβ deposits from the parietal cortex samples of AD and control (Ctr) humans were analyzed using immunofluorescence. N2A cells were transfected with pCDNA plasmid or plasmid-encoding APP (APPswe) for 48 h. (E) Expression patterns and (J) qualification of PGC-1a were studied with Western blot. (D) PCR products obtained from genomic DNA from APP/PS1 mice. The 608 and 350 bp bands resulted from the amplification of PS1 and APP alleles, respectively. Expression patterns and qualification of (H,K) PGC-1a and (I,L,M) Aβ deposits from the parietal cortex samples of APP/PS1 and WT mice (6 months) were studied with immunofluorescence. The qualification of % Area fraction of Aβ plaques was calculated using the formula [area fraction of Aβ plaques/total area fractions] × 100% between the two genotypes. Scale bars = 200 μm. For each group, n = 6–10. Significance levels were set at * p < 0.05, *** p < 0.001 for noted differences between Ctr and AD groups, pCDNA and APPswe groups or WT and APP/PS1 groups. Tubulin was used as the loading control.
![Cells 11 02849 g001]()
Figure 2.
MutAPP triggers dynamic imbalance of mitochondrial fission and fusion. N2A cells were transfected with pCDNA or APPswe plasmid for 48 h. (A) EGFP-labeled APPswe was successfully overexpressed in N2A cells. Expression patterns and qualification of the fusion proteins, including (B,D) OPA1, (F,I) MFN1 and (G,J) MFN2, as well as the fission proteins, including (L,N) DRP1 and (P,R) FIS1 were studied with Western blot. Expression patterns and qualification of (C,E) OPA1, (H,K) MFN2, (M,O) DRP1 and (Q,S) FIS1 from the parietal cortex samples of 2×Tg-AD mice were also examined with immunohischemistry. Scale bars = 100 μm. (T) Representative electron microscope images showing stages of mitochondria in cortical neurons of WT and APP/PS1 animals. Scale bar = 0.5 μm. Yellow stars: the fissive stage of mitochondria. Significance levels were set at ** p < 0.01, *** p < 0.001 for noted differences between pCDNA and APPswe groups and WT and APP/PS1 groups. Tubulin was used as the loading control.
![Cells 11 02849 g002]()
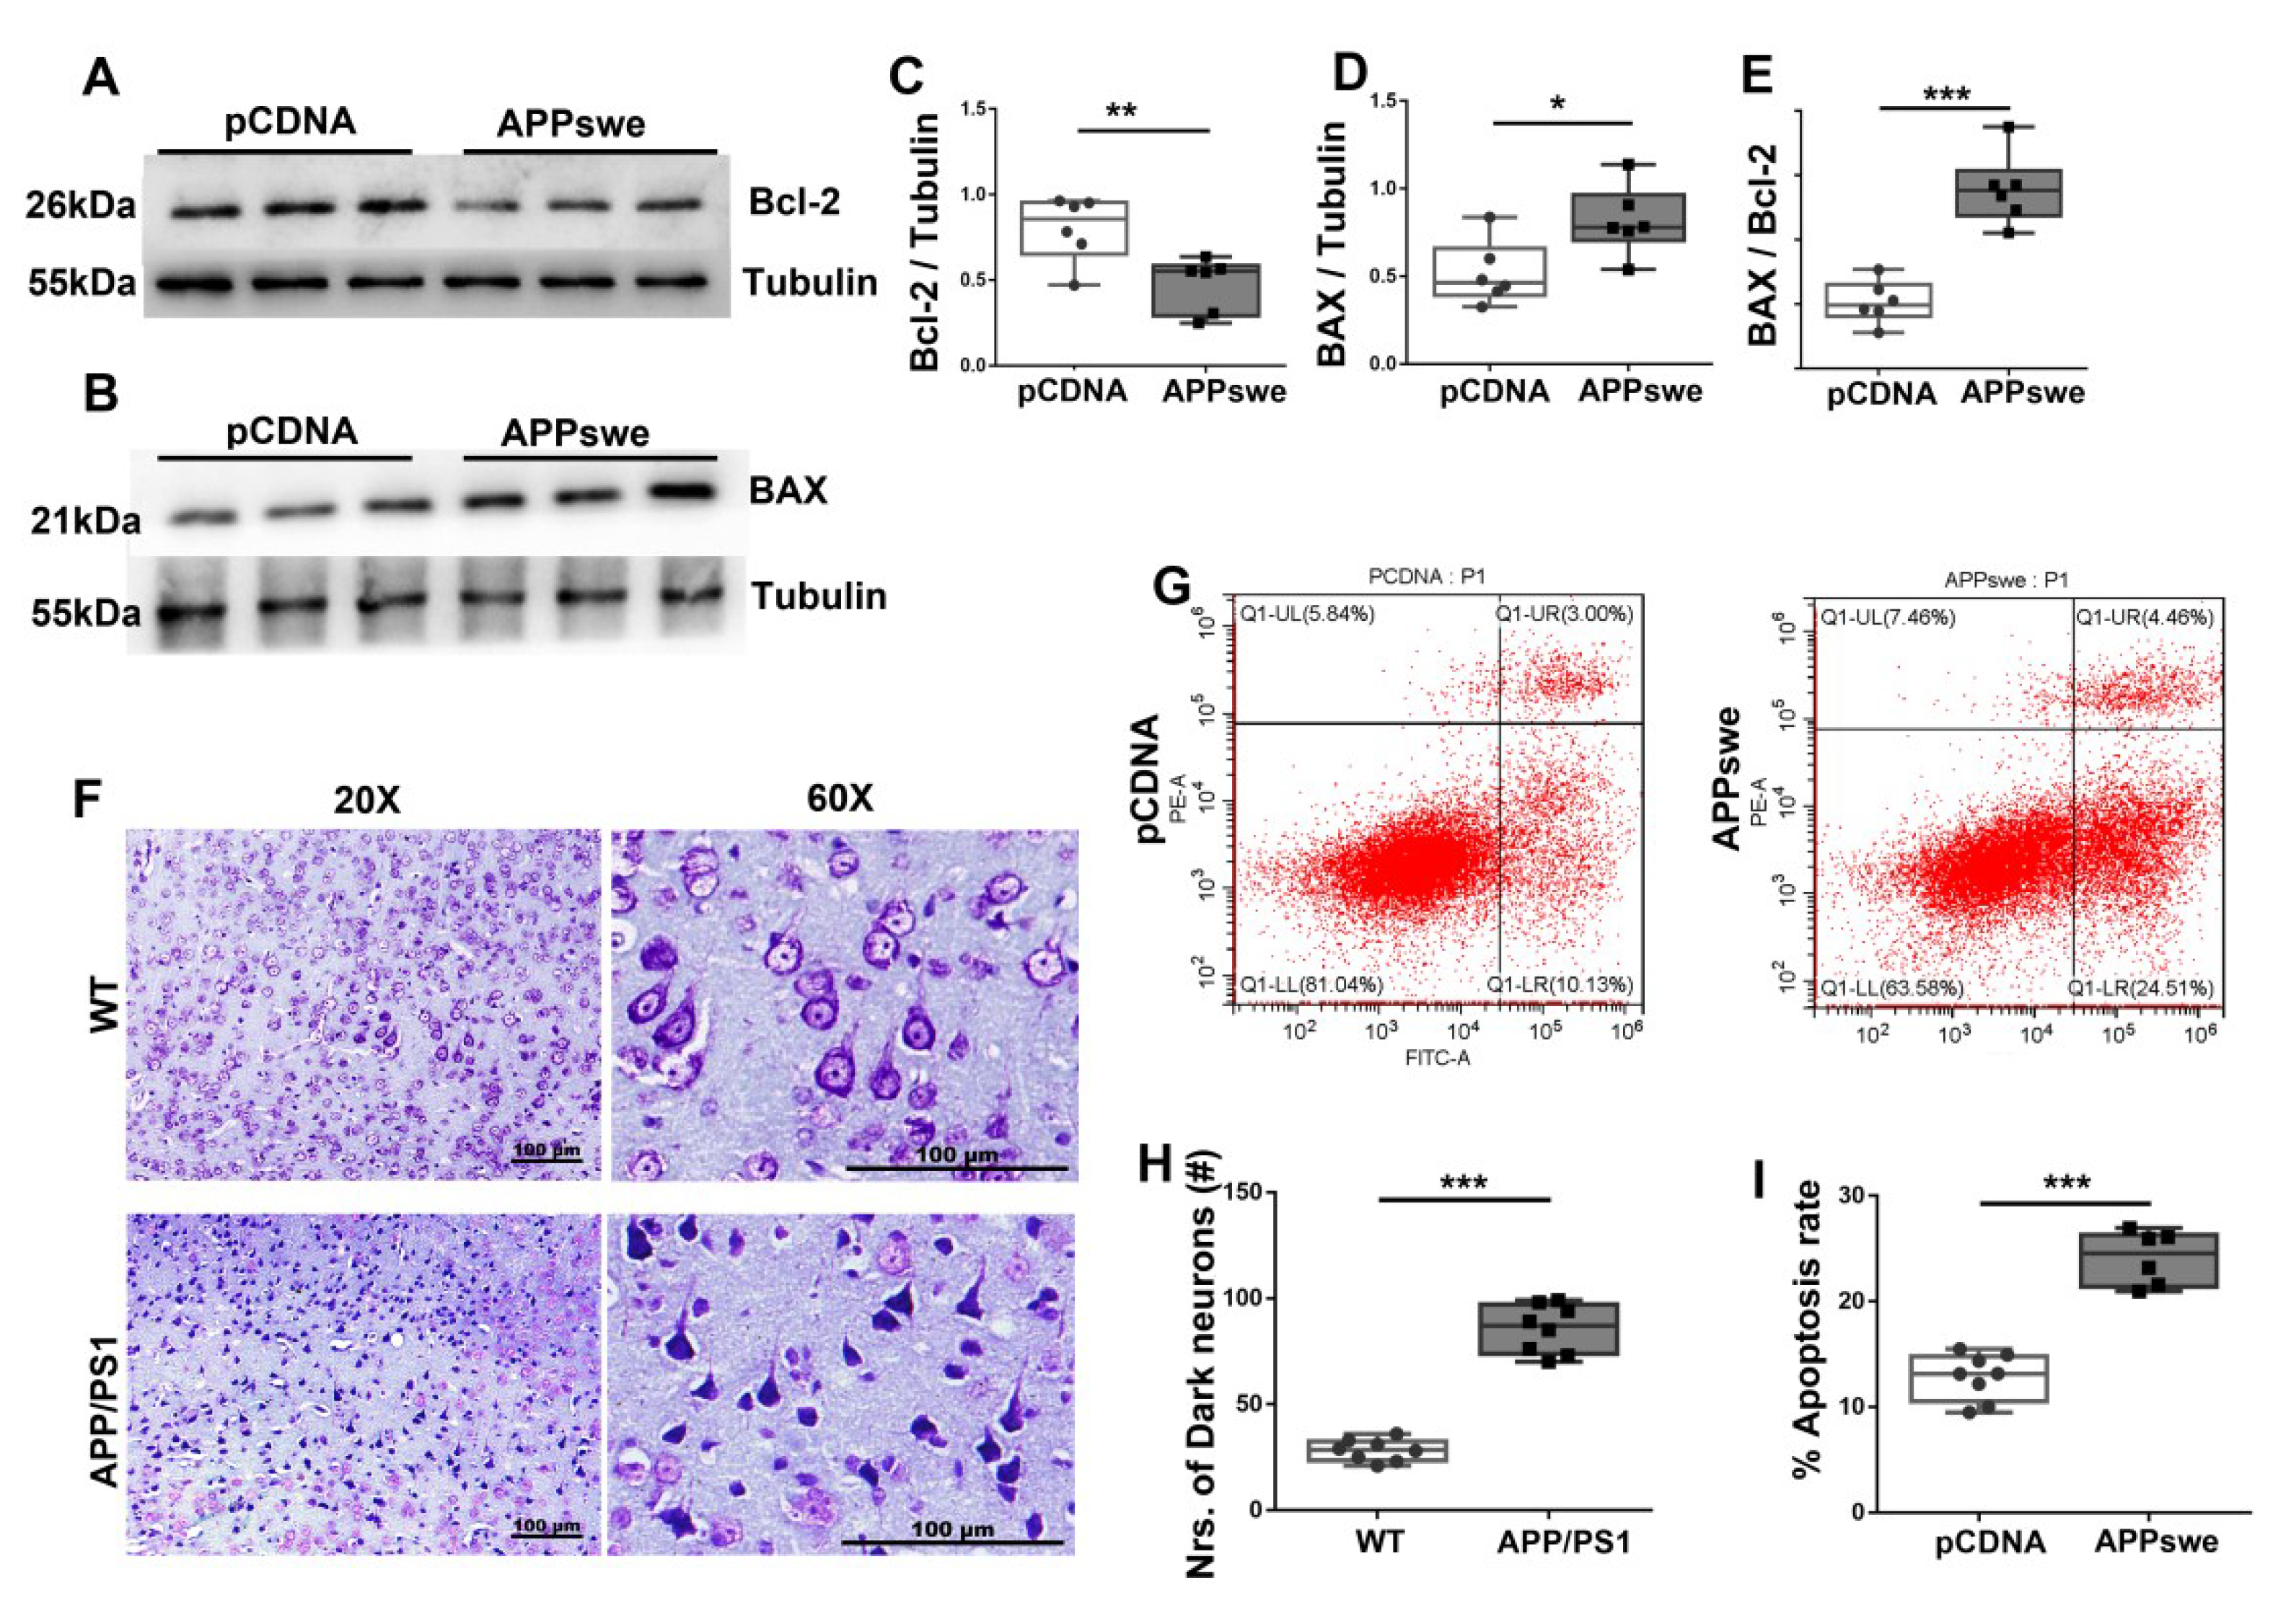
Figure 3.
Increased neuronal apoptosis is observed in AD cells and 2×Tg-AD animals. N2A cells were transfected with pCDNA or APPswe plasmid for 48 h. Expression patterns and qualification of (A,C) B cell lymphoma/leukemia-2 (Bcl-2) and of (B,D) Bcl-2 associated X protein (BAX) in the cells were studied with Western blot (E) Apoptosis index, defined as the expression ratio of BAX to Bcl-2, is illustrated with the bar graph. (F) Representative images and (H) qualification of Nissl staining for the parietal cortex samples from APP/PS1 and WT mice are illustrated. Scale bar = 100 μm. (G,I) N2A cells were transfected with pCDNA or APPswe plasmids for 48 h, and the % apoptotic rate was examined by CytExpert flow cytometry. For each group, n = 6–8. Significance levels were set at * p < 0.05, ** p < 0.01, *** p < 0.001 for noted differences between pCDNA and APPswe groups and WT and APP/PS1 groups, Tubulin was used as the loading control.
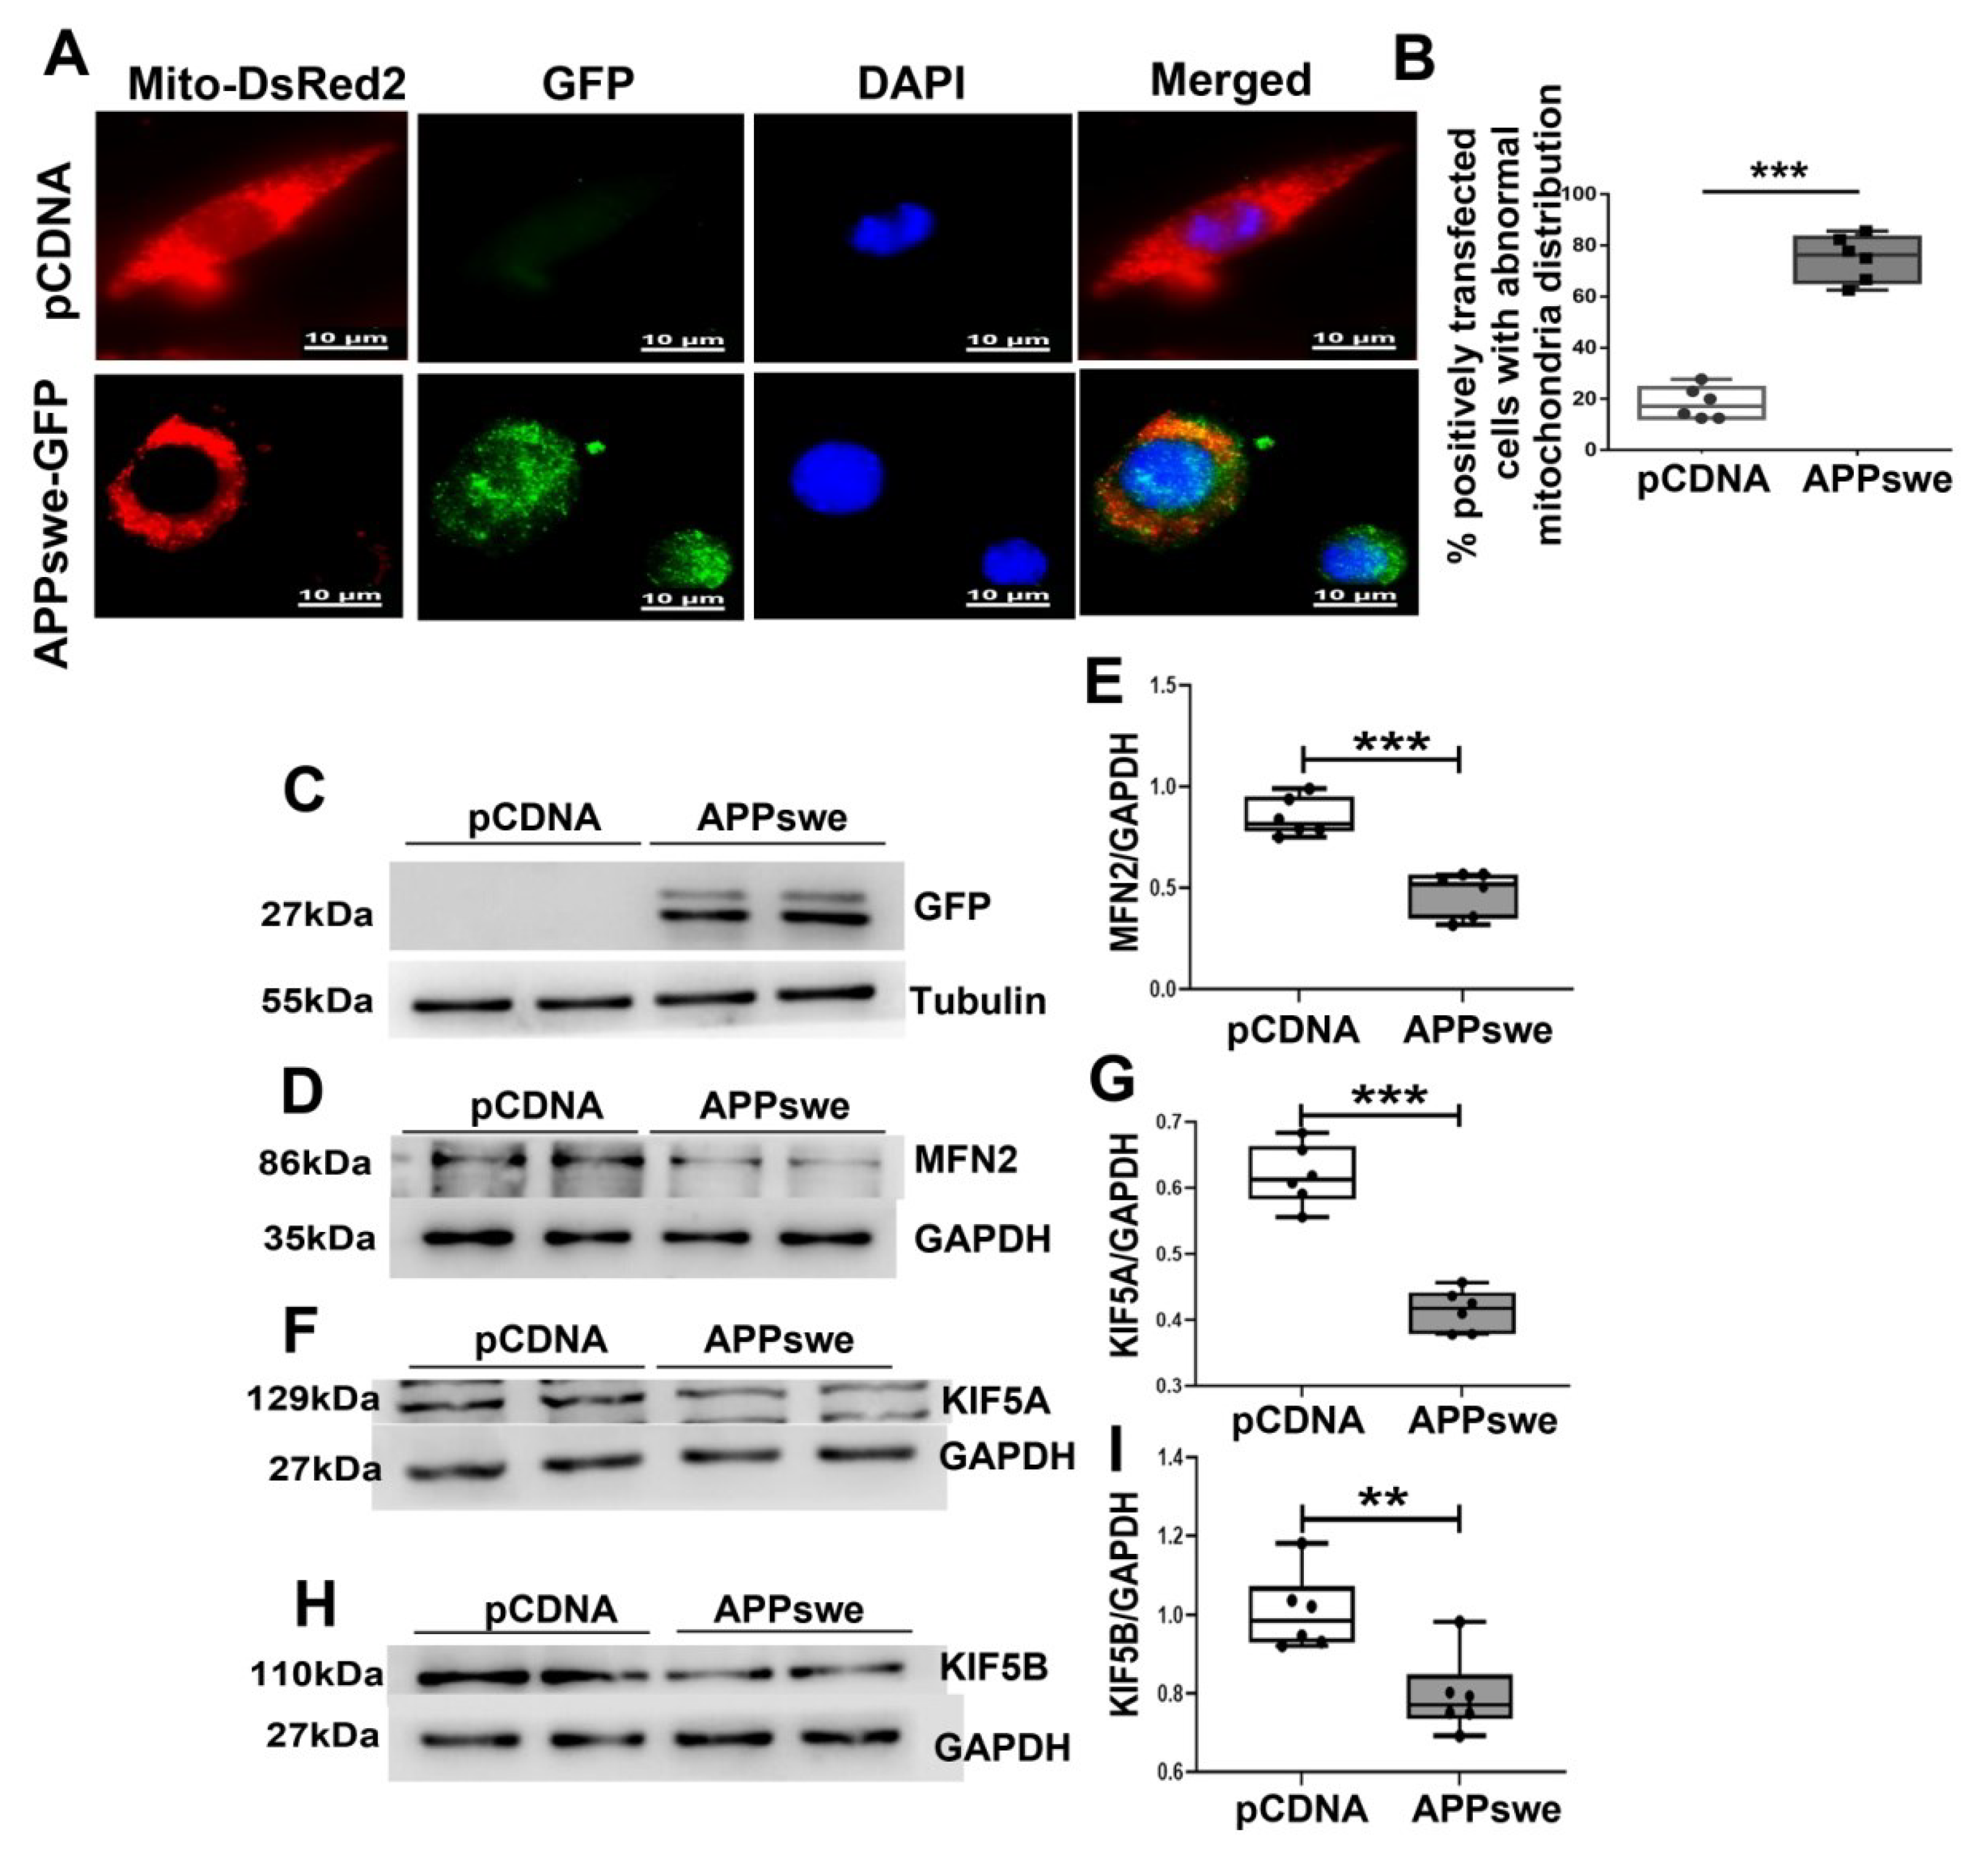
Figure 4.
MutAPP causes abnormal mitochondrial distribution. (A) Representative confocal pictures of mitochondria in N2A cells transected with pCDNA or GFP-tagged APPswe plasmid. Cells were incubated with Mito-DsReds to label mitochondria. Red = Mito-DsRed2, Green = GFP-labeled APPswe, Blue = DAPI. Scale bars = 10 µm. (B) The qualification of % positively transfected cells with abnormal mitochondria distribution was calculated using the formula [Numbers of cells with abnormal mitochondria distribution /total positively transfected cells] ×100% between the two groups. At least 20 cells were analyzed in triplicate for each cell line. n = 6 for each group. Significance levels were set at *** p < 0.001 for noted differences between pCDNA and APPswe-transfected cells. (C) N2A cells were transfected with pCDNA or APPswe plasmid for 48 h. GFP-labeled APPswe was successfully overexpressed in N2A cells. Expression patterns and qualification of (D,E) MFN2, (F,G) KIF5A and of (H,I) KIF5B in the cells were studied with Western blot. For each group, n = 6. Significance levels were set at ** p < 0.01, *** p < 0.001 for noted differences between pCDNA and APPswe groups, GAPDH was used as the loading control.
![Cells 11 02849 g004]()
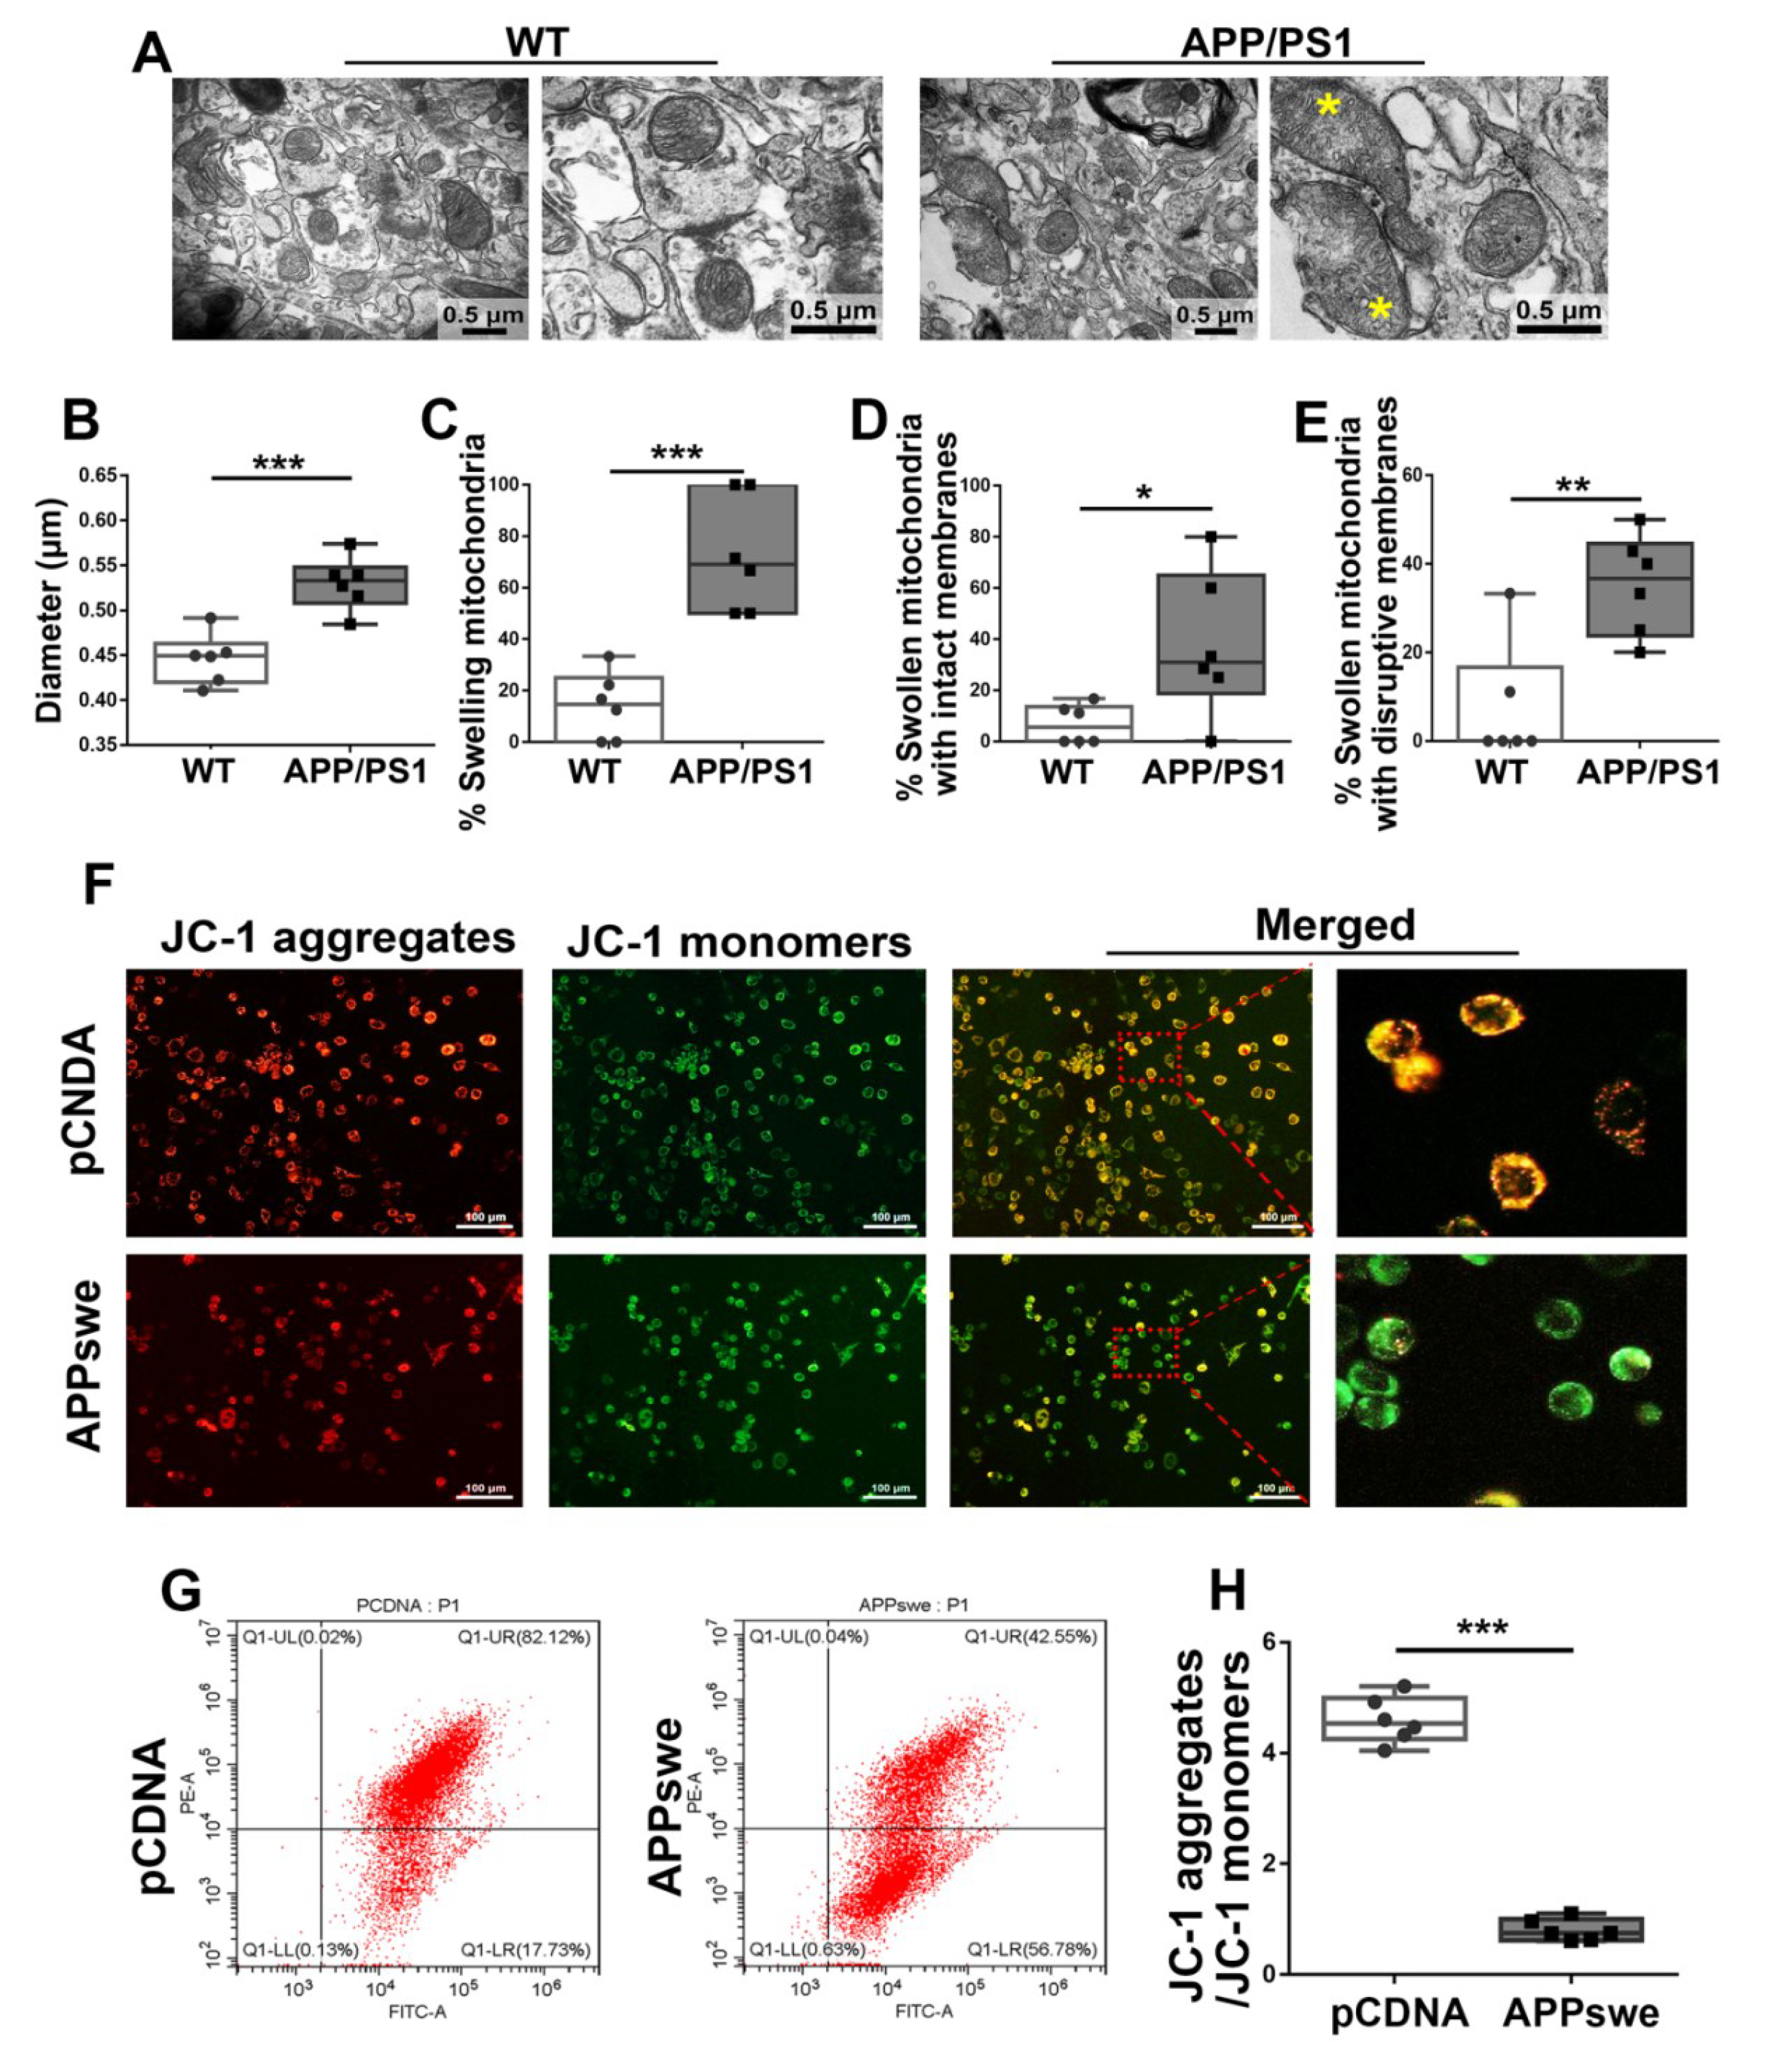
Figure 5.
Abnormal mitochondrial morphology and lowered MMP are showed in AD. (A) Electron micrograph showing representative mitochondrial morphology from parietal cortex samples of WT and APP/PS1 transgenic animals. Yellow star: swollen mitochondria. Scale bar = 0.5 μm. Quantitative analysis showing the (B) diameters of mitochondria and (C–E) proportions of swelling mitochondria both with intact membranes and with ruptured ones in cortical neurons of WT and APP/PS1 brains. For each group, n = 6/group. Significance levels were set at * p < 0.05, ** p < 0.01, ***p < 0.001 for noted differences between WT and APP/PS1 groups. N2A cells were transfected with pCDNA plasmid or plasmid-encoding APPswe for 48 h. Detection of JC-1 signals in N2A cells was performed using fluorescence confocal microscopy. Data are representative of three independent measurements. (F) Fluorescence was registered using excitation at 488 nm and adjusting the emission of confocal microscopy for J-monomers (visible as green) and J-aggregates (visible as red/orange). (G,H) The ratios of J-aggregates to J-monomers as an indicator of mitochondrial membrane potential (MMP) were examined with CytExpert flow cytometry. For each group, n = 6/group. Significance levels were set at *** p < 0.001 noted difference between pCDNA and APPswe groups.
![Cells 11 02849 g005]()
Figure 6.
rAAV2/9 forces PGC-1α overexpressed in the LPtA cortex of APP/PS1 mice. Photomicrograph of cresyl violet stained coronal section from the brain of a mouse with representative placement in the bilateral lateral parietal association cortex (LPtA). (A) Location of infusion sites in the LPtA of genotype mice. (B,C) Cortical lysates of the two treatment mice were immunoblotted using an antibody against PGC-1α. Values are expressed as means ± S.E.M. For each group, n = 8/group. Significance levels were set at *** p < 0.001 for noted differences between AAV-Vector- and AAV-Pgc-1alpha-infused AD animals. (D) Representative immunofluroscence images showed AAV2/9 forced PGC-1α overexpression in the LPtA cortex of APP/PS1 mice. Green = HA−labeled PGC-1α; Blue = DAPI. Scale bars = 100 μm.
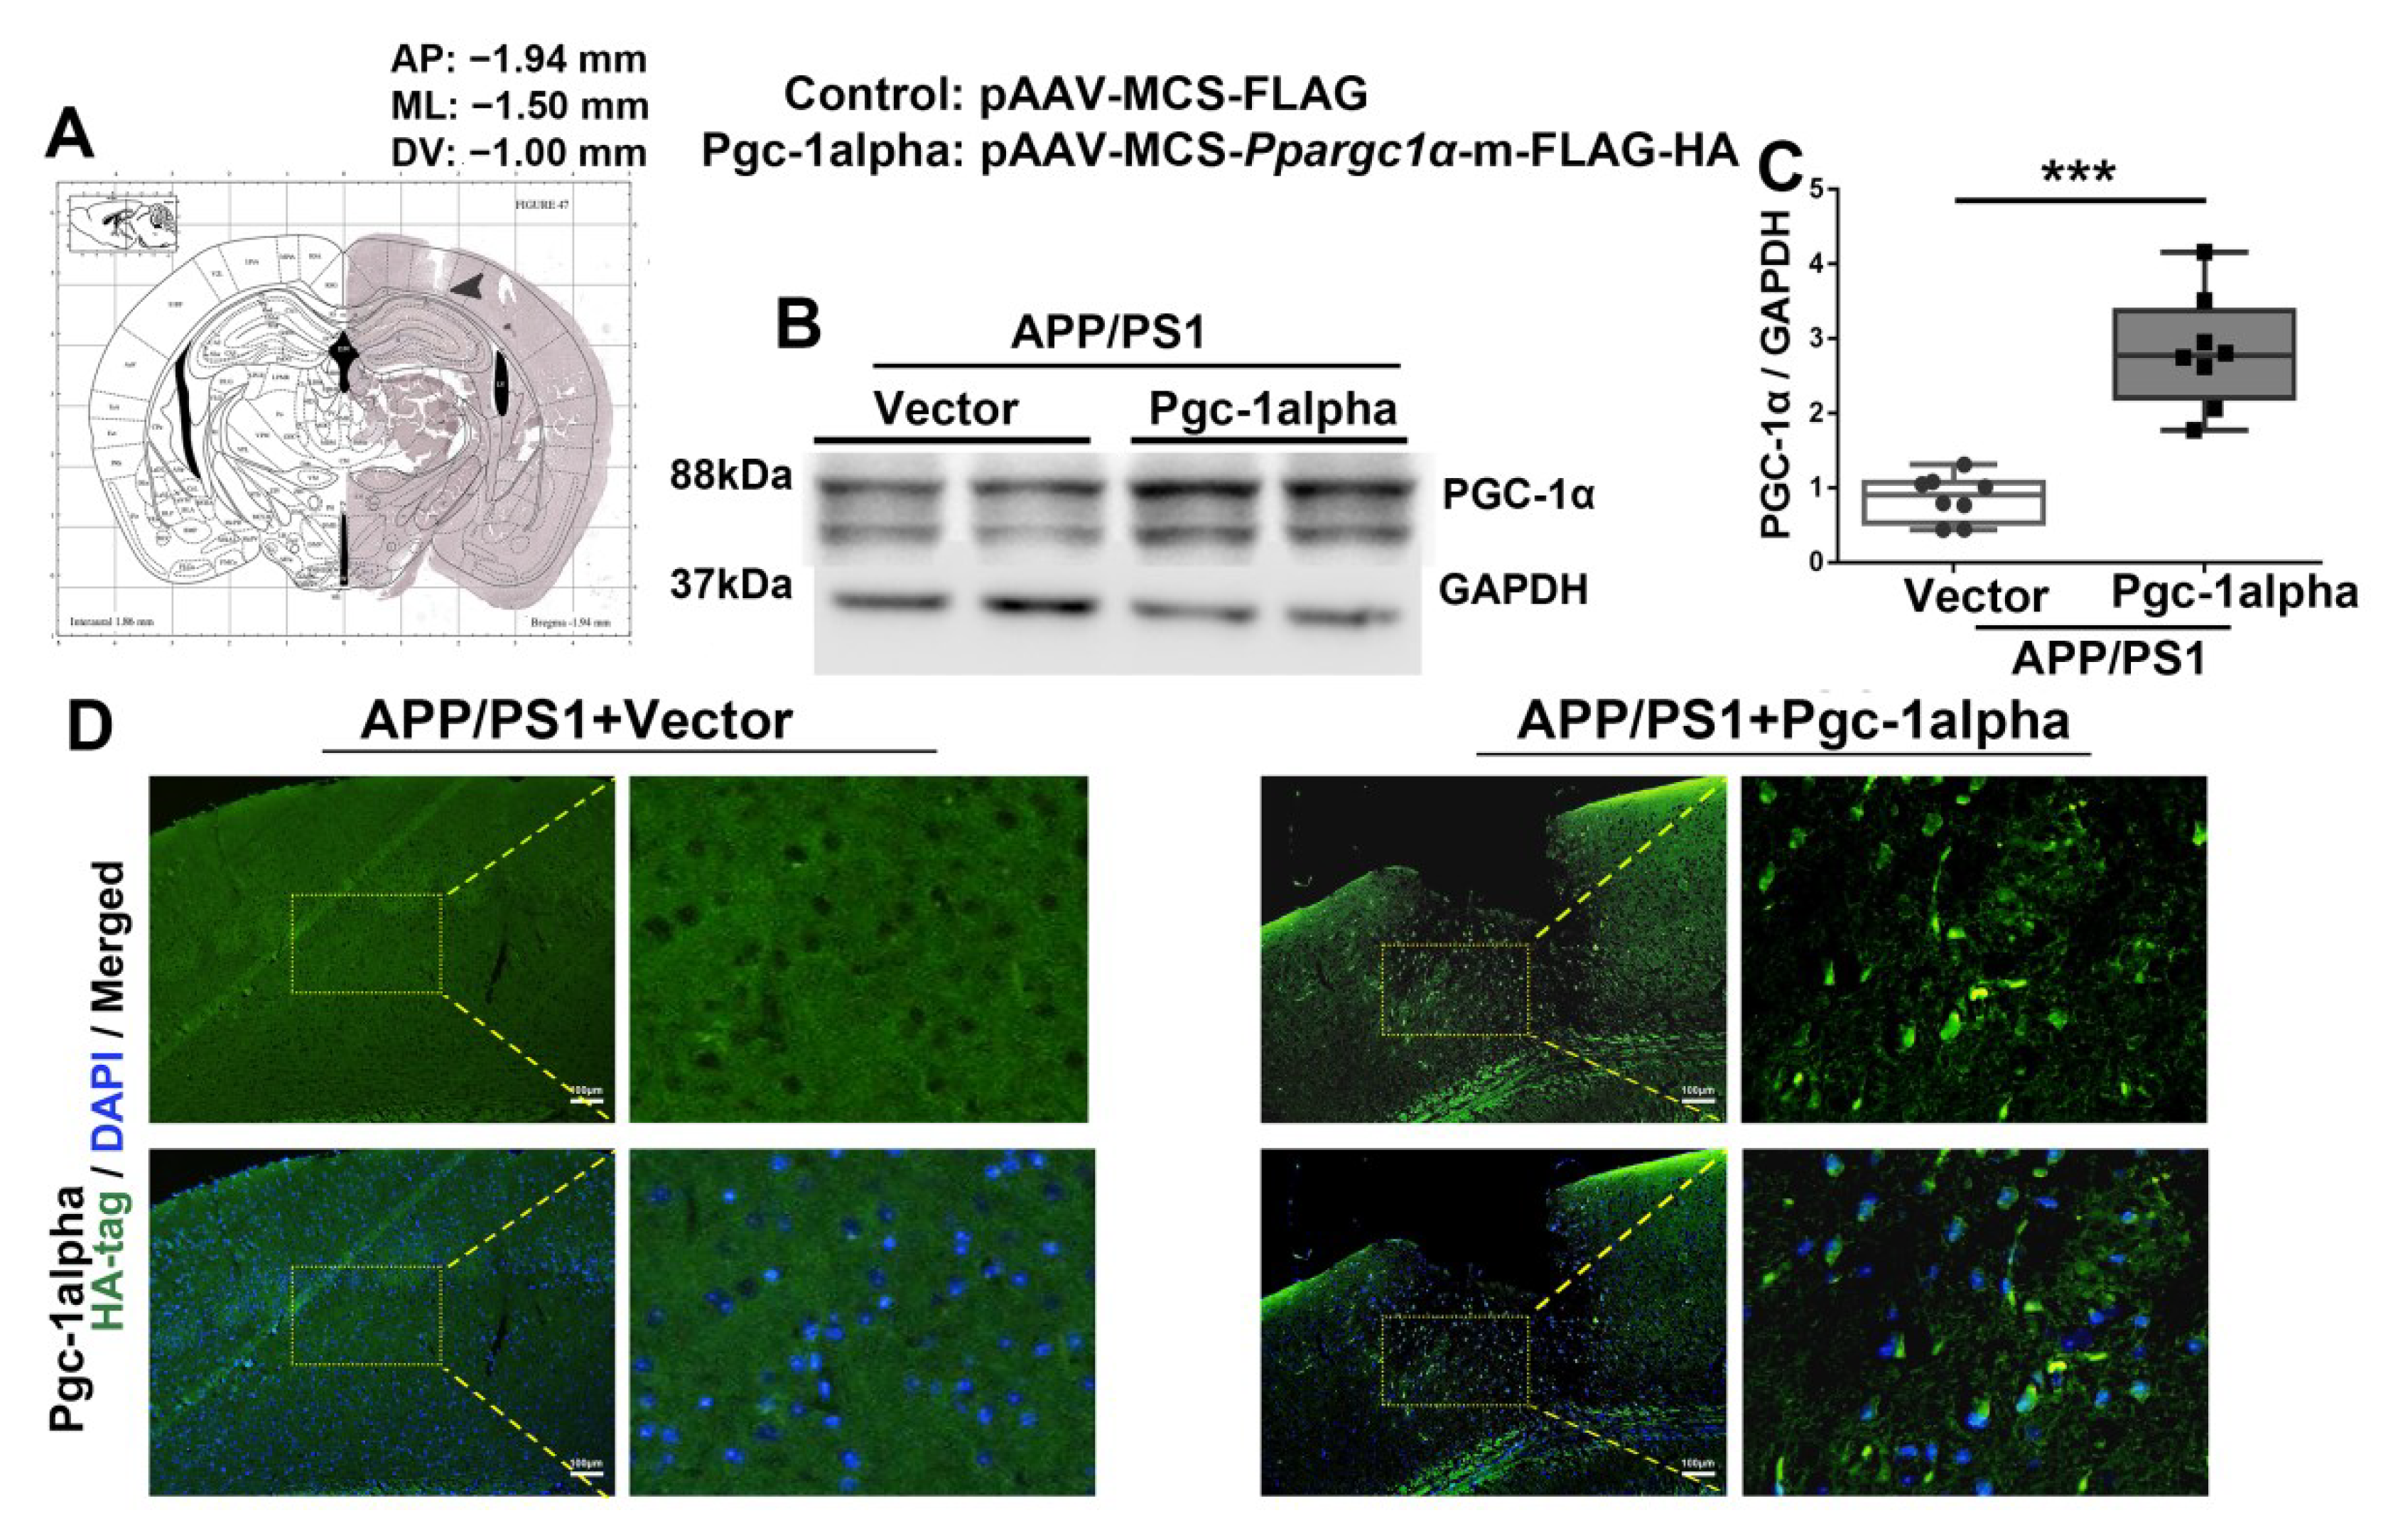
Figure 7.
PGC-1α rescues mutAPP-triggered dynamic imbalance of mitochondrial fission and fusion. N2A cells were transfected with pEnCMV/Pgc-1alpha plasmid and plasmid-encoding APPswe for 48 h. (A) Flag-labeled PGC-1α and EGFP-labeled APPswe were successfully overexpressed in N2A cells. Expression patterns and qualification of the fusion proteins, including (B,D) OPA1, (F,I) MFN1 and (G,J) MFN2, as well as the fission proteins, including (L,N) DRP1 and (P,R) FIS1, were studied with Western blot. Expression patterns and qualification of (C,E) OPA1, (H,K) MFN2, (M,O) DRP1 and (Q,S) FIS1 from the parietal cortex samples of 2×Tg-AD mice treated with Vector/Pgc-1alpha were also examined with immunohistochemistry. Scale bars = 100 μm. (T) Representative electron microscopes showing stage of mitochondria in cortical neurons of AAV-Vector- and AAV-Pgc-1alpha treated APP/PS1 mice. Scale bar = 0.5 μm. Yellow stars: the fissive stage of mitochondria. Significance levels were set at ** p < 0.01, *** p < 0.001 for noted differences between APPswe + pEnCMV and APPswe + Pgc-1alpha groups, or APP/PS1 + Vector and APP/PS1 + Pgc-1alpha groups. Tubulin was used as the loading control.
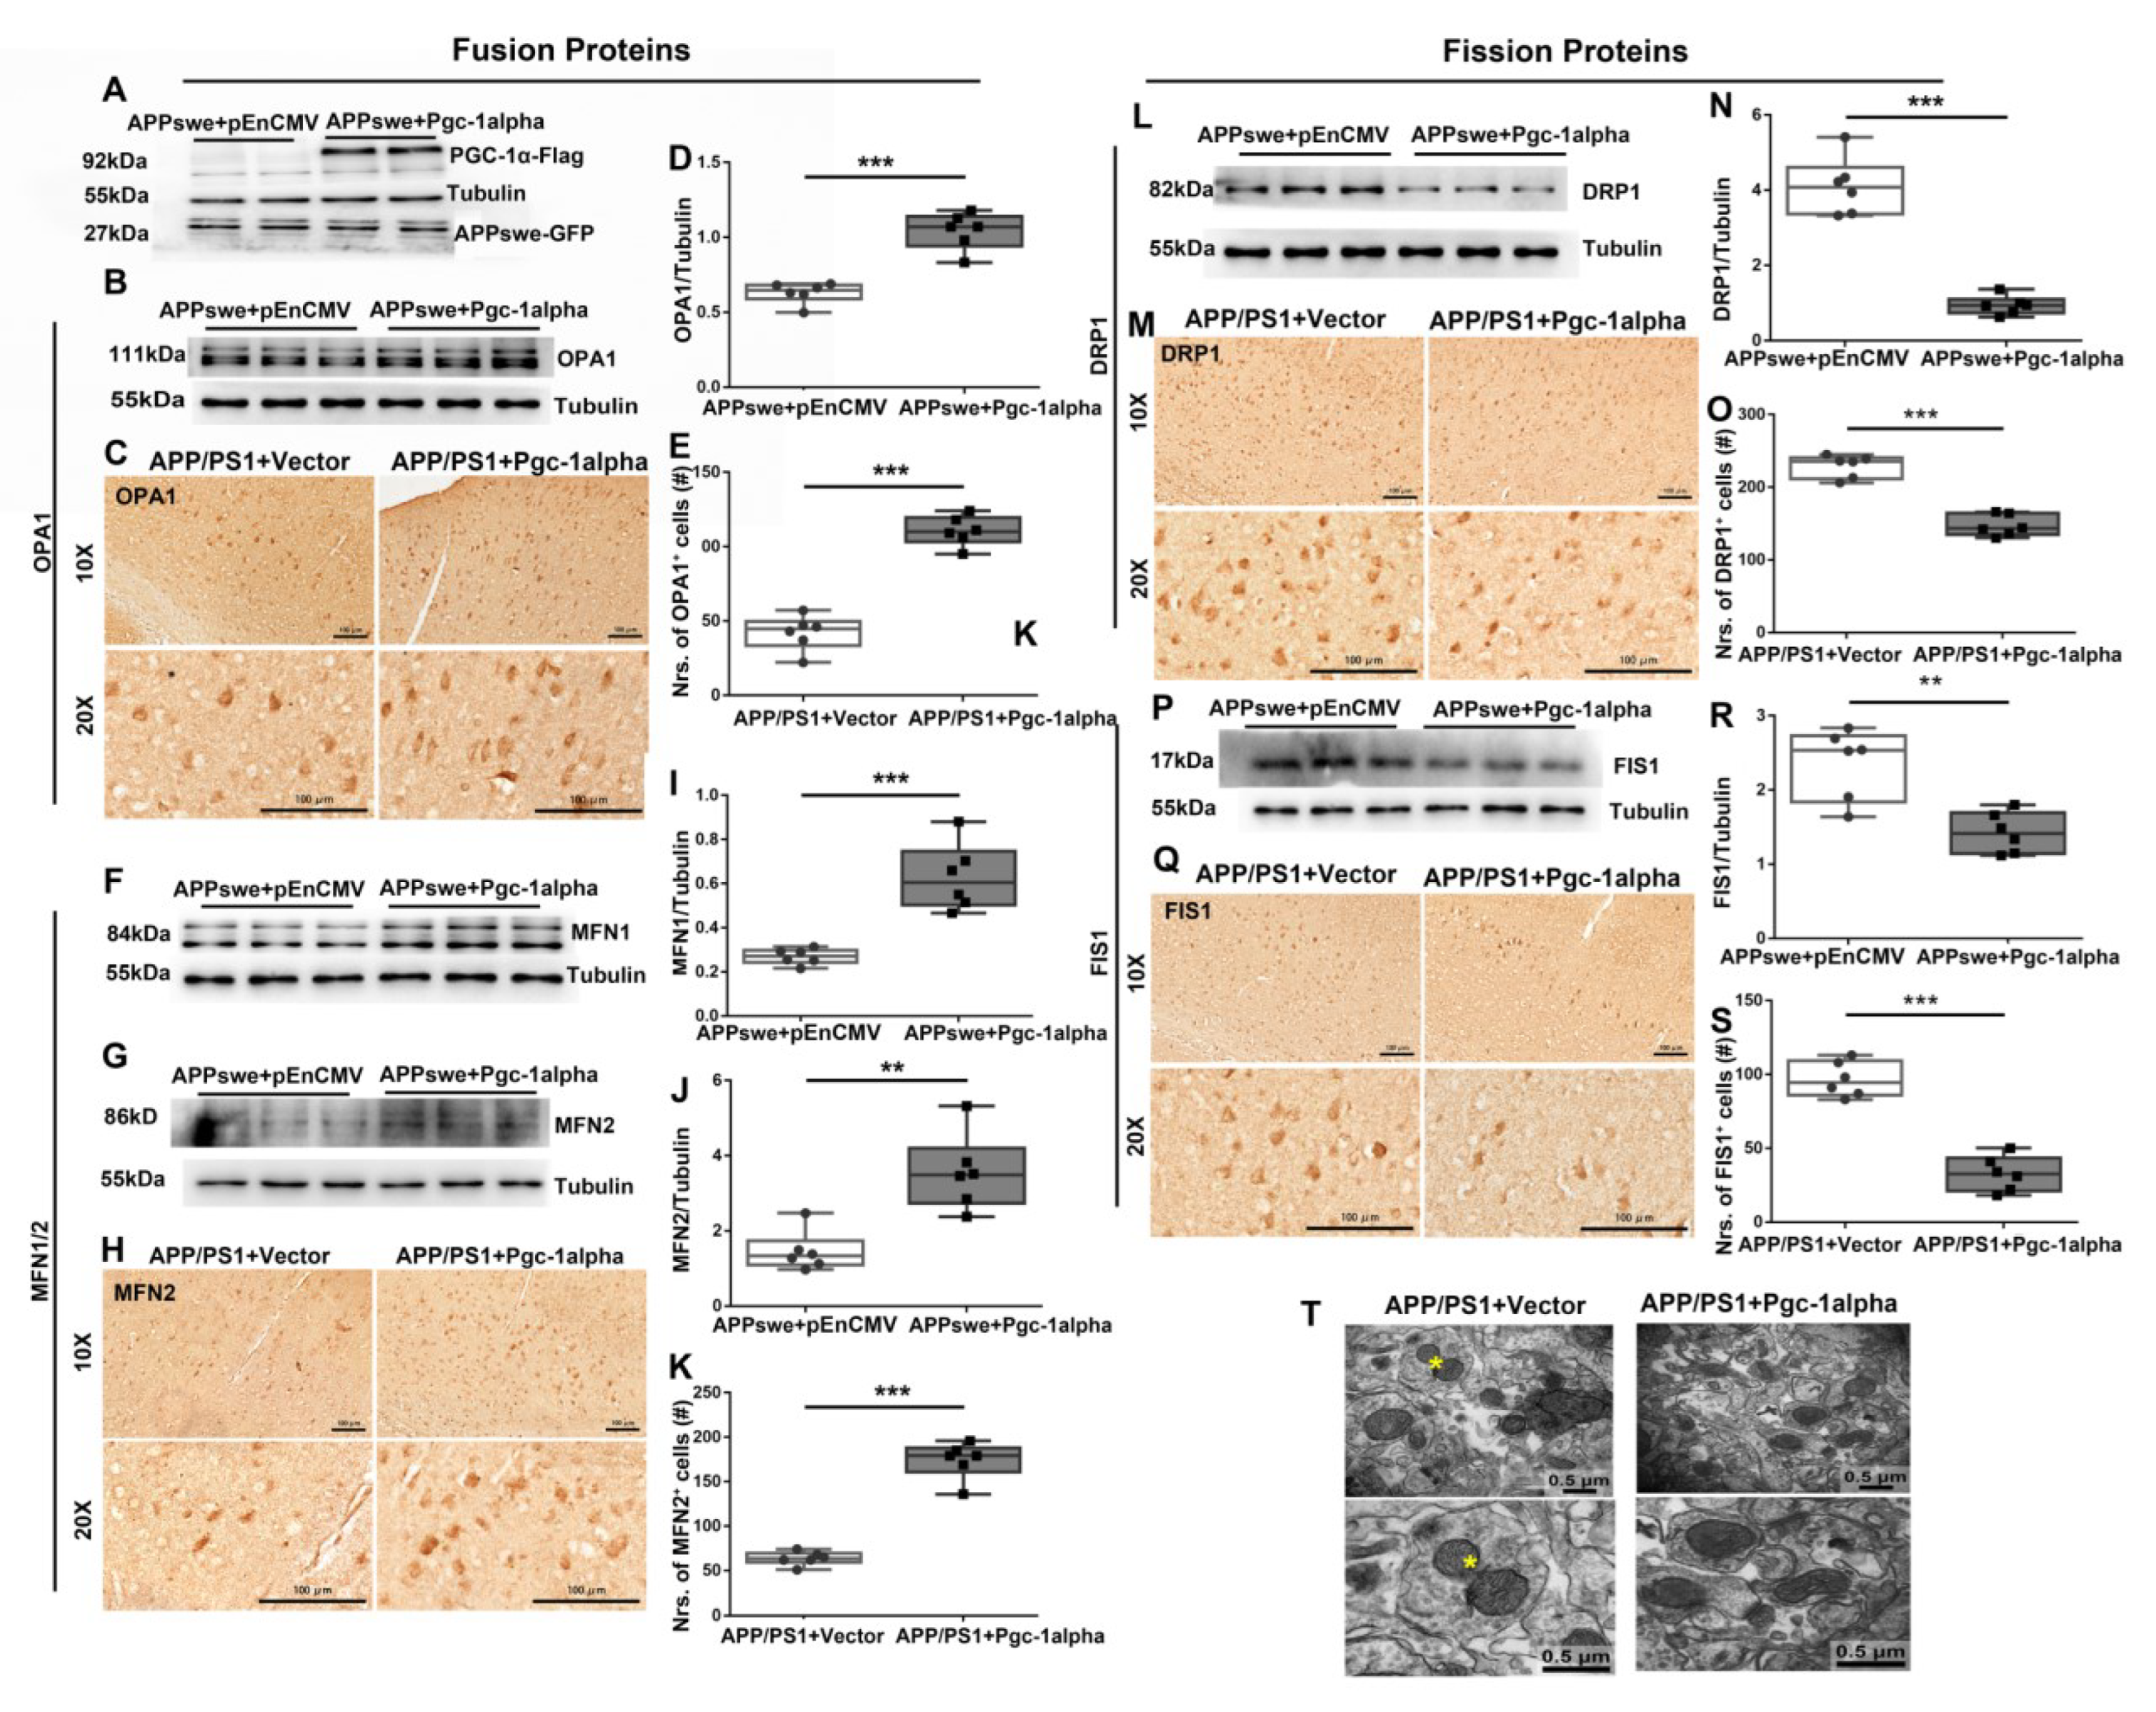
![Cells 11 02849 g007]()
Figure 8.
PGC-1α ameliorates apoptosis-relevant AD pathology. Expression patterns and qualification of (A,C) Bcl-2 and (B,D) BAX from the cortical samples of AAV-Pgc-1alpha-treated AD brains are showed. (E) Anti-apoptotic index, defined as the expression ratio of Bcl-2 to BAX was illustrated by bar graph. (F) Representative images of Nissl staining from the parietal cortex samples of Vector- and Pgc-1alpha- treated AD mice. Scale bar = 100 μm. (G) Nrs of dark neurons of Nissl substance between the two treatments were qualified and showed by bar graph. (H) Apoptosis rate was analyzed with flow cytometry after overexpressing pEnCMV/Pgc-1alpha and plasmid-encoding APPswe for 48 h in N2A cells. (I) Quantification of proportion of apoptotic cells of the two treatments were displayed by bar graphs. Values are expressed as means ± S.E.M. For each group, n = 6–8/group. Significance levels were set at ** p < 0.01, *** p < 0.001 for noted differences between APPswe + pEnCMV and APPswe + Pgc-1alpha groups, or APP/PS1 + Vector and APP/PS1 + Pgc-1alpha groups. Tubulin was used as the loading control.
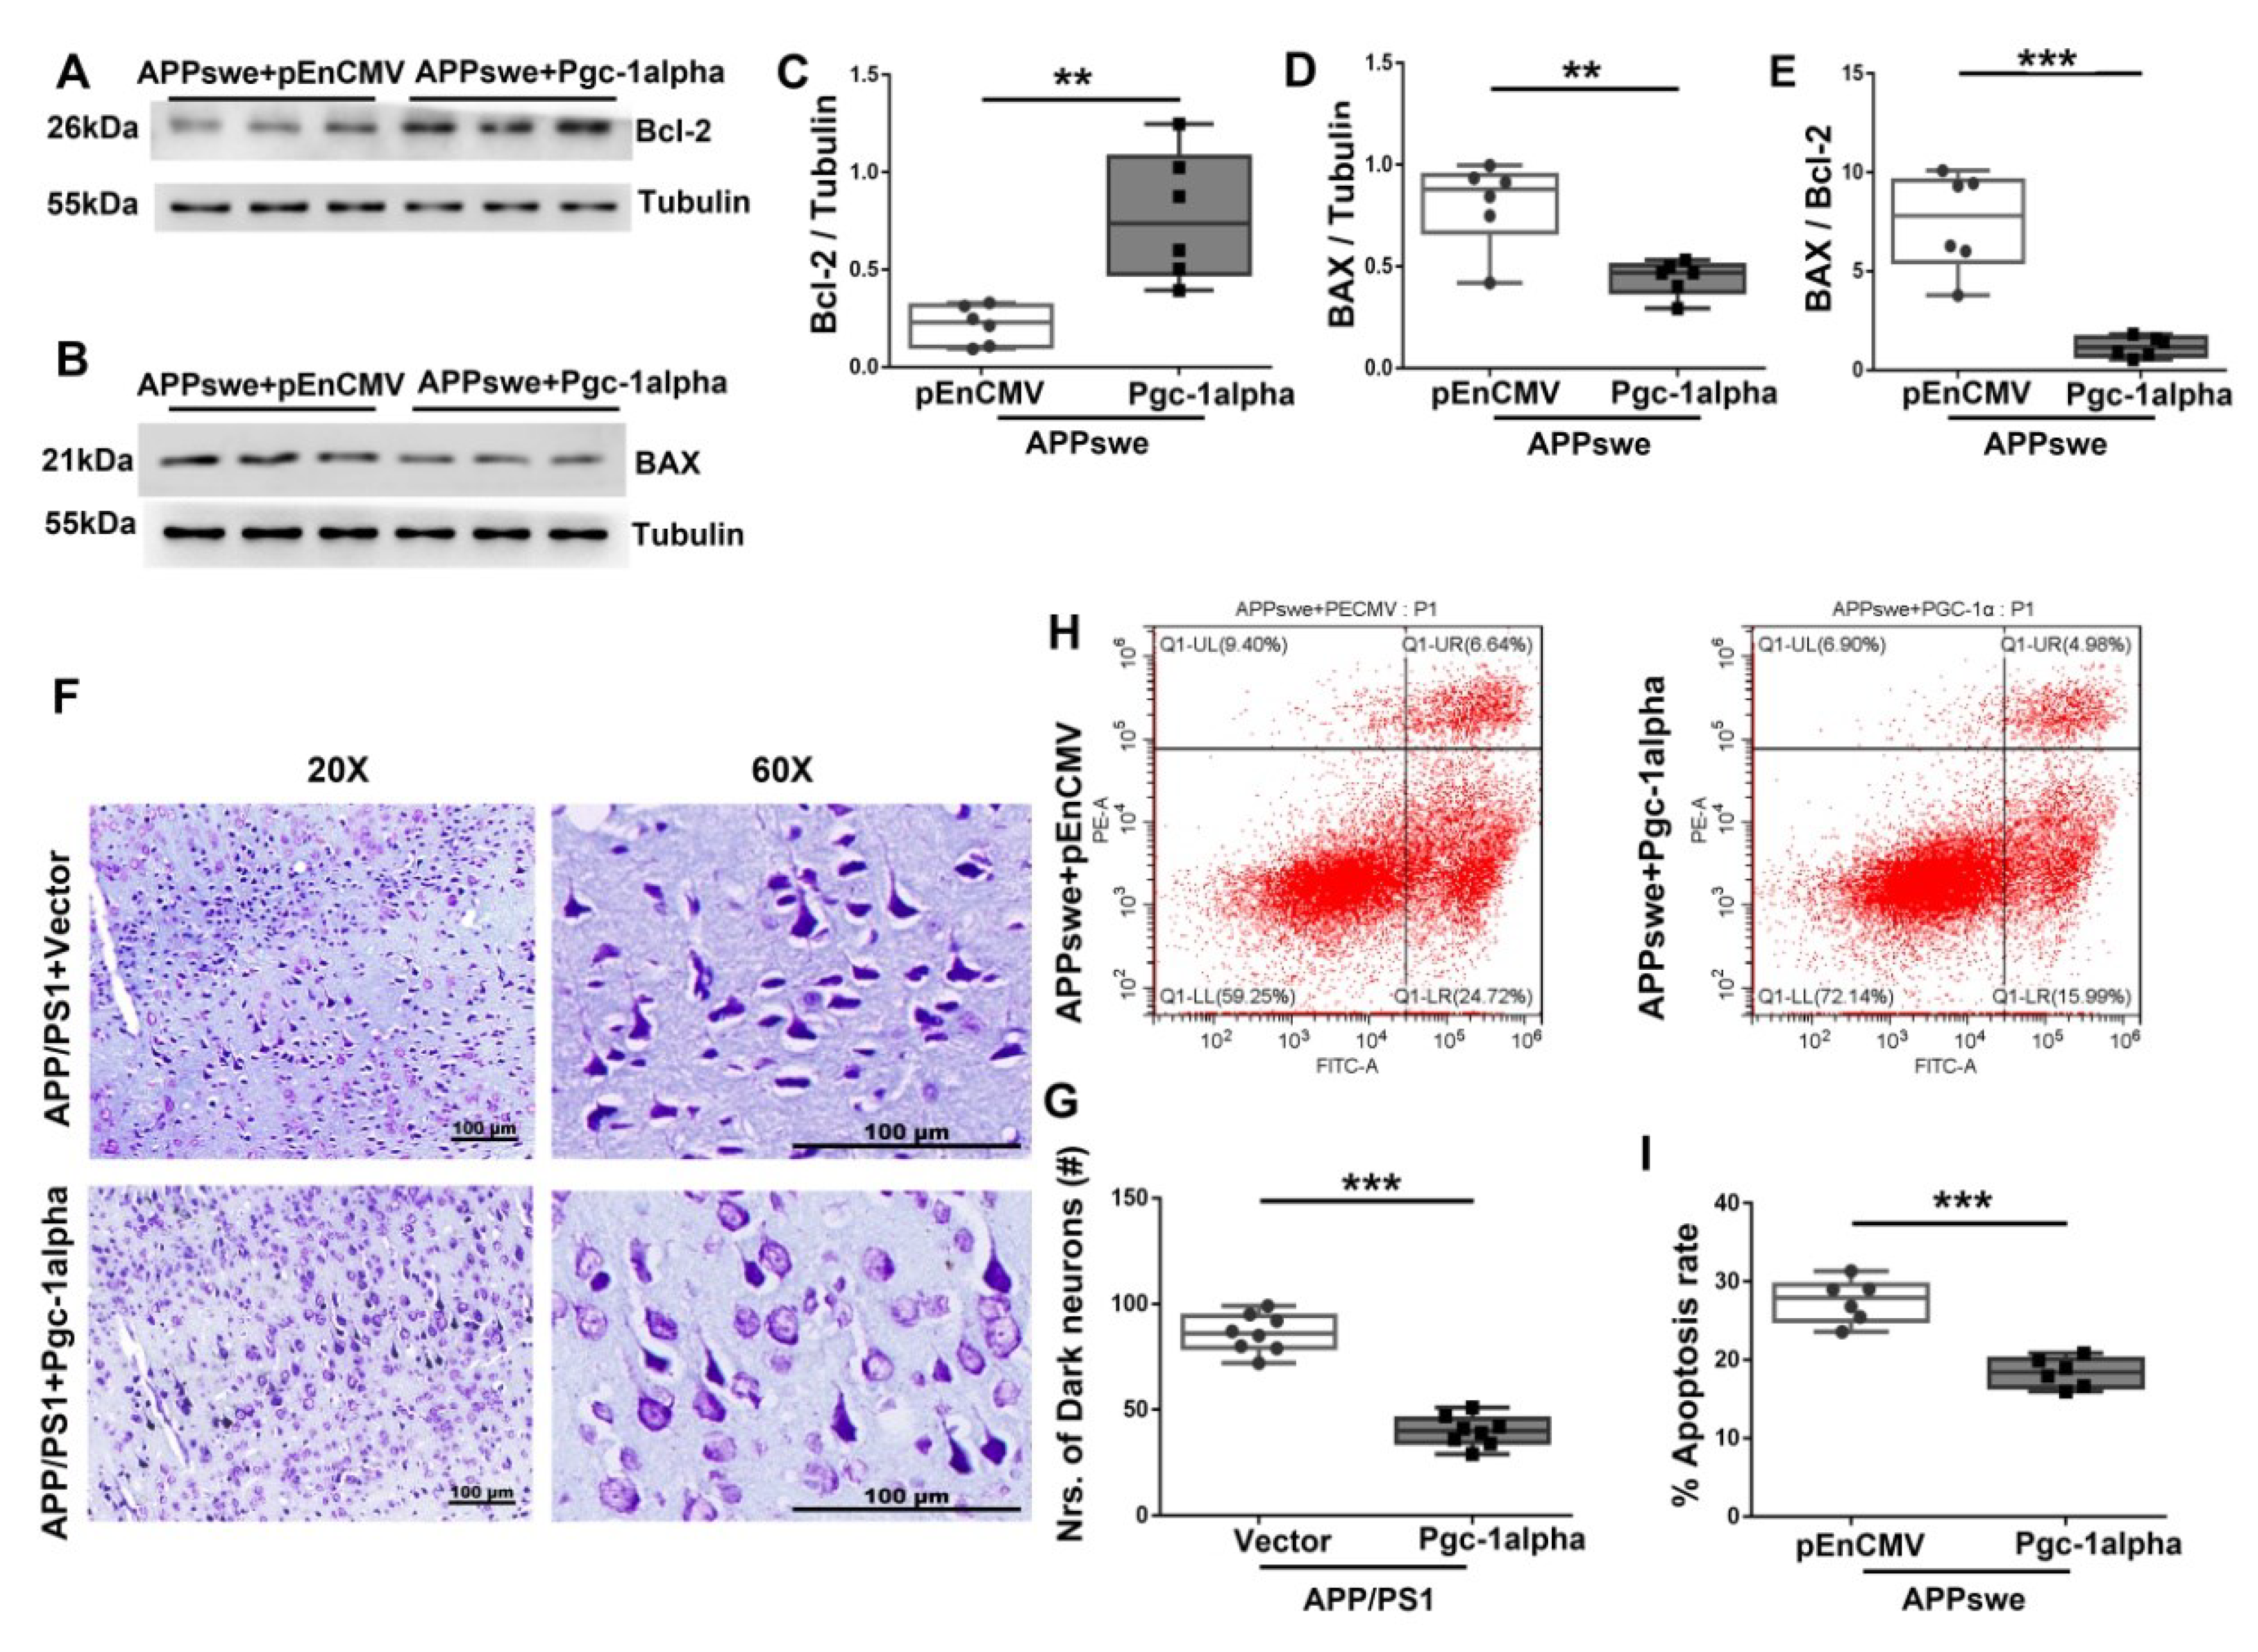
![Cells 11 02849 g008]()
Figure 9.
PGC-1α antagonizes mutAPP-induced abnormalities in mitochondrial axonal transport and distribution. (A) Representative confocal pictures of mitochondria in N2A cells transected with APPswe and pEnCMV/Pgc-1alpha plasmids. Cells were incubated with Mito-DsReds to label mitochondria. Red = mito-DsRed2, Green = Flag-labeled PGC-1α, Blue = DAPI. Scale bars = 10 µm. (B) The qualification of % positively transfected cells with abnormal mitochondria distribution was calculated using the formula [Numbers of cells with abnormal mitochondria distribution /total positively transfected cells] ×100% between the two treatments. At least 20 cells were analyzed in triplicate for each cell line. n = 6 for each group. Significance levels were set at *** p < 0.001 for noted differences between APPswe + pEnCMV and APPswe + Pgc-1alpha transfected cells. (C) N2A cells were transfected with pEnCMV/Pgc-1alpha plasmid and plasmid-encoding APPswe for 48 h. GFP-labeled APPswe and Flag-labeled Pgc-1alpha were successfully overexpressed in N2A cells. Expression patterns and qualification of (D,E) MFN2, (F,G) KIF5A and of (H,I) KIF5B in the cells were studied with Western blot. For each group, n = 6. Significance levels were set at ** p < 0.01, *** p < 0.001 for noted differences between APPswe + pEnCMV and APPswe + Pgc-1alpha groups. Tubulin/GAPDH was used as the loading control.
![Cells 11 02849 g009]()
Figure 10.
PGC-1α rescues AD-associated morphological abnormalities and MMP declines. (A) Representative electron microscopies showing mitochondrial morphology in axons in vivo. Yellow star: swollen mitochondria. Scale bar = 0.5 μm. Quantitative analysis showing the treatment effect of AAV-Vector or AAV-Pgc-1alpha on (B) diameter of mitochondria and (C–E) number of swelling mitochondria both with intact membranes and with ruptured ones in AD brains. For each group, n = 6/group. Significance levels were set at * p < 0.05, ** p < 0.01, *** p < 0.001 for noted differences between APP/PS1 + Vector and APP/PS1 + Pgc-1alpha groups. (F) N2A cells were transfected with pEnCMV/Pgc-1alpha and plasmid-encoding APPswe for 48 h. Detection of JC-1 signals in N2A cells was performed with fluorescence confocal microscopy. Data are representative of three independent measurements. Fluorescence was registered using excitation at 488 nm and adjusting the emission of confocal microscopy for J-monomers (visible as green) and J-aggregates (visible as red/orange). (G,H) The ratio of J-aggregates to J-monomers as an indicator of mitochondrial MMP was examined with CytExpert flow cytometry. For each group, n = 6. Significance levels were set at *** p < 0.001 for noted differences between APPswe + pEnCMV and APPswe + Pgc-1alpha groups.
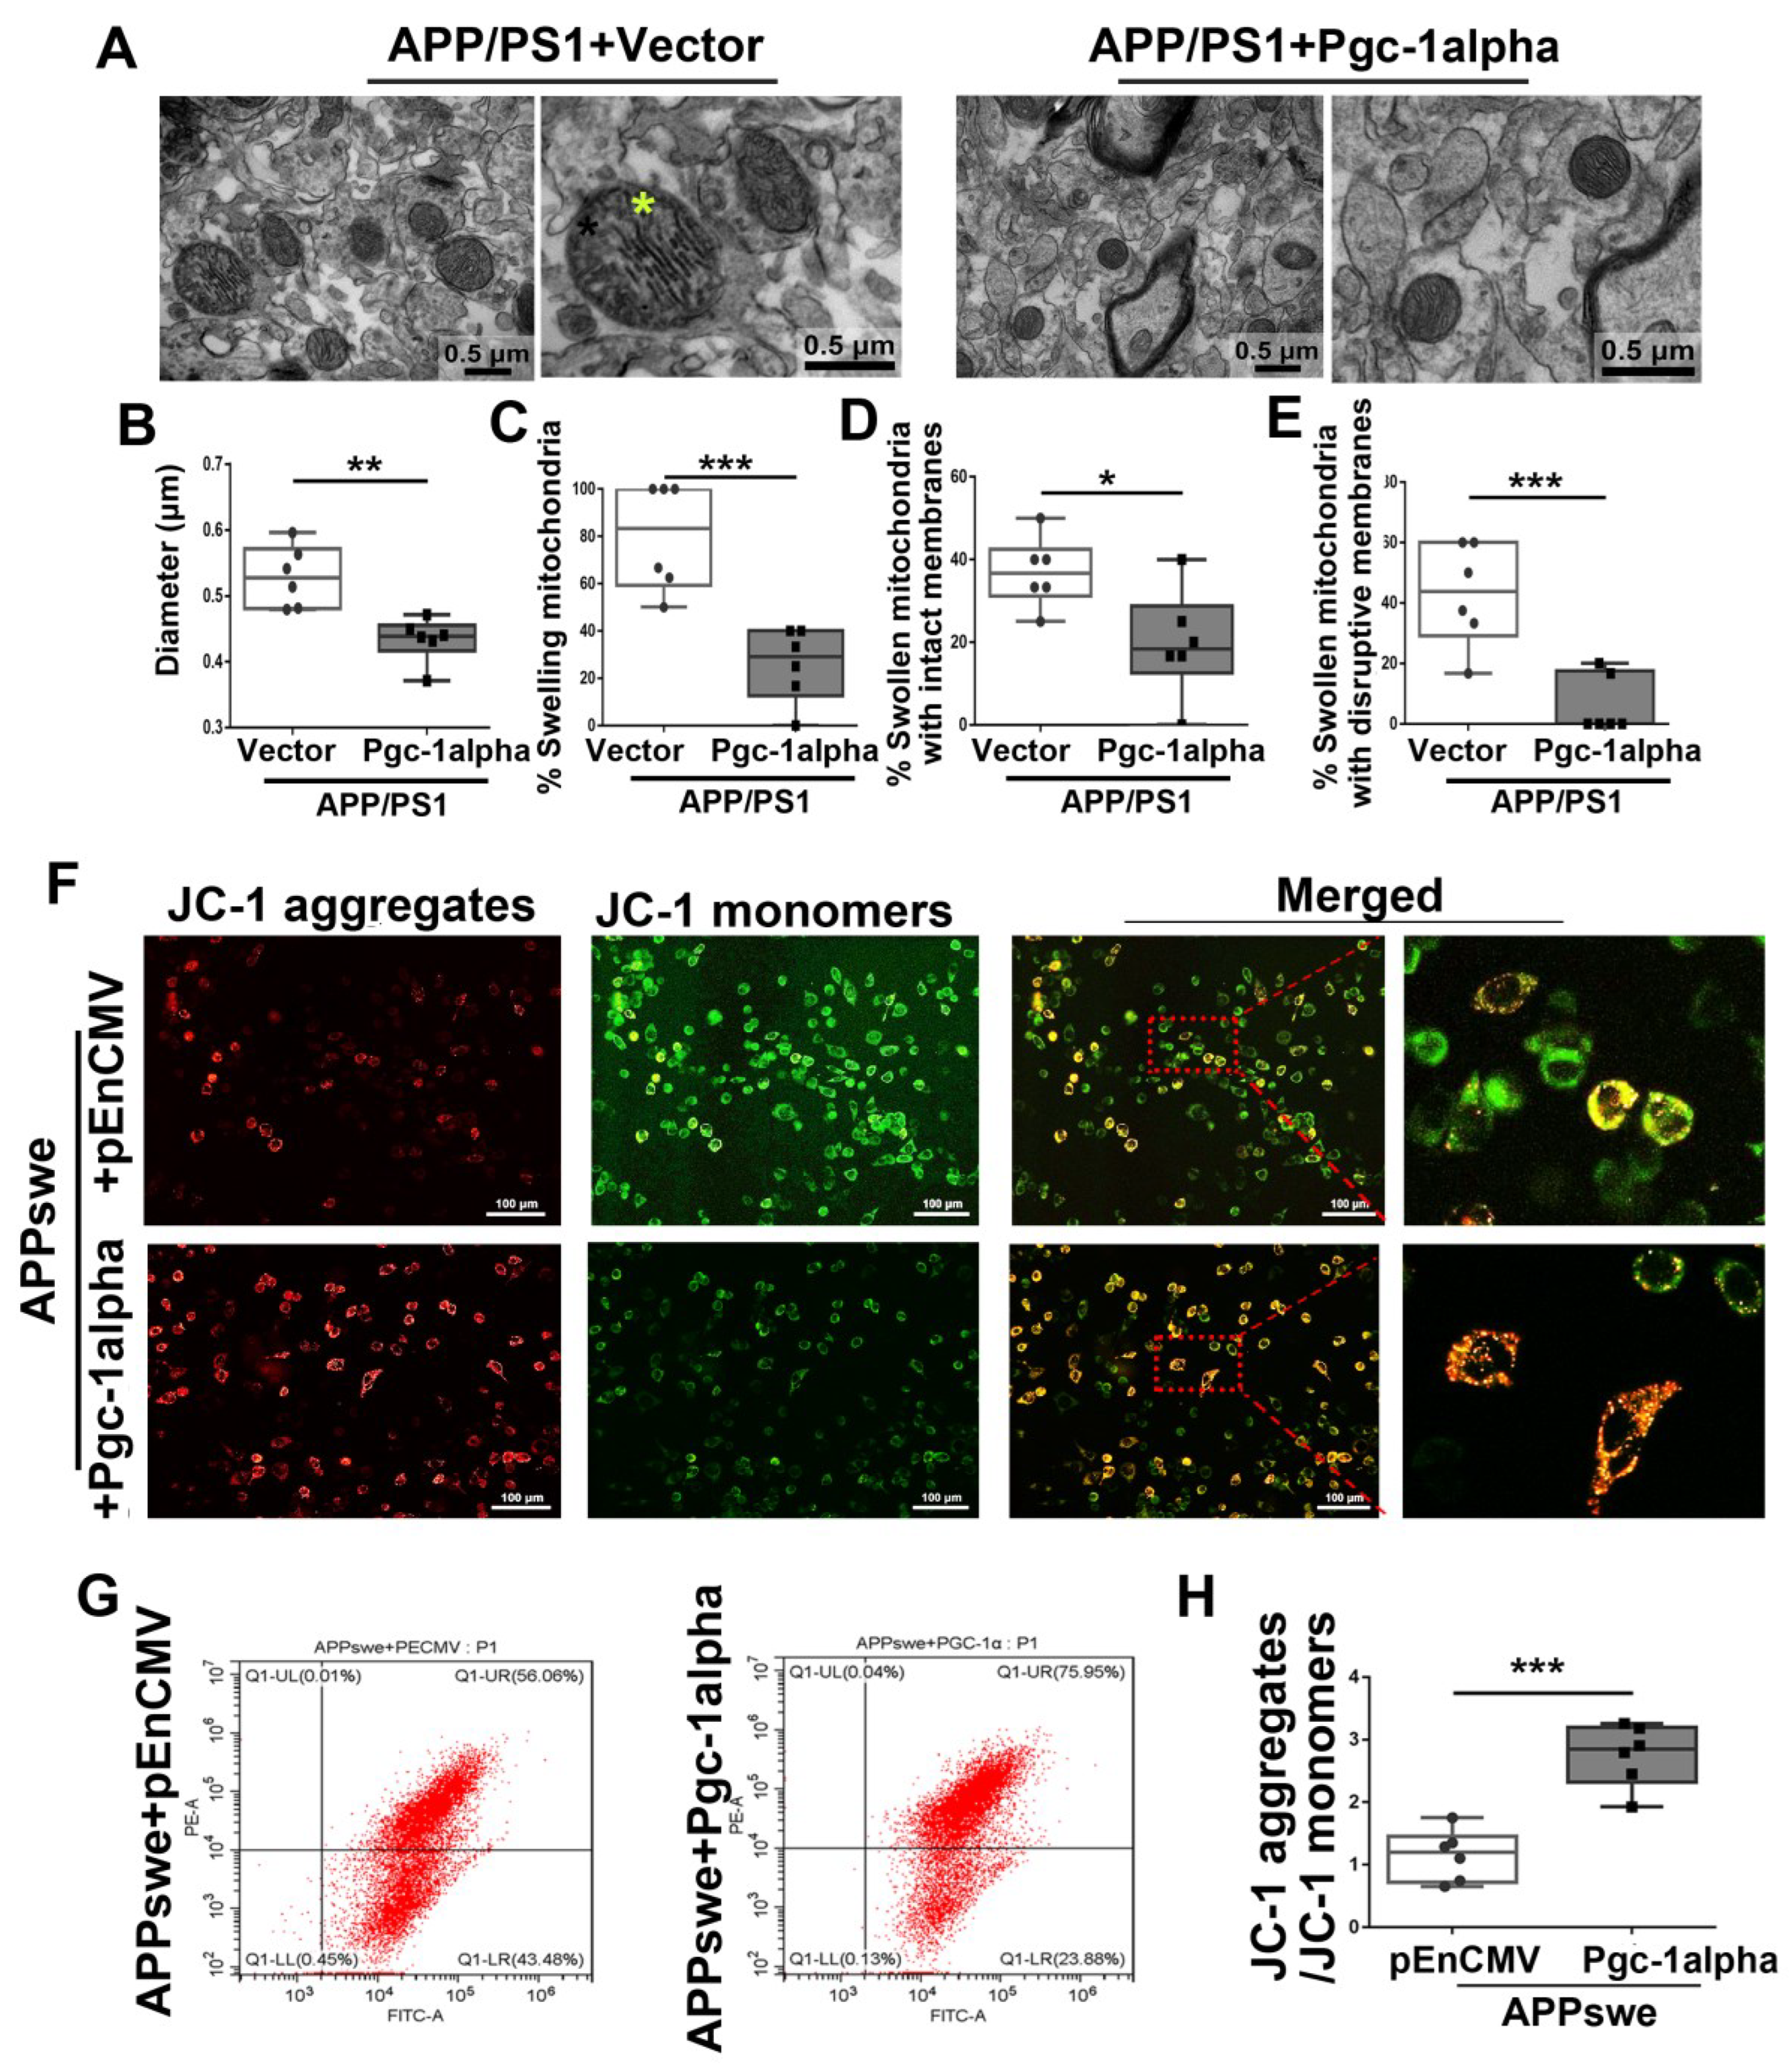
![Cells 11 02849 g010]()
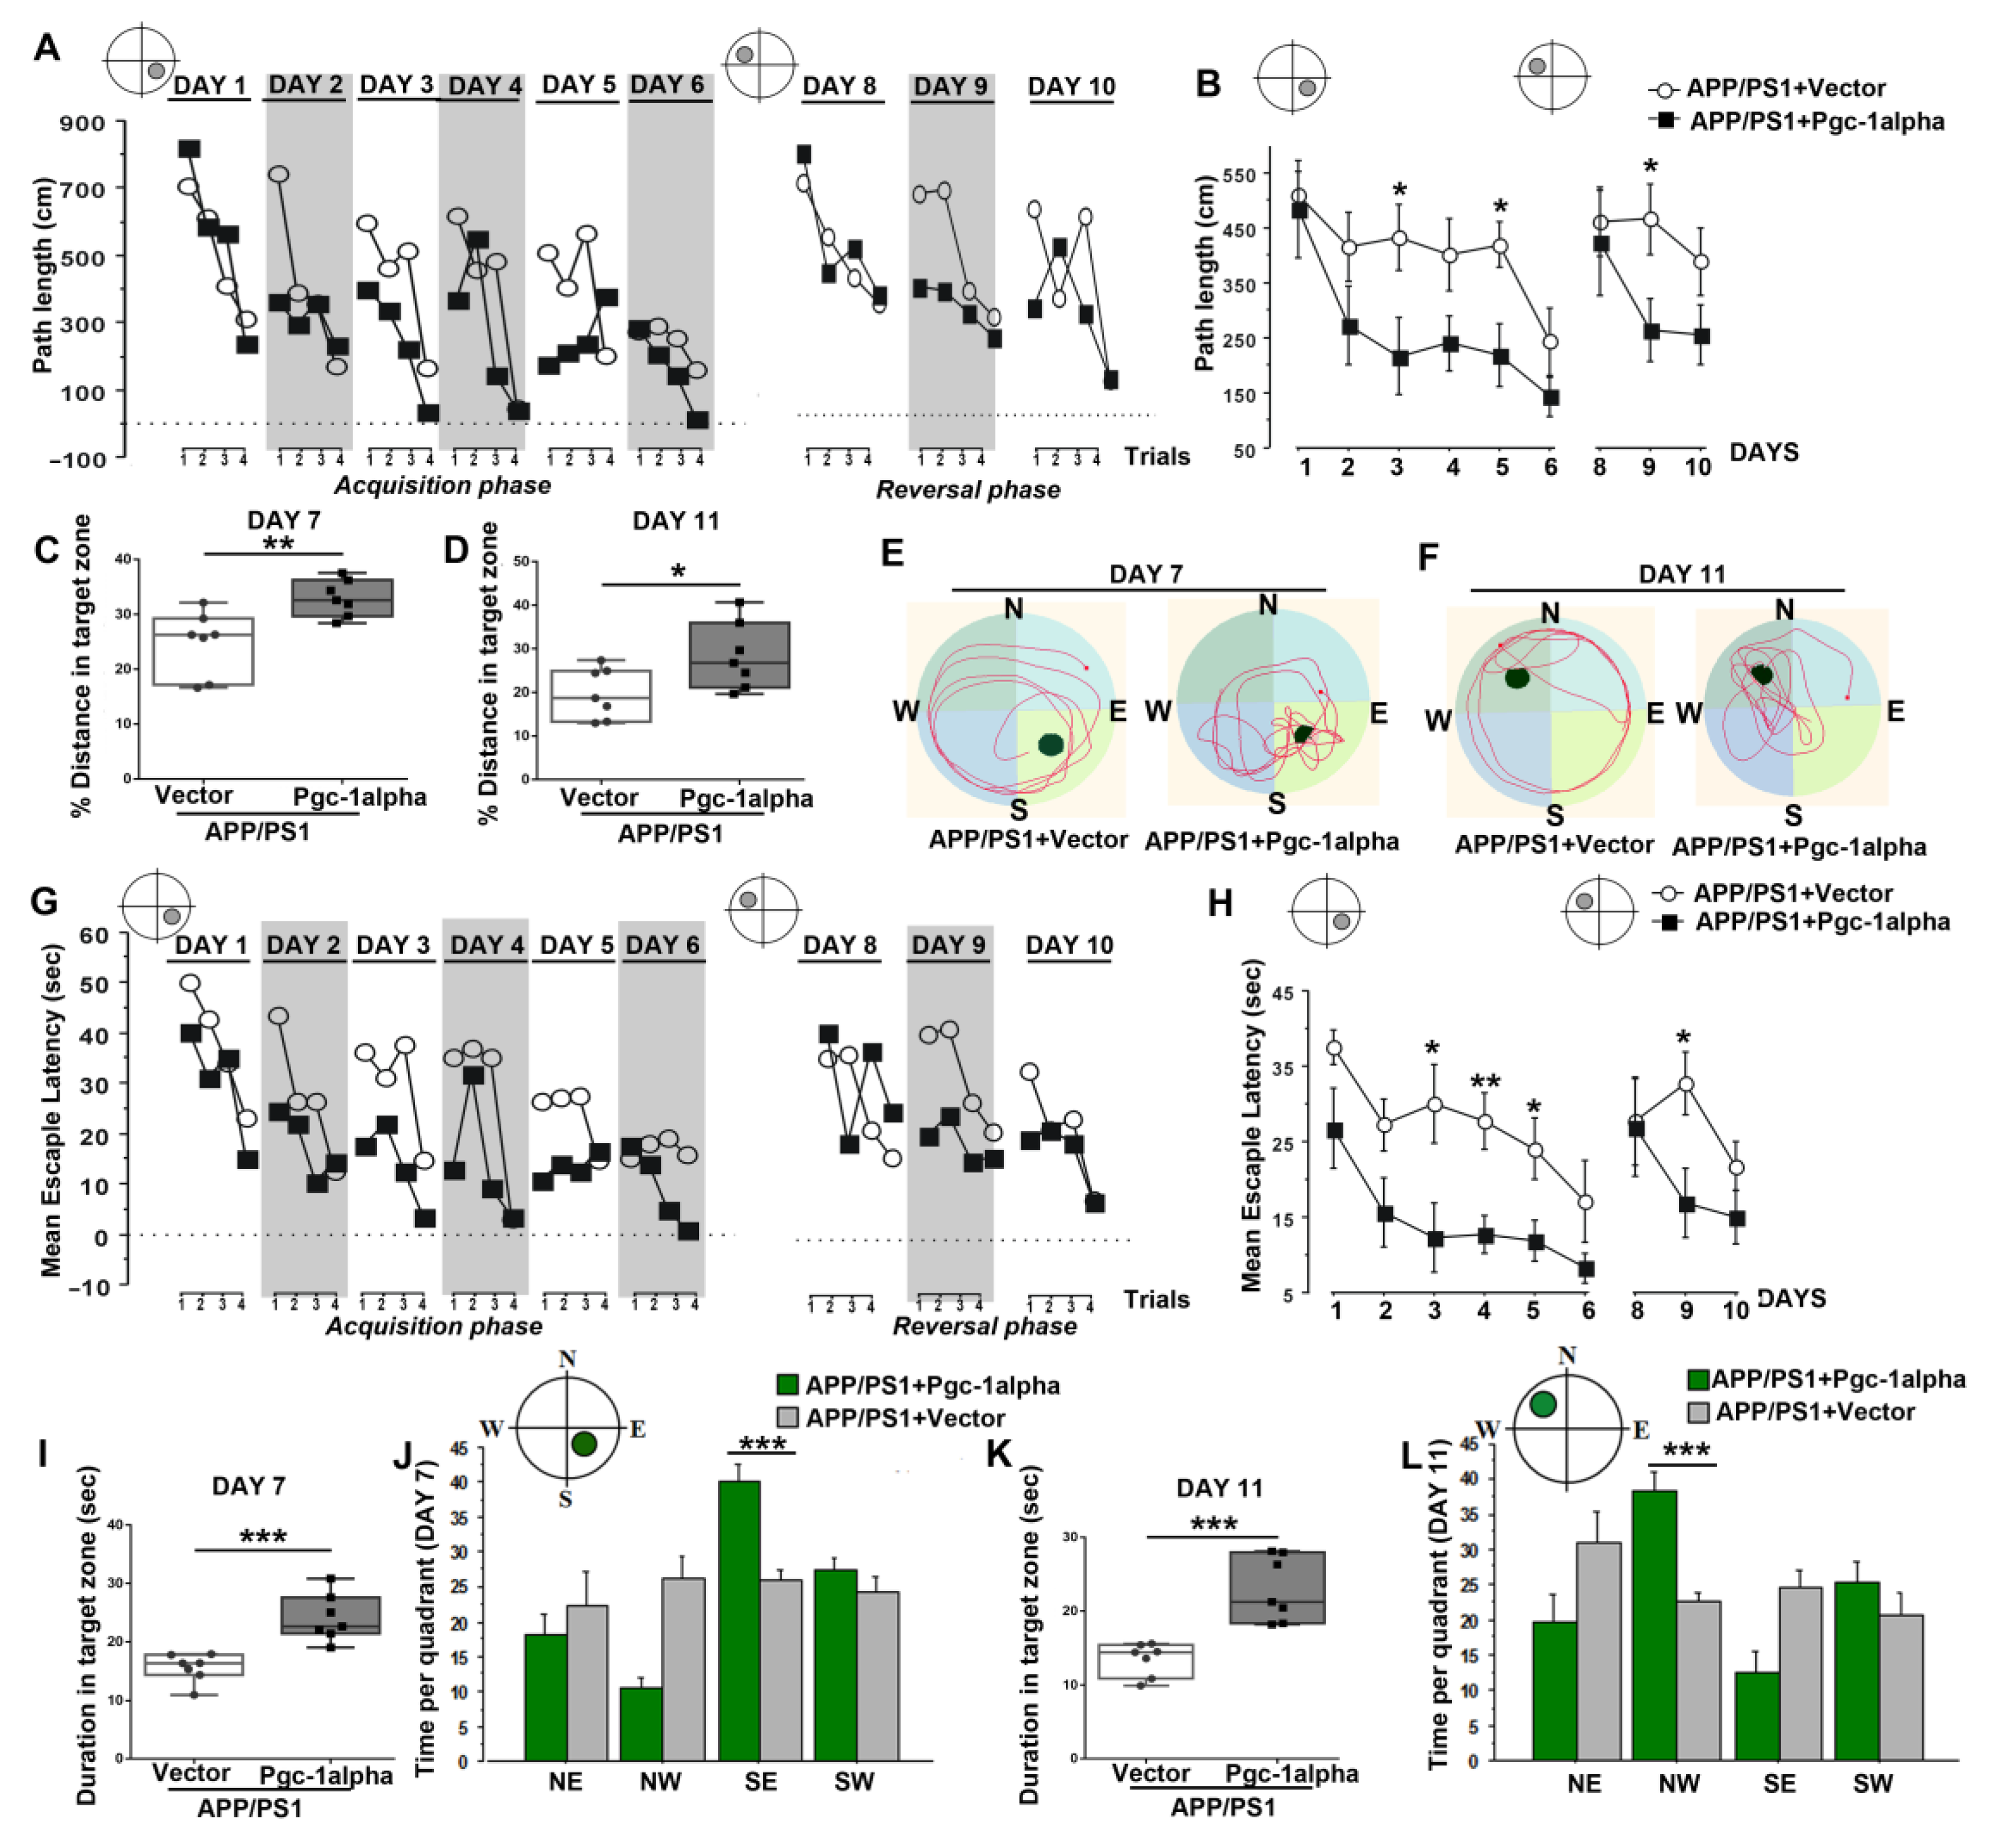
Figure 11.
PGC-1α ameliorates spatial learning disability displayed in AD mice. Performance of path length to reach the hidden platform during the acquisition (Day 1–Day 6) and reversal phases (Day 8–Day 10) for animals was expressed as (B) a function of days and (A) across the 4 trials per day. Distance % in the target zone of the water maze pool during (C) probe test 1 (Day 7) and (D) probe test 2 (Day 11) are shown in the bar graphs. (E,F) present the search patterns made by individual animals during probe tests 1 and 2. Performance of escape latency to reach the hidden platform during the acquisition and reversal phases for animals was expressed as (H) a function of days and (G) across the 4 trials per day. Duration in the target zone of the water maze pool during (I) probe test 1 and (K) probe test 2 are shown in the bar graphs. Time was recorded in each of the four quadrants to index search preference for the initial platform location during (J) probe test 1 and (L) probe test 2 for the two treatments. Values were expressed as means ± S.E.M. For each group, n = 7–8. Significance levels were set at * p < 0.05, ** p < 0.01, *** p < 0.001 for noted differences between APP/PS1 + Vector and APP/PS1 + Pgc-1alpha groups.
![Cells 11 02849 g011]()
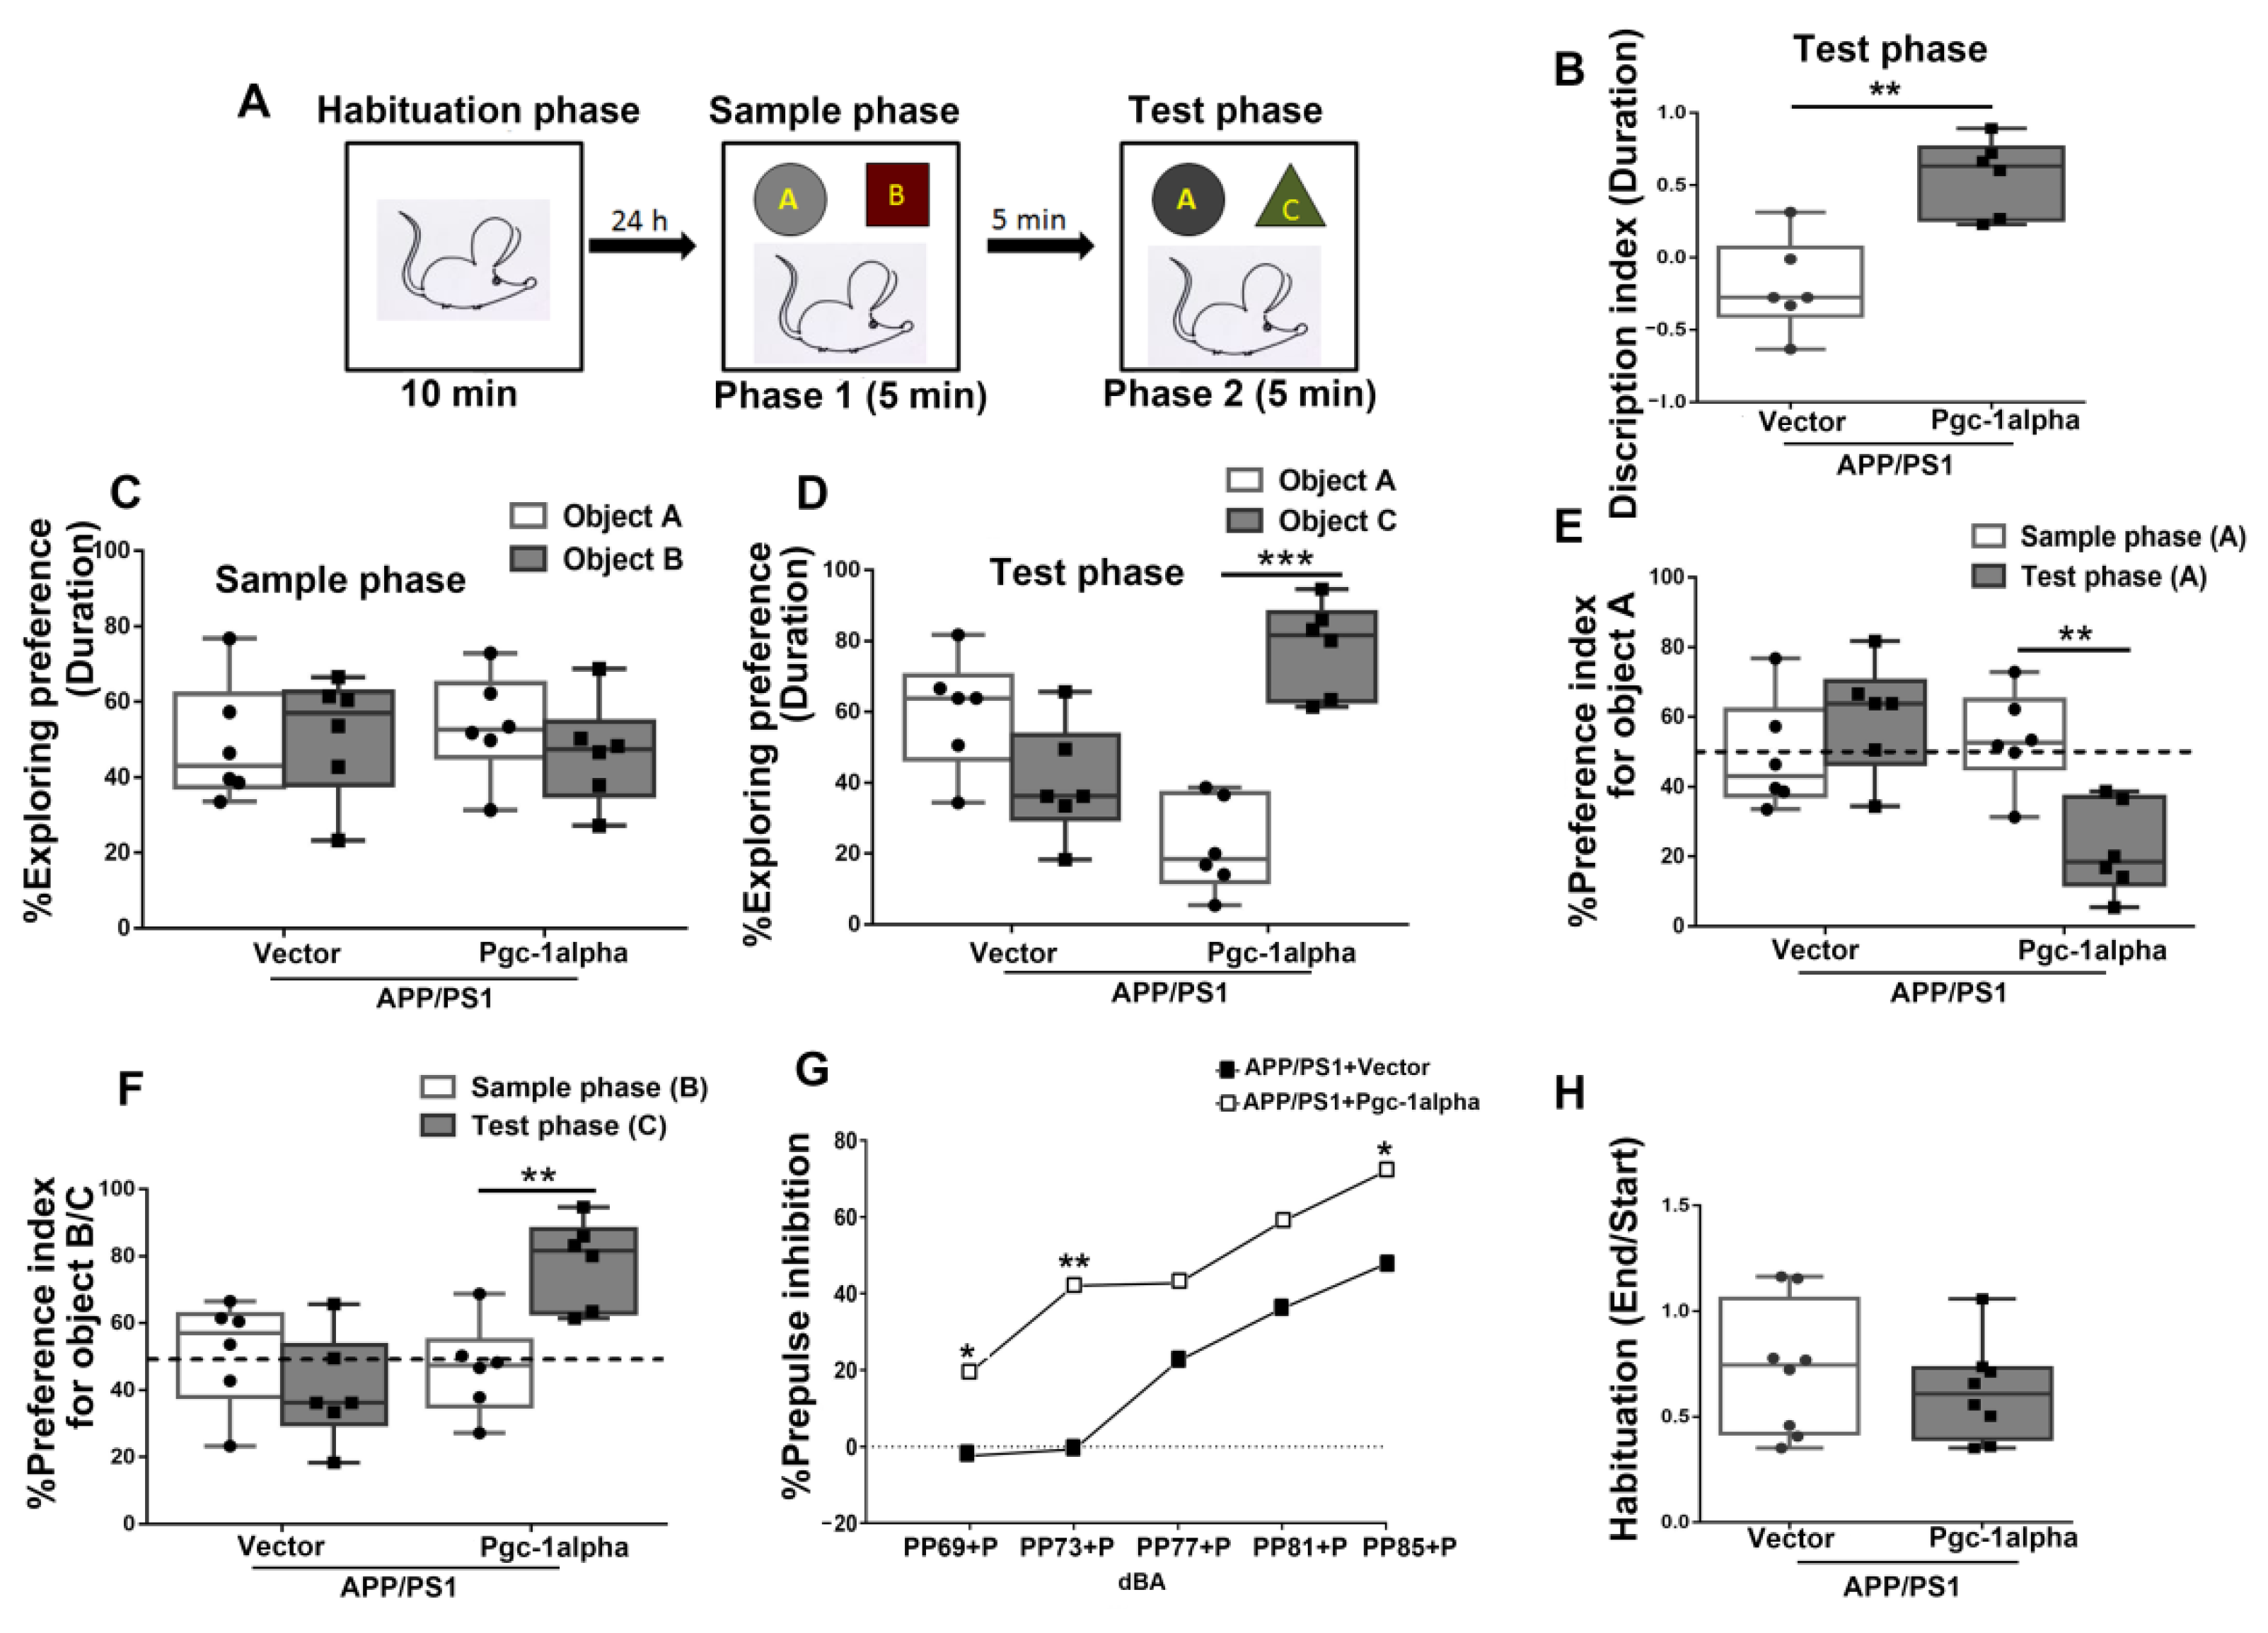
Figure 12.
PGC-1α ameliorates novel object learning deficits and sensorimotor gating impairment displayed in AD mice. (A) The top panel showed the design of the standard novel object recognition task. During the habituation phase, the animal was allowed to explore an empty arena for 10 min. 24 h later, the animals were exposed to two objects (A,B) (Sample phase), and then after a 5 min interval, they received a 5 min test in which they were allowed to explore a duplicate of the familiar object (A) and a novel object (C) (Test phase). (B) The time spent exploring the novel object (C) for AD mice during the test phase was indicated as Discrimination index (DI). [The test phase: DI = (DC - DA)/(DC + DA)]. (C) The treatment (Vector/Pgc-1alpha) effect on distinguishing objects A and B for AD mice during the sample phase was indicated by Exploring preference (EP). [The sample phase: EPA = (DA)/(DA + DB); EPB = (DB)/(DA + DB)]. (D) The treatment (Vector/Pgc-1alpha) effect on % EP for AD mice distinguishing object A and C during the test phase was calculated using the formula [The test phase: EPA = (DA)/(DA + DC); EPC = (DC)/(DA + DC)]. (E) The treatment (Vector/Pgc-1alpha) effect on % Preference index (PI) for AD mice recognize the object A during the sample phase was calculated using the formula [The sample phase: PIA = (DA)/(DA + DB)], while during the test phase, it was calculated using the formula [The test phase: PIA = (DA)/(DA + DC)]. (F) The treatment (Vector/Pgc-1alpha) effect on % PI for AD mice recognize the object B during the sample phase was calculated using the formula [The sample phase: PIB = (DB)/(DA + DB)], while recognizing object C during the test phase was calculated using the formula [The test phase: PIC = (DC)/(DA + DC)]. (H) The mean startle magnitudes obtained in the first six and last six pulse-alone (120 dBA) trials are shown in the bar graph. (G) % PPI was expressed as a function of prepulse intensity (69, 73, 77, 81, and 85 dBA) for mice of the two treatments. % PPI = [(pulse alone-(prepulse plus pulse))/pulse alone × 100%]. Values were expressed as means ± S. E. M. For each group, n = 7–8. Significance levels were set at * p < 0.05, ** p < 0.01, *** p < 0.001 for noted differences between two treatments/objects/phases.
![Cells 11 02849 g012]()
Table 1.
Summary of clinicopathological characteristics of human cases.
Table 1.
Summary of clinicopathological characteristics of human cases.
| Group | n | Age
(yrs) | Gender (M/F) | Duration (yrs) | Education (yrs) | DRS (Mean) | MMSE (Mean) |
|---|
| Control | 3 | 87.0 ± 4.4 | 1/2 | 0 | 11.2 ± 2.6 | 141.4 ± 4.33 | 29.21 ± 0.6 |
| AD | 4 | 85.0 ± 3.8 | 2/2 | 9.8 ± 1.6 | 12.3 ± 1.3 | 39.67 ± 10.13 | 7.4 ± 2.3 |


