
Distinct and Dynamic Transcriptome Adaptations of iPSC-Generated Astrocytes after Cytokine Stimulation

 and
and 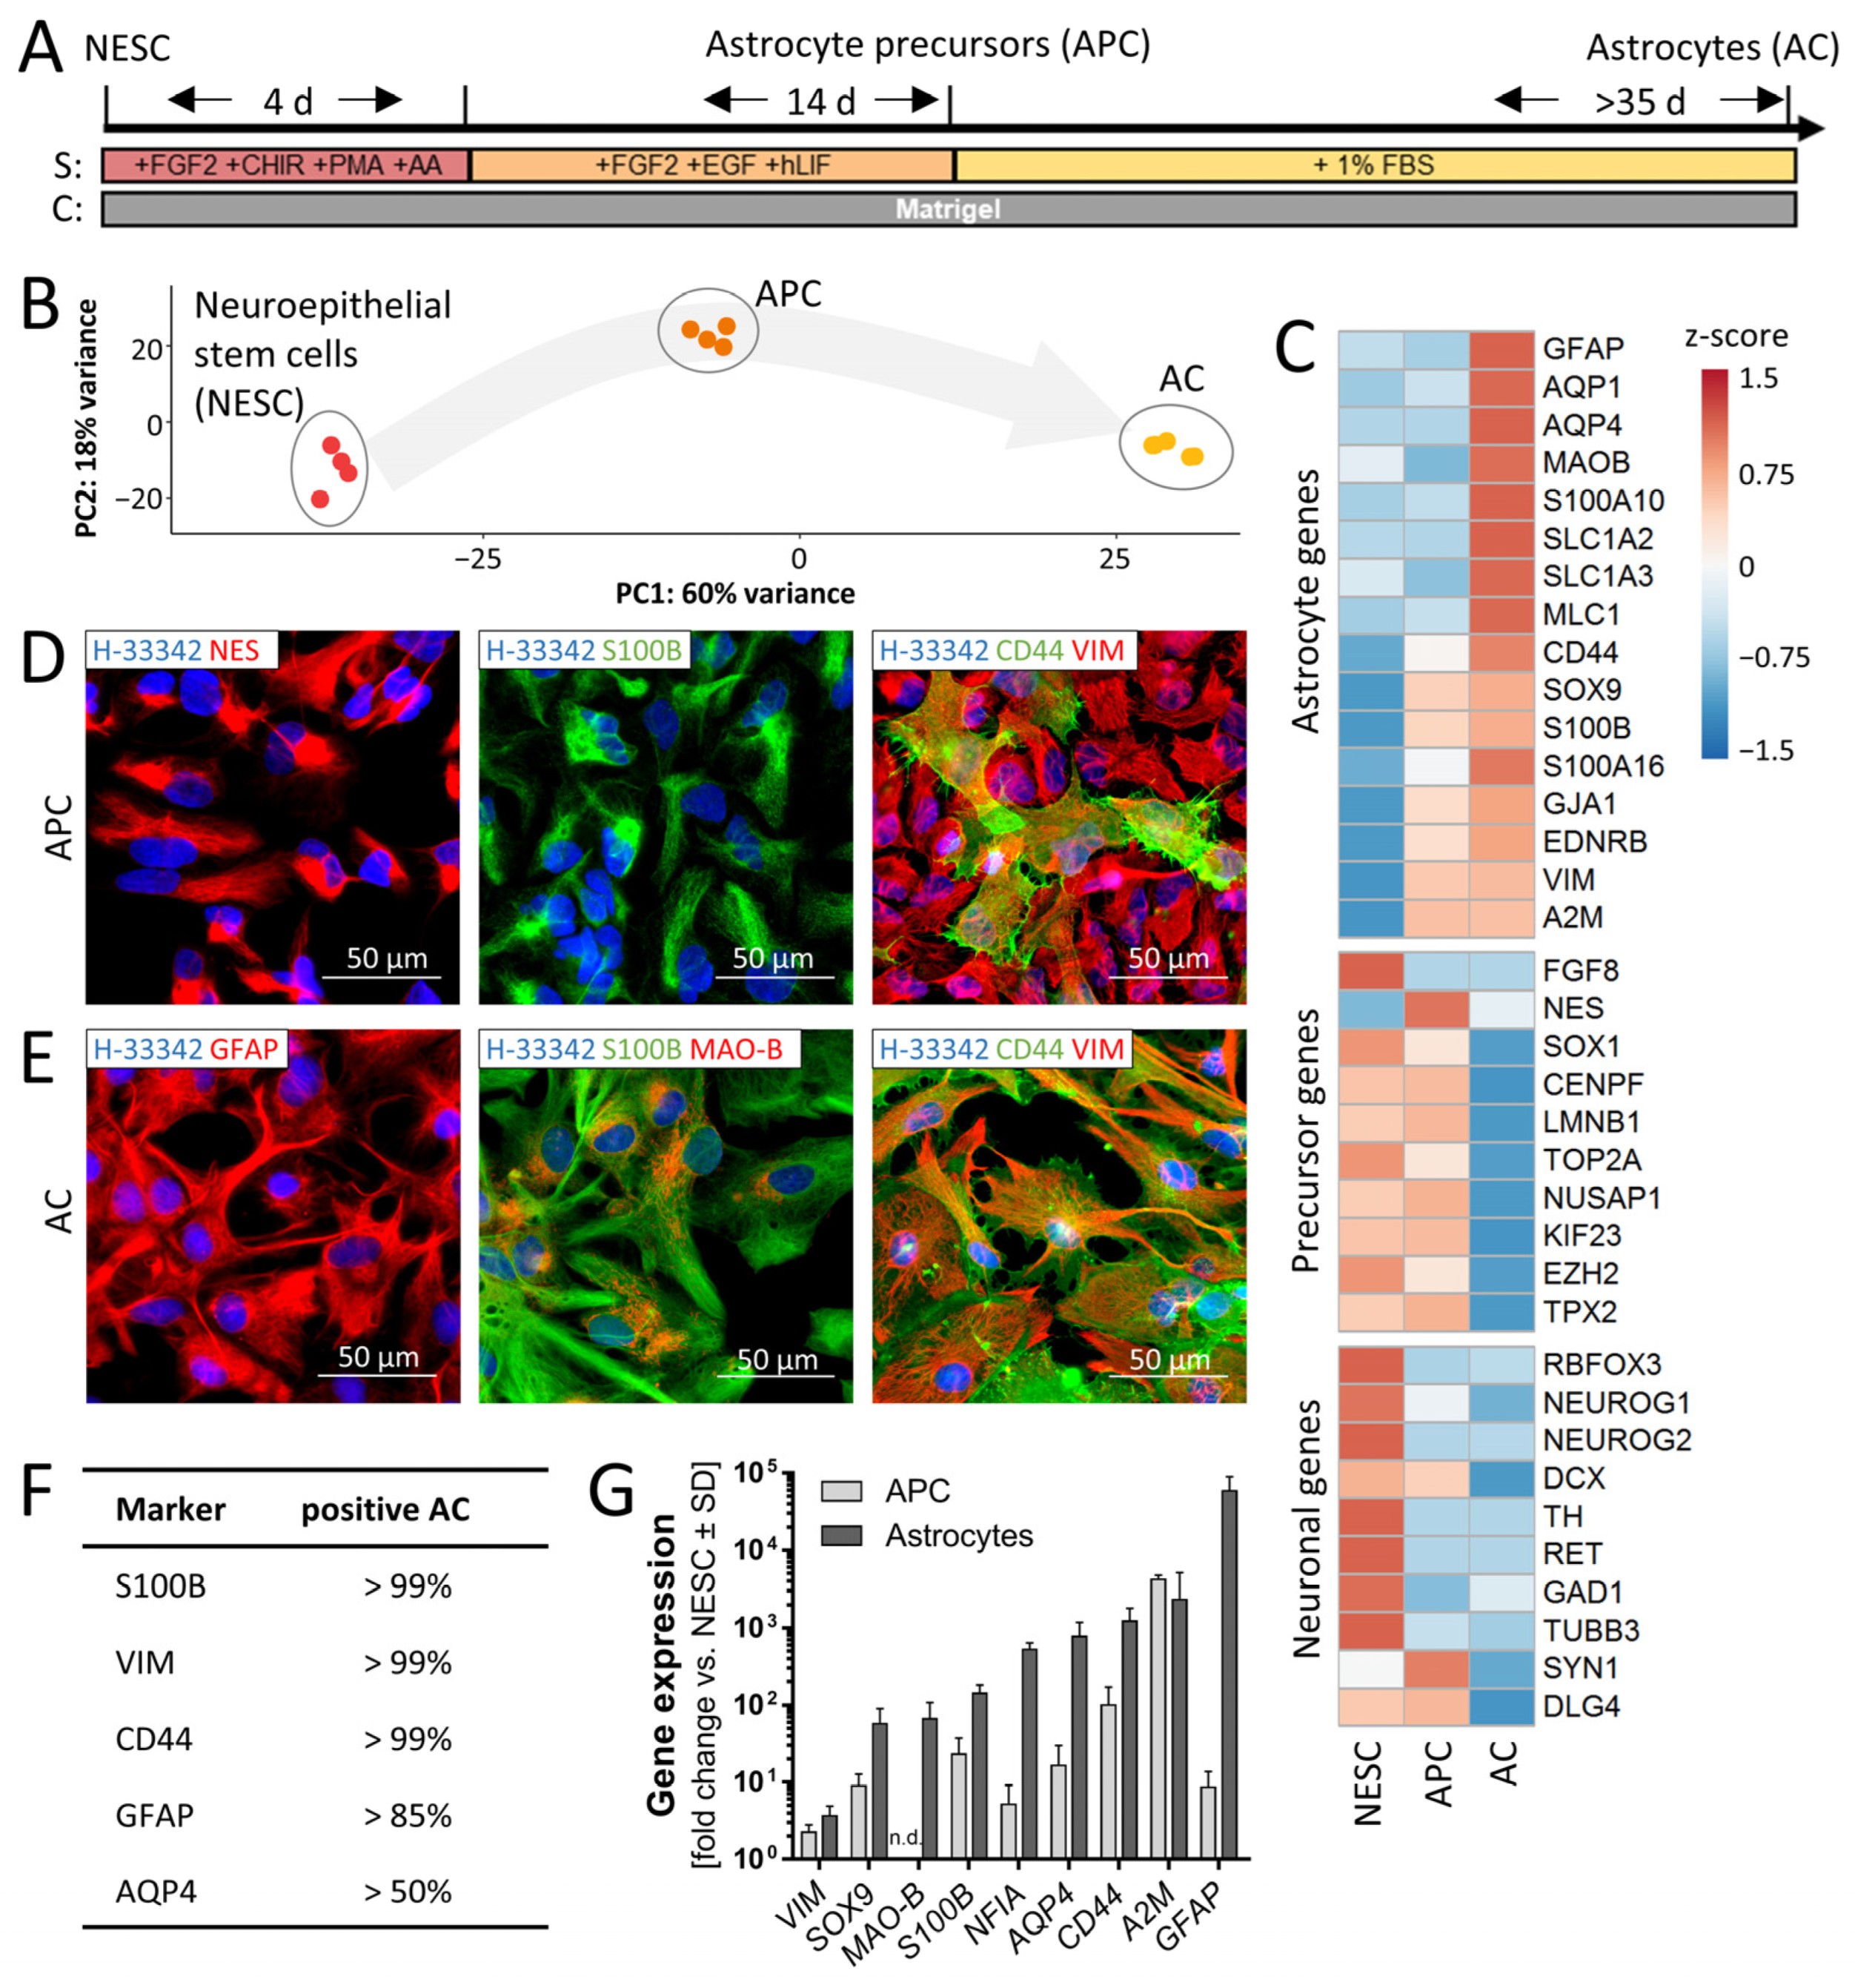
Abstract
:1. Introduction
2. Materials and Methods
2.1. Differentiation and Culture of iPSC-Derived Astrocytes
2.2. Re-Seeding of APCs and Astrocytes
2.3. Freezing of APCs and Astrocytes
2.4. Coating of Cell Culture Plates
2.5. RNA Extraction, cDNA Synthesis and Real-Time qPCR
2.6. Immunofluorescence Staining
2.7. Quantification of Morphological Changes
2.8. NFκB Translocation
2.9. Western Blot
2.10. Treatment of Astrocytes for Transcriptome Sample Generation
2.11. Transcriptome Data Generation and Analysis
2.12. Statistics
3. Results
3.1. Two-Step Differentiation of Astrocytes from Neural Stem Cells
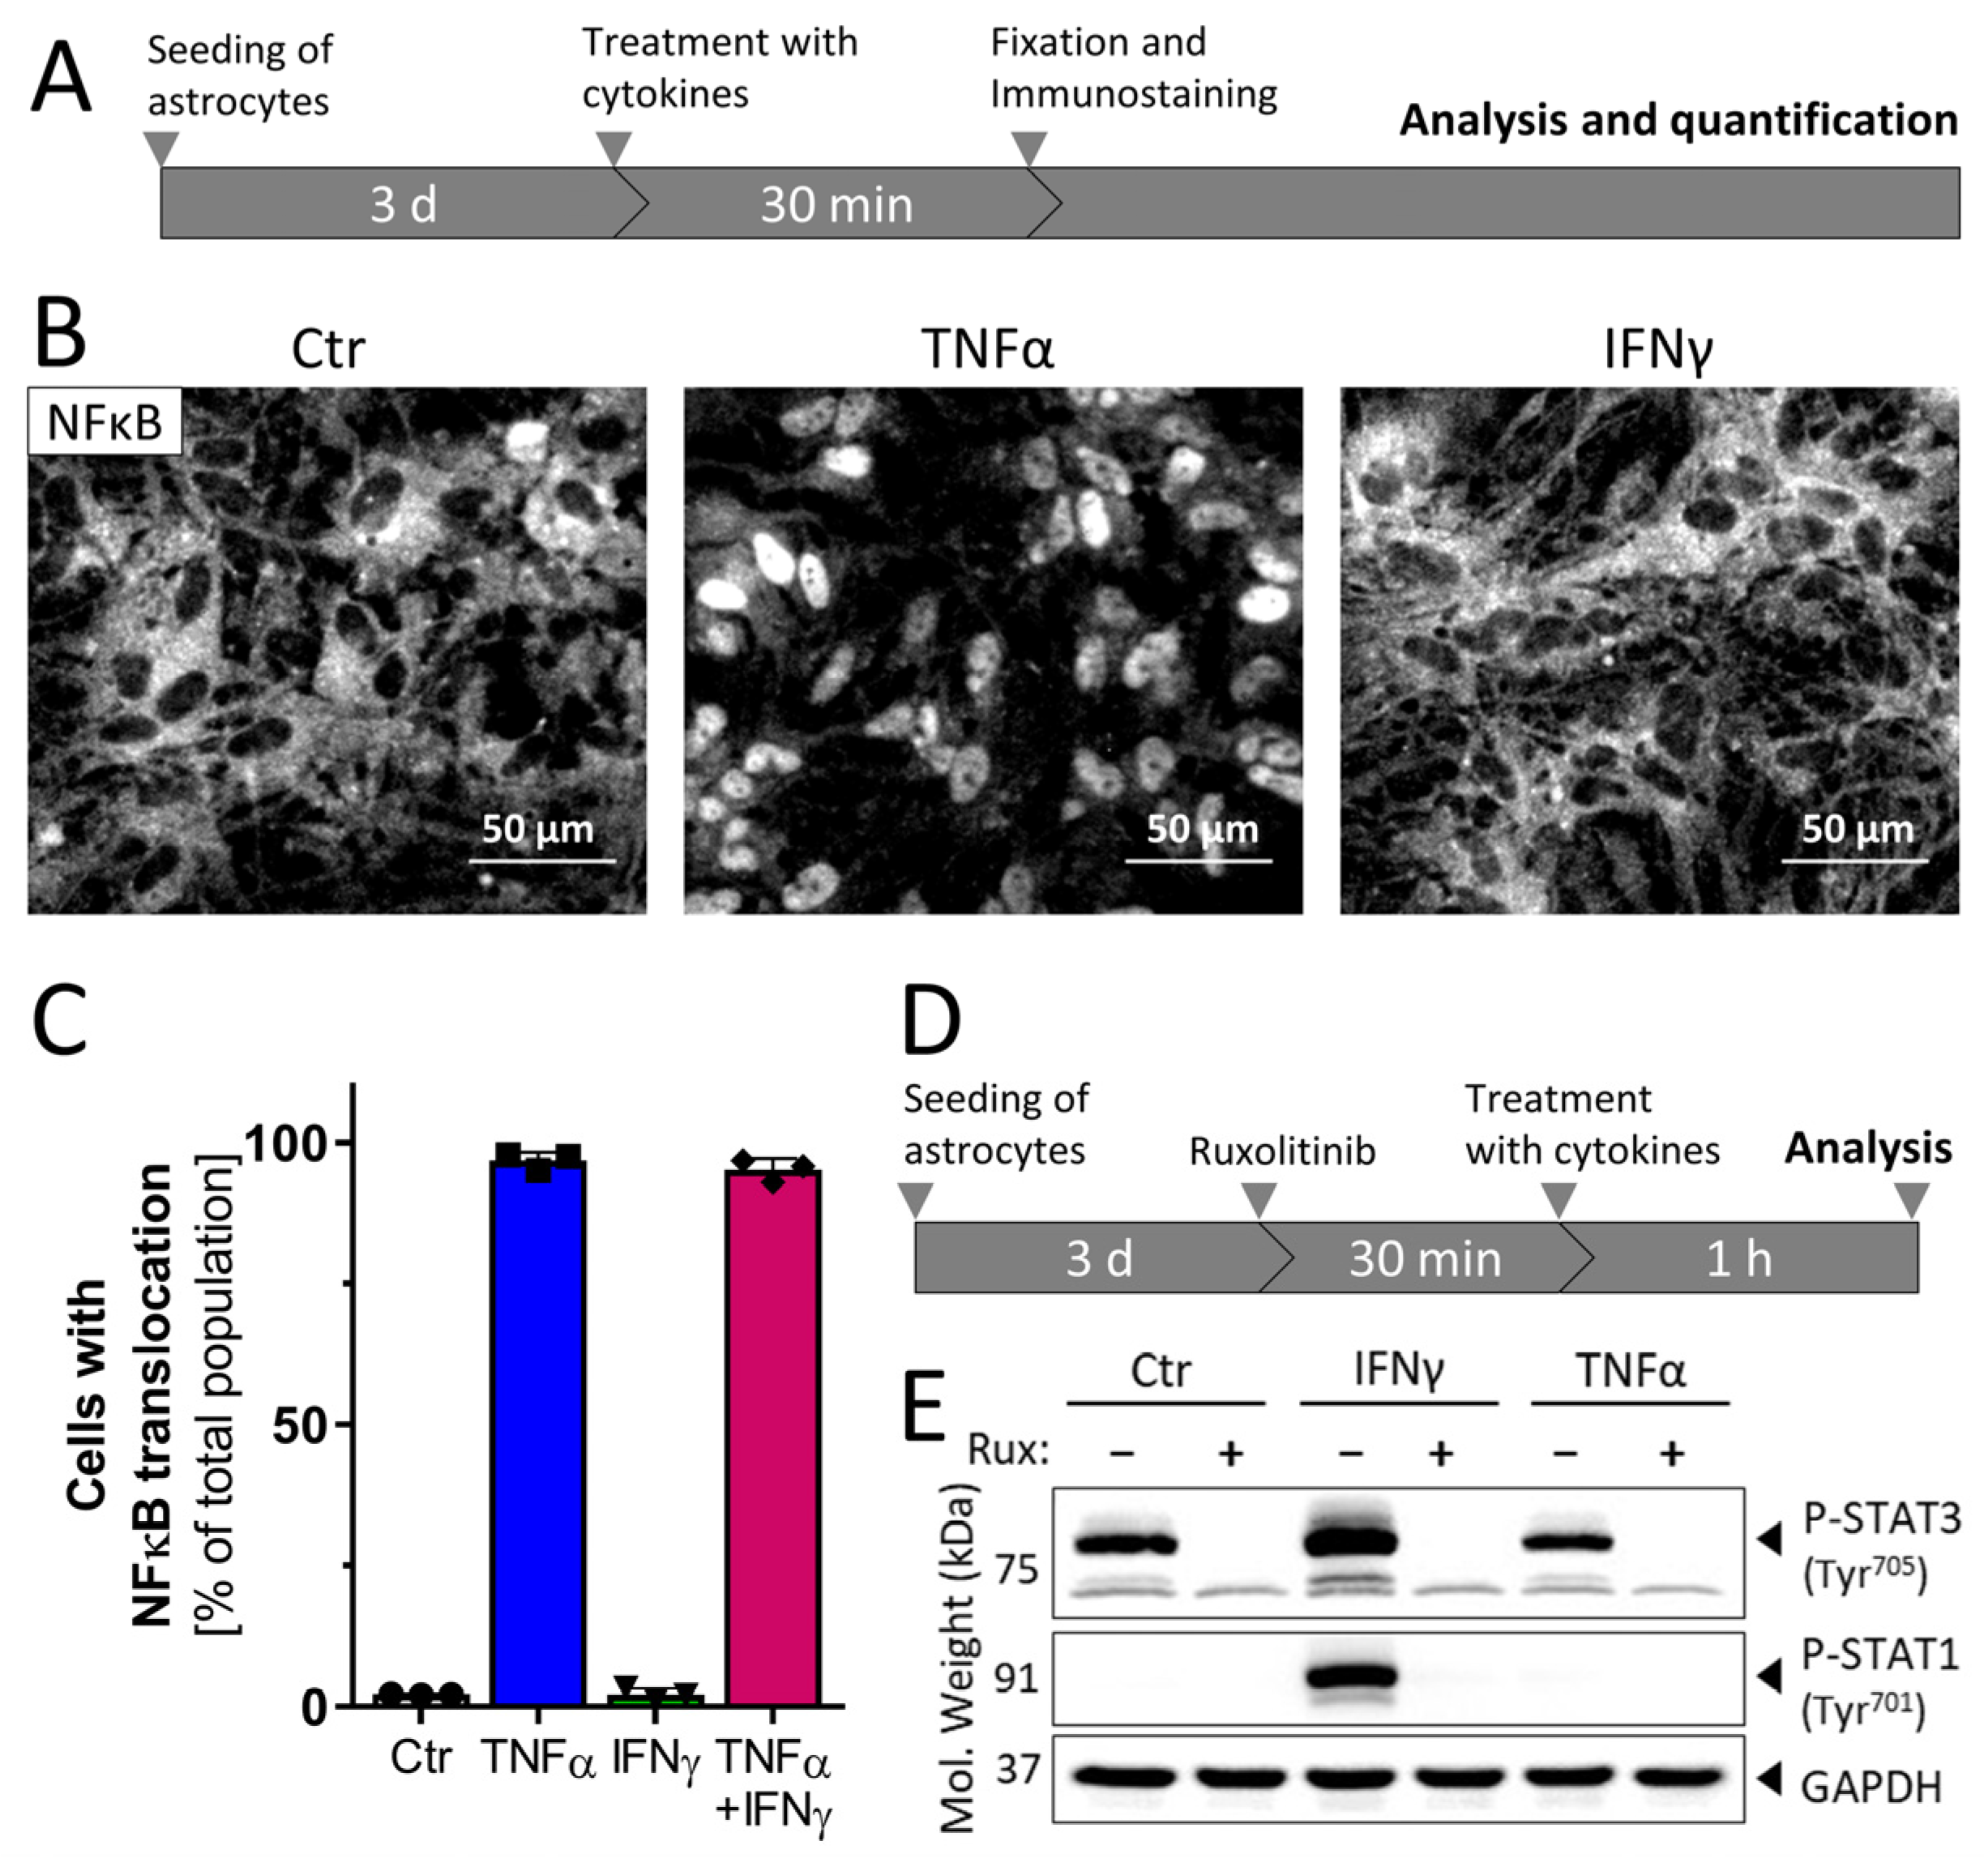
3.2. Inflammatory Competence of iPSC-Derived Astrocytes after Stimulation with Cytokines
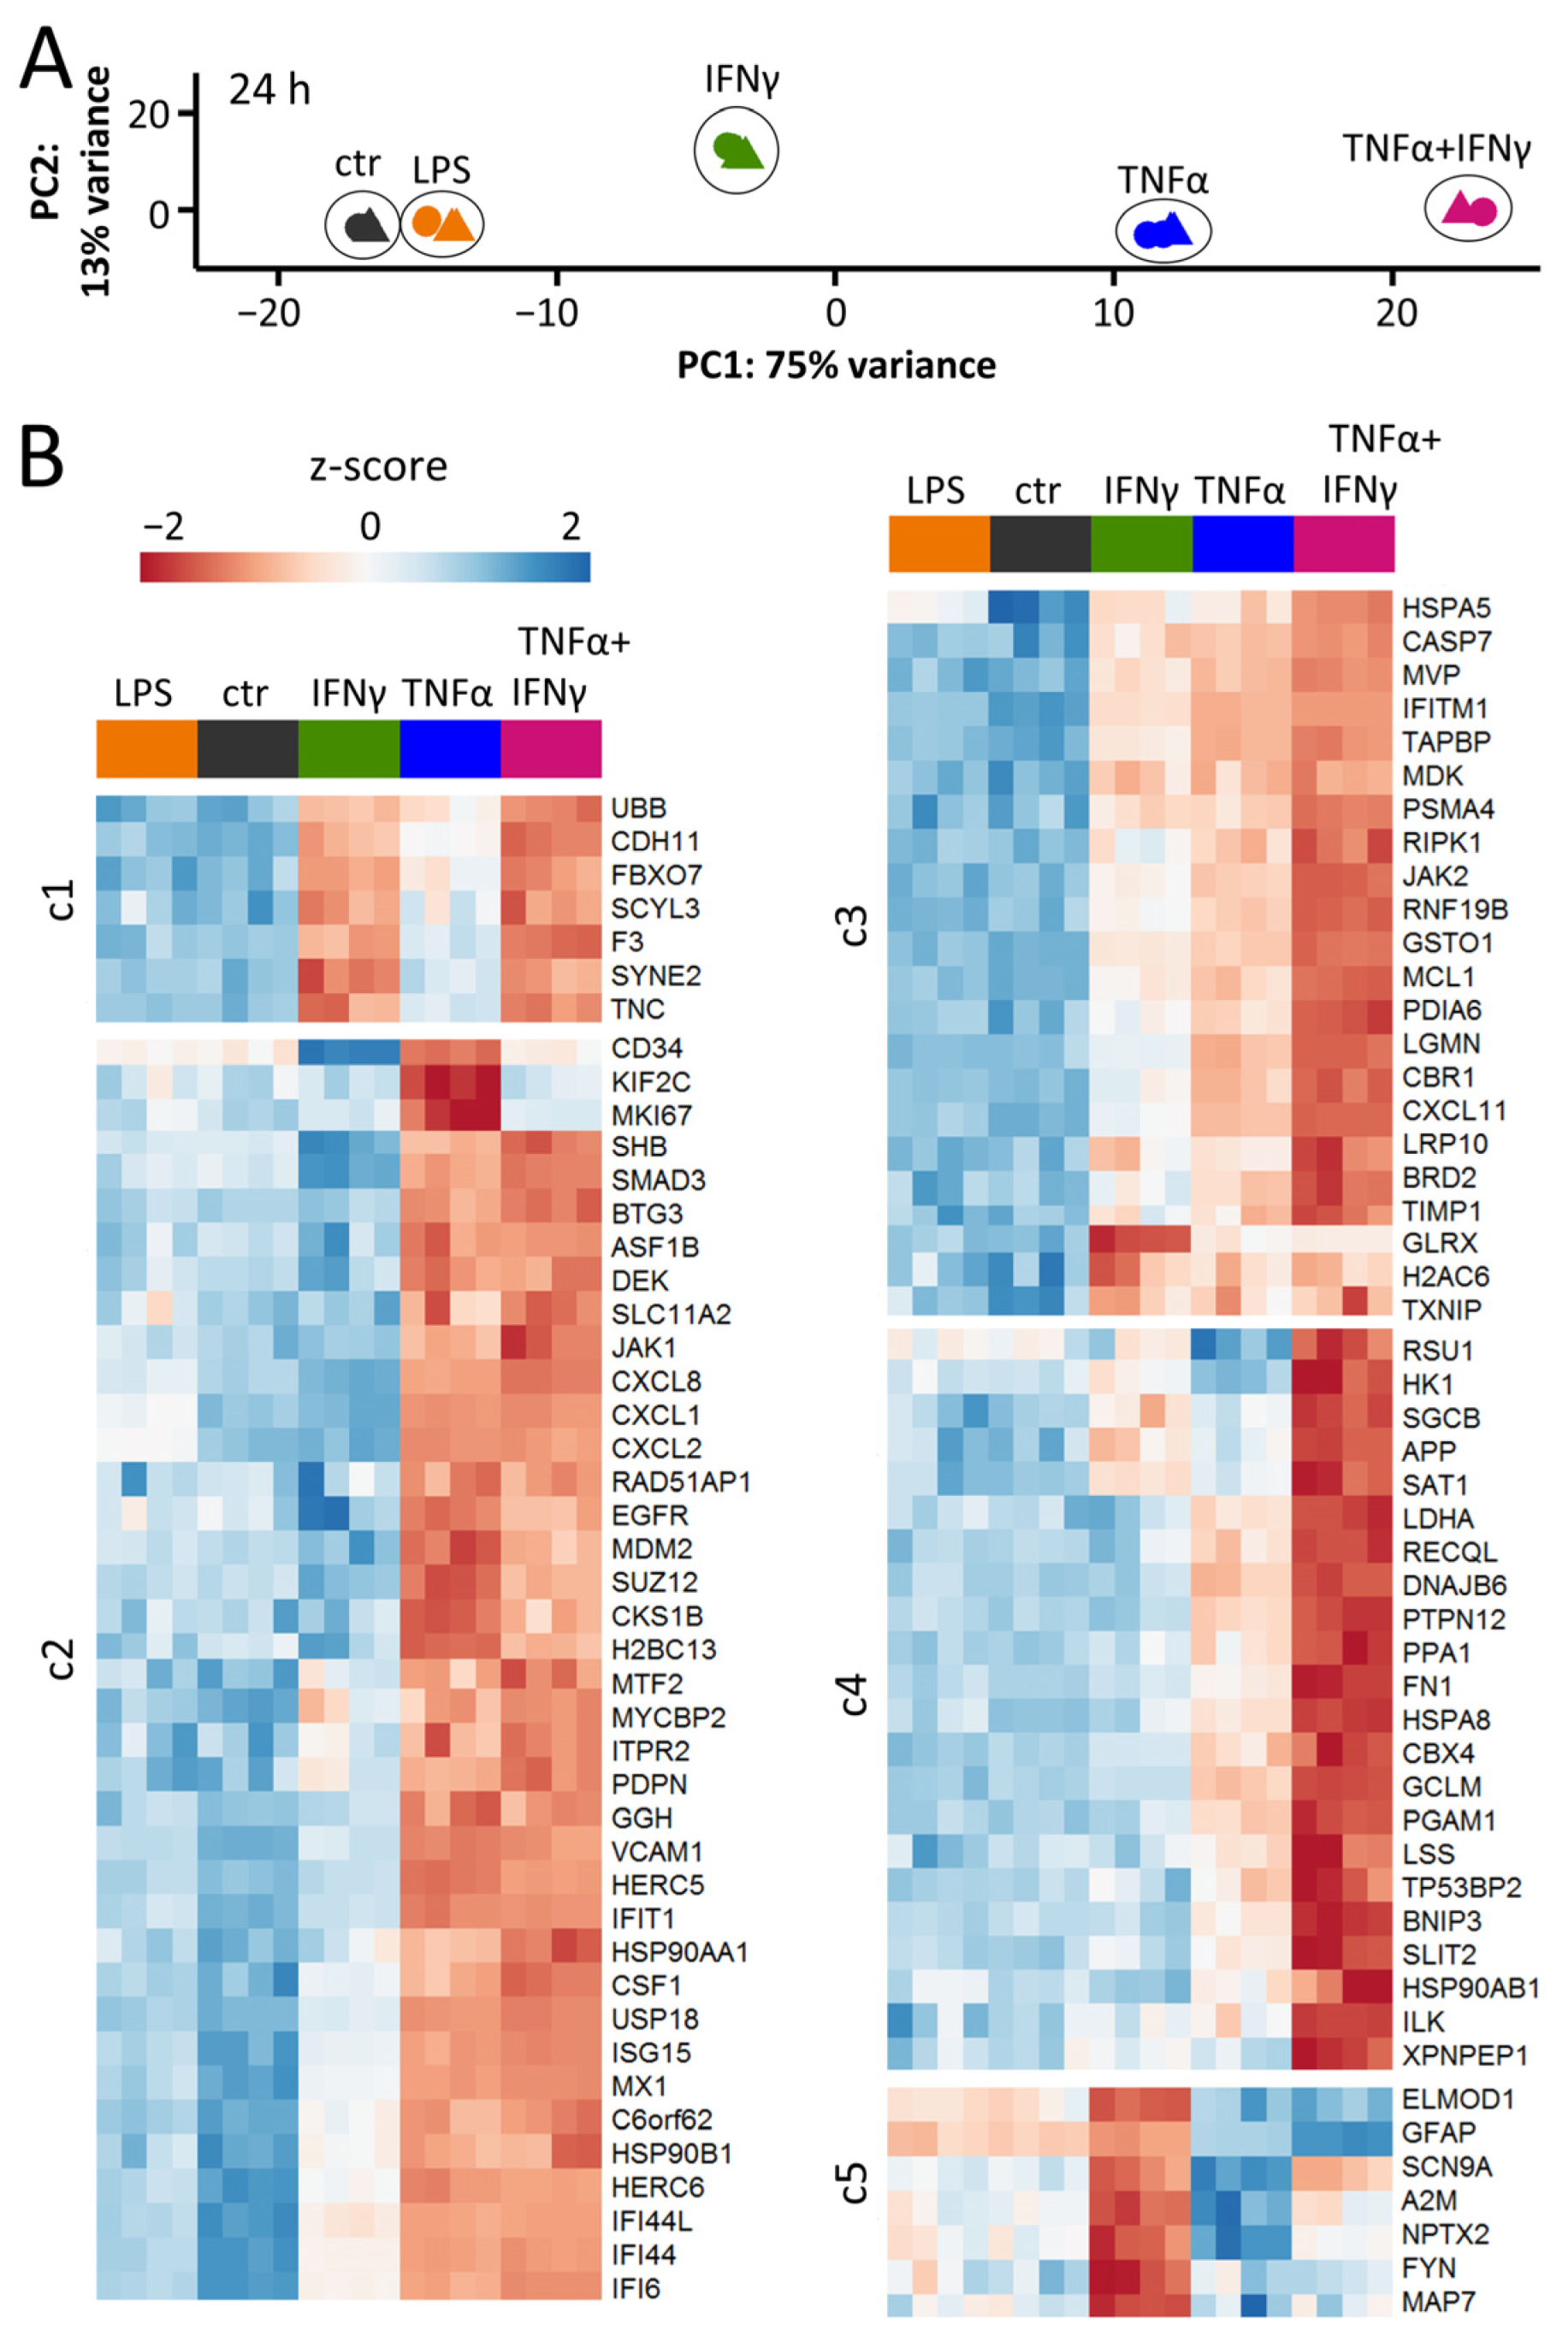
3.3. Distinct Patterns of Gene Expression after Exposure to Three Types of Inflammogens
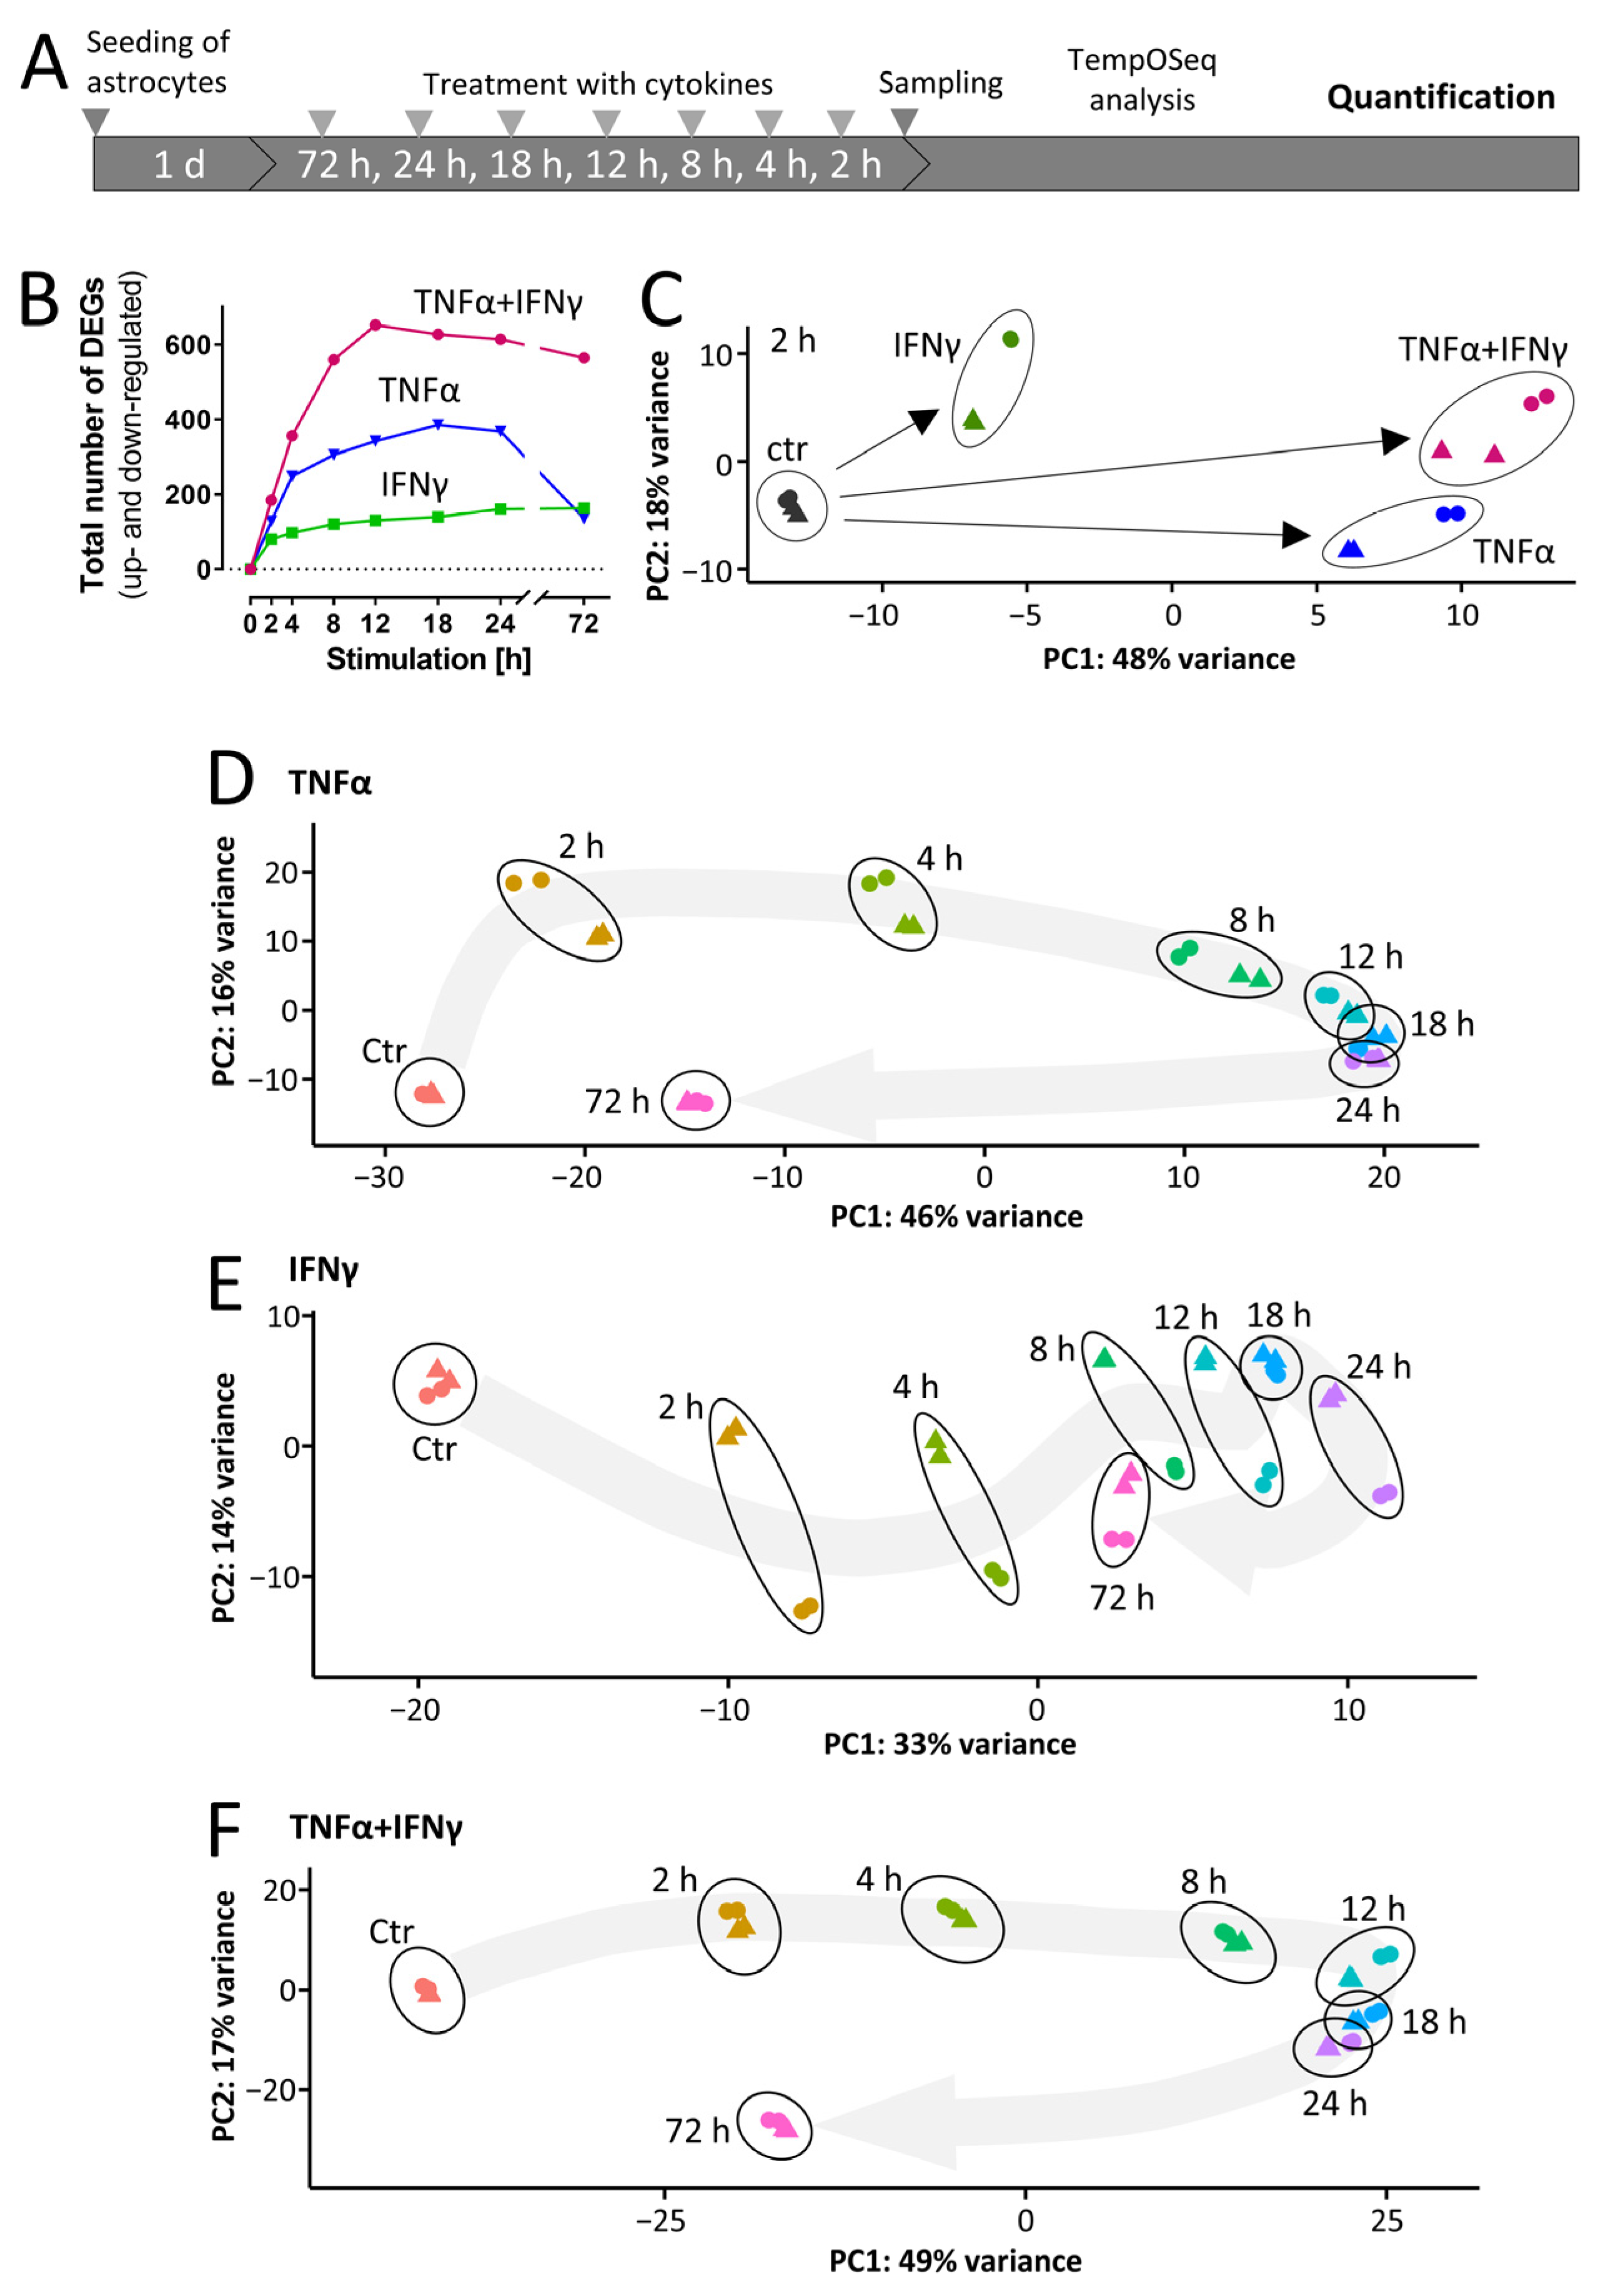
3.4. Rapid Cytokine-Induced Gene Expression Changes in ACs
3.5. Overall Dynamics of Transcriptome Changes
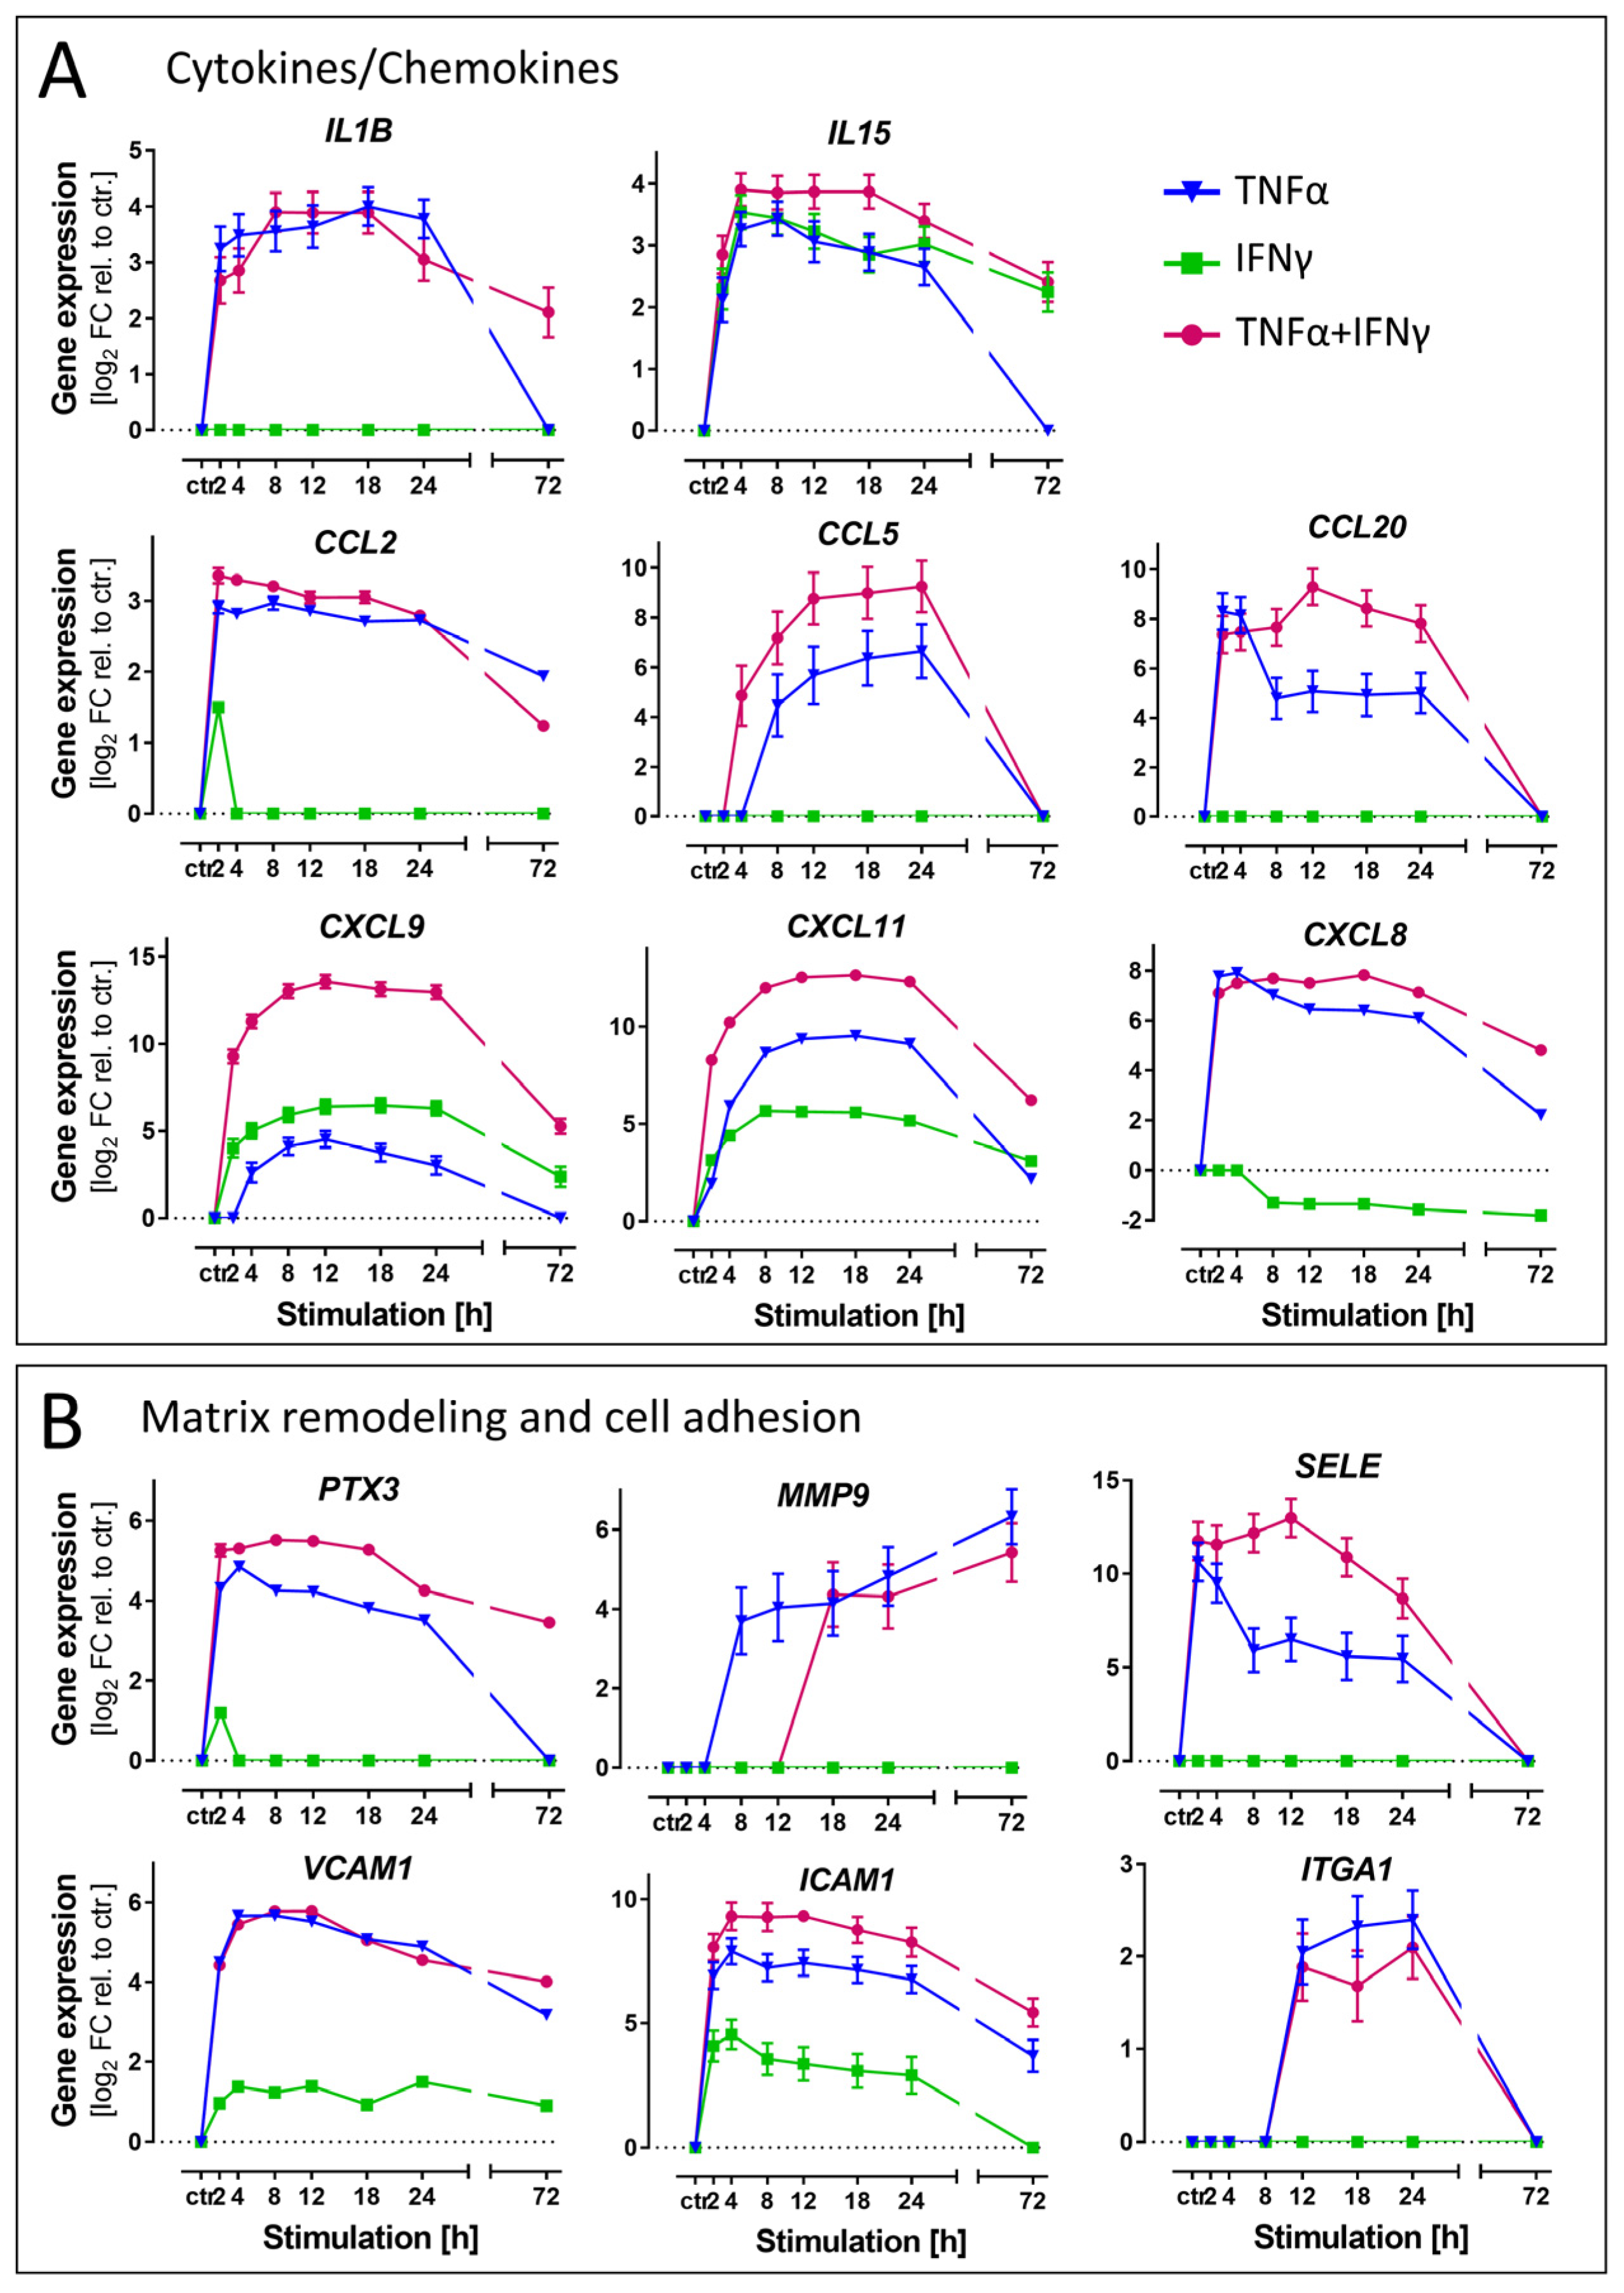
3.6. Differential Regulation of Exemplary Genes Coding for Inflammation Markers
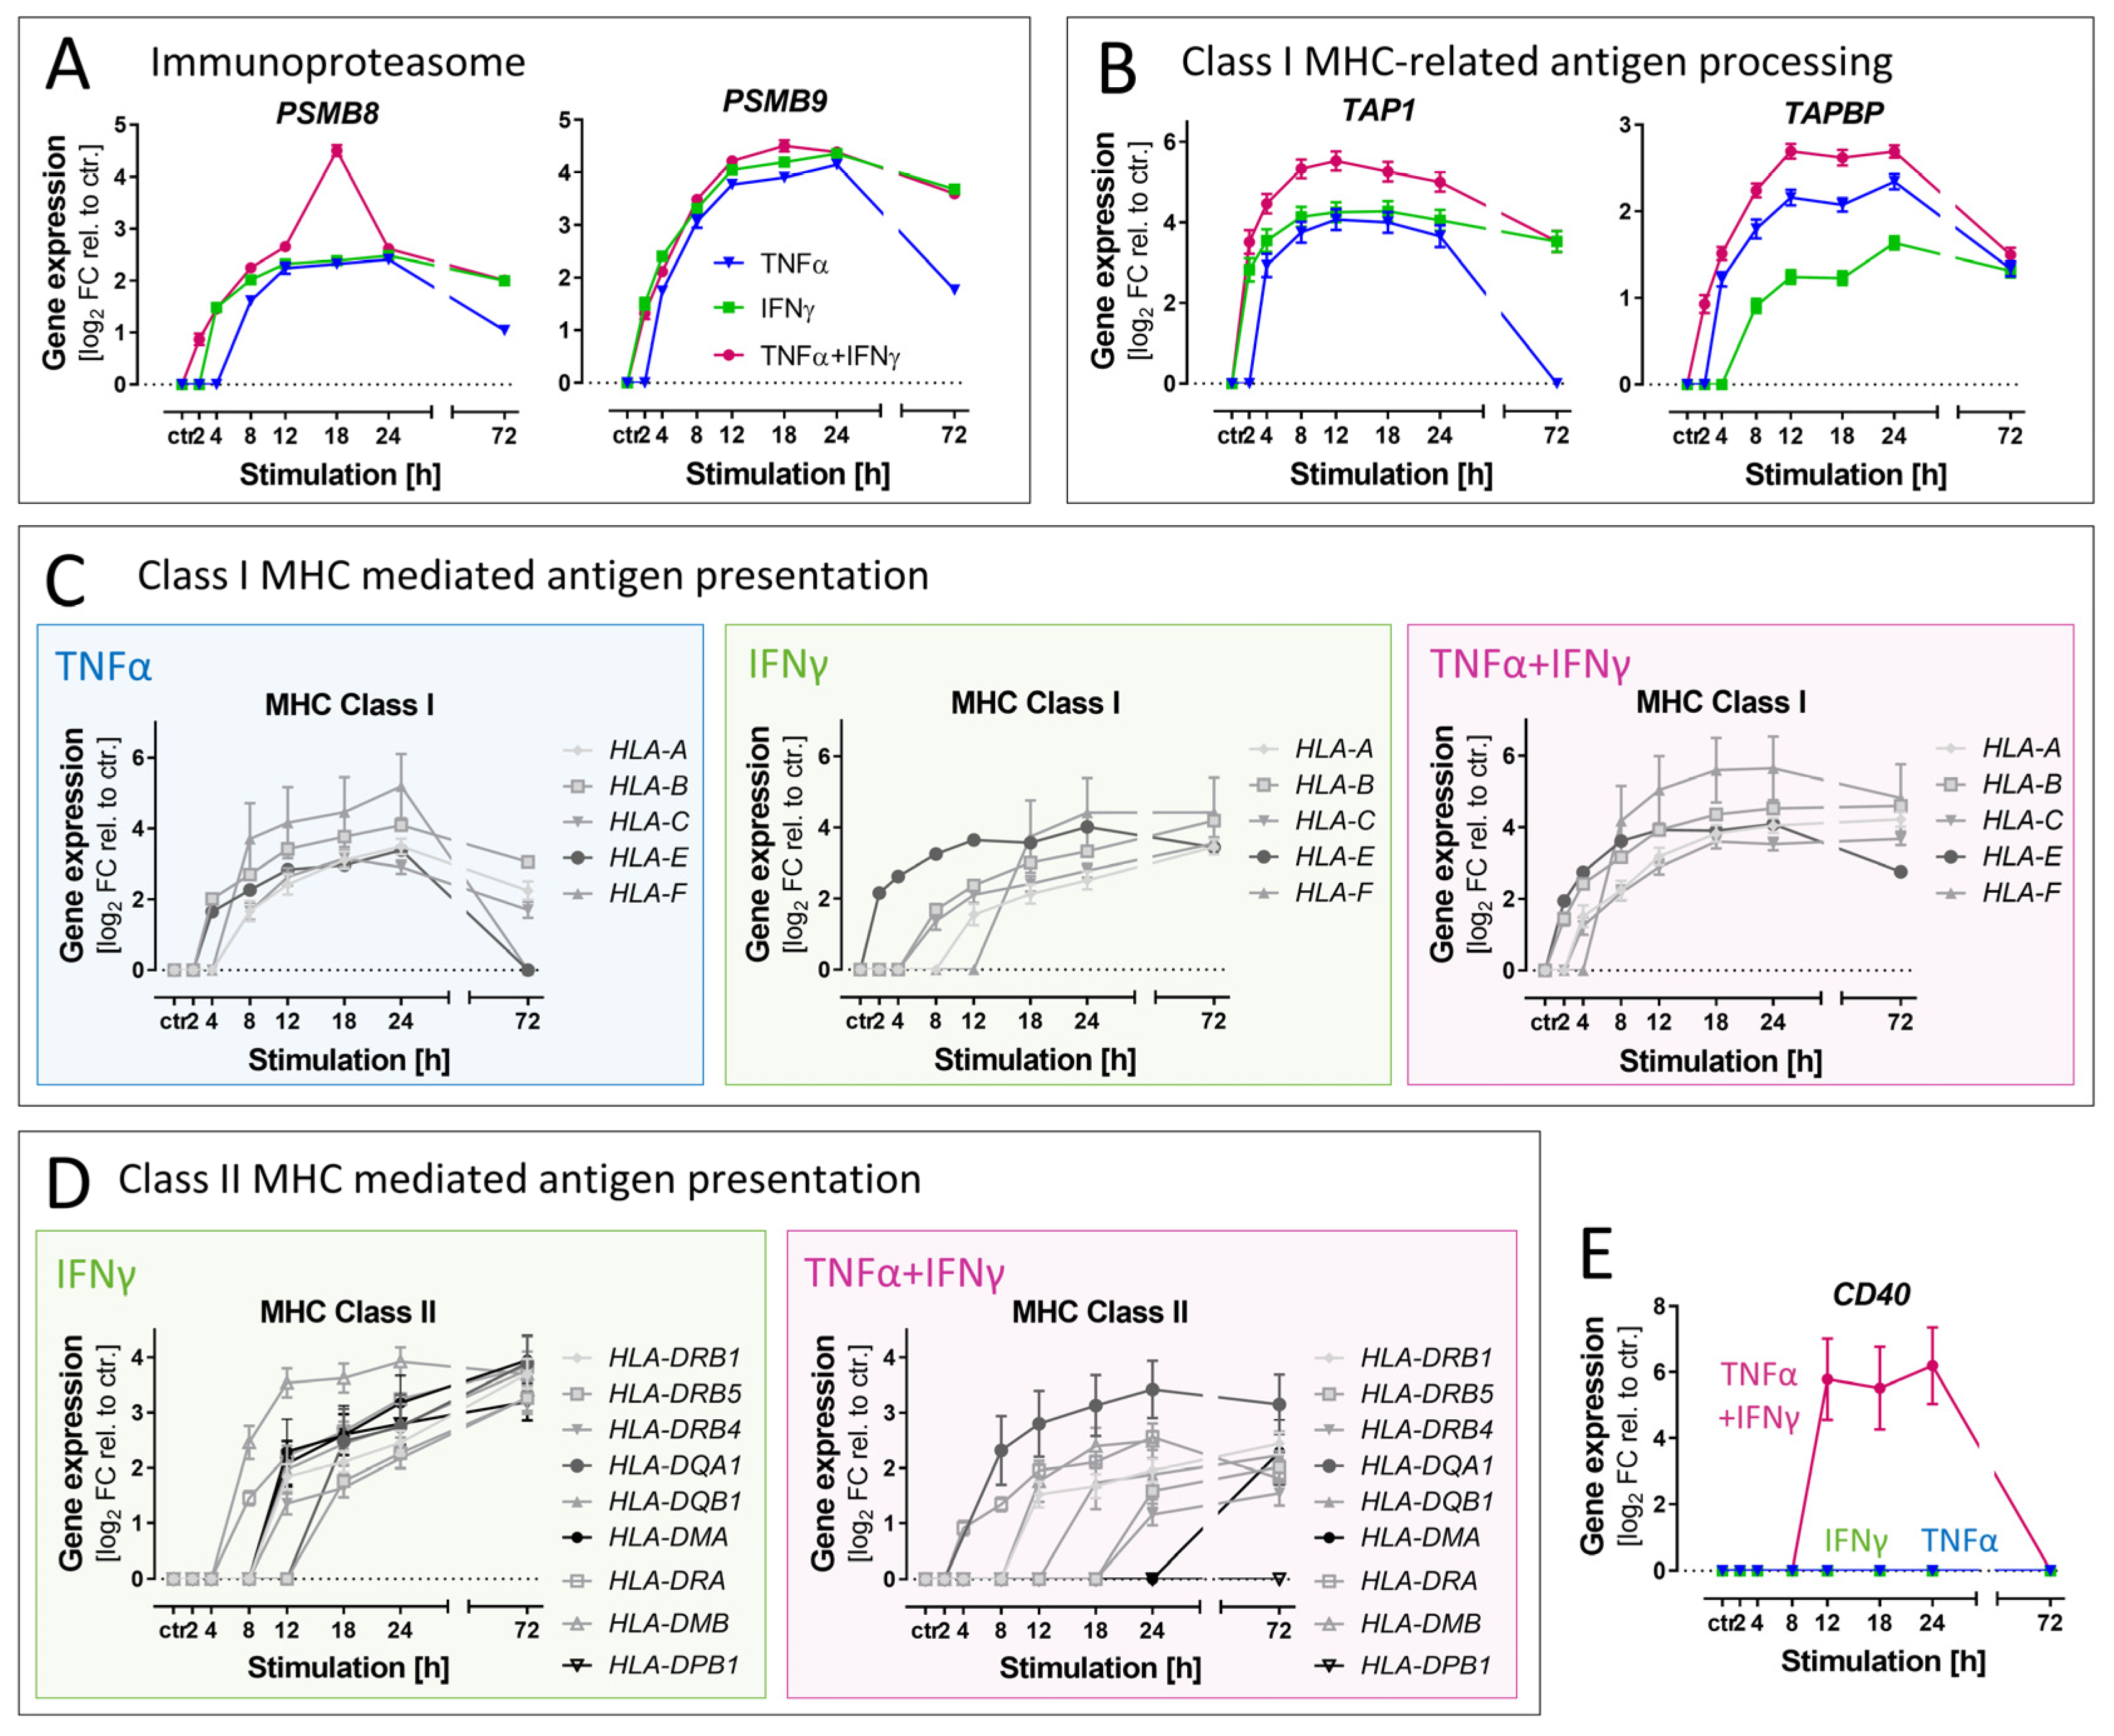
3.7. Differential Effects of Cytokines on Genes Related to Antigen Presentation
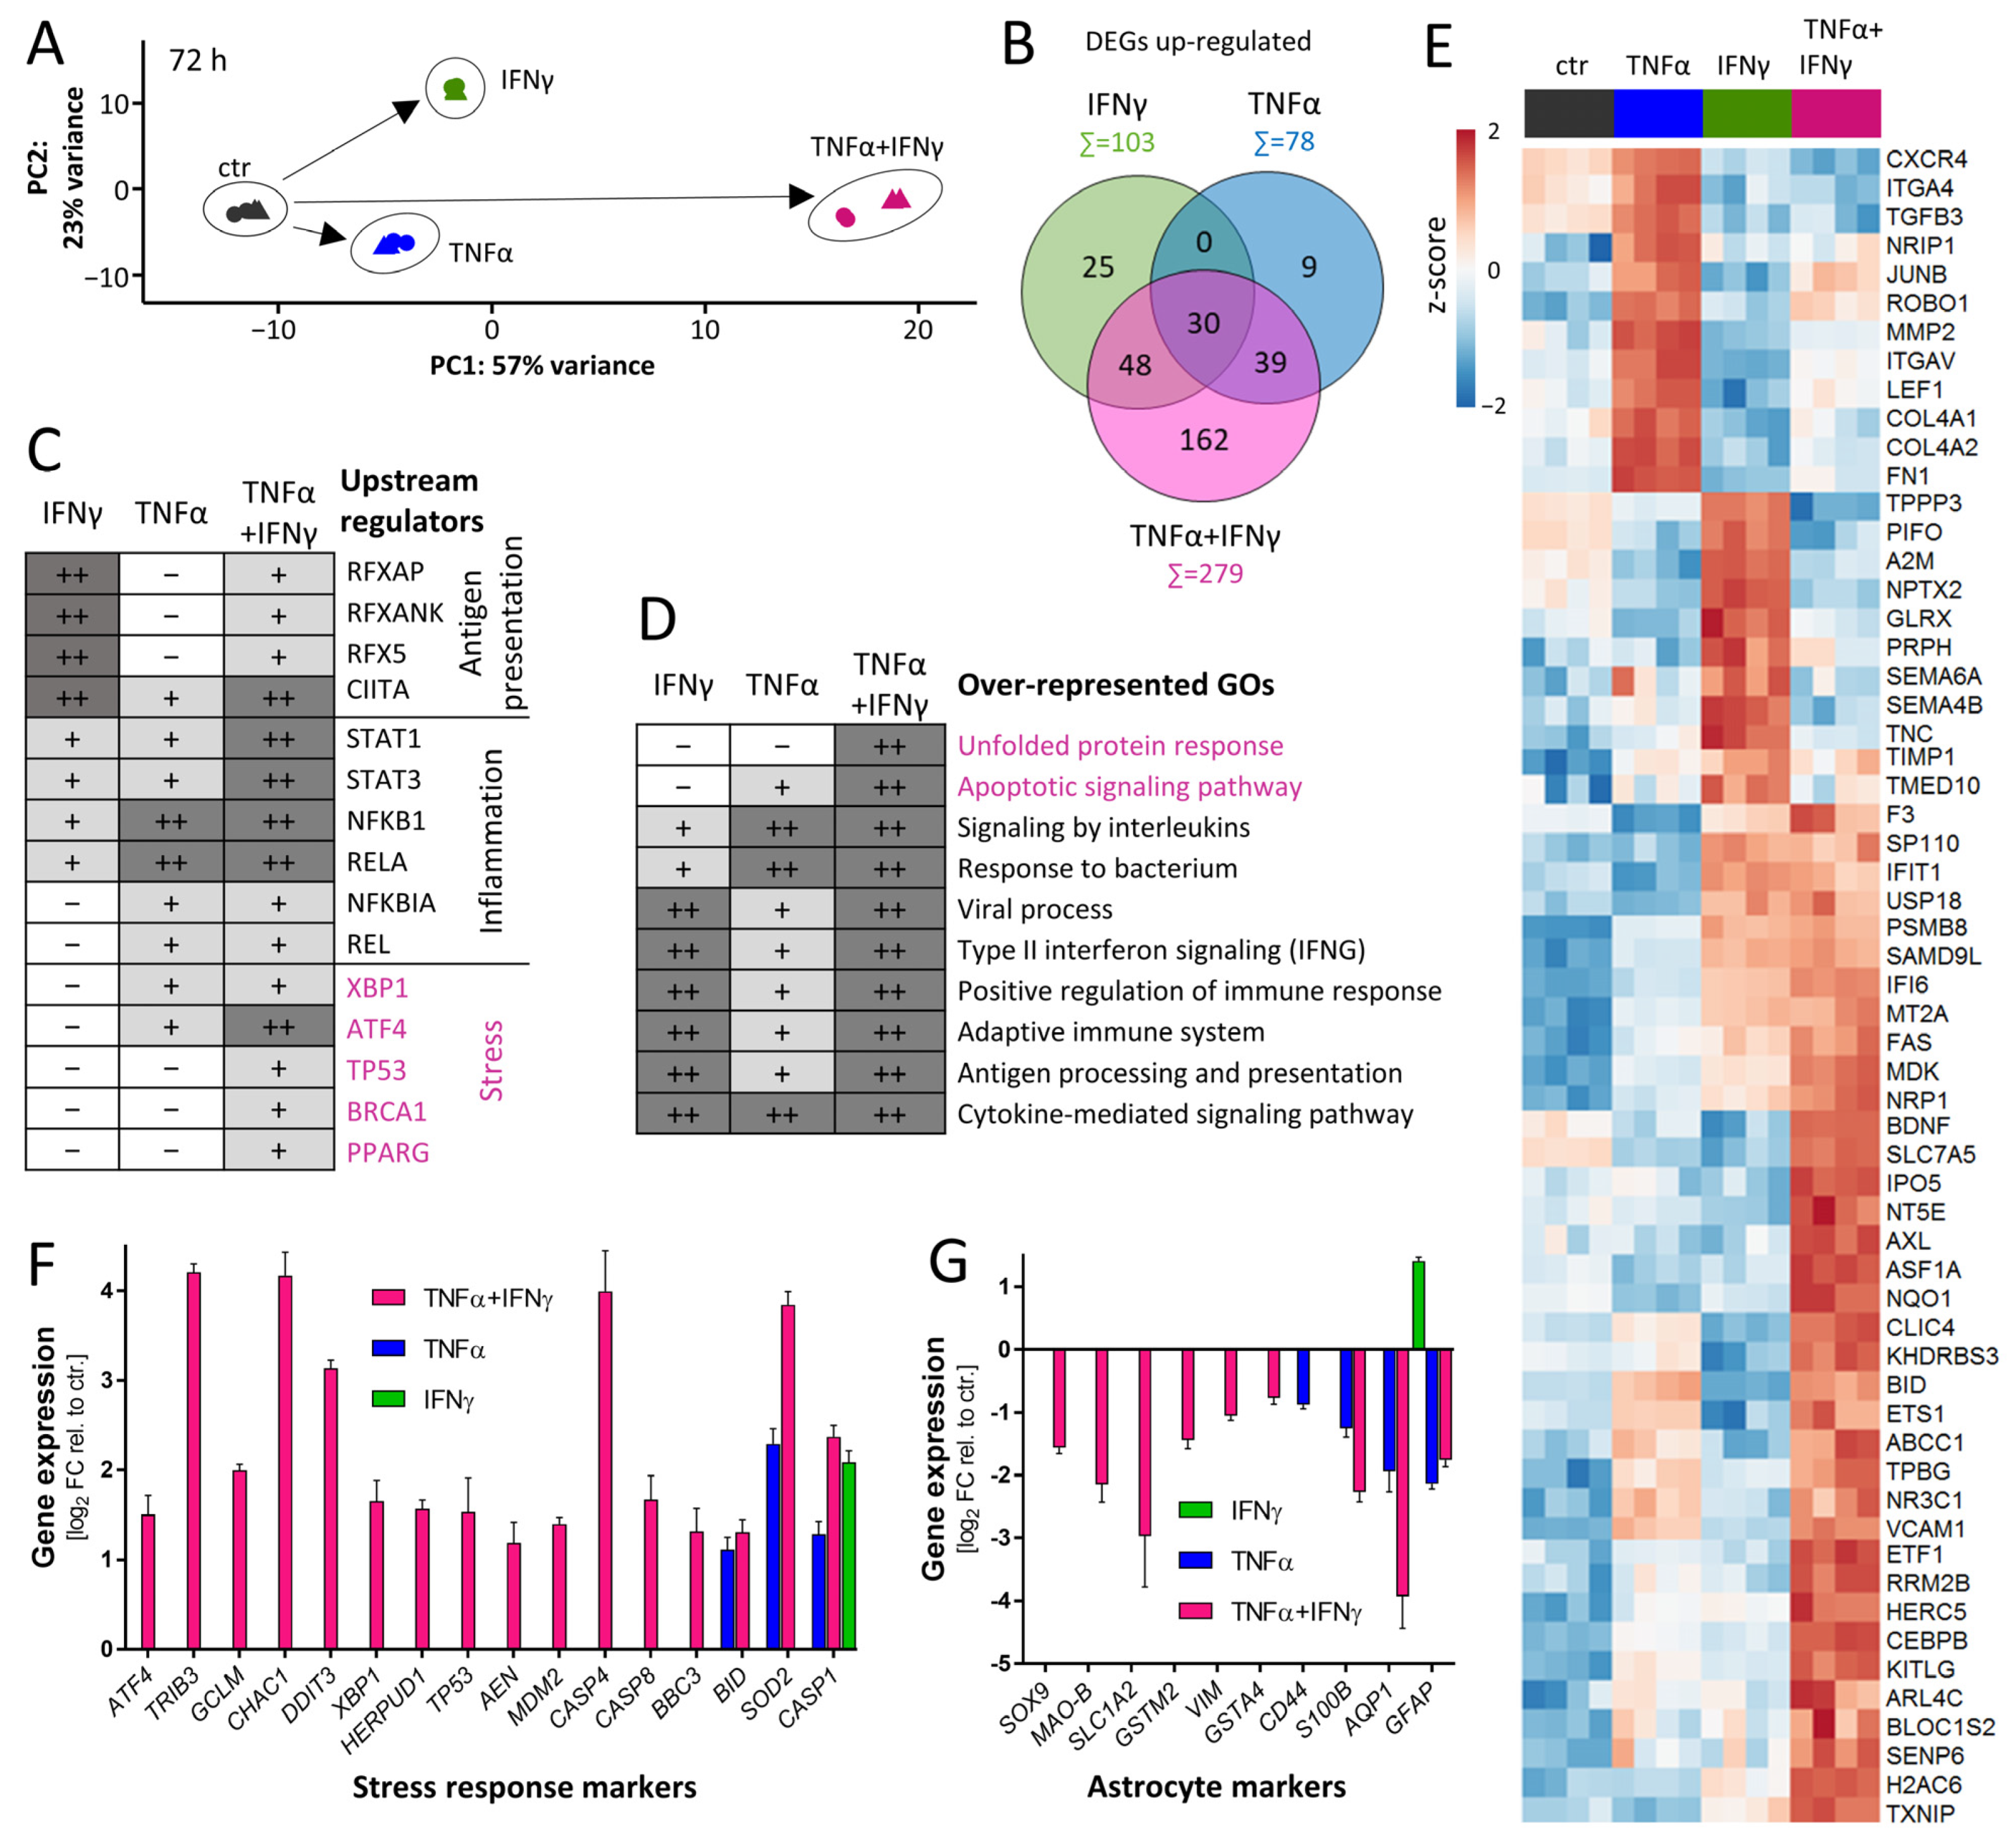
3.8. Characterization of Response Features of ACs after Prolonged Cytokine Exposure
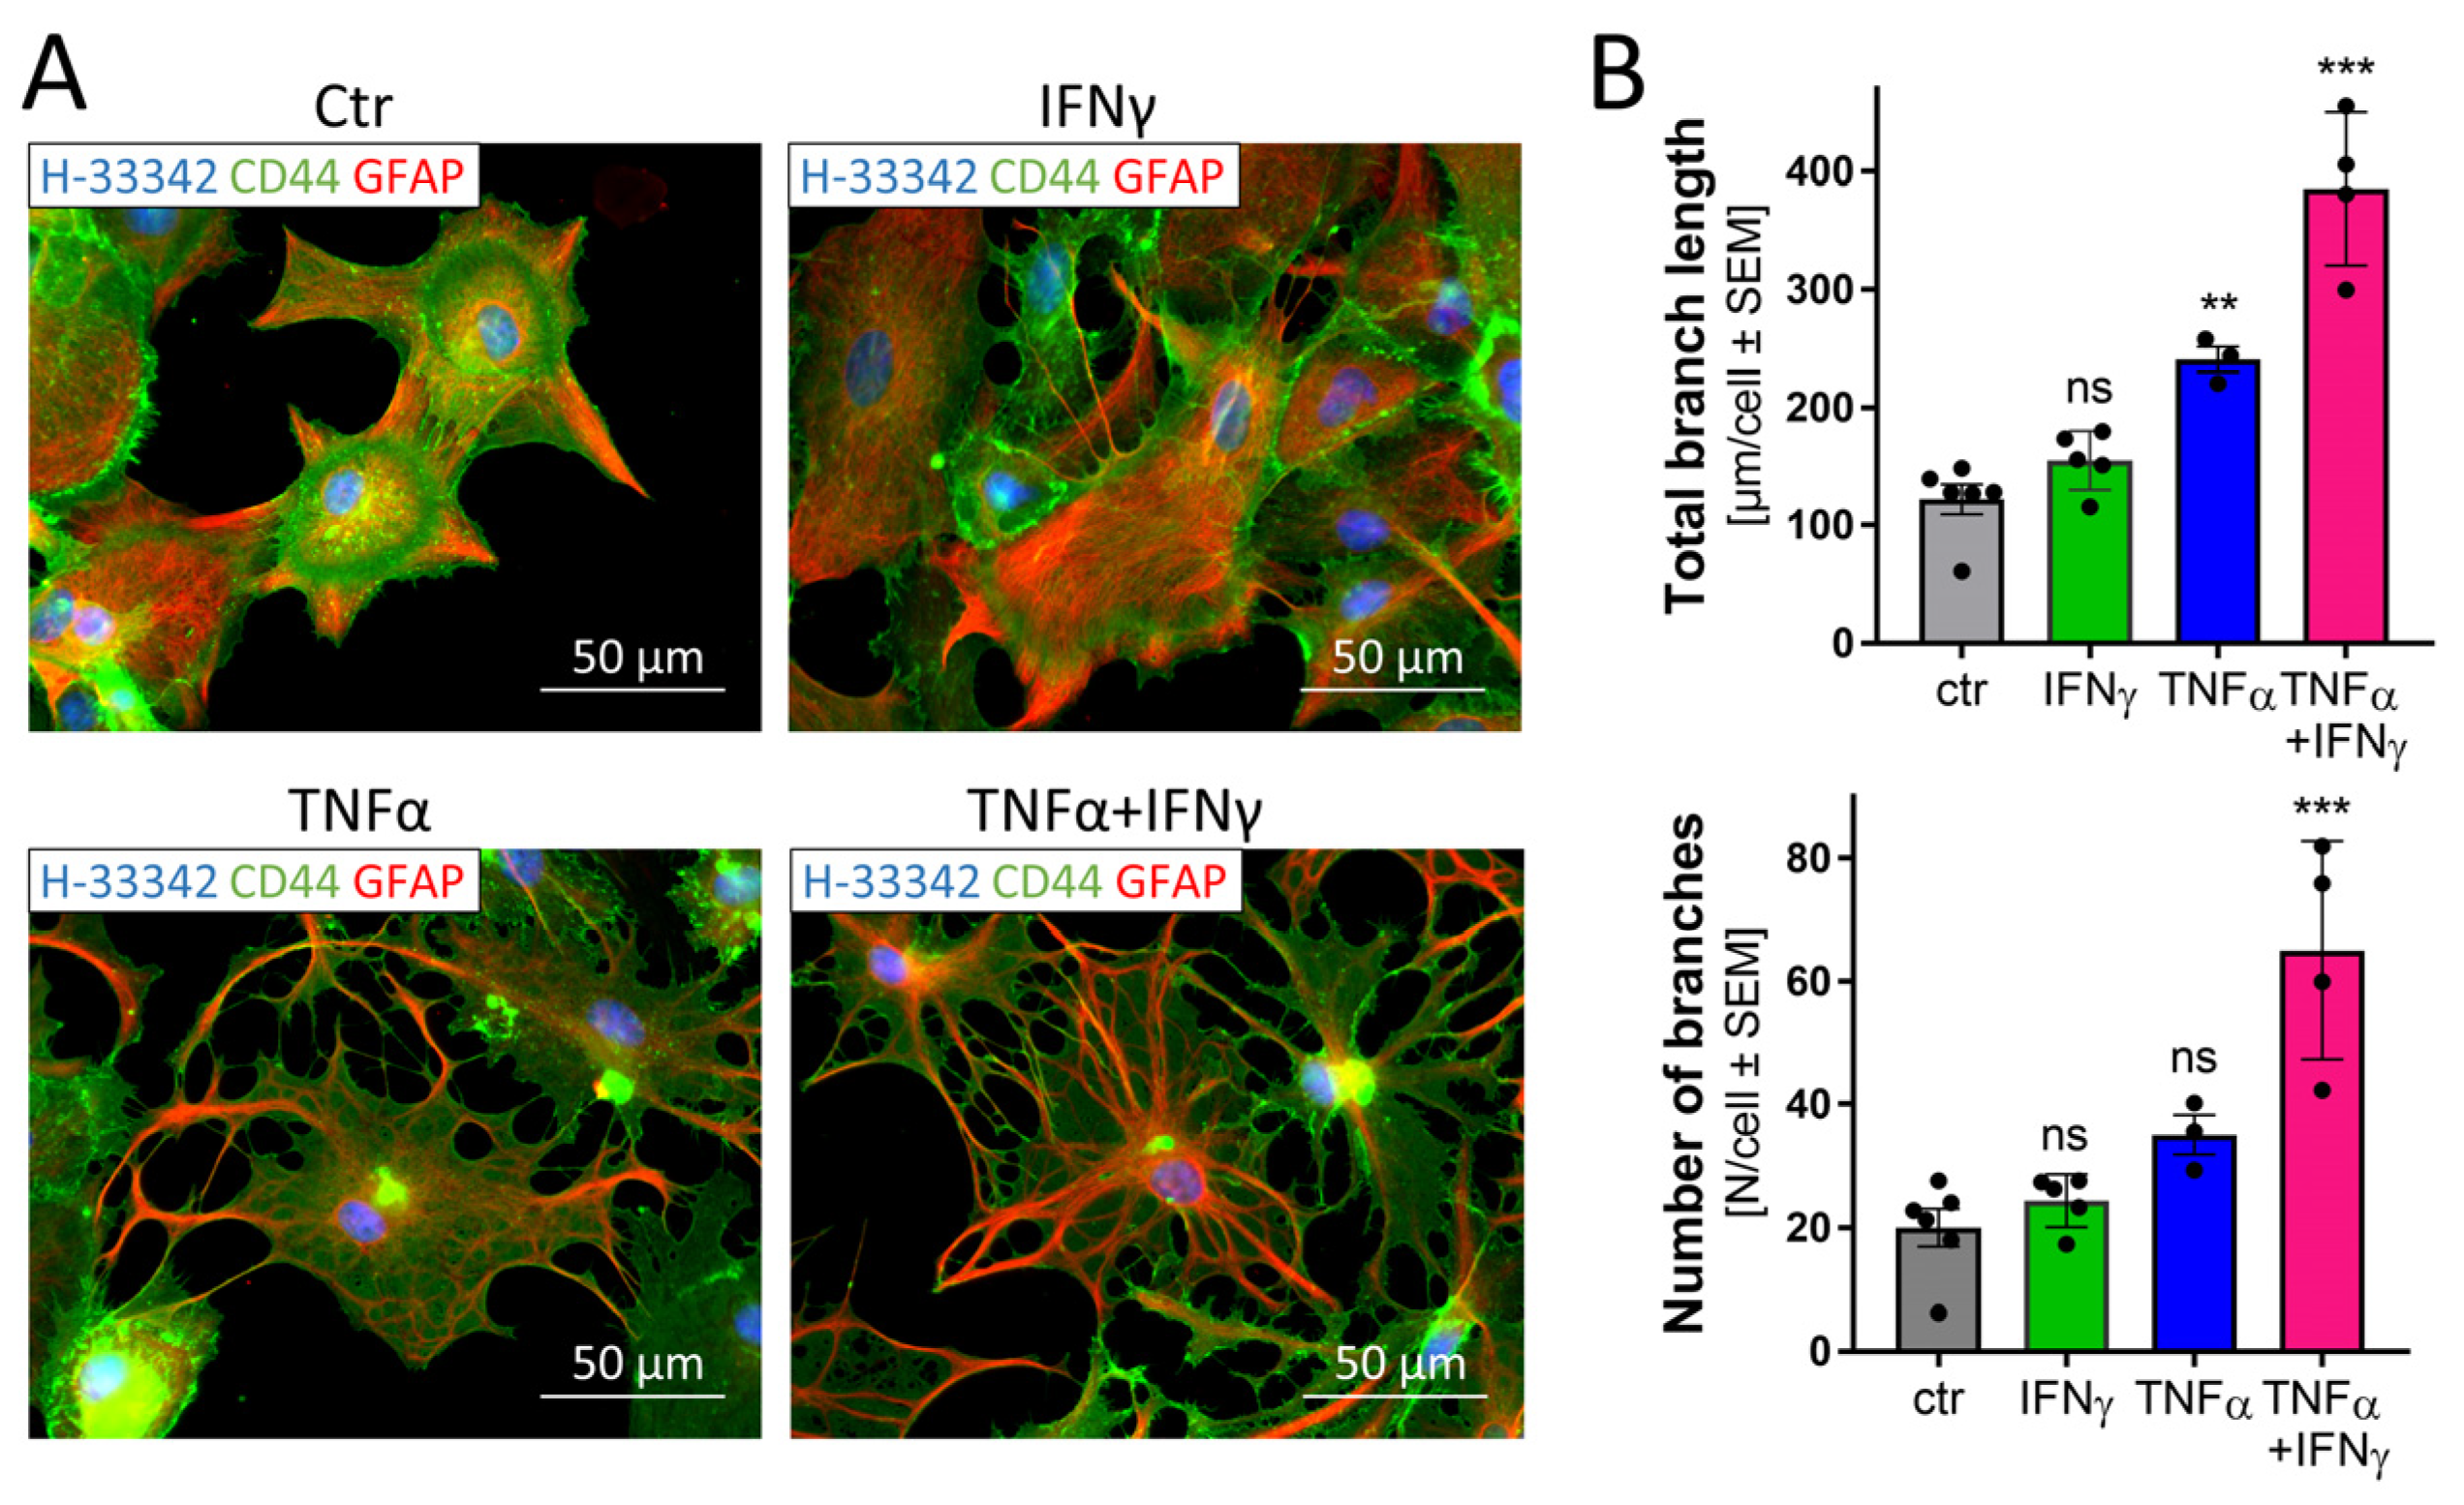
3.9. Morphological Changes in Astrocytes Triggered by Inflammatory Stimuli
4. Discussion
Supplementary Materials
Author Contributions
Funding
Institutional Review Board Statement
Informed Consent Statement
Data Availability Statement
Acknowledgments
Conflicts of Interest
References
- Sofroniew, M.V.; Vinters, H.V. Astrocytes: Biology and pathology. Acta Neuropathol. 2010, 119, 7–35. [Google Scholar] [CrossRef] [PubMed]
- Sofroniew, M.V. Astrocyte Reactivity: Subtypes, States, and Functions in CNS Innate Immunity. Trends Immunol. 2020, 41, 758–770. [Google Scholar] [CrossRef] [PubMed]
- Pekny, M.; Pekna, M.; Messing, A.; Steinhäuser, C.; Lee, J.-M.; Parpura, V.; Hol, E.M.; Sofroniew, M.V.; Verkhratsky, A. Astrocytes: A central element in neurological diseases. Acta Neuropathol. 2016, 131, 323–345. [Google Scholar] [CrossRef]
- Falsig, J.; van Beek, J.; Hermann, C.; Leist, M. Molecular basis for detection of invading pathogens in the brain. J. Neurosci. Res. 2008, 86, 1434–1447. [Google Scholar] [CrossRef] [PubMed]
- Henn, A.; Kirner, S.; Leist, M. TLR2 Hypersensitivity of Astrocytes as Functional Consequence of Previous Inflammatory Episodes. J. Immunol. 2011, 186, 3237. [Google Scholar] [CrossRef] [PubMed]
- Falsig, J.; Latta, M.; Leist, M. Defined inflammatory states in astrocyte cultures: Correlation with susceptibility towards CD95-driven apoptosis. J. Neurochem. 2004, 88, 181–193. [Google Scholar] [CrossRef] [PubMed]
- Sola, C.; Casal, C.; Tusell, J.M.; Serratosa, J. Astrocytes enhance lipopolysaccharide-induced nitric oxide production by microglial cells. Eur. J. Neurosci. 2002, 16, 1275–1283. [Google Scholar] [CrossRef]
- Dringen, R.; Hamprecht, B. Differences in glycogen metabolism in astroglia-rich primary cultures and sorbitol-selected astroglial cultures derived from mouse brain. Glia 1993, 8, 143–149. [Google Scholar] [CrossRef]
- Crang, A.J.; Blakemore, W.F. Attempts to produce astrocyte cultures devoid of oligodendrocyte generating potential by the use of antimitotic treatment reveal the presence of quiescent oligodendrocyte precursors. J. Neurosci. Res. 1997, 49, 64–71. [Google Scholar] [CrossRef]
- Brown, D.R. A method for long term culture of murine type 2 astrocytes. J. Neurosci. Methods 1998, 79, 161–167. [Google Scholar] [CrossRef]
- Foo, L.C.; Allen, N.J.; Bushong, E.A.; Ventura, P.B.; Chung, W.S.; Zhou, L.; Cahoy, J.D.; Daneman, R.; Zong, H.; Ellisman, M.H.; et al. Development of a method for the purification and culture of rodent astrocytes. Neuron 2011, 71, 799–811. [Google Scholar] [CrossRef] [PubMed]
- Kleiderman, S.; Sa, J.V.; Teixeira, A.P.; Brito, C.; Gutbier, S.; Evje, L.G.; Hadera, M.G.; Glaab, E.; Henry, M.; Sachinidis, A.; et al. Functional and phenotypic differences of pure populations of stem cell-derived astrocytes and neuronal precursor cells. Glia 2016, 64, 695–715. [Google Scholar] [CrossRef] [PubMed]
- Oberheim, N.A.; Takano, T.; Han, X.; He, W.; Lin, J.H.C.; Wang, F.; Xu, Q.; Wyatt, J.D.; Pilcher, W.; Ojemann, J.G.; et al. Uniquely Hominid Features of Adult Human Astrocytes. J. Neurosci. 2009, 29, 3276–3287. [Google Scholar] [CrossRef] [PubMed]
- Zhang, Y.; Sloan, S.A.; Clarke, L.E.; Caneda, C.; Plaza, C.A.; Blumenthal, P.D.; Vogel, H.; Steinberg, G.K.; Edwards, M.S.; Li, G.; et al. Purification and Characterization of Progenitor and Mature Human Astrocytes Reveals Transcriptional and Functional Differences with Mouse. Neuron 2016, 89, 37–53. [Google Scholar] [CrossRef]
- Li, J.; Pan, L.; Pembroke, W.G.; Rexach, J.E.; Godoy, M.I.; Condro, M.C.; Alvarado, A.G.; Harteni, M.; Chen, Y.W.; Stiles, L.; et al. Conservation and divergence of vulnerability and responses to stressors between human and mouse astrocytes. Nat. Commun. 2021, 12, 3958. [Google Scholar] [CrossRef]
- Tarassishin, L.; Suh, H.S.; Lee, S.C. LPS and IL-1 differentially activate mouse and human astrocytes: Role of CD14. Glia 2014, 62, 999–1013. [Google Scholar] [CrossRef] [PubMed]
- Freeman, M.R.; Rowitch, D.H. Evolving concepts of gliogenesis: A look way back and ahead to the next 25 years. Neuron 2013, 80, 613–623. [Google Scholar] [CrossRef]
- Han, X.; Chen, M.; Wang, F.; Windrem, M.; Wang, S.; Shanz, S.; Xu, Q.; Oberheim, N.A.; Bekar, L.; Betstadt, S.; et al. Forebrain Engraftment by Human Glial Progenitor Cells Enhances Synaptic Plasticity and Learning in Adult Mice. Cell Stem Cell 2013, 12, 342–353. [Google Scholar] [CrossRef]
- Croitoru-Lamoury, J.; Guillemin, G.J.; Boussin, F.D.; Mognetti, B.; Gigout, L.I.; Chéret, A.; Vaslin, B.; Le Grand, R.; Brew, B.J.; Dormont, D. Expression of chemokines and their receptors in human and simian astrocytes: Evidence for a central role of TNFα and IFNγ in CXCR4 and CCR5 modulation. Glia 2003, 41, 354–370. [Google Scholar] [CrossRef]
- Meeuwsen, S.; Persoon-Deen, C.; Bsibsi, M.; Ravid, R.; van Noort, J.M. Cytokine, chemokine and growth factor gene profiling of cultured human astrocytes after exposure to proinflammatory stimuli. Glia 2003, 43, 243–253. [Google Scholar] [CrossRef]
- Choi, S.S.; Lee, H.J.; Lim, I.; Satoh, J.; Kim, S.U. Human astrocytes: Secretome profiles of cytokines and chemokines. PLoS ONE 2014, 9, e92325. [Google Scholar] [CrossRef]
- Simmnacher, K.; Krach, F.; Schneider, Y.; Alecu, J.E.; Mautner, L.; Klein, P.; Roybon, L.; Prots, I.; Xiang, W.; Winner, B. Unique signatures of stress-induced senescent human astrocytes. Exp. Neurol. 2020, 334, 113466. [Google Scholar] [CrossRef] [PubMed]
- Chandrasekaran, A.; Avci, H.X.; Leist, M.; Kobolak, J.; Dinnyes, A. Astrocyte Differentiation of Human Pluripotent Stem Cells: New Tools for Neurological Disorder Research. Front. Cell. Neurosci. 2016, 10, 215. [Google Scholar] [CrossRef] [PubMed]
- Krencik, R.; Zhang, S.C. Directed differentiation of functional astroglial subtypes from human pluripotent stem cells. Nat. Protoc. 2011, 6, 1710–1717. [Google Scholar] [CrossRef] [PubMed]
- Roybon, L.; Lamas, N.J.; Garcia, A.D.; Yang, E.J.; Sattler, R.; Lewis, V.J.; Kim, Y.A.; Kachel, C.A.; Rothstein, J.D.; Przedborski, S.; et al. Human stem cell-derived spinal cord astrocytes with defined mature or reactive phenotypes. Cell Rep. 2013, 4, 1035–1048. [Google Scholar] [CrossRef]
- Santos, R.; Vadodaria, K.C.; Jaeger, B.N.; Mei, A.; Lefcochilos-Fogelquist, S.; Mendes, A.P.D.; Erikson, G.; Shokhirev, M.; Randolph-Moore, L.; Fredlender, C.; et al. Differentiation of Inflammation-Responsive Astrocytes from Glial Progenitors Generated from Human Induced Pluripotent Stem Cells. Stem Cell Rep. 2017, 8, 1757–1769. [Google Scholar] [CrossRef]
- Tcw, J.; Wang, M.; Pimenova, A.A.; Bowles, K.R.; Hartley, B.J.; Lacin, E.; Machlovi, S.I.; Abdelaal, R.; Karch, C.M.; Phatnani, H.; et al. An Efficient Platform for Astrocyte Differentiation from Human Induced Pluripotent Stem Cells. Stem Cell Rep. 2017, 9, 600–614. [Google Scholar] [CrossRef]
- Lundin, A.; Delsing, L.; Clausen, M.; Ricchiuto, P.; Sanchez, J.; Sabirsh, A.; Ding, M.; Synnergren, J.; Zetterberg, H.; Brolen, G.; et al. Human iPS-Derived Astroglia from a Stable Neural Precursor State Show Improved Functionality Compared with Conventional Astrocytic Models. Stem Cell Rep. 2018, 10, 1030–1045. [Google Scholar] [CrossRef]
- Zhou, Q.; Viollet, C.; Efthymiou, A.; Khayrullina, G.; Moritz, K.E.; Wilkerson, M.D.; Sukumar, G.; Dalgard, C.L.; Doughty, M.L. Neuroinflammatory astrocytes generated from cord blood-derived human induced pluripotent stem cells. J. Neuroinflamm. 2019, 16, 164. [Google Scholar] [CrossRef]
- Barbar, L.; Jain, T.; Zimmer, M.; Kruglikov, I.; Sadick, J.S.; Wang, M.; Kalpana, K.; Rose, I.V.L.; Burstein, S.R.; Rusielewicz, T.; et al. CD49f Is a Novel Marker of Functional and Reactive Human iPSC-Derived Astrocytes. Neuron 2020, 107, 436–453.e12. [Google Scholar] [CrossRef]
- Labib, D.; Wang, Z.; Prakash, P.; Zimmer, M.; Smith, M.D.; Frazel, P.W.; Barbar, L.; Sapar, M.L.; Calabresi, P.A.; Peng, J.; et al. Proteomic Alterations and Novel Markers of Neurotoxic Reactive Astrocytes in Human Induced Pluripotent Stem Cell Models. Front. Mol. Neurosci. 2022, 15, 870085. [Google Scholar] [CrossRef]
- Russ, K.; Teku, G.; Bousset, L.; Redeker, V.; Piel, S.; Savchenko, E.; Pomeshchik, Y.; Savistchenko, J.; Stummann, T.C.; Azevedo, C.; et al. TNF-alpha and alpha-synuclein fibrils differently regulate human astrocyte immune reactivity and impair mitochondrial respiration. Cell Rep. 2021, 34, 108895. [Google Scholar] [CrossRef]
- Liddelow, S.A.; Guttenplan, K.A.; Clarke, L.E.; Bennett, F.C.; Bohlen, C.J.; Schirmer, L.; Bennett, M.L.; Munch, A.E.; Chung, W.S.; Peterson, T.C.; et al. Neurotoxic reactive astrocytes are induced by activated microglia. Nature 2017, 541, 481–487. [Google Scholar] [CrossRef]
- Williams, M.E.; Stein, D.J.; Joska, J.A.; Naude, P.J.W. Cerebrospinal fluid immune markers and HIV-associated neurocognitive impairments: A systematic review. J. Neuroimmunol. 2021, 358, 577649. [Google Scholar] [CrossRef]
- Prasad, S.; Lokensgard, J.R. Brain-Resident T Cells Following Viral Infection. Viral Immunol. 2019, 32, 48–54. [Google Scholar] [CrossRef]
- Loimaranta, V.; Hepojoki, J.; Laaksoaho, O.; Pulliainen, A.T. Galectin-3-binding protein: A multitask glycoprotein with innate immunity functions in viral and bacterial infections. J. Leukoc. Biol. 2018, 104, 777–786. [Google Scholar] [CrossRef]
- Singhal, G.; Jaehne, E.J.; Corrigan, F.; Toben, C.; Baune, B.T. Inflammasomes in neuroinflammation and changes in brain function: A focused review. Front. Neurosci. 2014, 8, 315. [Google Scholar] [CrossRef]
- Hunt, N.H.; Ball, H.J.; Hansen, A.M.; Khaw, L.T.; Guo, J.; Bakmiwewa, S.; Mitchell, A.J.; Combes, V.; Grau, G.E. Cerebral malaria: Gamma-interferon redux. Front. Cell. Infect. Microbiol. 2014, 4, 113. [Google Scholar] [CrossRef]
- Suzuki, Y.; Sa, Q.; Gehman, M.; Ochiai, E. Interferon-gamma- and perforin-mediated immune responses for resistance against Toxoplasma gondii in the brain. Expert. Rev. Mol. Med. 2011, 13, e31. [Google Scholar] [CrossRef]
- Smith, B.C.; Sinyuk, M.; Jenkins, J.E.; Psenicka, M.W.; Williams, J.L. The impact of regional astrocyte interferon-γ signaling during chronic autoimmunity: A novel role for the immunoproteasome. J. Neuroinflamm. 2020, 17, 184. [Google Scholar] [CrossRef]
- Dunleavy, C.; Elsworthy, R.J.; Upthegrove, R.; Wood, S.J.; Aldred, S. Inflammation in first-episode psychosis: The contribution of inflammatory biomarkers to the emergence of negative symptoms, a systematic review and meta-analysis. Acta Psychiatr. Scand. 2022, 146, 6–20. [Google Scholar] [CrossRef]
- Lesh, T.A.; Careaga, M.; Rose, D.R.; McAllister, A.K.; Van de Water, J.; Carter, C.S.; Ashwood, P. Cytokine alterations in first-episode schizophrenia and bipolar disorder: Relationships to brain structure and symptoms. J. Neuroinflamm. 2018, 15, 165. [Google Scholar] [CrossRef]
- Momtazmanesh, S.; Zare-Shahabadi, A.; Rezaei, N. Cytokine Alterations in Schizophrenia: An Updated Review. Front. Psychiatry 2019, 10, 892. [Google Scholar] [CrossRef]
- De Oliveira Figueiredo, E.C.; Cali, C.; Petrelli, F.; Bezzi, P. Emerging evidence for astrocyte dysfunction in schizophrenia. Glia 2022, 70, 1585–1604. [Google Scholar] [CrossRef]
- Kvestak, D.; Juranic Lisnic, V.; Lisnic, B.; Tomac, J.; Golemac, M.; Brizic, I.; Indenbirken, D.; Cokaric Brdovcak, M.; Bernardini, G.; Krstanovic, F.; et al. NK/ILC1 cells mediate neuroinflammation and brain pathology following congenital CMV infection. J. Exp. Med. 2021, 218, e20201503. [Google Scholar] [CrossRef]
- Zareen, Z.; Strickland, T.; Eneaney, V.M.; Kelly, L.A.; McDonald, D.; Sweetman, D.; Molloy, E.J. Cytokine dysregulation persists in childhood post Neonatal Encephalopathy. BMC Neurol. 2020, 20, 115. [Google Scholar] [CrossRef]
- Balestrieri, E.; Cipriani, C.; Matteucci, C.; Benvenuto, A.; Coniglio, A.; Argaw-Denboba, A.; Toschi, N.; Bucci, I.; Miele, M.T.; Grelli, S.; et al. Children with Autism Spectrum Disorder and Their Mothers Share Abnormal Expression of Selected Endogenous Retroviruses Families and Cytokines. Front. Immunol. 2019, 10, 2244. [Google Scholar] [CrossRef]
- Goines, P.E.; Croen, L.A.; Braunschweig, D.; Yoshida, C.K.; Grether, J.; Hansen, R.; Kharrazi, M.; Ashwood, P.; Van de Water, J. Increased midgestational IFN-gamma, IL-4 and IL-5 in women bearing a child with autism: A case-control study. Mol. Autism 2011, 2, 13. [Google Scholar] [CrossRef]
- Wang, G.; Zhang, H.; Sun, J.; Zhang, Y.; He, F.; Zou, J. Cyclosporin A impairs neurogenesis and cognitive abilities in brain development via the IFN-gamma-Shh-BDNF pathway. Int. Immunopharmacol. 2021, 96, 107744. [Google Scholar] [CrossRef]
- Sonninen, T.M.; Hamalainen, R.H.; Koskuvi, M.; Oksanen, M.; Shakirzyanova, A.; Wojciechowski, S.; Puttonen, K.; Naumenko, N.; Goldsteins, G.; Laham-Karam, N.; et al. Metabolic alterations in Parkinson’s disease astrocytes. Sci. Rep. 2020, 10, 14474. [Google Scholar] [CrossRef]
- Palm, T.; Bolognin, S.; Meiser, J.; Nickels, S.; Trager, C.; Meilenbrock, R.L.; Brockhaus, J.; Schreitmuller, M.; Missler, M.; Schwamborn, J.C. Rapid and robust generation of long-term self-renewing human neural stem cells with the ability to generate mature astroglia. Sci. Rep. 2015, 5, 16321. [Google Scholar] [CrossRef]
- Brull, M.; Spreng, A.S.; Gutbier, S.; Loser, D.; Krebs, A.; Reich, M.; Kraushaar, U.; Britschgi, M.; Patsch, C.; Leist, M. Incorporation of stem cell-derived astrocytes into neuronal organoids to allow neuro-glial interactions in toxicological studies. ALTEX 2020, 37, 409–428. [Google Scholar] [CrossRef]
- Klima, S.; Brull, M.; Spreng, A.S.; Suciu, I.; Falt, T.; Schwamborn, J.C.; Waldmann, T.; Karreman, C.; Leist, M. A human stem cell-derived test system for agents modifying neuronal N-methyl-D-aspartate-type glutamate receptor Ca2+-signalling. Arch. Toxicol. 2021, 95, 1703–1722. [Google Scholar] [CrossRef]
- Reinhardt, P.; Glatza, M.; Hemmer, K.; Tsytsyura, Y.; Thiel, C.S.; Hoing, S.; Moritz, S.; Parga, J.A.; Wagner, L.; Bruder, J.M.; et al. Derivation and expansion using only small molecules of human neural progenitors for neurodegenerative disease modeling. PLoS ONE 2013, 8, e59252. [Google Scholar] [CrossRef]
- Henn, A.; Lund, S.; Hedtjarn, M.; Schrattenholz, A.; Porzgen, P.; Leist, M. The suitability of BV2 cells as alternative model system for primary microglia cultures or for animal experiments examining brain inflammation. ALTEX 2009, 26, 83–94. [Google Scholar] [CrossRef]
- Loser, D.; Schaefer, J.; Danker, T.; Moller, C.; Brull, M.; Suciu, I.; Uckert, A.K.; Klima, S.; Leist, M.; Kraushaar, U. Human neuronal signaling and communication assays to assess functional neurotoxicity. Arch. Toxicol. 2021, 95, 229–252. [Google Scholar] [CrossRef]
- House, J.S.; Grimm, F.A.; Jima, D.D.; Zhou, Y.H.; Rusyn, I.; Wright, F.A. A Pipeline for High-Throughput Concentration Response Modeling of Gene Expression for Toxicogenomics. Front. Genet. 2017, 8, 168. [Google Scholar] [CrossRef]
- Love, M.I.; Huber, W.; Anders, S. Moderated estimation of fold change and dispersion for RNA-seq data with DESeq2. Genome Biol. 2014, 15, 550. [Google Scholar] [CrossRef]
- Zhou, Y.; Zhou, B.; Pache, L.; Chang, M.; Khodabakhshi, A.H.; Tanaseichuk, O.; Benner, C.; Chanda, S.K. Metascape provides a biologist-oriented resource for the analysis of systems-level datasets. Nat. Commun. 2019, 10, 1523. [Google Scholar] [CrossRef]
- Colombo, E.; Farina, C. Astrocytes: Key Regulators of Neuroinflammation. Trends Immunol. 2016, 37, 608–620. [Google Scholar] [CrossRef]
- Majoros, A.; Platanitis, E.; Kernbauer-Holzl, E.; Rosebrock, F.; Muller, M.; Decker, T. Canonical and Non-Canonical Aspects of JAK-STAT Signaling: Lessons from Interferons for Cytokine Responses. Front. Immunol. 2017, 8, 29. [Google Scholar] [CrossRef] [PubMed]
- Kanski, R.; van Strien, M.E.; van Tijn, P.; Hol, E.M. A star is born: New insights into the mechanism of astrogenesis. Cell Mol. Life Sci. 2014, 71, 433–447. [Google Scholar] [CrossRef] [PubMed]
- Subedi, L.; Lee, S.E.; Madiha, S.; Gaire, B.P.; Jin, M.; Yumnam, S.; Kim, S.Y. Phytochemicals against TNFalpha-Mediated Neuroinflammatory Diseases. Int. J. Mol. Sci. 2020, 21, 965. [Google Scholar] [CrossRef] [PubMed]
- Villard, J.; Peretti, M.; Masternak, K.; Barras, E.; Caretti, G.; Mantovani, R.; Reith, W. A functionally essential domain of RFX5 mediates activation of major histocompatibility complex class II promoters by promoting cooperative binding between RFX and NF-Y. Mol. Cell. Biol. 2000, 20, 3364–3376. [Google Scholar] [CrossRef] [PubMed]
- Seguin-Estevez, Q.; De Palma, R.; Krawczyk, M.; Leimgruber, E.; Villard, J.; Picard, C.; Tagliamacco, A.; Abbate, G.; Gorski, J.; Nocera, A.; et al. The transcription factor RFX protects MHC class II genes against epigenetic silencing by DNA methylation. J. Immunol. 2009, 183, 2545–2553. [Google Scholar] [CrossRef]
- Hasel, P.; Rose, I.V.L.; Sadick, J.S.; Kim, R.D.; Liddelow, S.A. Neuroinflammatory astrocyte subtypes in the mouse brain. Nat. Neurosci. 2021, 24, 1475–1487. [Google Scholar] [CrossRef]
- Sofroniew, M.V. Astrocyte barriers to neurotoxic inflammation. Nat. Rev. Neurosci. 2015, 16, 249–263. [Google Scholar] [CrossRef]
- Falsig, J.; Porzgen, P.; Lund, S.; Schrattenholz, A.; Leist, M. The inflammatory transcriptome of reactive murine astrocytes and implications for their innate immune function. J. Neurochem. 2006, 96, 893–907. [Google Scholar] [CrossRef]
- Shindo, A.; Maki, T.; Mandeville, E.T.; Liang, A.C.; Egawa, N.; Itoh, K.; Itoh, N.; Borlongan, M.; Holder, J.C.; Chuang, T.T.; et al. Astrocyte-Derived Pentraxin 3 Supports Blood-Brain Barrier Integrity Under Acute Phase of Stroke. Stroke 2016, 47, 1094–1100. [Google Scholar] [CrossRef]
- Rostami, J.; Fotaki, G.; Sirois, J.; Mzezewa, R.; Bergstrom, J.; Essand, M.; Healy, L.; Erlandsson, A. Astrocytes have the capacity to act as antigen-presenting cells in the Parkinson’s disease brain. J. Neuroinflamm. 2020, 17, 119. [Google Scholar] [CrossRef]
- Hirsch, M.R.; Wietzerbin, J.; Pierres, M.; Goridis, C. Expression of Ia antigens by cultured astrocytes treated with gamma-interferon. Neurosci. Lett. 1983, 41, 199–204. [Google Scholar] [CrossRef]
- Zeinstra, E.M.; Wilczak, N.; Wilschut, J.C.; Glazenburg, L.; Chesik, D.; Kroese, F.G.; De Keyser, J. 5HT4 agonists inhibit interferon-gamma-induced MHC class II and B7 costimulatory molecules expression on cultured astrocytes. J. Neuroimmunol. 2006, 179, 191–195. [Google Scholar] [CrossRef] [PubMed]
- Vardjan, N.; Gabrijel, M.; Potokar, M.; Svajger, U.; Kreft, M.; Jeras, M.; de Pablo, Y.; Faiz, M.; Pekny, M.; Zorec, R. IFN-gamma-induced increase in the mobility of MHC class II compartments in astrocytes depends on intermediate filaments. J. Neuroinflamm. 2012, 9, 144. [Google Scholar] [CrossRef] [PubMed]
- Rajesh, Y.; Kanneganti, T.D. Innate Immune Cell Death in Neuroinflammation and Alzheimer’s Disease. Cells 2022, 11, 1885. [Google Scholar] [CrossRef] [PubMed]
- Escartin, C.; Guillemaud, O.; Carrillo-de Sauvage, M.A. Questions and (some) answers on reactive astrocytes. Glia 2019, 67, 2221–2247. [Google Scholar] [CrossRef]
- Goursaud, S.; Kozlova, E.N.; Maloteaux, J.M.; Hermans, E. Cultured astrocytes derived from corpus callosum or cortical grey matter show distinct glutamate handling properties. J. Neurochem. 2009, 108, 1442–1452. [Google Scholar] [CrossRef]
- Kang, K.; Lee, S.W.; Han, J.E.; Choi, J.W.; Song, M.R. The complex morphology of reactive astrocytes controlled by fibroblast growth factor signaling. Glia 2014, 62, 1328–1344. [Google Scholar] [CrossRef]
- Zhou, B.; Zuo, Y.X.; Jiang, R.T. Astrocyte morphology: Diversity, plasticity, and role in neurological diseases. CNS Neurosci. Ther. 2019, 25, 665–673. [Google Scholar] [CrossRef]
- Castillo, C.; Saez-Orellana, F.; Godoy, P.A.; Fuentealba, J. Microglial Activation Modulated by P2X4R in Ischemia and Repercussions in Alzheimer’s Disease. Front. Physiol. 2022, 13, 814999. [Google Scholar] [CrossRef]
- Tang, Y.; Le, W. Differential Roles of M1 and M2 Microglia in Neurodegenerative Diseases. Mol. Neurobiol. 2016, 53, 1181–1194. [Google Scholar] [CrossRef]
- Baskakov, I.V. On the reactive states of astrocytes in prion diseases. Prion 2021, 15, 87–93. [Google Scholar] [CrossRef] [PubMed]
- Yun, S.P.; Kam, T.I.; Panicker, N.; Kim, S.; Oh, Y.; Park, J.S.; Kwon, S.H.; Park, Y.J.; Karuppagounder, S.S.; Park, H.; et al. Block of A1 astrocyte conversion by microglia is neuroprotective in models of Parkinson’s disease. Nat. Med. 2018, 24, 931–938. [Google Scholar] [CrossRef] [PubMed]
- Hinkle, J.T.; Dawson, V.L.; Dawson, T.M. The A1 astrocyte paradigm: New avenues for pharmacological intervention in neurodegeneration. Mov. Disord. 2019, 34, 959–969. [Google Scholar] [CrossRef] [PubMed]
- Lana, D.; Ugolini, F.; Nosi, D.; Wenk, G.L.; Giovannini, M.G. The Emerging Role of the Interplay Among Astrocytes, Microglia, and Neurons in the Hippocampus in Health and Disease. Front. Aging Neurosci. 2021, 13, 651973. [Google Scholar] [CrossRef] [PubMed]
- Bardou, I.; Brothers, H.M.; Kaercher, R.M.; Hopp, S.C.; Wenk, G.L. Differential effects of duration and age on the consequences of neuroinflammation in the hippocampus. Neurobiol. Aging 2013, 34, 2293–2301. [Google Scholar] [CrossRef]
- Bardou, I.; Kaercher, R.M.; Brothers, H.M.; Hopp, S.C.; Royer, S.; Wenk, G.L. Age and duration of inflammatory environment differentially affect the neuroimmune response and catecholaminergic neurons in the midbrain and brainstem. Neurobiol. Aging 2014, 35, 1065–1073. [Google Scholar] [CrossRef]
- Acioglu, C.; Li, L.; Elkabes, S. Contribution of astrocytes to neuropathology of neurodegenerative diseases. Brain Res. 2021, 1758, 147291. [Google Scholar] [CrossRef]
- Kleiderman, S.; Gutbier, S.; Ugur Tufekci, K.; Ortega, F.; Sa, J.V.; Teixeira, A.P.; Brito, C.; Glaab, E.; Berninger, B.; Alves, P.M.; et al. Conversion of Nonproliferating Astrocytes into Neurogenic Neural Stem Cells: Control by FGF2 and Interferon-gamma. Stem Cells 2016, 34, 2861–2874. [Google Scholar] [CrossRef]
- Chiareli, R.A.; Carvalho, G.A.; Marques, B.L.; Mota, L.S.; Oliveira-Lima, O.C.; Gomes, R.M.; Birbrair, A.; Gomez, R.S.; Simao, F.; Klempin, F.; et al. The Role of Astrocytes in the Neurorepair Process. Front. Cell Dev. Biol. 2021, 9, 665795. [Google Scholar] [CrossRef]
- Mattugini, N.; Bocchi, R.; Scheuss, V.; Russo, G.L.; Torper, O.; Lao, C.L.; Gotz, M. Inducing Different Neuronal Subtypes from Astrocytes in the Injured Mouse Cerebral Cortex. Neuron 2019, 103, 1086–1095.e5. [Google Scholar] [CrossRef] [Green Version]


Publisher’s Note: MDPI stays neutral with regard to jurisdictional claims in published maps and institutional affiliations. |
© 2022 by the authors. Licensee MDPI, Basel, Switzerland. This article is an open access article distributed under the terms and conditions of the Creative Commons Attribution (CC BY) license (https://creativecommons.org/licenses/by/4.0/).
Share and Cite
Spreng, A.-S.; Brüll, M.; Leisner, H.; Suciu, I.; Leist, M. Distinct and Dynamic Transcriptome Adaptations of iPSC-Generated Astrocytes after Cytokine Stimulation. Cells 2022, 11, 2644. https://doi.org/10.3390/cells11172644
Spreng A-S, Brüll M, Leisner H, Suciu I, Leist M. Distinct and Dynamic Transcriptome Adaptations of iPSC-Generated Astrocytes after Cytokine Stimulation. Cells. 2022; 11(17):2644. https://doi.org/10.3390/cells11172644
Chicago/Turabian StyleSpreng, Anna-Sophie, Markus Brüll, Heidrun Leisner, Ilinca Suciu, and Marcel Leist. 2022. "Distinct and Dynamic Transcriptome Adaptations of iPSC-Generated Astrocytes after Cytokine Stimulation" Cells 11, no. 17: 2644. https://doi.org/10.3390/cells11172644