
The Protective Action of Metformin against Pro-Inflammatory Cytokine-Induced Human Islet Cell Damage and the Mechanisms Involved

 , , , ,
  and
and
Abstract
:1. Introduction
2. Methods
2.1. Human Pancreatic Islets
2.2. Insulin Secretion Studies
2.3. Caspase 3/7 Activity Assay
2.4. Protein Extraction from Human Pancreatic Islets
2.5. Protein Fractionation
2.6. Shotgun Label Free Analysis
2.7. Raw Data Processing and Quantitative Analysis
2.8. Pathway Analysis
2.9. Western Blot
2.10. Statistical Analysis
3. Results
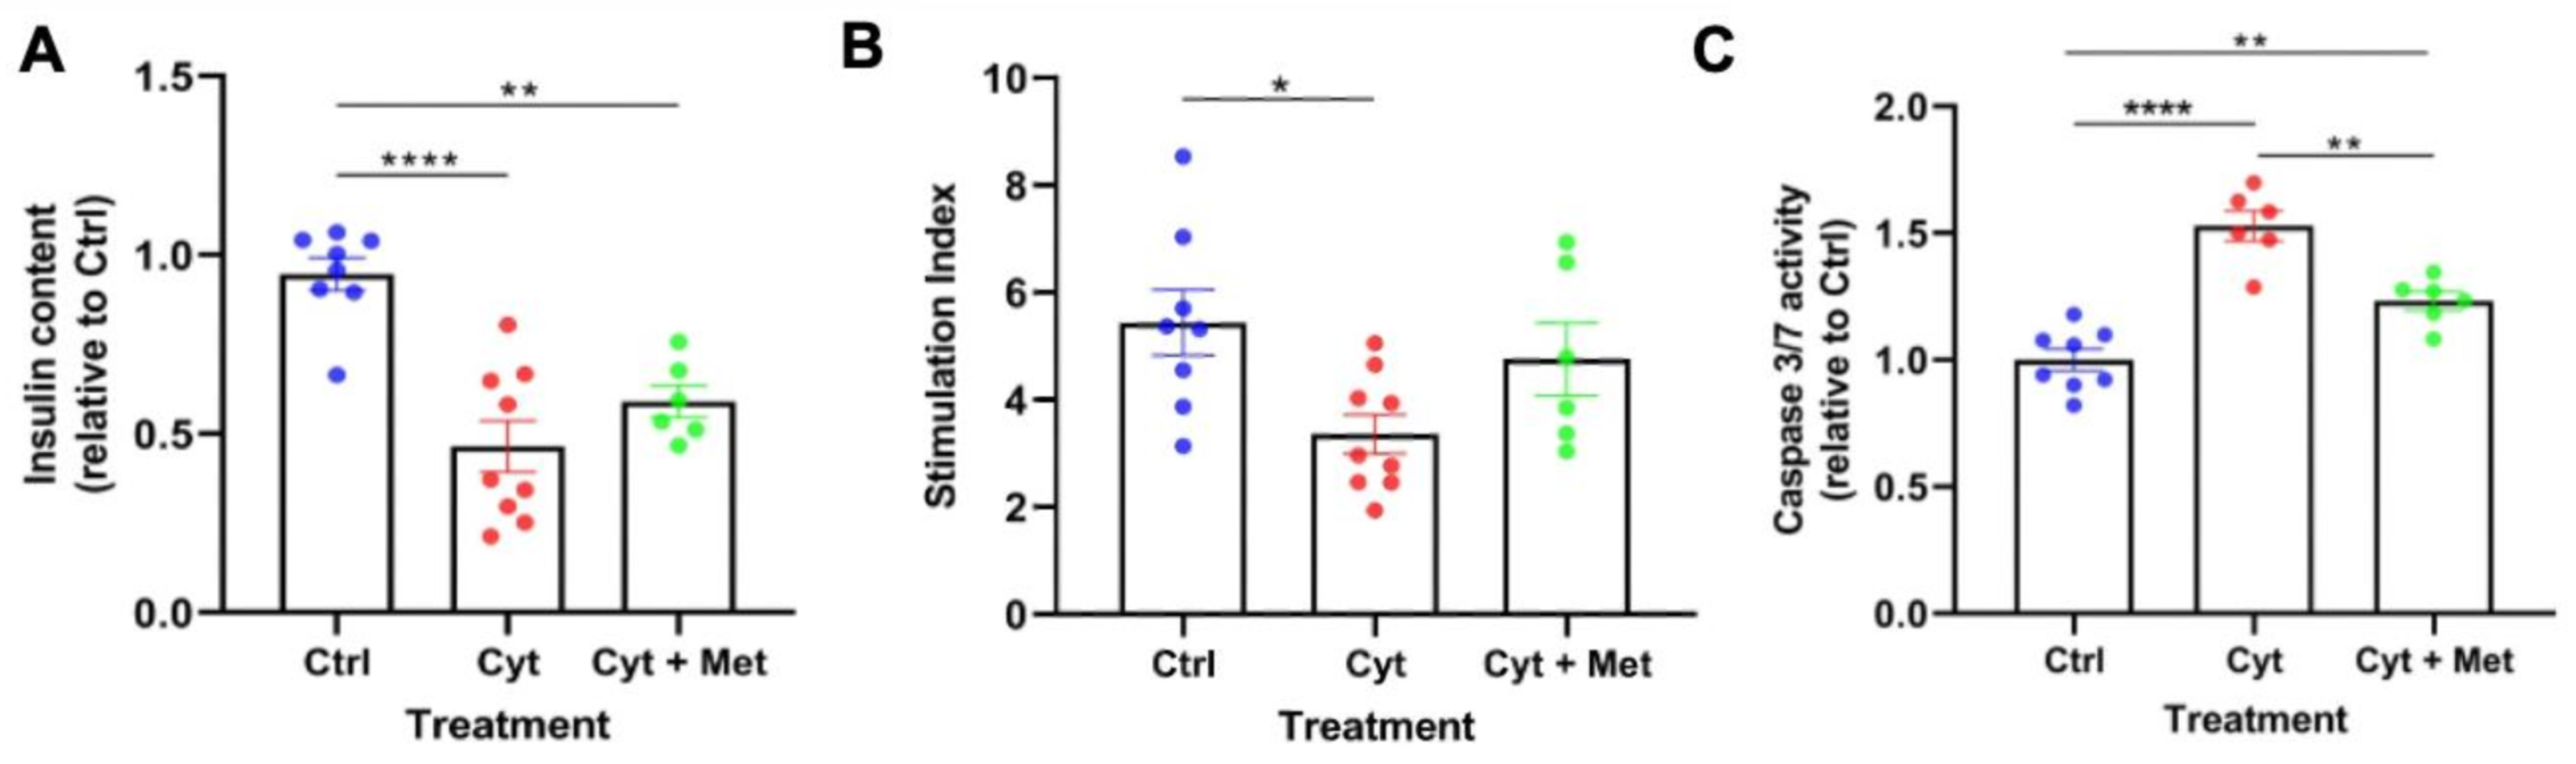
3.1. Effects of Metformin on Cytokine-Induced Damage
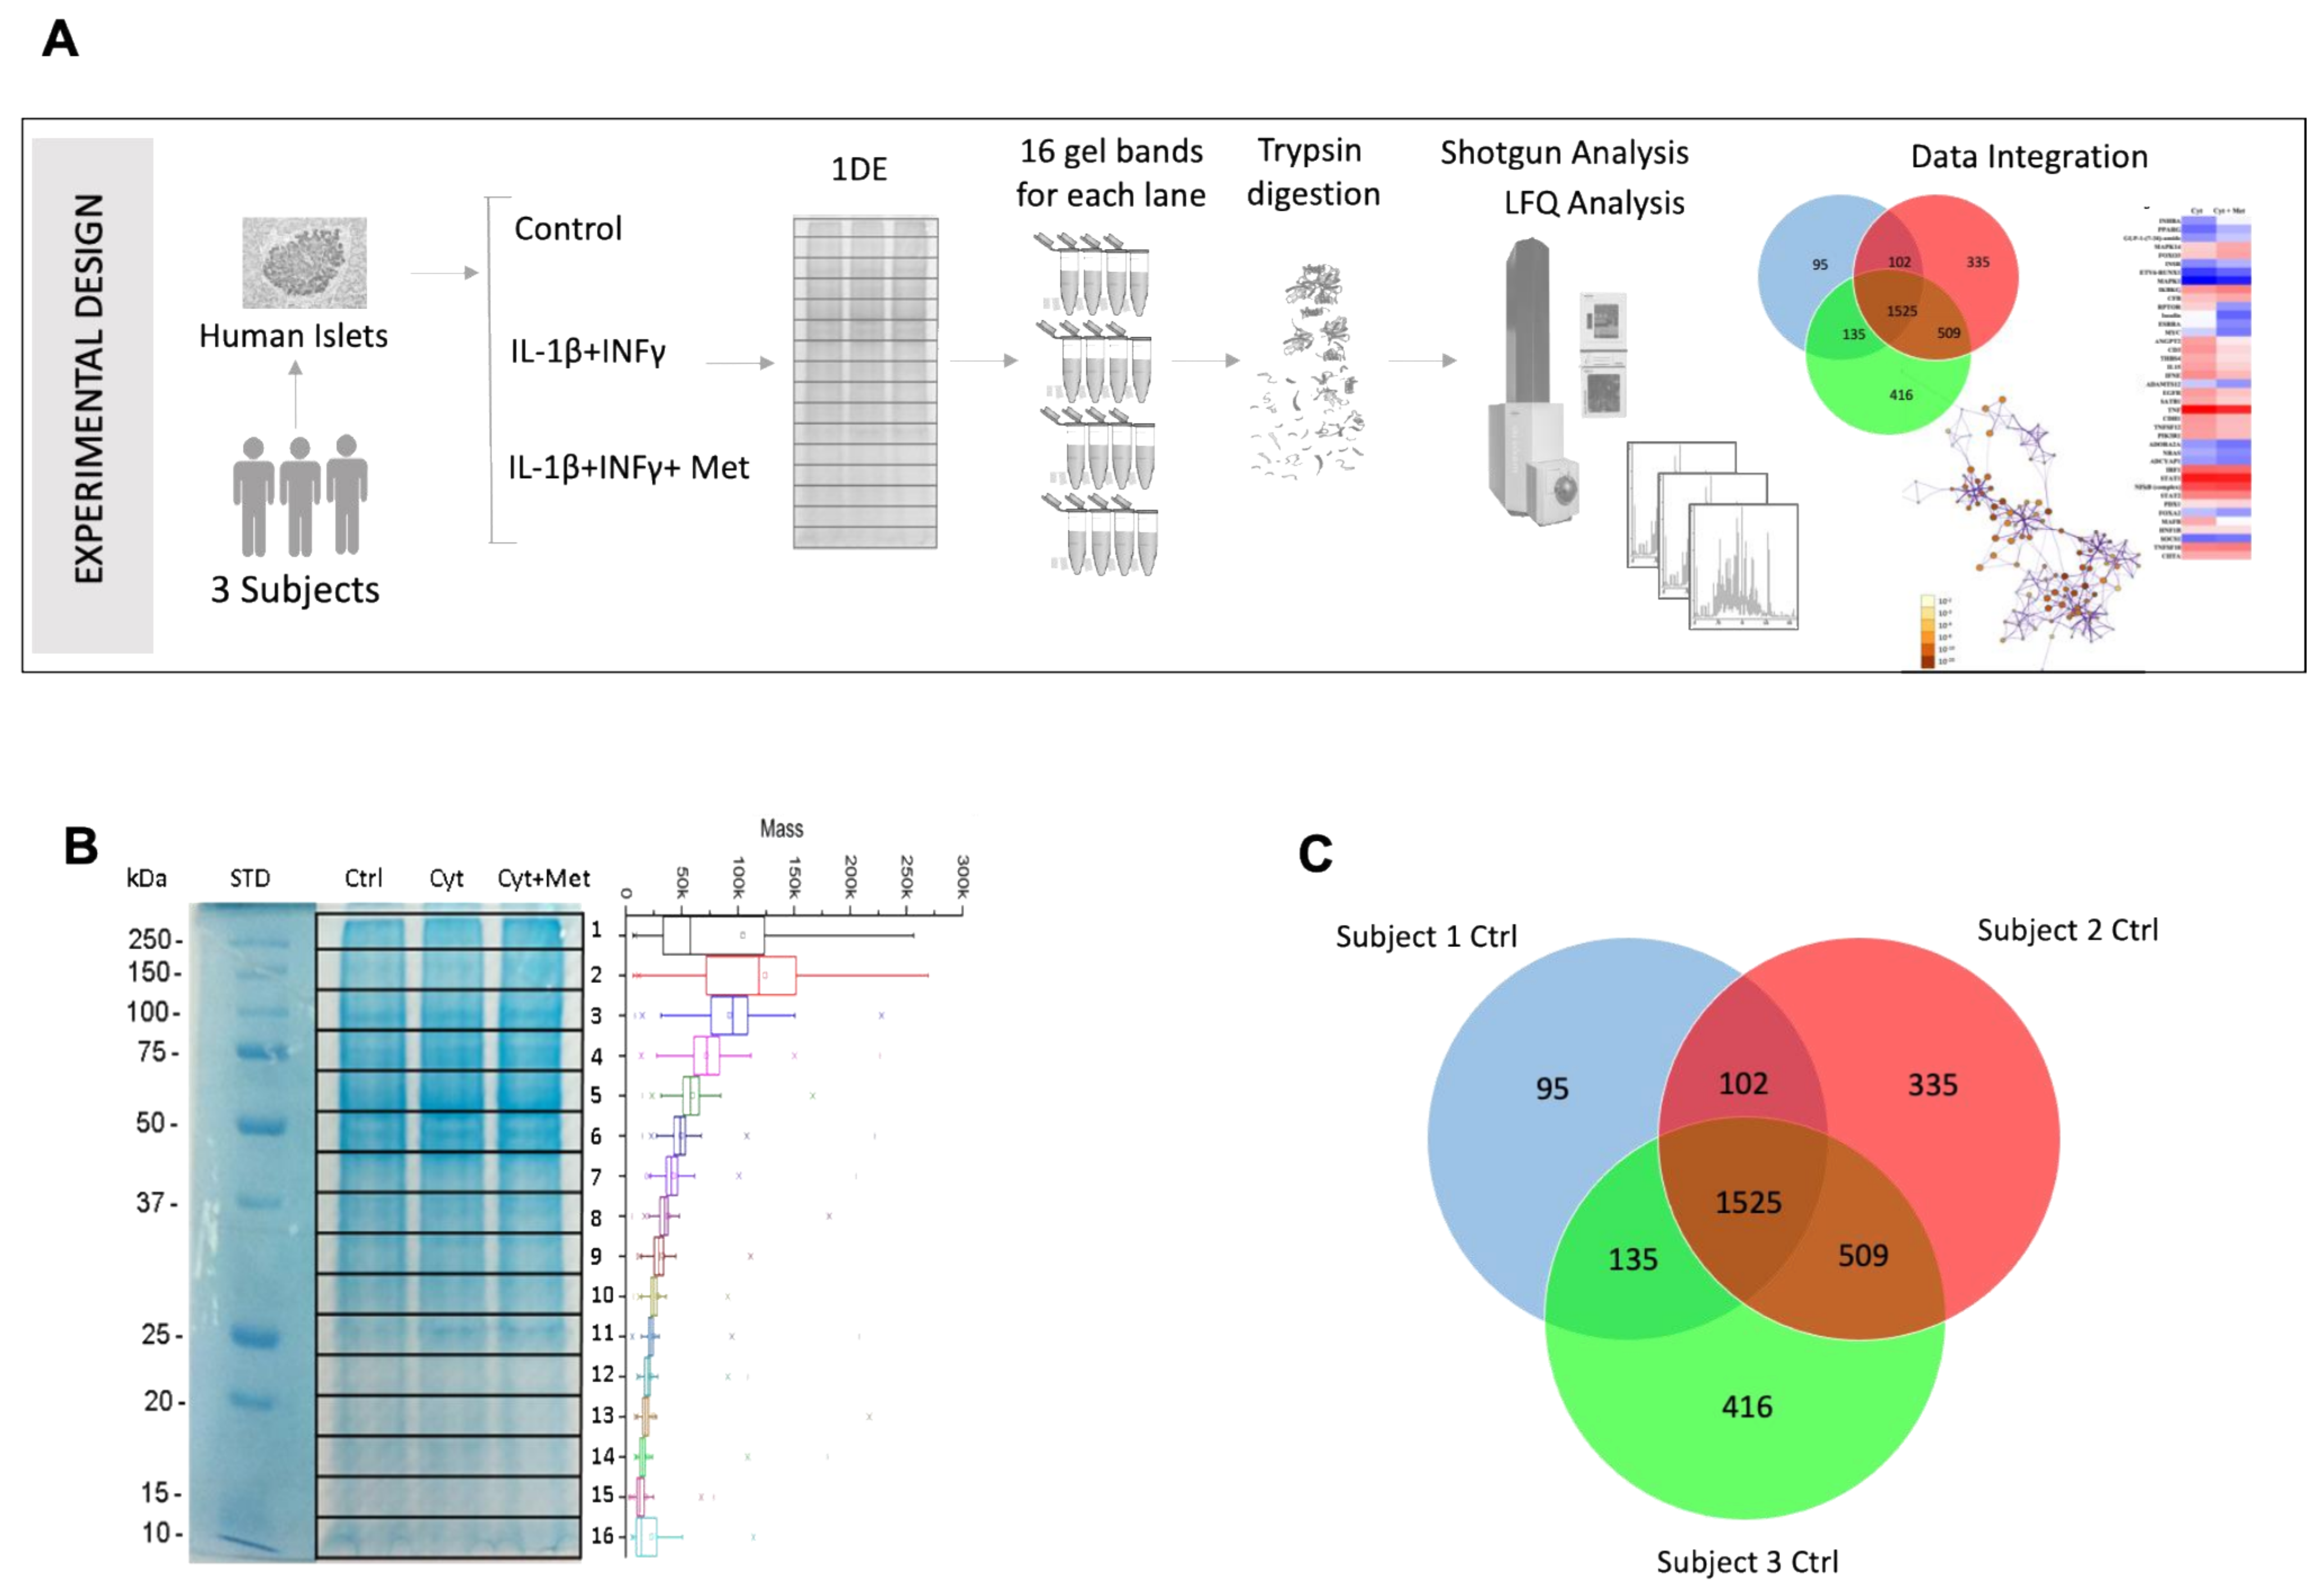
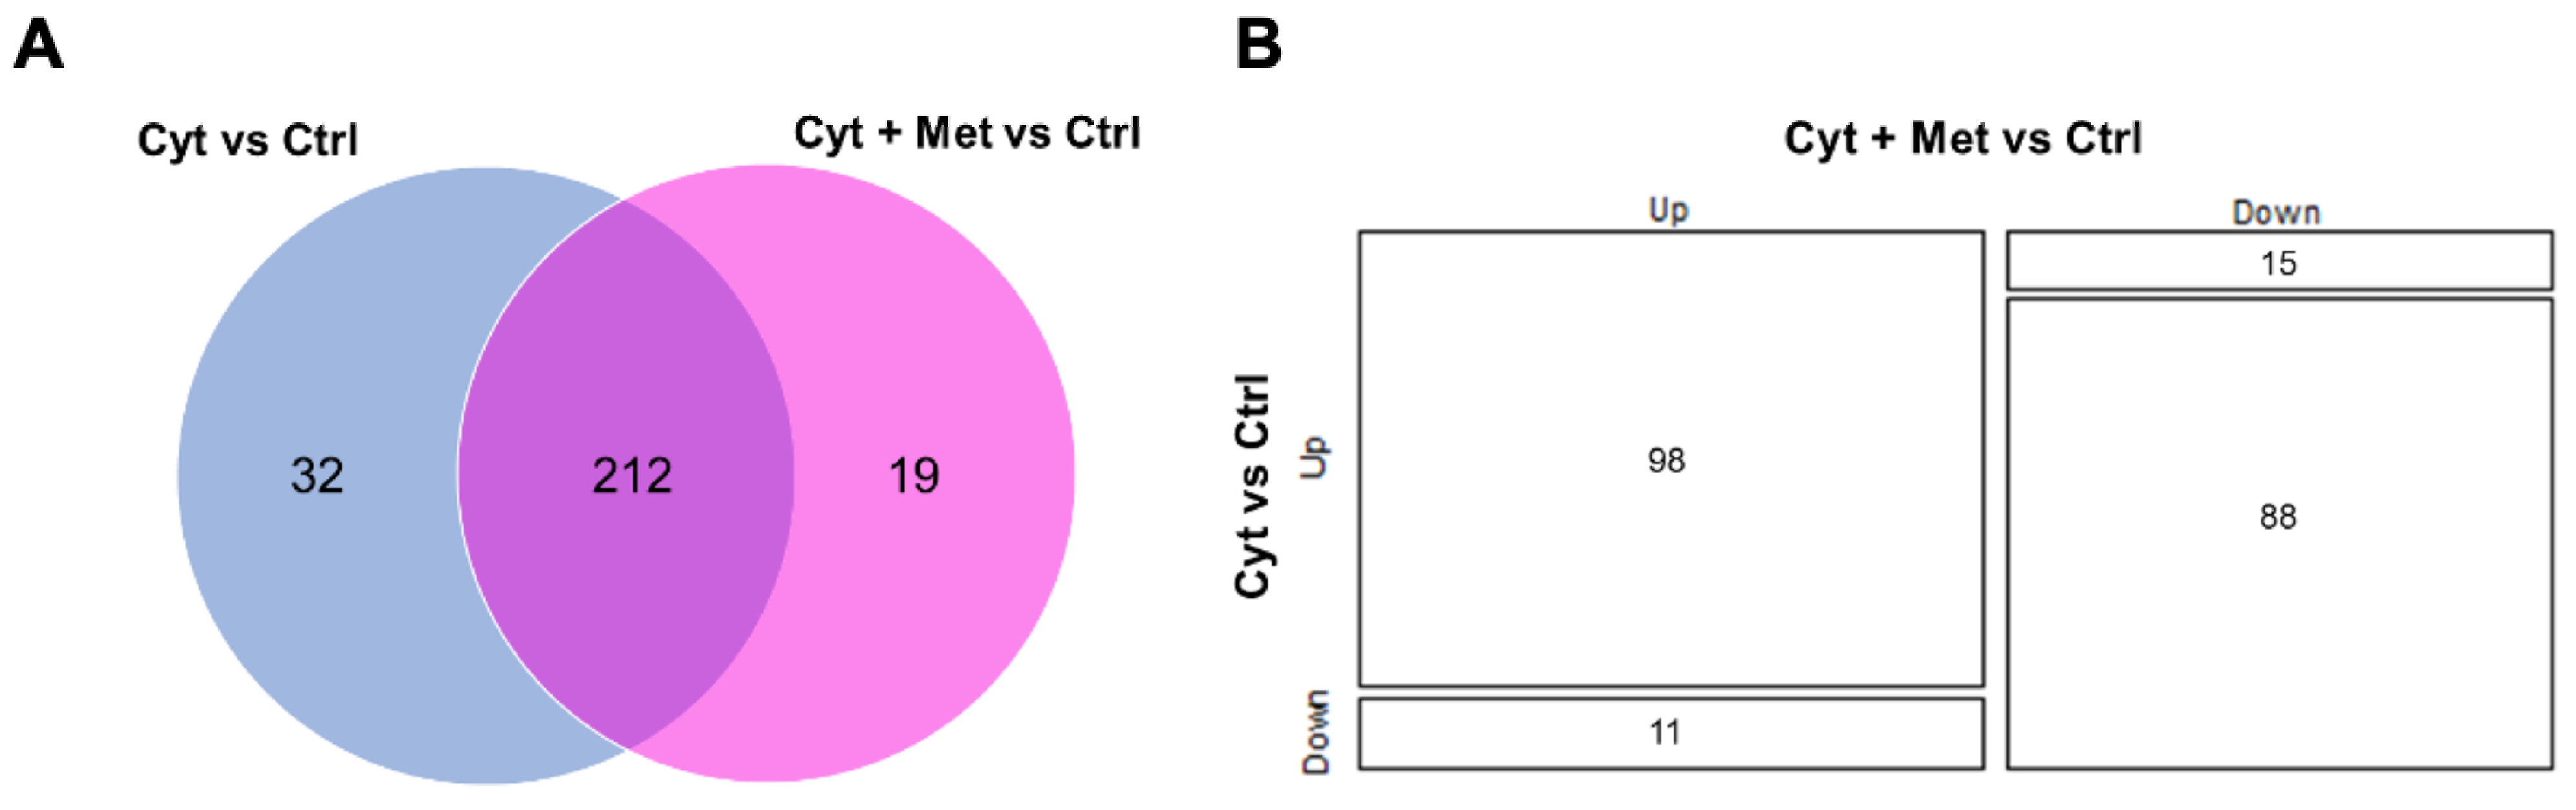
3.2. Identification of Islet Proteins Using Multidimensional Shotgun Proteomics
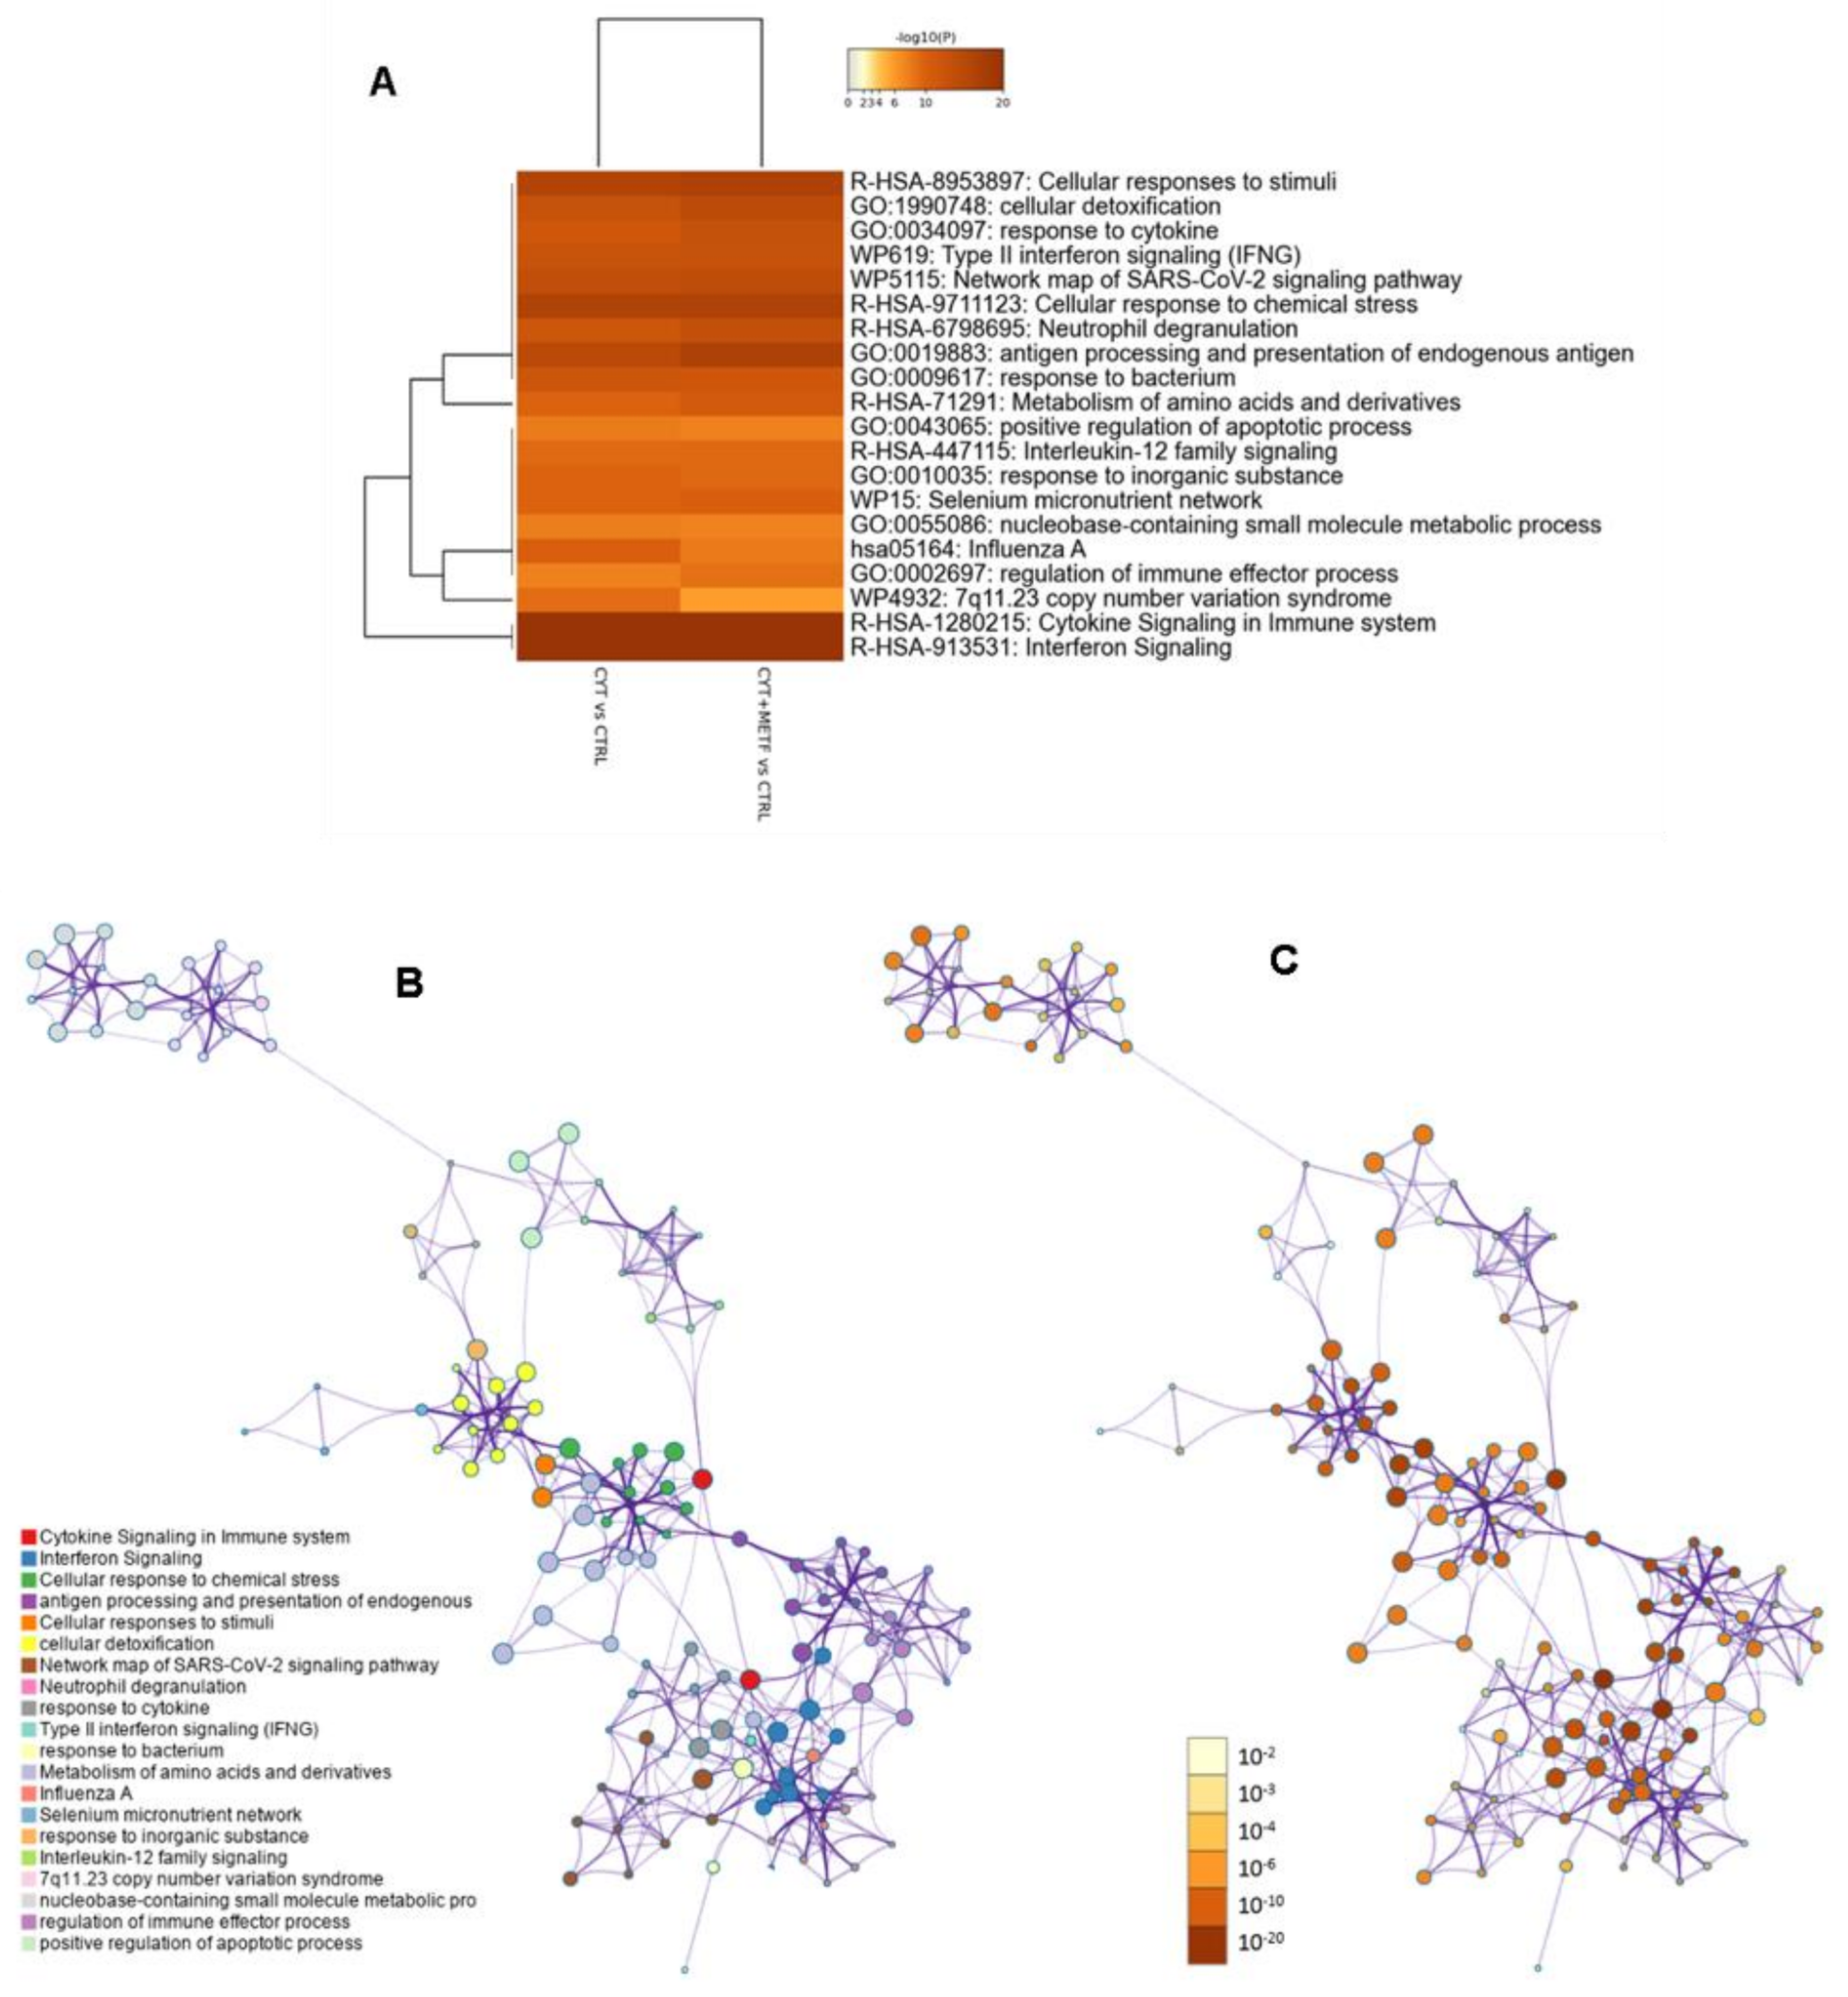
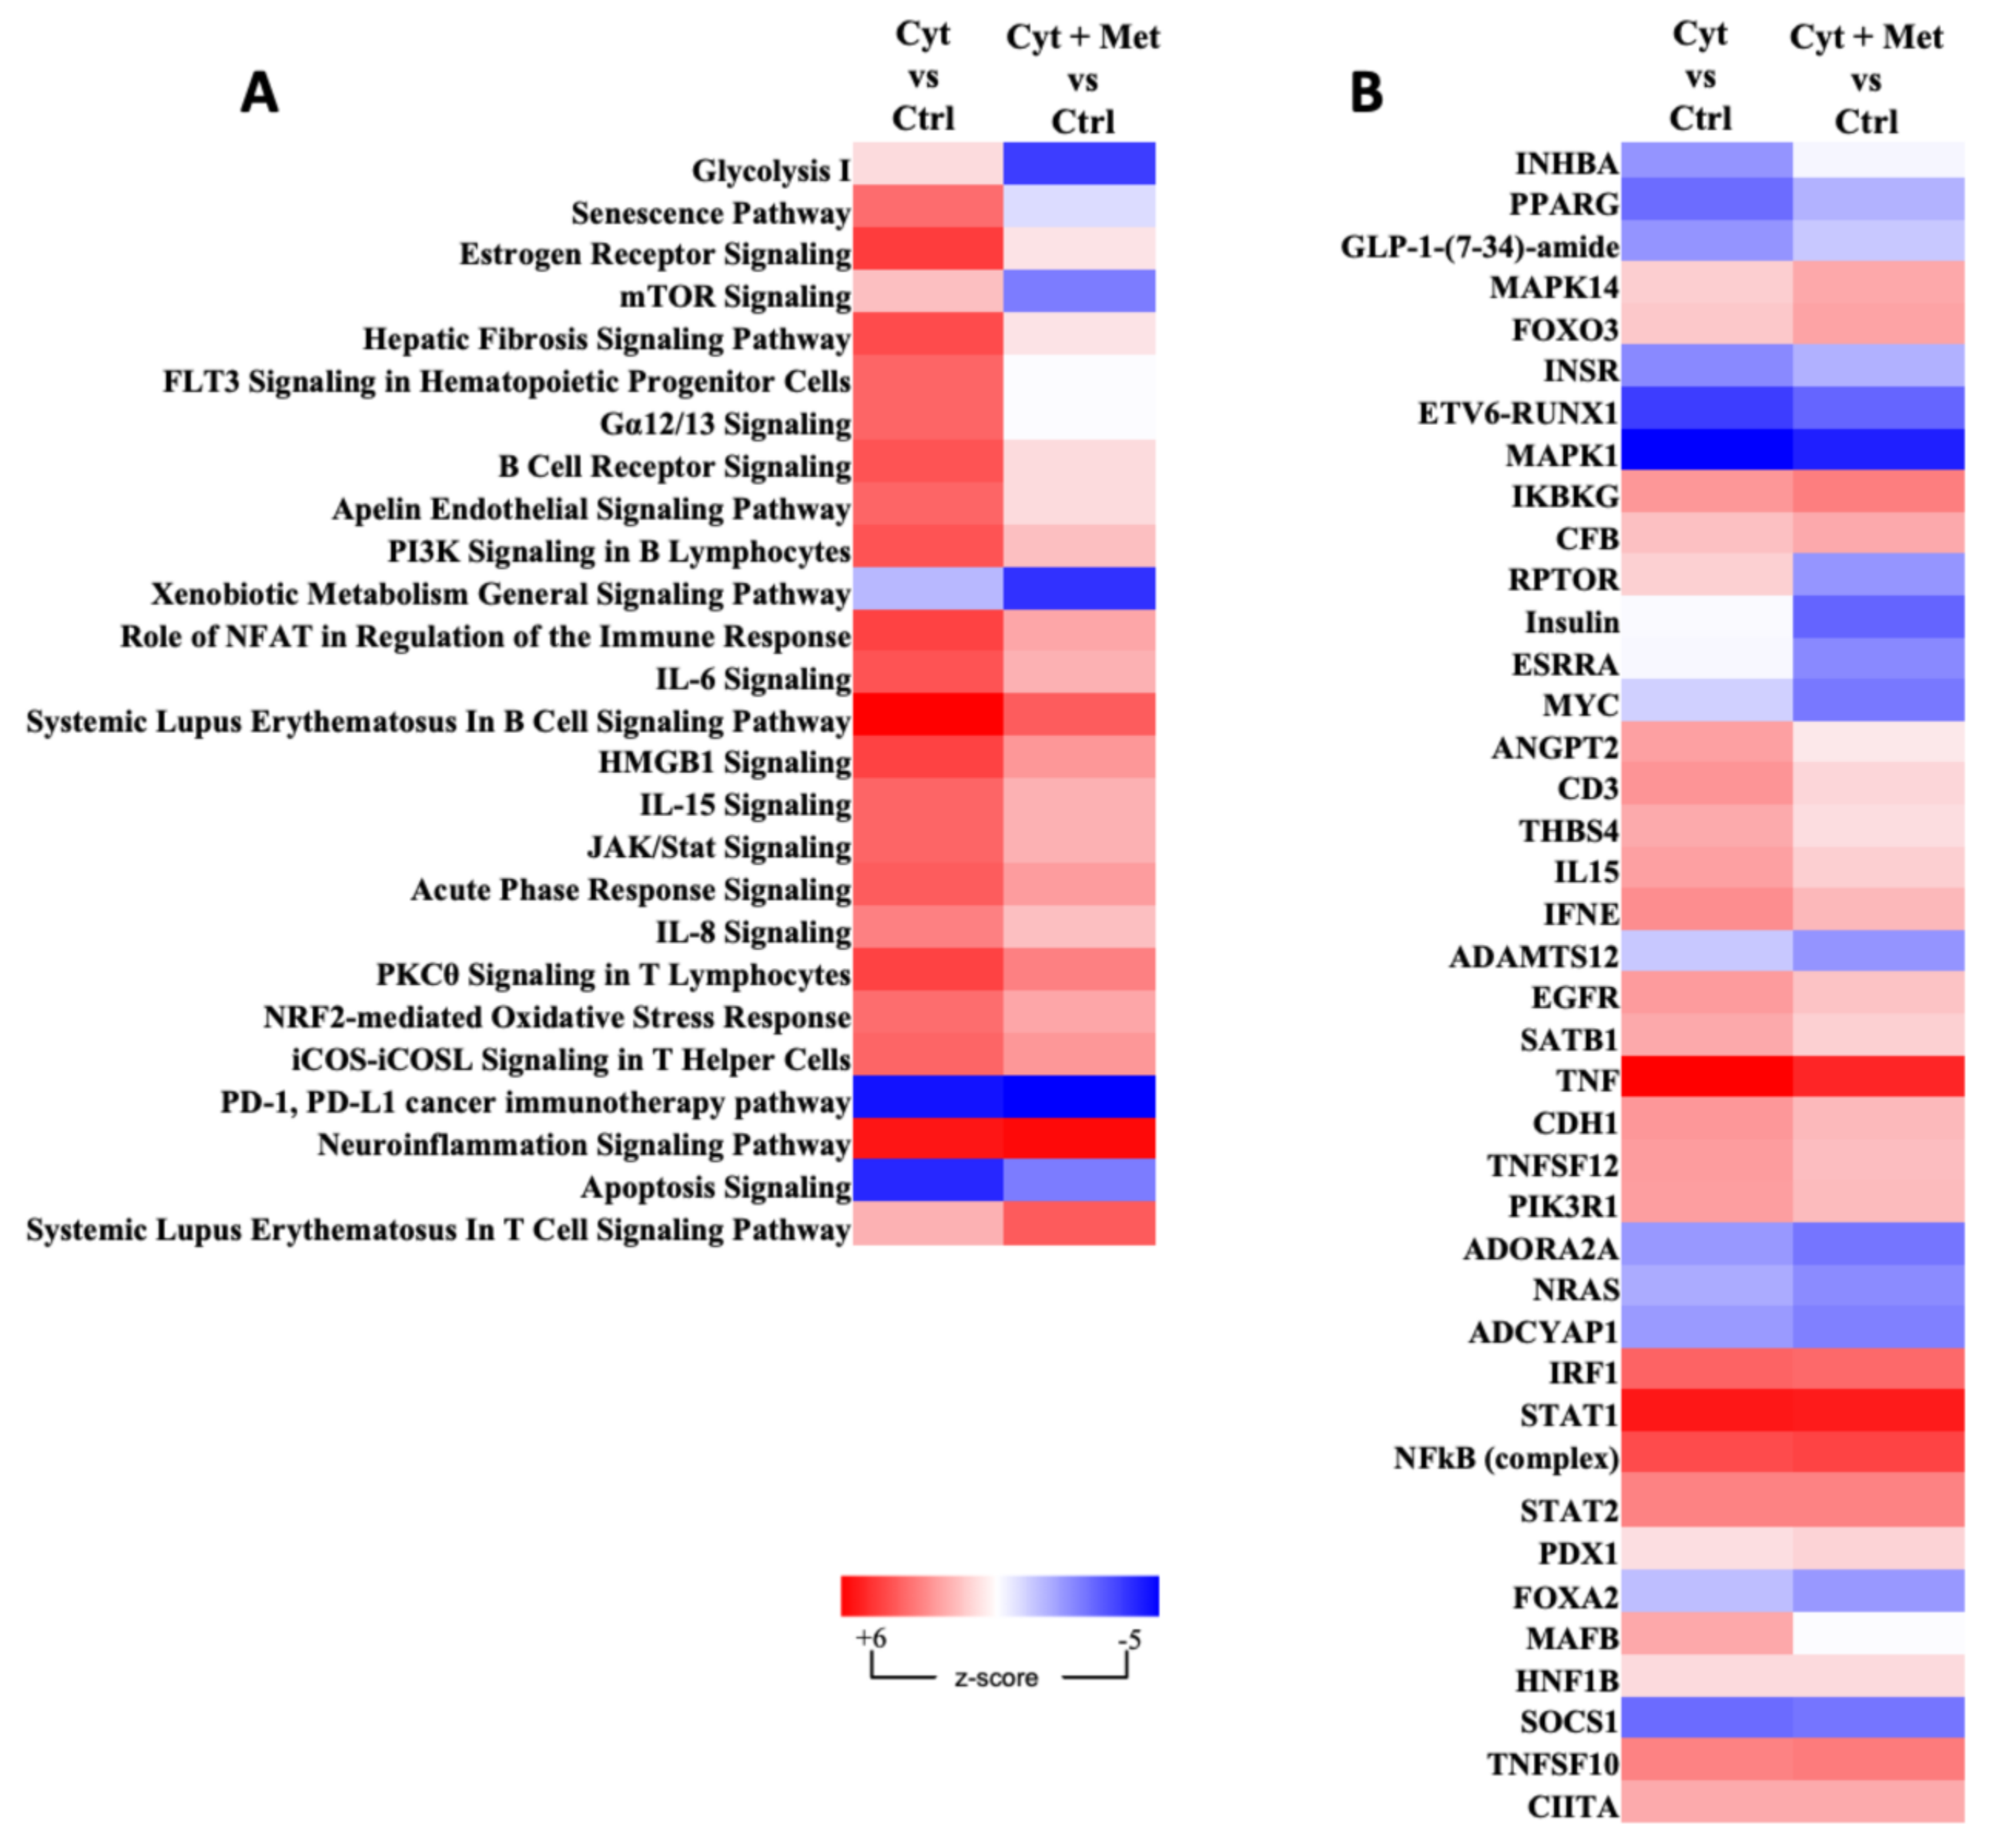
3.3. Gene Ontology, Analysis of Canonical Pathway, and Upstream Regulators
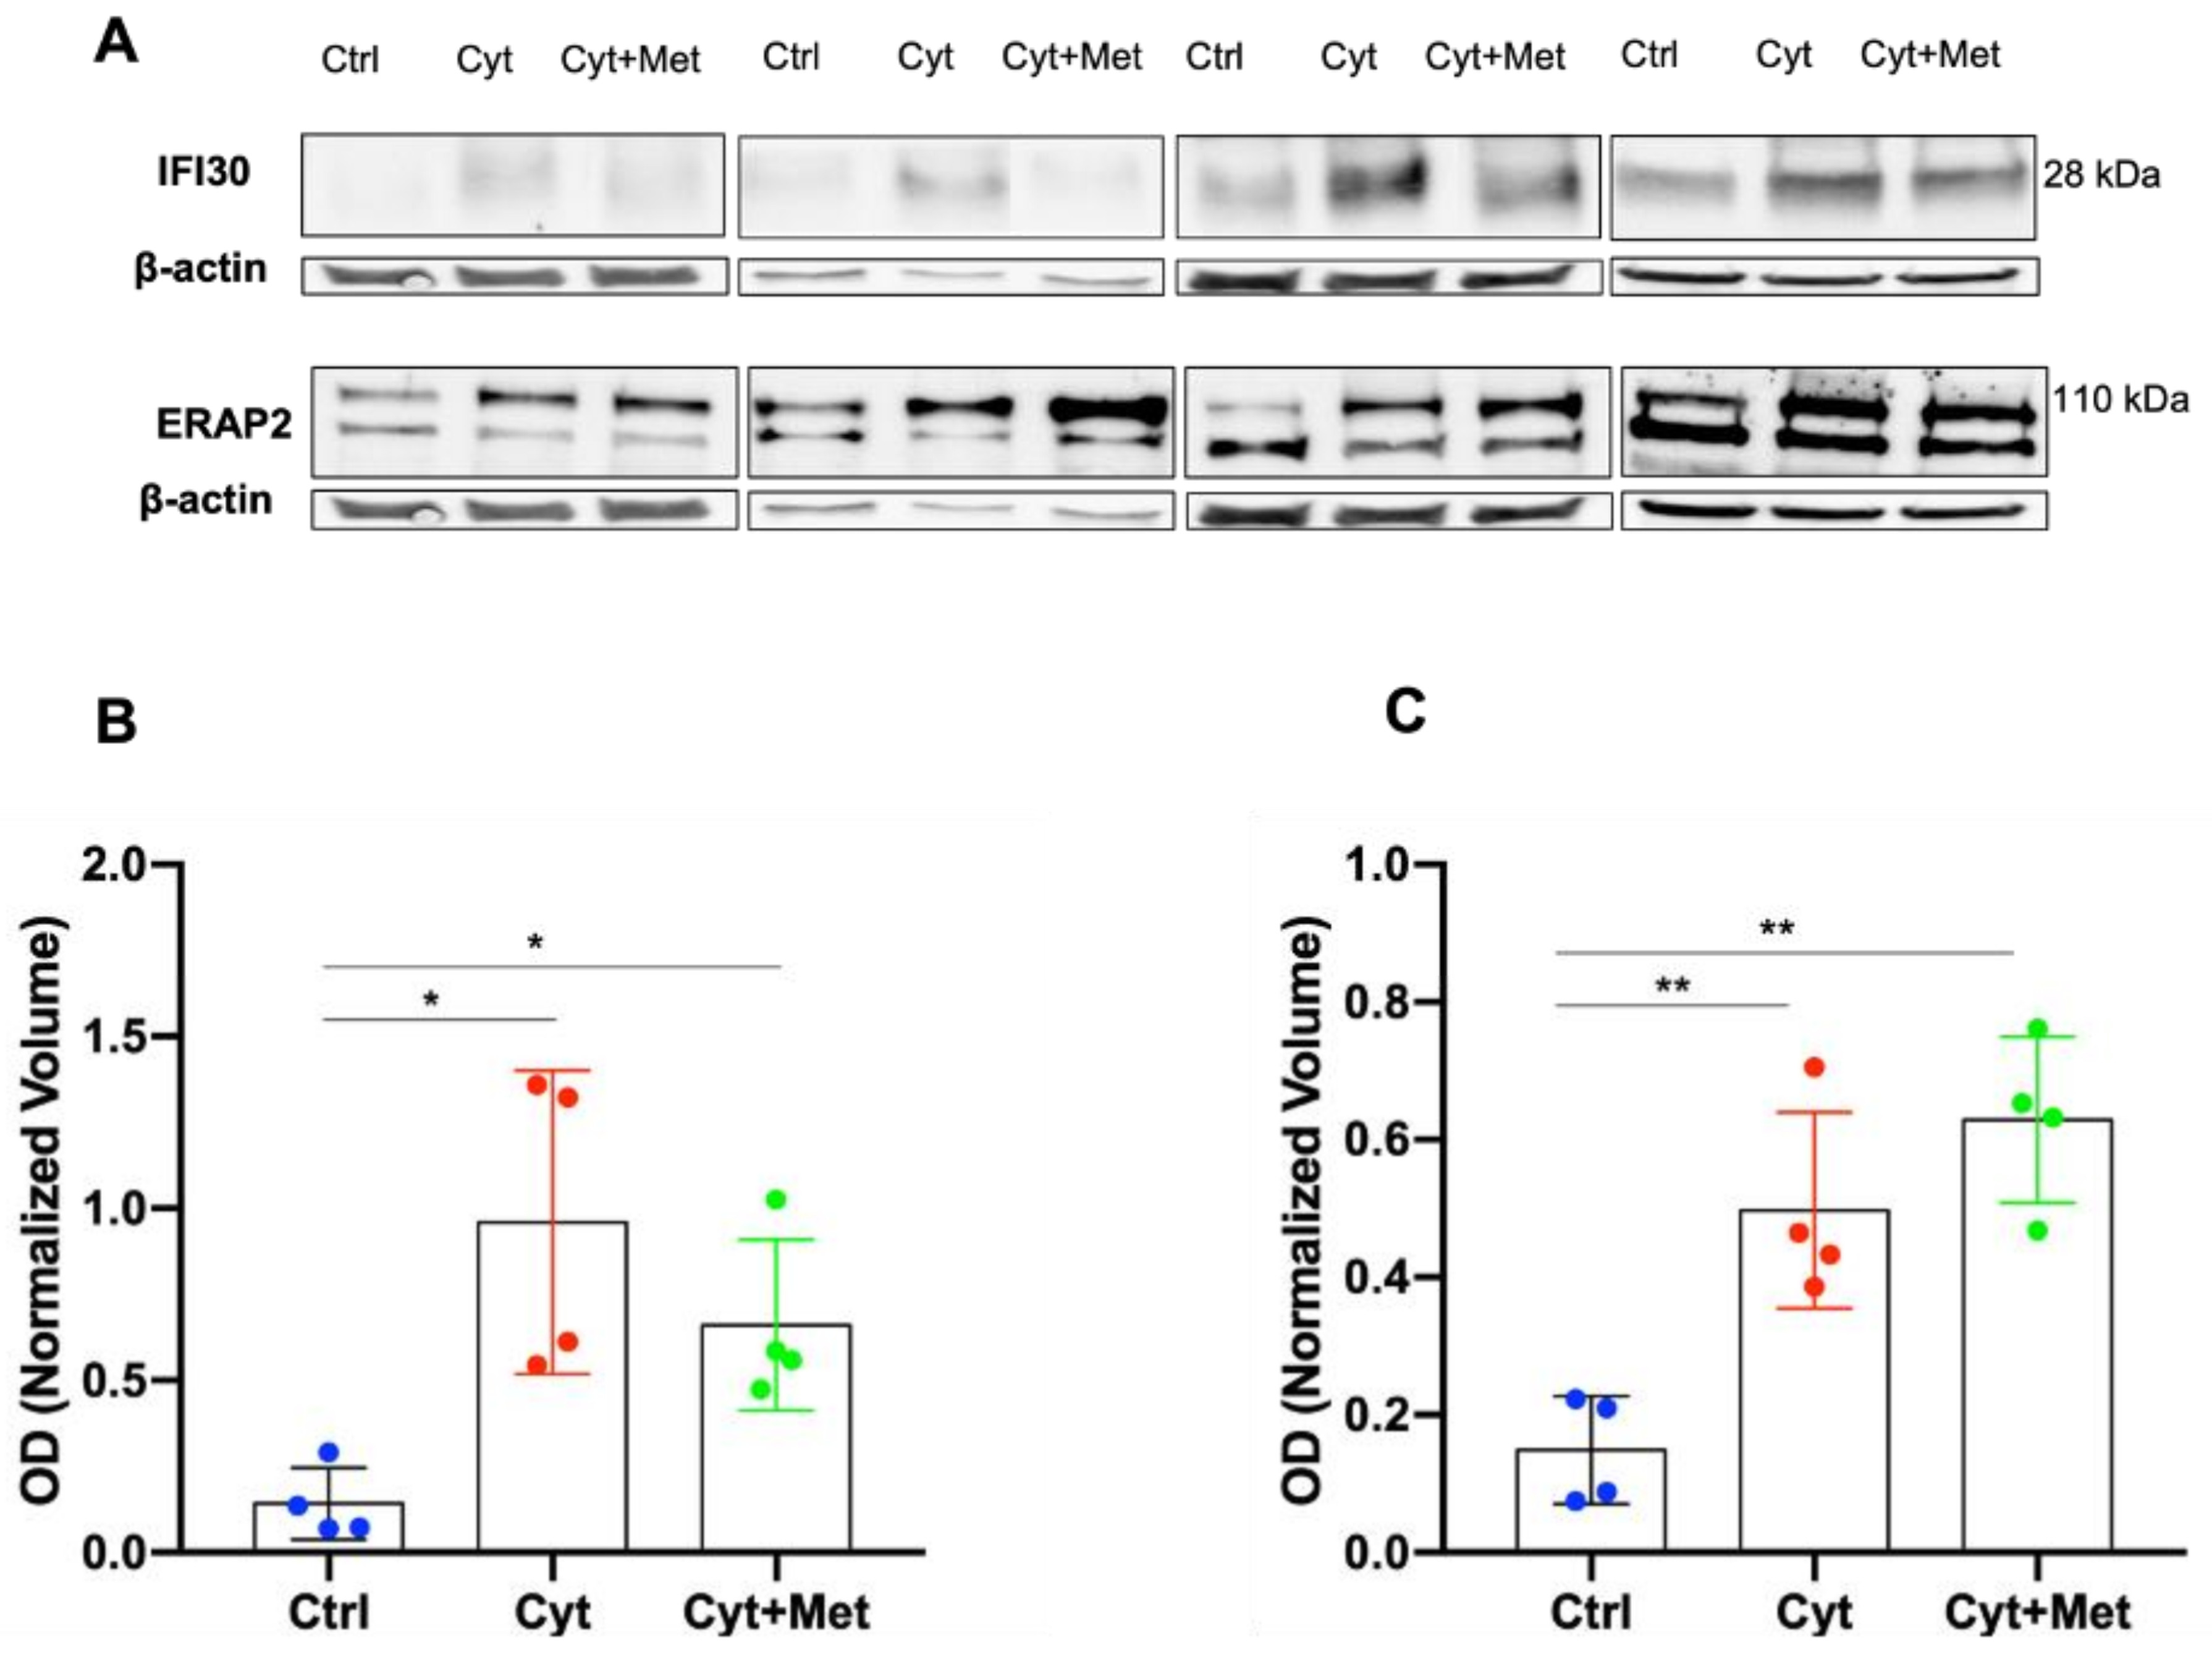
3.4. Western Blot (WB) Analysis of ERAP2 and IFI30 in Human Islets
4. Discussion
Supplementary Materials
Author Contributions
Funding
Institutional Review Board Statement
Informed Consent Statement
Data Availability Statement
Conflicts of Interest
References
- American Diabetes Association. Classification and Diagnosis of Diabetes: Standards of Medical Care in Diabetes—2022. Diabetes Care 2021, 45, S17–S38. [Google Scholar]
- International Diabetes Federation. Available online: https://idf.org/ (accessed on 7 July 2022).
- Eizirik, D.L.; Pasquali, L.; Cnop, M. Pancreatic β-cells in type 1 and type 2 diabetes mellitus: Different pathways to failure. Nat. Rev. Endocrinol. 2020, 16, 349–362. [Google Scholar] [CrossRef] [PubMed]
- Halban, P.A.; Polonsky, K.S.; Bowden, D.W.; Hawkins, M.A.; Ling, C.; Mather, K.J.; Powers, A.C.; Rhodes, C.J.; Sussel, L.; Weir, G.C. β-Cell Failure in Type 2 Diabetes: Postulated Mechanisms and Prospects for Prevention and Treatment. Diabetes Care 2014, 37, 1751–1758. [Google Scholar] [CrossRef] [PubMed] [Green Version]
- Davies, M.J.; D’Alessio, D.A.; Fradkin, J.; Kernan, W.N.; Mathieu, C.; Mingrone, G.; Rossing, P.; Tsapas, A.; Wexler, D.J.; Buse, J.B. Management of Hyperglycemia in Type 2 Diabetes, 2018. A Consensus Report by the American Diabetes Association (ADA) and the European Association for the Study of Diabetes (EASD). Diabetes Care 2018, 41, 2669–2701. [Google Scholar] [CrossRef] [Green Version]
- Draznin, B.; Aroda, V.R.; Bakris, G.; Benson, G.; Brown, F.M.; Freeman, R.; Green, J.; Huang, E.; Isaacs, D.; Kahan, S.; et al. Pharmacologic Approaches to Glycemic Treatment: Standards of Medical Care in Diabetes-2022. Diabetes Care 2022, 45 (Suppl. S1), S125–S143. [Google Scholar]
- Bailey, C.J. Metformin: Historical overview. Diabetologia 2017, 60, 1566–1576. [Google Scholar] [CrossRef] [Green Version]
- Buse, J.B.; Wexler, D.J.; Tsapas, A.; Rossing, P.; Mingrone, G.; Mathieu, C.; D’Alessio, D.A.; Davies, M.J. 2019 Update to: Management of Hyperglycemia in Type 2 Diabetes, 2018. A Consensus Report by the American Diabetes Association (ADA) and the European Association for the Study of Diabetes (EASD). Diabetes Care 2020, 43, 487–493. [Google Scholar] [CrossRef] [Green Version]
- Adeva-Andany, M.M.; Ranal-Muino, E.; Fernandez-Fernandez, C.; Pazos-Garcia, C.; Vila-Altesor, M. Metabolic Effects of Metformin in Humans. Curr. Diabetes Rev. 2019, 15, 328–339. [Google Scholar] [CrossRef]
- Foretz, M.; Guigas, B.; Viollet, B. Understanding the glucoregulatory mechanisms of metformin in type 2 diabetes mellitus. Nat. Rev. Endocrinol. 2019, 15, 569–589. [Google Scholar] [CrossRef] [Green Version]
- Glossmann, H.H.; Lutz, O.M.D. Pharmacology of metformin—An update. Eur. J. Pharmacol. 2019, 865, 172782. [Google Scholar] [CrossRef]
- Zheng, J.; Xiao, K.-L.; Chen, L.; Wu, C.; Hu, X.; Zeng, T.; Chen, X.-Q.; Li, W.-J.; Deng, X.; Li, H.; et al. Insulin sensitizers improve the GLP-1 secretion and the amount of intestinal L cells on high-fat-diet–induced catch-up growth. Nutrition 2017, 39-40, 82–91. [Google Scholar] [CrossRef] [PubMed]
- Cameron, A.R.; Morrison, V.; Levin, D.; Mohan, M.; Forteath, C.; Beall, C.; McNeilly, A.; Balfour, D.J.; Savinko, T.; Wong, A.K.; et al. Anti-Inflammatory Effects of Metformin Irrespective of Diabetes Status. Circ. Res. 2016, 119, 652–665. [Google Scholar] [CrossRef] [PubMed] [Green Version]
- Kanigur Sultuybek, G.; Soydas, T.; Yenmis, G. NF-κB as the mediator of metformin’s effect on ageing and ageing-related diseases. Clin. Exp. Pharmacol. Physiol. 2019, 46, 413–422. [Google Scholar] [CrossRef] [PubMed] [Green Version]
- Zilov, A.V.; Abdelaziz, S.I.; Alshammary, A.; Al Zahrani, A.; Amir, A.; Khalil, S.H.A.; Brand, K.; Elkafrawy, N.; Hassoun, A.A.; Jahed, A.; et al. Mechanisms of action of metformin with special reference to cardiovascular protection. Diabetes/Metabolism Res. Rev. 2019, 35, e3173. [Google Scholar] [CrossRef] [PubMed] [Green Version]
- Todd, J.A. Etiology of Type 1 Diabetes. Immunity 2010, 32, 457–467. [Google Scholar] [CrossRef] [Green Version]
- Eizirik, D.L.; Sammeth, M.; Bouckenooghe, T.; Bottu, G.; Sisino, G.; Igoillo-Esteve, M.; Ortis, F.; Santin, I.; Colli, M.L.; Barthson, J.; et al. The hu-man pancreatic islet transcriptome: Expression of candidate genes for type 1 diabetes and the impact of pro-inflammatory cytokines. PLoS Genet 2012, 8, e1002552. [Google Scholar] [CrossRef]
- Ghiasi, S.M.; Dahllöf, M.S.; Osmai, Y.; Osmai, M.; Jakobsen, K.K.; Aivazidis, A.; Tyrberg, B.; Perruzza, L.; Prause, M.; Christensen, D.P.; et al. Regulation of the β-cell inflammasome and contribution to stress-induced cellular dysfunction and apoptosis. Mol. Cell. Endocrinol. 2018, 478, 106–114. [Google Scholar] [CrossRef]
- Roep, B.O.; Kleijwegt, F.S.; van Halteren, A.G.S.; Bonato, V.; Boggi, U.; Vendrame, F.; Marchetti, P.; Dotta, F. Islet in-flammation and CXCL10 in recent-onset type 1 diabetes. Clin. Exp. Immunol. 2010, 159, 338–343. [Google Scholar] [CrossRef]
- Colli, M.L.; Ramos-Rodríguez, M.; Nakayasu, E.S.; Alvelos, M.I.; Lopes, M.; Hill, J.L.E.; Turatsinze, J.V.; Coomans de Brachène, A.; Russell, M.A.; Raurell-Vila, H.; et al. An inte-grated multi-omics approach identifies the landscape of interferon-α-mediated responses of human pancreatic beta cells. Nat. Commun. 2020, 11, 2584. [Google Scholar] [CrossRef]
- Marselli, L.; Dotta, F.; Piro, S.; Santangelo, C.; Masini, M.; Lupi, R.; Realacci, M.; del Guerra, S.; Mosca, F.; Boggi, U.; et al. Th2 cytokines have a par-tial, direct protective effect on the function and survival of isolated human islets exposed to combined proinflammatory and Th1 cytokines. J. Clin. Endocrinol. Metab. 2001, 86, 4974–4978. [Google Scholar] [CrossRef]
- Patanè, G.; Piro, S.; Rabuazzo, A.M.; Anello, M.; Vigneri, R.; Purrello, F. Metformin restores insulin secretion altered by chronic exposure to free fatty acids or high glucose: A direct metformin ef-fect on pancreatic beta-cells. Diabetes 2000, 49, 735–740. [Google Scholar] [CrossRef] [PubMed] [Green Version]
- Simon-Szabó, L.; Kokas, M.; Mandl, J.; Kéri, G.; Csala, M. Metformin Attenuates Palmitate-Induced Endoplasmic Reticulum Stress, Serine Phosphorylation of IRS-1 and Apoptosis in Rat Insulinoma Cells. PLoS ONE 2014, 9, e97868. [Google Scholar] [CrossRef] [PubMed] [Green Version]
- Hashemitabar, M.; Bahramzadeh, S.; Saremy, S.; Nejaddehbashi, F. Glucose plus metformin compared with glucose alone on β-cell function in mouse pancreatic islets. Biomed. Rep. 2015, 3, 721–725. [Google Scholar] [CrossRef] [PubMed]
- Lundquist, I.; Mohammed Al-Amily, I.; Meidute Abaraviciene, S.; Salehi, A. Metformin Ame-liorates Dysfunctional Traits of Glibenclamide- and Glucose-Induced Insulin Secretion by Sup-pression of Imposed Overactivity of the Islet Nitric Oxide Synthase-NO System. PLoS ONE 2016, 11, e0165668. [Google Scholar] [CrossRef] [PubMed] [Green Version]
- Moon, J.S.; Karunakaran, U.; Elumalai, S.; Lee, I.-K.; Lee, H.W.; Kim, Y.-W. Metformin and pan-creatic beta cells. J. Diabetes Complicat. 2017, 31, 21–30. [Google Scholar] [CrossRef]
- Shen, X.; Fan, B.; Hu, X.; Luo, L.; Yan, Y.; Yang, L. Metformin Reduces Lipotoxicity-Induced Me-ta-Inflammation in β-Cells through the Activation of GPR40-PLC-IP3 Pathway. J. Diabetes Res. 2019, 2019, 7602427. [Google Scholar] [CrossRef] [PubMed] [Green Version]
- Lupi, R.; Del Guerra, S.; Fierabracci, V.; Marselli, L.; Novelli, M.; Patanè, G.; Boggi, U.; Mosca, F.; Piro, S.; Del Prato, S.; et al. Lipotoxicity in Human Pancreatic Islets and the Protective Effect of Metformin. Diabetes 2002, 51, S134–S137. [Google Scholar] [CrossRef] [Green Version]
- Marchetti, P.; Del Guerra, S.; Marselli, L.; Lupi, R.; Masini, M.; Pollera, M.; Bugliani, M.; Boggi, U.; Vistoli, F.; Mosca, F.; et al. Pancreatic islets from type 2 diabetic patients have functional defects and increased apoptosis that are amelio-rated by metformin. J. Clin. Endocrinol. Metab. 2004, 89, 5535–5541. [Google Scholar] [CrossRef] [PubMed] [Green Version]
- Masini, M.; Anello, M.; Bugliani, M.; Marselli, L.; Filipponi, F.; Boggi, U.; Purrello, F.; Occhipinti, M.; Martino, L.; Marchetti, P.; et al. Prevention by met-formin of alterations induced by chronic exposure to high glucose in human islet beta cells is associated with preserved ATP/ADP ratio. Diabetes Res. Clin. Pract. 2014, 104, 163–170. [Google Scholar] [CrossRef]
- Zhang, M.; Liu, Y.; Huan, Z.; Wang, Y.; Xu, J. Metformin protects chondrocytes against IL-1β in-duced injury by regulation of the AMPK/NF-κ B signaling pathway. Pharmazie 2020, 75, 632–636. [Google Scholar]
- Zhang, J.; Huang, L.; Shi, X.; Yang, L.; Hua, F.; Ma, J.; Zhu, W.; Liu, X.; Xuan, R.; Shen, Y.; et al. Metformin protects against myocardial ischemia-reperfusion injury and cell pyroptosis via AMPK/NLRP3 inflammasome pathway. Aging 2020, 12, 24270–24287. [Google Scholar] [CrossRef] [PubMed]
- Sun, J.; Huang, N.; Ma, W.; Zhou, H.; Lai, K. Protective effects of metformin on lipopolysaccha-ride induced airway epithelial cell injury via NF κB signaling inhibition. Mol. Med. Rep. 2019, 19, 1817–1823. [Google Scholar] [PubMed] [Green Version]
- Matallana-Surget, S.; Leroy, B.; Wattiez, R. Shotgun proteomics: Concept, key points and data mining. Expert Rev Proteom. 2010, 7, 5–7. [Google Scholar] [CrossRef] [PubMed] [Green Version]
- Alberio, T.; Pieroni, L.; Ronci, M.; Banfi, C.; Bongarzone, I.; Bottoni, P.; Brioschi, M.; Caterino, M.; Chinello, C.; Cormio, A.; et al. Toward the Standardi-zation of Mitochondrial Proteomics: The Italian Mitochondrial Human Proteome Project Initia-tive. J. Proteome Res. 2017, 16, 4319–4329. [Google Scholar] [CrossRef] [Green Version]
- Veschi, S.; Ronci, M.; Lanuti, P.; De Lellis, L.; Florio, R.; Bologna, G.; Scotti, L.; Carletti, E.; Brugnoli, F.; Di Bella, M.C.; et al. Integrative proteomic and functional analyses provide novel insights into the action of the repurposed drug candidate ni-troxoline in AsPC-1 cells. Sci. Rep. 2020, 10, 2574. [Google Scholar] [CrossRef]
- Chatterjee, S.; Khunti, K.; Davies, M.J. Type 2 diabetes. Lancet 2017, 389, 2239–2251. [Google Scholar] [CrossRef]
- Walker, J.T.; Saunders, D.C.; Brissova, M.; Powers, A.C. The Human Islet: Mini-Organ With Mega-Impact. Endocr. Rev. 2021, 42, 605–657. [Google Scholar] [CrossRef]
- Marchetti, P.; Dotta, F.; Lauro, D.; Purrello, F. An overview of pancreatic beta-cell defects in human type 2 diabetes: Implications for treatment. Regul. Pept. 2008, 146, 4–11. [Google Scholar] [CrossRef]
- Zhou, J.-Y.; Dann, G.P.; Liew, C.W.; Smith, R.D.; Kulkarni, R.N.; Qian, W.-J. Unraveling pancreatic islet biology by quantitative proteomics. Expert Rev. Proteom. 2011, 8, 495–504. [Google Scholar] [CrossRef]
- Sacco, F.; Seelig, A.; Humphrey, S.; Krahmer, N.; Volta, F.; Reggio, A.; Marchetti, P.; Gerdes, J.; Mann, M. Phosphoproteomics Reveals the GSK3-PDX1 Axis as a Key Pathogenic Signaling Node in Diabetic Islets. Cell Metab. 2019, 29, 1422–1432.e3. [Google Scholar] [CrossRef]
- Nakayasu, E.S.; Syed, F.; Tersey, S.A.; Gritsenko, M.A.; Mitchell, H.D.; Chan, C.Y.; Dirice, E.; Turatsinze, J.-V.; Cui, Y.; Kulkarni, R.N.; et al. Compre-hensive Proteomics Analysis of Stressed Human Islets Identifies GDF15 as a Target for Type 1 Diabetes Intervention. Cell Metab. 2020, 31, 363–374. [Google Scholar] [CrossRef] [PubMed]
- Marselli, L.; Piron, A.; Suleiman, M.; Colli, M.L.; Yi, X.; Khamis, A.; Carrat, G.R.; Rutter, G.A.; Bugliani, M.; Giusti, L.; et al. Persistent or Transient Human β Cell Dysfunction Induced by Metabolic Stress: Specific Signatures and Shared Gene Expression with Type 2 Diabetes. Cell Rep. 2020, 33, 108466. [Google Scholar] [CrossRef] [PubMed]
- Bugliani, M.; Tavarini, S.; Grano, F.; Tondi, S.; Lacerenza, S.; Giusti, L.; Ronci, M.; Maidecchi, A.; Marchetti, P.; Tesi, M.; et al. Protective effects of Stevia rebaudiana extracts on beta cells in lipotoxic conditions. Geol. Rundsch. 2021, 59, 113–126. [Google Scholar] [CrossRef] [PubMed]
- Brozzi, F.; Nardelli, T.R.; Lopes, M.; Millard, I.; Barthson, J.; Igoillo-Esteve, M.; Grieco, F.A.; Villate, O.; Oliveira, J.M.; Casimir, M.; et al. Cytokines in-duce endoplasmic reticulum stress in human, rat and mouse beta cells via different mechanisms. Diabetologia 2015, 58, 2307–2316. [Google Scholar] [CrossRef] [Green Version]
- Ramos-Rodríguez, M.; Raurell-Vila, H.; Colli, M.L.; Alvelos, M.I.; Subirana-Granés, M.; Juan-Mateu, J.; Norris, R.; Turatsinze, J.-V.; Nakayasu, E.S.; Webb-Robertson, E.-J.M.; et al. The impact of proinflammatory cytokines on the β-cell regulatory landscape provides in-sights into the genetics of type 1 diabetes. Nat. Genet 2019, 51, 1588–1595. [Google Scholar] [CrossRef]
- Lundh, M.; Bugliani, M.; Dahlby, T.; Chou, D.H.; Wagner, B.; Ghiasi, S.M.; De Tata, V.; Chen, Z.; Nissan Lund, M.; Davies, M.J.; et al. The immunopro-teasome is induced by cytokines and regulates apoptosis in human islets. J. Endocrinol. 2017, 233, 369–379. [Google Scholar] [CrossRef]
- Del Guerra, S.; Lupi, R.; Marselli, L.; Masini, M.; Bugliani, M.; Sbrana, S.; Torri, S.; Pollera, M.; Boggi, U.; Mosca, F.; et al. Functional and mo-lecular defects of pancreatic islets in human type 2 diabetes. Diabetes 2005, 54, 727–735. [Google Scholar] [CrossRef] [Green Version]
- Marchetti, P.; Bugliani, M.; Lupi, R.; Marselli, L.; Masini, M.; Boggi, U. The endoplasmic retic-ulum in pancreatic beta cells of type 2 diabetes patients. Diabetologia 2007, 50, 2486–2494. [Google Scholar] [CrossRef]
- Persaud, S.J.; Liu, B.; Jones, P.M. Functional Analysis of Human Islets of Langerhans Maintained in Culture. Methods Mol. Biol. 2011, 806, 55–71. [Google Scholar] [CrossRef]
- Pingitore, A.; Chambers, E.S.; Hill, T.; Ruz-Maldonado, I.; Liu, B.; Bewick, G.; Morrison, D.; Preston, T.; Wallis, G.A.; Tedford, C.; et al. The diet-derived short chain fatty acid propionate improves beta-cell function in humans and stimulates insulin secretion from human islets in vitro. Diabetes, Obes. Metab. 2016, 19, 257–265. [Google Scholar] [CrossRef] [Green Version]
- Ciregia, F.; Bugliani, M.; Ronci, M.; Giusti, L.L.; Boldrini, C.C.; Mazzoni, M.R.; Mossuto, S.S.; Grano, F.F.; Cnop, M.; Marselli, L.; et al. Palmitate-induced lipotoxicity alters acetylation of multiple proteins in clonal β cells and human pancreatic islets. Sci. Rep. 2017, 7, 13445. [Google Scholar] [CrossRef] [PubMed] [Green Version]
- Ciregia, F.; Giusti, L.; Ronci, M.; Bugliani, M.; Piga, I.; Pieroni, L.; Rossi, C.; Marchetti, P.; Urbani, A.; Lucacchini, A. Glucagon-like peptide 1 pro-tects INS-1E mitochondria against palmitate-mediated beta-cell dysfunction: A proteomic study. Mol. Biosyst. 2015, 11, 1696–1707. [Google Scholar] [CrossRef] [PubMed]
- Li, X.; Franz, T.; Atanassov, I.; Colby, T. Step-by-Step Sample Preparation of Proteins for Mass Spectrometric Analysis. Methods Mol. Biol. 2021, 2261, 13–23. [Google Scholar] [CrossRef]
- Zhou, Y.; Zhou, B.; Pache, L.; Chang, M.; Khodabakhshi, A.H.; Tanaseichuk, O.; Benner, C.; Chanda, S.K. Metascape provides a biologist-oriented resource for the analysis of systems-level datasets. Nat. Commun. 2019, 10, 1523. [Google Scholar] [CrossRef] [PubMed]
- Krämer, A.; Green, J.; Pollard, J., Jr.; Tugendreich, S. Causal analysis approaches in Ingenuity Pathway Analysis. Bioinformatics 2014, 30, 523–530. [Google Scholar] [CrossRef] [PubMed]
- Cox, J.; Mann, M. MaxQuant enables high peptide identification rates, individualized p.p.b.-range mass accuracies and proteome-wide protein quantification. Nat. Biotechnol. 2008, 26, 1367–1372. [Google Scholar] [CrossRef]
- Wolden-Kirk, H.; Rondas, D.; Bugliani, M.; Korf, H.; Van Lommel, L.; Brusgaard, K.; Christesen, H.T.; Schuit, F.; Proost, P.; Masini, M.; et al. Discov-ery of Molecular Pathways Mediating 1,25-Dihydroxyvitamin D3 Protection Against Cyto-kine-Induced Inflammation and Damage of Human and Male Mouse Islets of Langerhans. Endocrinology 2014, 155, 736–747. [Google Scholar] [CrossRef] [Green Version]
- Rondas, D.; Bugliani, M.; D’Hertog, W.; Lage, K.; Masini, M.; Waelkens, E.; Marchetti, P.; Mathieu, C.; Overbergh, L. Glucagon-Like Peptide-1 Protects Human Islets against Cytokine-Mediated β-Cell Dysfunction and Death: A Proteomic Study of the Pathways Involved. J. Proteome Res. 2013, 12, 4193–4206. [Google Scholar] [CrossRef] [Green Version]
- Gonzalez-Duque, S.; Azoury, M.E.; Colli, M.L.; Afonso, G.; Turatsinze, J.-V.; Nigi, L.; Lalanne, A.I.; Sebastiani, G.; Carré, A.; Pinto, S.; et al. Conven-tional and Neo-antigenic Peptides Presented by β Cells Are Targeted by Circulating Naïve CD8 T Cells in Type 1 Diabetic and Healthy Donors. Cell Metab. 2018, 28, 946–960.e6. [Google Scholar] [CrossRef] [Green Version]
- Wu, W.; Syed, F.; Simpson, E.; Lee, C.-C.; Liu, J.; Chang, G.; Dong, C.; Seitz, C.; Eizirik, D.L.; Mirmira, R.G.; et al. Impact of Proinflammatory Cytokines on Alternative Splicing Patterns in Human Islets. Diabetes 2021, 71, 116–127. [Google Scholar] [CrossRef]
- Zhang, J.; Zhang, L.; Zhang, S.; Yu, Q.; Xiong, F.; Huang, K.; Wang, C.-Y.; Yang, P. HMGB1, an innate alarmin, plays a critical role in chronic inflammation of adipose tissue in obesity. Mol. Cell. Endocrinol. 2017, 454, 103–111. [Google Scholar] [CrossRef] [PubMed]
- Zhang, J.; Chen, L.; Wang, F.; Zou, Y.; Li, J.; Luo, J.; Khan, F.; Sun, F.; Li, L.; Liu, J.; et al. Extracellular HMGB1 exacerbates auto-immune progression and recurrence of type 1 diabetes by impairing regulatory T cell stability. Diabetologia 2020, 63, 987–1001. [Google Scholar] [CrossRef] [PubMed] [Green Version]
- Saisho, Y. Metformin and Inflammation: Its Potential Beyond Glucose-lowering Effect. Endocrine, Metab. Immune Disord. Drug Targets 2015, 15, 196–205. [Google Scholar] [CrossRef] [PubMed]
- Kristófi, R.; Eriksson, J.W. Metformin as an anti-inflammatory agent: A short review. J. Endocrinol. 2021, 251, R11–R22. [Google Scholar] [CrossRef]
- Yang, X.; Xu, Z.; Zhang, C.; Cai, Z.; Zhang, J. Metformin, beyond an insulin sensitizer, targeting heart and pancreatic β cells. Biochim. Biophys. Acta Mol. Basis Dis. 2017, 1863, 1984–1990. [Google Scholar] [CrossRef]
- Huang, H.; Lorenz, B.R.; Zelmanovitz, P.H.; Chan, C.B. Metformin Preserves β-Cell Compensation in Insulin Secretion and Mass Expansion in Prediabetic Nile Rats. Int. J. Mol. Sci. 2021, 22, 421. [Google Scholar] [CrossRef]
- Apostolova, N.; Iannantuoni, F.; Gruevska, A.; Muntane, J.; Rocha, M.; Victor, V.M. Mechanisms of action of metformin in type 2 diabetes: Effects on mitochondria and leukocyte-endothelium in-teractions. Redox Biol. 2020, 34, 101517. [Google Scholar] [CrossRef]
- Vaziri, N.D.; Rodríguez-Iturbe, B. Mechanisms of Disease: Oxidative stress and inflammation in the pathogenesis of hypertension. Nat. Clin. Pr. Nephrol. 2006, 2, 582–593. [Google Scholar] [CrossRef]
- Lugrin, J.; Rosenblatt-Velin, N.; Parapanov, R.; Liaudet, L. The role of oxidative stress during in-flammatory processes. Biol. Chem. 2014, 395, 203–230. [Google Scholar] [CrossRef] [Green Version]
- Hayes, J.D.; Flanagan, J.U.; Jowsey, I.R. Glutathione transferases. Annu. Rev. Pharmacol. Toxicol. 2005, 45, 51–88. [Google Scholar] [CrossRef]
- Perkins, A.; Nelson, K.J.; Parsonage, D.; Poole, L.B.; Karplus, P.A. Peroxiredoxins: Guardians against oxidative stress and modulators of peroxide signaling. Trends Biochem. Sci. 2015, 40, 435–445. [Google Scholar] [CrossRef] [PubMed] [Green Version]
- Hotta, M.; Tashiro, F.; Ikegami, H.; Niwa, H.; Ogihara, T.; Yodoi, J.; Miyazaki, J.-I. Pancreatic β Cell–specific Expression of Thioredoxin, an Antioxidative and Antiapoptotic Protein, Prevents Autoimmune and Streptozotocin-induced Diabetes. J. Exp. Med. 1998, 188, 1445–1451. [Google Scholar] [CrossRef] [PubMed] [Green Version]
- Yamamoto, M.; Yamato, E.; Shu-Ichi, T.; Tashiro, F.; Ikegami, H.; Yodoi, J.; Miyazaki, J.-I. Transgenic Expression of Antioxidant Protein Thioredoxin in Pancreatic β Cells Prevents Progression of Type 2 Diabetes Mellitus. Antioxid. Redox Signal 2008, 10, 43–50. [Google Scholar] [CrossRef] [PubMed]
- Stancill, J.S.; Broniowska, K.A.; Oleson, B.J.; Naatz, A.; Corbett, J.A. Pancreatic β-cells detoxify H2O2 through the peroxiredoxin/thioredoxin antioxidant system. J. Biol. Chem. 2019, 294, 4843–4853. [Google Scholar] [CrossRef] [Green Version]
- Stancill, J.S.; Corbett, J.A. The Role of Thioredoxin/Peroxiredoxin in the β-Cell Defense Against Oxidative Damage. Front. Endocrinol. 2021, 12, 718253. [Google Scholar] [CrossRef]
- Stancill, J.S.; Happ, J.T.; Broniowska, K.A.; Hogg, N.; Corbett, J.A. Peroxiredoxin 1 plays a primary role in protecting pancreatic β-cells from hydrogen peroxide and peroxynitrite. Am. J. Physiol. Integr. Comp. Physiol. 2020, 318, R1004–R1013. [Google Scholar] [CrossRef]
- Vial, G.; Detaille, D.; Guigas, B. Role of Mitochondria in the Mechanism(s) of Action of Met-formin. Front Endocrinol. 2019, 10, 294. [Google Scholar] [CrossRef] [Green Version]
- Ursini, F.; Russo, E.; Pellino, G.; D’Angelo, S.; Chiaravalloti, A.; De Sarro, G.; Manfredini, R.; De Giorgio, R. Metformin and Autoimmunity: A “New Deal” of an Old Drug. Front Immunol. 2018, 9, 1236. [Google Scholar] [CrossRef] [Green Version]
- Wang, D.; Quan, Y.; Yan, Q.; Morales, J.E.; Wetsel, R.A. Targeted Disruption of the β2-Microglobulin Gene Minimizes the Immunogenicity of Human Embryonic Stem Cells. Stem Cells Transl. Med. 2015, 4, 1234–1245. [Google Scholar] [CrossRef]
- Castro-Gutierrez, R.; Alkanani, A.; Mathews, C.E.; Michels, A.; Russ, H.A. Protecting Stem Cell Derived Pancreatic Beta-Like Cells From Diabetogenic T Cell Recognition. Front. Endocrinol. 2021, 12, 707881. [Google Scholar] [CrossRef]
- Richardson, S.J.; Rodriguez-Calvo, T.; Gerling, I.C.; Mathews, C.E.; Kaddis, J.S.; Russell, M.A.; Zeissler, M.; Leete, P.; Krogvold, L.; Dahl-Jørgensen, K.; et al. Islet cell hyperexpression of HLA class I antigens: A defining feature in type 1 diabetes. Diabetologia 2016, 59, 2448–2458. [Google Scholar] [CrossRef] [PubMed] [Green Version]
- Cirulli, V.; Zalatan, J.; McMaster, M.; Prinsen, R.; Salomon, D.R.; Ricordi, C.; Torbett, B.E.; Meda, P.; Crisa, L. The class I HLA repertoire of pancreatic islets comprises the nonclassical class Ib anti-gen HLA-G. Diabetes 2006, 55, 1214–1222. [Google Scholar] [CrossRef] [PubMed] [Green Version]
- Martín-Villa, J.M.; Vaquero-Yuste, C.; Molina-Alejandre, M.; Juarez, I.; Suárez-Trujillo, F.; López-Nares, A.; Palacio-Gruber, J.; Barrera-Gutiérrez, L.; Fernández-Cruz, E.; Rodríguez-Sainz, C.; et al. HLA-G: Too Much or Too Little? Role in Cancer and Autoimmune Disease. Front. Immunol. 2022, 13, 796054. [Google Scholar] [CrossRef] [PubMed]
- Babaie, F.; Hosseinzadeh, R.; Ebrazeh, M.; Seyfizadeh, N.; Aslani, S.; Salimi, S.; Hemmatzadeh, M.; Azizi, G.; Jadidi-Niaragh, F.; Mohammadi, H. The roles of ERAP1 and ERAP2 in autoimmunity and cancer immunity: New insights and perspective. Mol. Immunol. 2020, 121, 7–19. [Google Scholar] [CrossRef] [PubMed]
- Arunachalam, B.; Phan, U.T.; Geuze, H.J.; Cresswell, P. Enzymatic reduction of disulfide bonds in lysosomes: Characterization of a Gamma-interferon-inducible lysosomal thiol reductase (GILT). Proc. Natl. Acad. Sci. USA 2000, 97, 745–750. [Google Scholar] [CrossRef] [Green Version]
- Ewanchuk, B.W.; Yates, R.M. The phagosome and redox control of antigen processing. Free Radic. Biol. Med. 2018, 125, 53–61. [Google Scholar] [CrossRef]
- De Castro, J.A.L.; Stratikos, E. Intracellular antigen processing by ERAP2: Molecular mechanism and roles in health and disease. Hum. Immunol. 2019, 80, 310–317. [Google Scholar] [CrossRef]
- Van den Elsen, P.J.; Gobin, S.J.; van Eggermond, M.C.; Peijnenburg, A. Regulation of MHC class I and II gene transcription: Differences and similarities. Immunogenetics 1998, 48, 208–221. [Google Scholar] [CrossRef]
- Compagnone, M.; Cifaldi, L.; Fruci, D. Regulation of ERAP1 and ERAP2 genes and their disfunction in human cancer. Hum. Immunol. 2019, 80, 318–324. [Google Scholar] [CrossRef]
- Wang, T.Y.; Liu, X.J.; Xie, J.Y.; Yuan, Q.Z.; Wang, Y. Cask methylation involved in the injury of insulin secretion function caused by interleukin1-β. J. Cell Mol. Med. 2020, 24, 14247–14256. [Google Scholar] [CrossRef]
- Gurzov, E.N.; Ortis, F.; Bakiri, L.; Wagner, E.F.; Eizirik, D.L. JunB Inhibits ER Stress and Apoptosis in Pancreatic Beta Cells. PLoS ONE 2008, 3, e3030. [Google Scholar] [CrossRef] [PubMed]
- Wang, Y.; Lin, H.; Hao, N.; Zhu, Z.; Wang, D.; Li, Y.; Chen, H.; Zhu, Y.; Han, X. Forkhead box O1 mediates defects in palmitate-induced insulin granule exocytosis by downregulation of calcium/calmodulin-dependent serine protein kinase expression in INS-1 cells. Diabetologia 2015, 58, 1272–1281. [Google Scholar] [CrossRef] [PubMed] [Green Version]
- Gurzov, E.N.; Barthson, J.; Marhfour, I.; Ortis, F.; Naamane, N.; Igoillo-Esteve, M.; Gysemans, C.; Mathieu, C.; Kitajima, S.; Marchetti, P.; et al. Pancreatic β-cells activate a JunB/ATF3-dependent survival pathway during inflammation. Oncogene 2011, 31, 1723–1732. [Google Scholar] [CrossRef] [PubMed] [Green Version]
- Kulkarni, A.S.; Gubbi, S.; Barzilai, N. Benefits of Metformin in Attenuating the Hallmarks of Aging. Cell Metab. 2020, 32, 15–30. [Google Scholar] [CrossRef] [PubMed]
- Jaafar, R.; Tran, S.; Shah, A.N.; Sun, G.; Valdearcos, M.; Marchetti, P.; Masini, M.; Swisa, A.; Giacometti, S.; Bernal-Mizrachi, E.; et al. mTORC1-to-AMPK switching underlies β cell metabolic plasticity during maturation and diabetes. J. Clin. Investig. 2019, 129, 4124–4137. [Google Scholar] [CrossRef] [Green Version]
- Morita, M.; Gravel, S.-P.; Hulea, L.; Larsson, O.; Pollak, M.; St-Pierre, J.; Topisirovic, I. mTOR coordinates protein synthesis, mitochondrial activity and proliferation. Cell Cycle 2015, 14, 473–480. [Google Scholar] [CrossRef] [Green Version]
- Kim, Y.C.; Guan, K.-L. mTOR: A pharmacologic target for autophagy regulation. J. Clin. Investig. 2015, 125, 25–32. [Google Scholar] [CrossRef] [Green Version]
- Rivera, J.F.; Costes, S.; Gurlo, T.; Glabe, C.G.; Butler, P.C. Autophagy defends pancreatic β cells from human islet amyloid polypeptide-induced toxicity. J. Clin. Investig. 2014, 124, 3489–3500. [Google Scholar] [CrossRef] [Green Version]
- Sheng, Q.; Xiao, X.; Prasadan, K.; Chen, C.; Ming, Y.; Fusco, J.; Gangopadhyay, N.N.; Ricks, D.; Gittes, G.K. Autophagy protects pancreatic beta cell mass and function in the setting of a high-fat and high-glucose diet. Sci. Rep. 2017, 7, 16348. [Google Scholar] [CrossRef]
- Bugliani, M.; Mossuto, S.; Grano, F.; Suleiman, M.; Marselli, L.; Boggi, U.; De Simone, P.; Eizirik, D.L.; Cnop, M.; Marchetti, P.; et al. Modulation of Au-tophagy Influences the Function and Survival of Human Pancreatic Beta Cells Under Endoplas-mic Reticulum Stress Conditions and in Type 2 Diabetes. Front Endocrinol. 2019, 10, 52. [Google Scholar] [CrossRef] [Green Version]
- Lambelet, M.; Terra, L.F.; Fukaya, M.; Meyerovich, K.; Labriola, L.; Cardozo, A.K.; Allagnat, F. Dysfunc-tional autophagy following exposure to pro-inflammatory cytokines contributes to pancreatic β-cell apoptosis. Cell Death Dis. 2018, 9, 96. [Google Scholar] [CrossRef] [PubMed]
- Aguayo-Mazzucato, C.; Andle, J.; Lee, T.B., Jr.; Midha, A.; Talemal, L.; Chipashvili, V.; Hollister-Lock, J.; van Deursen, J.; Weir, G.; Bonner-Weir, S. Accel-eration of β Cell Aging Determines Diabetes and Senolysis Improves Disease Outcomes. Cell Metab. 2019, 30, 129–142.e4. [Google Scholar] [CrossRef] [PubMed]
- Thompson, P.J.; Shah, A.; Ntranos, V.; Van Gool, F.; Atkinson, M.; Bhushan, A. Targeted Elimination of Senescent Beta Cells Prevents Type 1 Diabetes. Cell Metab. 2019, 29, 1045–1060.e10. [Google Scholar] [CrossRef] [PubMed]
- Aguayo-Mazzucato, C. Functional changes in beta cells during ageing and senescence. Diabetologia 2020, 63, 2022–2029. [Google Scholar] [CrossRef] [PubMed]
- Benninger, R.K.P.; Kravets, V. The physiological role of β-cell heterogeneity in pancreatic islet function. Nat. Rev. Endocrinol. 2021, 18, 9–22. [Google Scholar] [CrossRef]


| ID | Protein Name | Gene | Cyt/Ctrl | Cyt + Met/Ctrl |
|---|---|---|---|---|
| Apoptosis | ||||
| O95140 | MITOFUSIN-2 (PTHR10465:SF1) | MFN2 | 0.01 | 0.01 |
| Q9H1Y0 | AUTOPHAGY PROTEIN 5 (PTHR13040:SF2) | ATG5 | 0.01 | 0.01 |
| Q9NR28 | DIABLO HOMOLOG, MITOCHONDRIAL (PTHR32247:SF3) | DIABLO | 0.23 | 0.95 |
| Q13813 | SPECTRIN ALPHA CHAIN, NON-ERYTHROCYTIC 1 (PTHR11915:SF427) | SPTAN1 | 0.54 | 0.15 |
| Q13501 | SEQUESTOSOME-1 (PTHR15090:SF0) | SQSTM1 | 2.06 | 1.8 |
| Cytoskeleton, vesicle motility/intracellular transport/vesicle release | ||||
| P13637 | SODIUM/POTASSIUM-TRANSPORTING ATPASE SUBUNIT ALPHA-3 (PTHR43294:SF15) | ATP1A3 | 0.01 | 0.01 |
| Q5D862 | FILAGGRIN-2 (PTHR22571:SF24) | FLG2 | 0.01 | 0.01 |
| Q6KB66 | KERATIN, TYPE II CYTOSKELETAL 80 (PTHR45616:SF1) | KRT80 | 0.01 | 0.01 |
| Q86YZ3 | HORNERIN (PTHR22571:SF25) | HRNR | 0.01 | 0.27 |
| Q8IV36 | PROTEIN HID1 (PTHR21575:SF12) | HID1 | 0.01 | 0.01 |
| Q8N1N4 | KERATIN, TYPE II CYTOSKELETAL 78 (PTHR45616:SF18) | KRT78 | 0.01 | 0.01 |
| Q99442 | TRANSLOCATION PROTEIN SEC62 (PTHR12443:SF9) | SEC62 | 0.01 | 0.01 |
| Q01995 | TRANSGELIN (PTHR18959:SF40) | TAGLN | 0.09 | 1.11 |
| P61204 | ADP-RIBOSYLATION FACTOR 3 (PTHR11711:SF316) | ARF3 | 0.1 | 0.98 |
| Q06141 | REGENERATING ISLET-DERIVED PROTEIN 3-ALPHA (PTHR22803:SF123) | REG3A | 0.18 | 0.12 |
| O94875 | SORBIN AND SH3 DOMAIN-CONTAINING PROTEIN 2 (PTHR14167:SF56) | SORBS2 | 0.19 | 0.2 |
| Q9BVK6 | TRANSMEMBRANE EMP24 DOMAIN-CONTAINING PROTEIN 9 (PTHR22811:SF37) | TMED9 | 0.2 | 0.85 |
| P08670 | VIMENTIN (PTHR45652:SF5) | VIM | 0.32 | 0.32 |
| P61106 | RAS-RELATED PROTEIN RAB-14 (PTHR24073:SF185) | RAB14 | 0.35 | 1.59 |
| Q14019 | COACTOSIN-LIKE PROTEIN (PTHR10829:SF29) | COTL1 | 1.14 | 0.4 |
| Q969Q5 | RAS-RELATED PROTEIN RAB-24 (PTHR24073:SF471) | RAB24 | 1.89 | 2.53 |
| P07737 | PROFILIN-1 (PTHR13936:SF14) | PFN1 | 4.98 | 17.49 |
| Q9BQE5 | APOLIPOPROTEIN L2 (PTHR14096:SF27) | APOL2 | 6.47 | 5.93 |
| actin and actin related protein or actin-binding protein | ||||
| Q9BYX7 | BETA-ACTIN-LIKE PROTEIN 3-RELATED (PTHR11937:SF278) | POTEKP | 0.01 | 0.01 |
| P68032 | ACTIN, ALPHA CARDIAC MUSCLE 1 (PTHR11937:SF176) | ACTC1 | 0.32 | 0.09 |
| P60660 | MYOSIN LIGHT POLYPEPTIDE 6 (PTHR23048:SF7) | MYL6 | 1.69 | 0.43 |
| P63261 | ACTIN, CYTOPLASMIC 2 (PTHR11937:SF414) | ACTG1 | 2 | 2.15 |
| O43795 | UNCONVENTIONAL MYOSIN-IB (PTHR13140:SF277) | MYO1B | 2.98 | 3 |
| intercellular signal molecule | ||||
| P02751 | FIBRONECTIN (PTHR19143:SF267) | FN1 | 0.01 | 0.01 |
| O15240 | NEUROSECRETORY PROTEIN VGF (PTHR15159:SF2) | VGF | 1.76 | 1.94 |
| tubulin | ||||
| Q9NRH3 | TUBULIN GAMMA-2 CHAIN (PTHR11588:SF79) | TUBG2 | 0.01 | 0.01 |
| Q71U36 | TUBULIN ALPHA-1A CHAIN (PTHR11588:SF133) | TUBA1A | 1.27 | |
| small GTPase | ||||
| P62826 | GTP-BINDING NUCLEAR PROTEIN RAN (PTHR24071:SF23) | RAN | 0.39 | 1.48 |
| P11233 | RAS-RELATED PROTEIN RAL-A (PTHR24070:SF174) | RALA | 1.98 | 0.62 |
| P11234 | RAS-RELATED PROTEIN RAL-B (PTHR24070:SF199) | RALB | 5.02 | 2.86 |
| Defense repair/immune response/Signaling in Immune system | ||||
| P05451 | LITHOSTATHINE-1-ALPHA (PTHR22803:SF105) | REG1A | 0.42 | 0.27 |
| P10599 | THIOREDOXIN (PTHR10438:SF18) | TXN | 1.79 | 2.26 |
| Q06323 | PROTEASOME ACTIVATOR COMPLEX SUBUNIT 1 (PTHR10660:SF5) | PSME1 | 1.99 | 1.78 |
| Q9Y6N5 | SULFIDE:QUINONE OXIDOREDUCTASE, MITOCHONDRIAL (PTHR10632:SF2) | SQOR | 2.1 | 3.46 |
| O15533 | TAPASIN (PTHR23411:SF22) | TAPBP | 3.97 | 6.54 |
| P13164 | INTERFERON-INDUCED TRANSMEMBRANE PROTEIN 1 (PTHR13999:SF6) | IFITM1 | 4.8 | 4.98 |
| P05362 | INTERCELLULAR ADHESION MOLECULE 1 (PTHR13771:SF9) | ICAM1 | 24.83 | 23.94 |
| P00751 | COMPLEMENT FACTOR B (PTHR46393:SF1) | CFB | 32.89 | 29.22 |
| P14174 | MACROPHAGE MIGRATION INHIBITORY FACTOR (PTHR11954:SF6) | MIF | 34.9 | 51.02 |
| P05161 | UBIQUITIN-LIKE PROTEIN ISG15 (PTHR10666:SF267) | ISG15 | 45.7 | 52.83 |
| Q10589 | BONE MARROW STROMAL ANTIGEN 2 (PTHR15190:SF1) | BST2 | 56.28 | 55.56 |
| O14879 | INTERFERON-INDUCED PROTEIN WITH TETRATRICOPEPTIDE REPEATS 3 (PTHR10271:SF3) | IFIT3 | 69.33 | 64.83 |
| P09913 | INTERFERON-INDUCED PROTEIN WITH TETRATRICOPEPTIDE REPEATS 2 (PTHR10271:SF4) | IFIT2 | 100 | 100 |
| Q96AZ6 | INTERFERON-STIMULATED GENE 20 KDA PROTEIN (PTHR12801:SF59) | ISG20 | 100 | 96.33 |
| peroxidase | ||||
| P30048 | THIOREDOXIN-DEPENDENT PEROXIDE REDUCTASE, MITOCHONDRIAL (PTHR42801:SF4) | PRDX3 | 0.18 | 0.95 |
| P32119 | PEROXIREDOXIN-2 (PTHR10681:SF161) | PRDX2 | 0.34 | 1.02 |
| P30044 | PEROXIREDOXIN-5, MITOCHONDRIAL (PTHR10430:SF16) | PRDX5 | 0.46 | 1.8 |
| P30041 | PEROXIREDOXIN-6 (PTHR43503:SF11) | PRDX6 | 0.79 | 0.14 |
| Q06830 | PEROXIREDOXIN-1 (PTHR10681:SF111) | PRDX1 | 2.2 | 1.86 |
| oxidase/oxidoreductase | ||||
| O14618 | COPPER CHAPERONE FOR SUPEROXIDE DISMUTASE (PTHR10003:SF88) | CCS | 0.23 | 0.01 |
| Q9NRD8 | DUAL OXIDASE 2 (PTHR11972:SF67) | DUOX2 | 5.2 | 3.26 |
| P04179 | SUPEROXIDE DISMUTASE [MN], MITOCHONDRIAL (PTHR11404:SF6) | SOD2 | 6.39 | 5.12 |
| P00450 | CERULOPLASMIN (PTHR11709:SF226) | CP | 21.87 | 21.33 |
| P13284 | GAMMA-INTERFERON-INDUCIBLE LYSOSOMAL THIOL REDUCTASE (PTHR13234:SF8) | IFI30 | 38.02 | 6.53 |
| heterotrimeric G-protein | ||||
| P32456 | GUANYLATE-BINDING PROTEIN 2 (PTHR10751:SF112) | GBP2 | 64.5 | 69 |
| Q96PP8 | GUANYLATE-BINDING PROTEIN 5 (PTHR10751:SF40) | GBP5 | 69.41 | 55.56 |
| P32455 | GUANYLATE-BINDING PROTEIN 1 (PTHR10751:SF96) | GBP1 | 72 | 72.8 |
| Q96PP9 | GUANYLATE-BINDING PROTEIN 4 (PTHR10751:SF17) | GBP4 | 100 | 100 |
| chemokine | ||||
| P09341 | GROWTH-REGULATED ALPHA PROTEIN (PTHR10179:SF69) | CXCL1 | 11.21 | 21.38 |
| P78556 | C-C MOTIF CHEMOKINE 20 (PTHR12015:SF108) | CCL20 | 57.22 | 55.56 |
| P19875 | C-X-C MOTIF CHEMOKINE 2 (PTHR10179:SF80) | CXCL2 | 58.95 | 70 |
| P02778 | C-X-C MOTIF CHEMOKINE 10 (PTHR10179:SF47) | CXCL10 | 100 | 100 |
| membrane traffic protein | ||||
| Q03169 | TUMOR NECROSIS FACTOR ALPHA-INDUCED PROTEIN 2 (PTHR21292:SF4) | TNFAIP2 | 4.78 | 6.27 |
| P20591 | INTERFERON-INDUCED GTP-BINDING PROTEIN MX1 (PTHR11566:SF51) | MX1 | 39.72 | 43.43 |
| ATP-binding cassette (ABC) transporter | ||||
| Q03518 | ANTIGEN PEPTIDE TRANSPORTER 1 (PTHR24221:SF249) | TAP1 | 10.59 | 9.41 |
| Q03519 | ANTIGEN PEPTIDE TRANSPORTER 2 (PTHR24221:SF237) | TAP2 | 13.9 | 11.72 |
| Cytokine and Interferon Signaling in Immune system | ||||
| P10145 | INTERLEUKIN-8 (PTHR10179:SF42) | CXCL8 | 17.68 | 19.64 |
| major histocompatibility complex protein | ||||
| P04439 | HLA CLASS I HISTOCOMPATIBILITY ANTIGEN, A ALPHA CHAIN (HUMAN LEUKOCYTE ANTIGEN A) (HLA-A) | HLA-A | 0 | 100 |
| P61769 | BETA-2-MICROGLOBULIN (PTHR19944:SF62) | B2M | 2.74 | 1.68 |
| P01911 | HLA CLASS II HISTOCOMPATIBILITY ANTIGEN, DRB1-15 BETA CHAIN (PTHR19944:SF99) | HLA-DRB1 | 14.79 | 15.21 |
| P10321 | HLA CLASS I HISTOCOMPATIBILITY ANTIGEN, C ALPHA CHAIN (HLA-C) (HLA-CW) | HLA-C | 37.18 | 11.22 |
| P01903 | HLA CLASS II HISTOCOMPATIBILITY ANTIGEN, DR ALPHA CHAIN (PTHR19944:SF63) | HLA-DRA | 51.82 | 51.11 |
| P01889 | HLA CLASS I HISTOCOMPATIBILITY ANTIGEN, B ALPHA CHAIN | HLA-B | 100 | 0 |
| Metabolism | ||||
| P09601 | HEME OXYGENASE 1 (PTHR10720:SF1) | HMOX1 | 0.01 | 0.01 |
| P34059 | N-ACETYLGALACTOSAMINE-6-SULFATASE (PTHR42693:SF33) | GALNS | 0.01 | 0.01 |
| P16233 | PANCREATIC TRIACYLGLYCEROL LIPASE (PTHR11610:SF115) | PNLIP | 0.21 | 0.38 |
| P04054 | PHOSPHOLIPASE A2 (PTHR11716:SF94) | PLA2G1B | 0.33 | 0.01 |
| Q8NCW5 | NAD(P)H-HYDRATE EPIMERASE (PTHR13232:SF11) | NAXE | 0.41 | 0.12 |
| Q9H2U2 | INORGANIC PYROPHOSPHATASE 2, MITOCHONDRIAL (PTHR10286:SF49) | PPA2 | 0.69 | 0.11 |
| P47985 | CYTOCHROME B-C1 COMPLEX SUBUNIT RIESKE, MITOCHONDRIAL-RELATED (PTHR10134:SF20) | UQCRFS1 | 1.55 | 2.83 |
| P15954 | CYTOCHROME C OXIDASE SUBUNIT 7C, MITOCHONDRIAL (PTHR13313:SF1) | COX7C | 2.42 | 3.84 |
| P19971 | THYMIDINE PHOSPHORYLASE (PTHR10515:SF0) | TYMP | 5.68 | 6.01 |
| ATP synthase | ||||
| P06576 | ATP SYNTHASE SUBUNIT BETA, MITOCHONDRIAL (PTHR15184:SF58) | ATP5F1B | 0.28 | 0.52 |
| P48047 | ATP SYNTHASE SUBUNIT O, MITOCHONDRIAL (PTHR11910:SF1) | ATP5PO | 0.65 | 1.11 |
| kinase | ||||
| P07205 | PHOSPHOGLYCERATE KINASE 2 (PTHR11406:SF10) | PGK2 | 0.01 | 0.01 |
| Q6ZUJ8 | PHOSPHOINOSITIDE 3-KINASE ADAPTER PROTEIN 1 (PTHR16267:SF12) | PIK3AP1 | 2.89 | 2.79 |
| P14618 | PYRUVATE KINASE PKM (PTHR11817:SF15) | PKM | 6.41 | 0.47 |
| P32189 | GLYCEROL KINASE (PTHR10196:SF56) | GK | 52.08 | 52.06 |
| dehydrogenase | ||||
| P15559 | NAD(P)H DEHYDROGENASE [QUINONE] 1 (PTHR10204:SF1) | NQO1 | 0.31 | 0.25 |
| P04406 | GLYCERALDEHYDE-3-PHOSPHATE DEHYDROGENASE (PTHR10836:SF111) | GAPDH | 0.33 | 0.86 |
| Q8NBQ5 | ESTRADIOL 17-BETA-DEHYDROGENASE 11 (PTHR24322:SF489) | HSD17B11 | 0.5 | 0.04 |
| P40926 | MALATE DEHYDROGENASE, MITOCHONDRIAL (PTHR11540:SF16) | MDH2 | 0.51 | 0.15 |
| P47989 | XANTHINE DEHYDROGENASE/OXIDASE (PTHR11908:SF80) | XDH | 60.25 | 62.5 |
| P14902 | INDOLEAMINE 2,3-DIOXYGENASE 1 (PTHR28657:SF2) | IDO1 | 100 | 100 |
| isomerase | ||||
| Q13907 | ISOPENTENYL-DIPHOSPHATE DELTA-ISOMERASE 1 (PTHR10885:SF5) | IDI1 | 0.5 | 0.01 |
| P60174 | TRIOSEPHOSPHATE ISOMERASE (PTHR21139:SF24) | TPI1 | 1.29 | 0.18 |
| transferase | ||||
| P51580 | THIOPURINE S-METHYLTRANSFERASE (PTHR10259:SF11) | TPMT | 0.01 | 0.01 |
| P08263 | GLUTATHIONE S-TRANSFERASE A1 (PTHR11571:SF157) | GSTA1 | 0.29 | 0.62 |
| P09210 | GLUTATHIONE S-TRANSFERASE A2 (PTHR11571:SF243) | GSTA2 | 0.31 | 0.62 |
| Q99735 | MICROSOMAL GLUTATHIONE S-TRANSFERASE 2 (PTHR10250:SF13) | MGST2 | 0.36 | 0.21 |
| P24752 | ACETYL-COA ACETYLTRANSFERASE, MITOCHONDRIAL (PTHR18919:SF156) | ACAT1 | 0.43 | 0.86 |
| Q14749 | GLYCINE N-METHYLTRANSFERASE (PTHR16458:SF2) | GNMT | 0.44 | 0.01 |
| P40261 | NICOTINAMIDE N-METHYLTRANSFERASE (PTHR10867:SF37) | NNMT | 1.99 | 2.17 |
| P43490 | NICOTINAMIDE PHOSPHORIBOSYLTRANSFERASE (PTHR43816:SF1) | NAMPT | 2.33 | 2.55 |
| P21980 | PROTEIN-GLUTAMINE GAMMA-GLUTAMYLTRANSFERASE 2 (PTHR11590:SF6) | TGM2 | 3.39 | 2.62 |
| reductase | ||||
| P30043 | FLAVIN REDUCTASE (NADPH) (PTHR43355:SF2) | BLVRB | 0.36 | 1.45 |
| P52895 | ALDO-KETO REDUCTASE FAMILY 1 MEMBER C1-RELATED (PTHR11732:SF153) | AKR1C2 | 2.87 | 2.21 |
| Protein synthesis, modification, folding, secretion, degradation | ||||
| Q32P28 | PROLYL 3-HYDROXYLASE 1 (PTHR14049:SF5) | P3H1 | 0.01 | 0.01 |
| Q96JB6 | LYSYL OXIDASE HOMOLOG 4 (PTHR45817:SF5) | LOXL4 | 0.01 | 0.01 |
| P61278 | SOMATOSTATIN (PTHR10558:SF2) | SST | 0.26 | 0.01 |
| P16870 | CARBOXYPEPTIDASE E (PTHR11532:SF62) | CPE | 0.59 | 0.42 |
| P10909 | CLUSTERIN (PTHR10970:SF1) | CLU | 0.63 | 0.21 |
| P07237 | PROTEIN DISULFIDE-ISOMERASE (PTHR18929:SF101) | P4HB | 1.2 | 0.42 |
| P01275 | GLUCAGON (PTHR11418:SF0) | GCG | 1.9 | 0.73 |
| P26885 | PEPTIDYL-PROLYL CIS-TRANS ISOMERASE FKBP2 (PTHR45779:SF3) | FKBP2 | 1.98 | 0.67 |
| P28062 | PROTEASOME SUBUNIT BETA TYPE-8 (PTHR11599:SF53) | PSMB8 | 2.06 | 2.47 |
| P11021 | ENDOPLASMIC RETICULUM CHAPERONE BIP (PTHR19375:SF380) | HSPA5 | 2.18 | 1.39 |
| Q00653 | NUCLEAR FACTOR NF-KAPPA-B P100 SUBUNIT (DNA-BINDING FACTOR KBF2) (H2TF1)] | NFKB2 | 3.28 | 2.9 |
| Q9UL46 | PROTEASOME ACTIVATOR COMPLEX SUBUNIT 2 (PTHR10660:SF6) | PSME2 | 3.7 | 3.51 |
| P10645 | CHROMOGRANIN-A (CgA) | CHGA | 3.86 | 5.24 |
| P29590 | PROTEIN PML (PTHR25462:SF241) | PML | 4.64 | 4.39 |
| P28065 | PROTEASOME SUBUNIT BETA TYPE-9 (PTHR11599:SF50) | PSMB9 | 6.02 | 5.32 |
| P40306 | PROTEASOME SUBUNIT BETA TYPE-10 (PTHR11599:SF41) | PSMB10 | 10.69 | 13.67 |
| P01833 | POLYMERIC IMMUNOGLOBULIN RECEPTOR (PTHR11860:SF82) | PIGR | 19 | 15.97 |
| O15205 | UBIQUITIN D (PTHR47731:SF1) | UBD | 62.5 | 55.63 |
| metalloprotease | ||||
| Q99797 | MITOCHONDRIAL INTERMEDIATE PEPTIDASE (PTHR11804:SF5) | MIPEP | 0.01 | 0.01 |
| Q6P179 | ENDOPLASMIC RETICULUM AMINOPEPTIDASE 2 (PTHR11533:SF239) | ERAP2 | 3.56 | 35.71 |
| P28838 | CYTOSOL AMINOPEPTIDASE (PTHR11963:SF39) | LAP3 | 6.61 | 7.38 |
| cysteine protease | ||||
| P09936 | UBIQUITIN CARBOXYL-TERMINAL HYDROLASE ISOZYME L1 (PTHR10589:SF19) | UCHL1 | 0.62 | 0.22 |
| P25774 | CATHEPSIN S (PTHR12411:SF525) | CTSS | 4.99 | 5.02 |
| serine protease | ||||
| Q9ULP0 | PROTEIN NDRG4 (PTHR11034:SF21) | NDRG4 | 0.01 | 0.01 |
| P07478 | TRYPSIN-2 (PTHR24264:SF53) | PRSS2 | 0.36 | 0.31 |
| P07477 | TRYPSIN-1 (PTHR24264:SF59) | PRSS1 | 0.44 | 0.37 |
| Q6GPI1 | CHYMOTRYPSINOGEN B2 (PTHR24250:SF53) | CTRB2 | 0.46 | 0.46 |
| ribosomal protein | ||||
| P52815 | 39S RIBOSOMAL PROTEIN L12, MITOCHONDRIAL (PTHR45987:SF4) | MRPL12 | 0.01 | 0.01 |
| P05387 | 60S ACIDIC RIBOSOMAL PROTEIN P2 (PTHR21141:SF5) | RPLP2 | 0.35 | 0.32 |
| Q96A35 | 39S RIBOSOMAL PROTEIN L24, MITOCHONDRIAL (PTHR12903:SF0) | MRPL24 | 0.4 | 0.01 |
| Q9H2W6 | 39S RIBOSOMAL PROTEIN L46, MITOCHONDRIAL (PTHR13124:SF12) | MRPL46 | 0.48 | 0.02 |
| Q9H9J2 | 39S RIBOSOMAL PROTEIN L44, MITOCHONDRIAL (PTHR11207:SF5) | MRPL44 | 0.59 | 0.14 |
| P62857 | 40S RIBOSOMAL PROTEIN S28 (PTHR10769:SF3) | RPS28 | 0.61 | 0.45 |
| P62753 | 40S RIBOSOMAL PROTEIN S6 (PTHR11502:SF16) | RPS6 | 1.42 | 0.92 |
| P23396 | 40S RIBOSOMAL PROTEIN S3 (PTHR11760:SF36) | RPS3 | 1.57 | 0.32 |
| P60866 | 40S RIBOSOMAL PROTEIN S20 (PTHR11700:SF8) | RPS20 | 1.87 | 1.31 |
| P46781 | 40S RIBOSOMAL PROTEIN S9 (PTHR11831:SF23) | RPS9 | 2.19 | 0.96 |
| ubiquitin-protein ligase | ||||
| Q99816 | TUMOR SUSCEPTIBILITY GENE 101 PROTEIN (PTHR23306:SF17) | TSG101 | 0.35 | 1.38 |
| O14933 | UBIQUITIN/ISG15-CONJUGATING ENZYME E2 L6 (PTHR24068:SF43) | UBE2L6 | 11.67 | 10.77 |
| RNA/tRNA synthesis/metabolism/turnover | ||||
| Q13123 | PROTEIN RED (PTHR12765:SF7) | IK | 0.01 | 0.01 |
| Q9NR30 | NUCLEOLAR RNA HELICASE 2 (PTHR47958:SF109) | DDX21 | 0.01 | 0.01 |
| Q96EP5 | DAZ-ASSOCIATED PROTEIN 1 (PTHR48027:SF12) | DAZAP1 | 0.2 | 0.49 |
| Q9H583 | HEAT REPEAT-CONTAINING PROTEIN 1 (PTHR13457:SF1) | HEATR1 | 2.24 | 7.58 |
| P23381 | TRYPTOPHAN-TRNA LIGASE, CYTOPLASMIC (PTHR10055:SF1) | WARS1 | 18.27 | 21.83 |
| P55769 | NHP2-LIKE PROTEIN 1 (PTHR23105:SF38) | SNU13 | 23.22 | 51.02 |
| Q9UI30 | MULTIFUNCTIONAL METHYLTRANSFERASE SUBUNIT TRM112-LIKE PROTEIN (PTHR12773:SF2) | TRMT112 | 51.09 | 50.85 |
| P62304 | SMALL NUCLEAR RIBONUCLEOPROTEIN E (PTHR11193:SF9) | SNRPE | 51.39 | 50.61 |
| Q9Y6K5 | 2’-5’-OLIGOADENYLATE SYNTHASE 3 (PTHR11258:SF4) | OAS3 | 52.63 | 52.68 |
| translation factor | ||||
| Q53EL6 | PROGRAMMED CELL DEATH PROTEIN 4 (PTHR12626:SF3) | PDCD4 | 0.32 | 0.32 |
| P06730 | EUKARYOTIC TRANSLATION INITIATION FACTOR 4E (PTHR11960:SF14) | EIF4E | 1.67 | 0.68 |
| P68104 | ELONGATION FACTOR 1-ALPHA 1-RELATED (PTHR23115:SF222) | EEF1A1 | 2.11 | 2.37 |
| Chromatin remodeling and histone | ||||
| P84243 | HISTONE H3.3-RELATED (PTHR11426:SF228) | H3-3A | 0.79 | |
| P62805 | HISTONE H4 (PTHR10484:SF163) | H4-16 | 2 | 2.45 |
| Q16777 | HISTONE H2A TYPE 2-C (PTHR23430:SF130) | H2AC20 | 2.75 | 1.25 |
| P0C0S5 | HISTONE H2A.Z (PTHR23430:SF47) | H2AZ1 | 34.01 | 51.25 |
| Q7L7L0 | HISTONE H2A TYPE 3 (PTHR23430:SF220) | H2AW | 51.25 | 50.64 |
| DNA binding | ||||
| P43246 | DNA MISMATCH REPAIR PROTEIN MSH2 (PTHR11361:SF35) | MSH2 | 0.01 | 0.01 |
| P12004 | PROLIFERATING CELL NUCLEAR ANTIGEN (PTHR11352:SF5) | PCNA | 0.81 | 0.25 |
| P42224 | SIGNAL TRANSDUCER AND ACTIVATOR OF TRANSCRIPTION 1-ALPHA/BETA (PTHR11801:SF18) | STAT1 | 9.25 | 9.63 |
| exocytosis | ||||
| P13521 | SECRETOGRANIN-2 (PTHR15119:SF0) | SCG2 | 0.45 | 0.21 |
| Miscellaneus | ||||
| Q12860 | CONTACTIN-1 (PTHR44170:SF10) | CNTN1 | 0.01 | 0.01 |
| Q14966 | ZINC FINGER PROTEIN 638 (PTHR15592:SF1) | ZNF638 | 0.01 | 0.01 |
| Q5BJF2 | SIGMA INTRACELLULAR RECEPTOR 2 (PTHR31204:SF1) | TMEM97 | 0.01 | 0.01 |
| Q969Z3 | MITOCHONDRIAL AMIDOXIME REDUCING COMPONENT 2 (PTHR14237:SF27) | MTARC2 | 0.01 | 0.01 |
| Q9BZH6 | WD REPEAT-CONTAINING PROTEIN 11 (PTHR14593:SF5) | WDR11 | 0.01 | 0.01 |
| Q8WY91 | THAP DOMAIN-CONTAINING PROTEIN 4 (PTHR15854:SF4) | THAP4 | 0.17 | 50.62 |
| Q9Y2W1 | THYROID HORMONE RECEPTOR-ASSOCIATED PROTEIN 3 (PTHR15268:SF16) | THRAP3 | 0.41 | 0.22 |
| P05408 | NEUROENDOCRINE PROTEIN 7B2 (PTHR12738:SF0) | SCG5 | 0.44 | 0.01 |
| P48059 | LIM AND SENESCENT CELL ANTIGEN-LIKE-CONTAINING DOMAIN PROTEIN 1 (PTHR24210:SF11) | LIMS1 | 0.45 | 0.41 |
| O14967 | CALMEGIN (PTHR11073:SF7) | CLGN | 0.49 | 0.17 |
| P05060 | SECRETOGRANIN-1 (PTHR10583:SF4) | CHGB | 0.52 | 0.37 |
| P02766 | TRANSTHYRETIN (PTHR10395:SF12) | TTR | 0.61 | 0.26 |
| Q9UHG3 | PRENYLCYSTEINE OXIDASE 1 (PTHR15944:SF3) | PCYOX1 | 0.85 | 0.21 |
| O75323 | PROTEIN NIPSNAP HOMOLOG 2 (PTHR21017:SF14) | NIPSNAP2 | 0.96 | 0.22 |
| Q96C19 | EF-HAND DOMAIN-CONTAINING PROTEIN D2 (PTHR13025:SF2) | EFHD2 | 1.57 | 0.77 |
| Q12907 | VESICULAR INTEGRAL-MEMBRANE PROTEIN VIP36 (PTHR12223:SF36) | LMAN2 | 2.14 | 2.75 |
| Q6UVJ0 | SPINDLE ASSEMBLY ABNORMAL PROTEIN 6 HOMOLOG (PTHR44281:SF1) | SASS6 | 2.35 | 3.32 |
| Q9UKY7 | PROTEIN CDV3 HOMOLOG (PTHR16284:SF13) | CDV3 | 2.57 | 1.63 |
| Q9C002 | NORMAL MUCOSA OF ESOPHAGUS-SPECIFIC GENE 1 PROTEIN (PTHR14256:SF3) | NMES1 | 2.61 | 3.12 |
| Q8N339 | METALLOTHIONEIN-1M (PTHR23299:SF50) | MT1M | 3.11 | 2.49 |
| Q09666 | NEUROBLAST DIFFERENTIATION-ASSOCIATED PROTEIN AHNAK (PTHR23348:SF41) | AHNAK | 9.48 | 0.31 |
| Q63HN8 | E3 UBIQUITIN-PROTEIN LIGASE RNF213 (PTHR22605:SF16) | RNF213 | 10.35 | 8.25 |
| O95786 | ATP-DEPENDENT RNA HELICASE DDX58-RELATED (PTHR14074:SF16) | DDX58 | 11.21 | 10.63 |
| P69905 | HEMOGLOBIN SUBUNIT ALPHA (PTHR11442:SF48) | HBA1 | 23.19 | 34.96 |
| Q13113 | PDZK1-INTERACTING PROTEIN 1 (PTHR15296:SF0) | PDZK1IP1 | 27.08 | 38.44 |
| P58546 | MYOTROPHIN (PTHR24189:SF52) | MTPN | 67.35 | 50.64 |
| calcium-binding protein | ||||
| P0DP23 | CALMODULIN-1 | CALM1 | 0.43 | 0.43 |
| P09525 | ANNEXIN A4 (PTHR10502:SF28) | ANXA4 | 0.86 | 0.19 |
| P04083 | ANNEXIN A1 (PTHR10502:SF17) | ANXA1 | 2.16 | 3.23 |
| scaffold/adaptor protein | ||||
| Q9Y4E1 | WASH COMPLEX SUBUNIT 2A-RELATED (PTHR21669:SF1) | WASHC2C | 0.01 | 0.01 |
| P43487 | RAN-SPECIFIC GTPASE-ACTIVATING PROTEIN (PTHR23138:SF135) | RANBP1 | 0.45 | 0.03 |
| transfer/carrier protein | ||||
| P02753 | RETINOL-BINDING PROTEIN 4 (PTHR11873:SF2) | RBP4 | 0.15 | 0.52 |
| O15127 | SECRETORY CARRIER-ASSOCIATED MEMBRANE PROTEIN 2 (PTHR10687:SF7) | SCAMP2 | 0.46 | 0.19 |
| P80188 | NEUTROPHIL GELATINASE-ASSOCIATED LIPOCALIN (PTHR11430:SF13) | LCN2 | 4.76 | 5.59 |
| protease inhibitor | ||||
| P01011 | ALPHA-1-ANTICHYMOTRYPSIN (PTHR11461:SF145) | SERPINA3 | 0.39 | 0.31 |
| P18065 | INSULIN-LIKE GROWTH FACTOR-BINDING PROTEIN 2 (PTHR11551:SF5) | IGFBP2 | 0.44 | 0.01 |
| P17936 | INSULIN-LIKE GROWTH FACTOR-BINDING PROTEIN 3 (PTHR11551:SF3) | IGFBP3 | 2.39 | 2.03 |
| P01024 | COMPLEMENT C3 (PTHR11412:SF81) | C3 | 7.03 | 7.25 |
| P05120 | PLASMINOGEN ACTIVATOR INHIBITOR 2 (PTHR11461:SF61) | SERPINB2 | 8.1 | 7.19 |
| P48594 | SERPIN B4 (PTHR11461:SF186) | SERPINB4 | 100 | 106 |
| Ingenuity Canonical Pathways | −log(p-Value) | z-Score | Molecules |
|---|---|---|---|
| Antigen Presentation Pathway | 11.2 | B2M, HLA-B, HLA-C, HLA-DRA, HLA-DRB1, PSMB8, PSMB9, TAP1, TAP2, TAPBP | |
| Phagosome Maturation | 10.2 | B2M, CTSS, HLA-B, HLA-C, HLA-DRA, HLA-DRB1, PRDX1, PRDX2, PRDX5, PRDX6, TAP1, TSG101, TUBA1A, TUBA4B, TUBG2 | |
| NRF2-mediated Oxidative Stress Response | 8.8 | 1.89 | ACTA1, ACTC1, ACTG1, GSTA1, GSTA2, HMOX1, MAP2K3, MGST2, NQO1, PRDX1, RALA, RALB, SOD2, SQSTM1, TXN |
| Protein Ubiquitination Pathway | 7.47 | B2M, HLA-B, HLA-C, HSPA5, PSMB10, PSMB8, PSMB9, PSMD10, PSME1, PSME2, SASS6, TAP1, TAP2, UBD, UBE2L6, UCHL1 | |
| Acute Phase Response Signaling | 7.25 | 2.111 | C3, CFB, CP, FN1, HMOX1, MAP2K3, NFKB2, RALA, RALB, RBP4, SERPINA3, SOD2, TTR |
| Interferon Signaling | 7.09 | 2.646 | IFIT3, IFITM1, ISG15, MX1, PSMB8, STAT1, TAP1 |
| EIF2 Signaling | 6.12 | ACTA1, ACTC1, EIF4E, HSPA5, RALA, RALB, RPLP2, RPS20, RPS28, RPS3, RPS6, RPS9, WARS1 | |
| Crosstalk between Dendritic Cells and Natural Killer Cells | 5.36 | ACTA1, ACTC1, ACTG1, HLA-B, HLA-C, HLA-DRA, HLA-DRB1, NFKB2 | |
| Agranulocyte Adhesion and Diapedesis | 5.19 | ACTA1, ACTC1, ACTG1, CCL20, CXCL1, CXCL10, CXCL2, CXCL8, FN1, ICAM1, MYL6 | |
| Glycolysis I | 5.18 | 0.447 | BPGM, GAPDH, PGK2, PKM, TPI1 |
| Virus Entry via Endocytic Pathways | 4.76 | ACTA1, ACTC1, ACTG1, B2M, HLA-B, HLA-C, RALA, RALB | |
| Neuroinflammation Signaling Pathway | 4.74 | 3.051 | B2M, CXCL10, CXCL8, HLA-B, HLA-C, HLA-DRA, HLA-DRB1, HMOX1, ICAM1, NFKB2, PLA2G1B, SOD2, STAT1 |
| Type I Diabetes Mellitus Signaling | 4.65 | CPE, HLA-B, HLA-C, HLA-DRA, HLA-DRB1, MAP2K3, NFKB2, STAT1 | |
| Role of IL-17A in Arthritis | 4.63 | CCL20, CXCL1, CXCL2, CXCL8, MAP2K3, NFKB2 | |
| FAT10 Signaling Pathway | 4.49 | PSME1, PSME2, SQSTM1, UBD | |
| Regulation of eIF4 and p70S6K Signaling | 4.36 | 1 | EIF4E, PPP2R1B, RALA, RALB, RPS20, RPS28, RPS3, RPS6, RPS9 |
| Activation of IRF by Cytosolic Pattern Recognition Receptors | 4.29 | 1.633 | DDX58, IFIH1, IFIT2, ISG15, NFKB2, STAT1 |
| Sirtuin Signaling Pathway | 4.21 | 0.333 | ATG5, ATP5F1B, BPGM, CXCL8, MT-ATP6, NAMPT, NFKB2, NQO1, SOD2, TUBA1A, TUBA4B, UQCRFS1 |
| Communication between Innate and Adaptive Immune Cells | 4.16 | B2M, CXCL10, CXCL8, HLA-B, HLA-C, HLA-DRA, HLA-DRB1 | |
| mTOR Signaling | 4.10 | 0.816 | EIF4E, HMOX1, PPP2R1B, RALA, RALB, RPS20, RPS28, RPS3, RPS6, RPS9 |
| Remodeling of Epithelial Adherens Junctions | 4.10 | ACTA1, ACTC1, ACTG1, MAPRE2, RALA, TUBA1A | |
| Mitochondrial Dysfunction | 4.08 | ATP5F1B, ATP5PO, COX7C, MT-ATP6, PRDX3, PRDX5, SOD2, UQCRFS1, XDH | |
| Caveolar-mediated Endocytosis Signaling | 3.93 | ACTA1, ACTC1, ACTG1, B2M, HLA-B, HLA-C | |
| IL-17A Signaling in Gastric Cells | 3.90 | CCL20, CXCL1, CXCL10, CXCL8 | |
| Xenobiotic Metabolism General Signaling Pathway | 3.87 | −0.707 | GSTA1, GSTA2, HMOX1, MAP2K3, MGST2, NQO1, RALA, RALB |
| Upstream Regulator | Molecule Type | Predicted Activation State | Activation z-Score | p-Value of Overlap | Target Molecules in Dataset |
|---|---|---|---|---|---|
| IFNG | cytokine | Activated | 6.4 | 1.27 × 10⁻²⁷ | ATG5, B2M, BST2, C3, CCL20, CFB, CP, CTSS, CXCL1, CXCL10, CXCL2, CXCL8, DDX58, DIABLO, DUOX2, EEF1A1, ERAP2, FN1, GBP1, GBP2, GBP4, GBP5, HLA-B, HLA-C, HLA-DRA, HLA-DRB1, HMOX1, HSPA5, ICAM1, IDI1, IDO1, IFI30, IFIH1, IFIT2, IFIT3, IFITM1, ISG15, ISG20, LCN2, MIF, MSH2, MX1, NAMPT, NDRG4, NFKB2, NQO1, OAS3, PIGR, PKM, PML, PRDX2, PSMB10, PSMB8, PSMB9, PSME1, PSME2, SCG5, SOD2, SQSTM1, STAT1, TAP1, TAP2, TAPBP, TNFAIP2, TPI1, TYMP, UBD, UBE2L6, WARS1, ZNF638 |
| IRF1 | transcription regulator | Activated | 3.6 | 1.44 × 10⁻²⁶ | B2M, CCL20, CFB, CTSS, CXCL10, CXCL2, CXCL8, DDX58, GBP2, IDO1, IFIH1, IFIT2, IFIT3, IFITM1, ISG15, MX1, OAS3, PCNA, PIGR, PML, PSMB10, PSMB8, PSMB9, PSME1, PSME2, STAT1, TAP1, TAP2, TAPBP, UBD |
| STAT1 | transcription regulator | Activated | 5.4 | 3.13 × 10⁻²⁶ | B2M, BST2, C3, CCL20, CFB, CTSS, CXCL10, CXCL2, CXCL8, DUOX2, GBP1, GBP2, GBP4, GBP5, ICAM1, IDO1, IFI30, IFIH1, IFIT2, IFIT3, IFITM1, ISG15, LCN2, MX1, OAS3, PSMB10, PSMB8, PSMB9, PSME1, PSME2, RNF213, SERPINA3, SERPINB4, STAT1, TAP1, TYMP, UBD, WARS1 |
| TNF | cytokine | Activated | 5.9 | 1.43 × 10⁻²⁴ | ACTA1, ANXA1, B2M, BPGM, BST2, C3, CCL20, CFB, CLU, COTL1, CP, CTSS, CXCL1, CXCL10, CXCL2, CXCL8, DDX58, EFHD2, FN1, GBP1, GBP2, GBP4, GSTA1, HID1, HLA-B, HLA-DRA, HMOX1, HSPA5, ICAM1, IDO1, IFIH1, IFIT3, IFITM1, IGFBP2, IGFBP3, ISG15, LCN2, MAP2K3, MGST2, MIF, MSH2, MX1, MYL6, NAMPT, NFKB2, NNMT, NQO1, OAS3, P4HB, PCNA, PIGR, PKM, PML, PPP2R1B, PSMB10, PSMB8, PSMB9, PSME1, PSME2, RPS3, SERPINA3, SERPINB2, SOD2, SQSTM1, STAT1, TAGLN, TAP1, TAPBP, TGM2, TNFAIP2, TXN, TYMP, UBD, VIM, XDH |
| OSM | cytokine | Activated | 4.3 | 1.33 × 10⁻²³ | AKR1C1/AKR1C2, ANXA1, B2M, CCL20, CXCL1, CXCL10, CXCL2, CXCL8, FN1, GBP1, GBP2, HLA-B, HLA-C, HMOX1, HSPA5, ICAM1, IGFBP3, ISG20, LCN2, MX1, NAMPT, PCNA, PDCD4, PDZK1IP1, PIGR, PRDX2, PSMB8, PSMB9, REG3A, SERPINA3, SERPINB4, SNRPE, STAT1, TAP1, TAP2, TAPBP, TNFAIP2, TUBA1A, TYMP, UBE2L6, VIM, XDH |
| IFNA2 | cytokine | Activated | 4.8 | 4.02 × 10⁻²³ | ANXA1, B2M, BST2, CXCL10, DDX58, DIABLO, GBP1, GBP2, GBP4, HLA-B, HLA-C, IDO1, IFIH1, IFIT2, IFIT3, IFITM1, ISG15, ISG20, MTATP6, MT1M, MX1, OAS3, PLA2G1B, PML, PSME1, STAT1, TAP1, TGM2, UBD, UBE2L6 |
| PML | transcription regulator | Activated | 2.9 | 7.25 × 10⁻²³ | ACTG1, ANXA4, BST2, CPE, CXCL1, HLA-DRA, HMOX1, IDI1, IFIH1, IFIT3, IFITM1, ISG15, ISG20, MX1, NQO1, OAS3, PML, PRDX1, PSMB8, PSMB9, SQSTM1, STAT1, TAP1, TAP2, TXN, VIM |
| IL1B | cytokine | Activated | 5.2 | 2.81 × 10⁻²³ | ANXA1, B2M, C3, CCL20, CFB, CP, CTSS, CXCL1, CXCL10, CXCL2, CXCL8, EIF4E, FN1, GBP1, GBP2, GSTA1, GSTA2, HLA-DRA, HMOX1, HSPA5, ICAM1, IDO1, IFIT3, IGFBP3, ISG15, ISG20, LCN2, MIF, MX1, NAMPT, NFKB2, NQO1, P4HB, PCNA, PIGR, PSMB10, PSMB8, PSMB9, PSME2, RAN, SERPINA3, SERPINB2, SOD2, STAT1, TAP2, TGM2, TNFAIP2, TYMP, UBD, UBE2L6, VIM, XDH |
| IFNL1 | cytokine | Activated | 4.4 | 1.84 × 10⁻²¹ | BST2, CXCL10, CXCL8, DDX58, GBP1, GBP5, HLA-B, HLA-C, IFIH1, IFIT2, IFIT3, IFITM1, ISG15, ISG20, MX1, OAS3, PML, PSMB9, STAT1, UBE2L6 |
| Interferon alpha | group | Activated | 5.4 | 6.66 × 10⁻²¹ | APOL2, B2M, BST2, C3, CXCL1, CXCL10, CXCL2, CXCL8, DDX58, GBP1, GBP2, GBP5, HLA-B, HLA-C, ICAM1, IDO1, IFIH1, IFIT2, IFIT3, IFITM1, ISG15, ISG20, LAP3, MX1, OAS3, PML, PSMB8, PSMB9, RNF213, STAT1, TAP1, TAP2, TAPBP, TYMP, UBE2L6, WARS1 |
| CD40LG | cytokine | Activated | 3.2 | 8.58 × 10⁻²¹ | B2M, CCL20, CLU, CXCL1, CXCL10, CXCL2, CXCL8, ICAM1, IDO1, IFIT2, IFIT3, IFITM1, ISG15, LMAN2, MAP2K3, MIF, MSH2, MX1, NAMPT, NFKB2, PML, PSMB10, PSMB8, PSMB9, PSME1, PSME2, SOD2, STAT1, TAP1, TAP2, TGM2, TNFAIP2, TYMP, UBD |
| RELA | transcription regulator | Activated | 2.4 | 1.77 × 10⁻²⁰ | B2M, C3, CCL20, CFB, CXCL1, CXCL10, CXCL2, CXCL8, ERAP2, FN1, GBP1, GSTA1, GSTA2, HLA-B, HMOX1, ICAM1, IGFBP2, ISG15, MIF, NAMPT, NFKB2, PKM, PRDX6, PSMB10, PSMB9, REG3A, SOD2, TAP1, TAP2, TAPBP, TGM2, TNFAIP2, TPMT, UBD, VIM |
| IRF7 | transcription regulator | Activated | 4.7 | 5.05 × 10⁻²⁰ | CXCL10, DDX58, GBP1, GBP4, GBP5, IDO1, IFIH1, IFIT2, IFIT3, IFITM1, ISG15, ISG20, MX1, NAMPT, OAS3, PSMB10, PSMB8, PSMB9, PSME1, PSME2, STAT1, TAP1, TAP2, UBE2L6 |
| APP | other | Activated | 3.6 | 1.64 × 10⁻¹⁹ | ACTA1, ACTG1, ATP1A3, ATP5F1B, C3, CCL20, CLU, CP, CXCL1, CXCL10, CXCL2, CXCL8, DDX58, FN1, GAPDH, GBP2, GBP4, HMOX1, HSPA5, ICAM1, IDO1, IFIH1, IFIT2, IGFBP2, ISG20, MT-ATP6, NAMPT, PDCD4, PGK2, PKM, PRDX2, PRDX5, PRDX6, PSME1, RAN, RNF213, RPS6, SCG5, SOD2, SPTAN1, SQSTM1, TAGLN, TNFAIP2, TPI1, TTR, TUBA1A, TXN, UCHL1 |
| Ifnar | group | Activated | 4.3 | 3.37 × 10⁻¹⁹ | B2M, C3, CXCL10, DDX58, GBP2, IDO1, IFIH1, IFIT2, IFIT3, ISG15, ISG20, PSMB8, PSMB9, RNF213, STAT1, TAP1, TAP2, TAPBP, UBE2L6 |
| MYC | transcription regulator | −0.8 | 5.15 × 10⁻¹⁸ | ACAT1, ACTA1, ANXA4, ARF3, BOP1, CLU, CXCL10, CXCL8, DDX21, DEK, EIF4E, FN1, GAPDH, GBP2, GBP4, H2AZ1, HDAC2, HLA-B, HMOX1, ICAM1, IFIH1, IFIT2, IFIT3, ISG20, LIMS1, MIF, MRPL12, MSH2, MX1, MYO1B, NQO1, PCNA, PDCD4, PKM, PML, PRDX2, PRDX3, PSMB8, RANBP1, RPLP2, RPS20, RPS28, RPS3, RPS6, RPS9, SOD2, SQOR, STAT1, TMEM97, TPI1, TXN, VIM | |
| TP53 | transcription regulator | 0.9 | 8.64 × 10⁻¹⁸ | ACAT1, ANXA1, ANXA4, BOP1, CCS, CLU, CP, CXCL1, CXCL10, CXCL8, DEK, EEF1A1, FN1, GAPDH, GBP1, GPRC5C, H2AZ1, HDAC2, HLA-B, HMOX1, HSPA5, ICAM1, IFI30, IGFBP2, IGFBP3, ISG15, LMAN2, MAP2K3, MAPRE2, MDH2, MGST2, MRPL12, MRPL46, MSH2, MX1, NAMPT, NDRG4, NFKB2, P4HB, PCNA, PFN1, PKM, PML, PPM1B, PRDX2, PRDX3, PRDX6, PSMB9, RAN, RPS20, RPS3, SEC62, SERPINA3, SERPINB2, SOD2, SQOR, STAT1, TAP1, TAP2, TGM2, TMEM97, TNFAIP2, TSG101, UBD, UQCRFS1, VIM | |
| STAT3 | transcription regulator | 1.0 | 1.29 × 10⁻¹⁷ | BST2, CCL20, CFB, CXCL10, CXCL2, CXCL8, FN1, GBP2, GBP5, HMOX1, ICAM1, IFI30, IFIH1, IFIT2, IFIT3, IFITM1, ISG15, ISG20, MT-ATP6, MX1, NAMPT, NFKB2, OAS3, PML, PSMB8, PSMB9, REG1A, REG3A, SERPINA3, SERPINB4, SOD2, STAT1, TAGLN, TAP1, UBD, VIM, WARS1 | |
| IFNAR2 | transmembrane receptor | Activated | 3.0 | 3.31 × 10⁻¹⁷ | CXCL10, DDX58, GBP4, IDO1, IFIH1, IFITM1, ISG15, PSMB10, PSMB8, PSMB9, PSME2, TGM2, UBD, UBE2L6 |
| HRAS | enzyme | 1.4 | 1.89 × 10⁻¹⁶ | ACTA1, ACTG1, ATP1A3, ATP5F1B, B2M, CFB, CHGA, CLU, CTSS, CXCL1, CXCL10, CXCL8, FN1, HLA-B, HMOX1, ICAM1, IFI30, MRPL12, NQO1, P4HB, PCNA, PDCD4, PFN1, PML, PRDX2, PRDX6, PSMB9, RPS3, RPS6, SERPINA3, SERPINB2, TAGLN, TAP1, TAP2, TGM2, TYMP, VIM | |
| MAPK1 | kinase | Inhibited | −4.8 | 2.18 × 10⁻¹⁶ | BST2, CFB, CXCL8, DDX58, FN1, GBP1, GBP2, GBP5, HLA-B, HLA-C, HMOX1, IFI30, IFIH1, IFIT2, IFIT3, IFITM1, ISG15, ISG20, LAP3, OAS3, PML, PSMB8, PSMB9, PSME2, STAT1, TAP1, TRIM25, UBE2L6, VIM |
| IL6 | cytokine | Activated | 2.5 | 2.50 × 10⁻¹⁶ | AHNAK, ANXA1, BST2, C3, CCL20, CLU, CP, CXCL1, CXCL10, CXCL2, CXCL8, FN1, GBP2, GCG, GSTA1, HMOX1, HSPA5, ICAM1, IDO1, IFIT2, IGFBP3, IK, LCN2, NAMPT, PCNA, PSMB10, PSMB8, PSMB9, PSME1, PSME2, REG1A, SERPINA3, SOD2, SST, STAT1, TAP1, TGM2, TTR, VIM, WARS1 |
| IRF3 | transcription regulator | Activated | 3.7 | 4.26 × 10⁻¹⁶ | AHNAK, ANXA4, B2M, CXCL1, CXCL10, CXCL8, DDX58, FN1, GBP1, GBP5, IFIH1, IFIT2, IFIT3, ISG15, ISG20, LCN2, OAS3, PML, STAT1, TAP1, UBE2L6, VIM |
| PRL | cytokine | Activated | 2.3 | 6.90 × 10⁻¹⁶ | ARF3, B2M, BST2, CCL20, CLU, CTSS, CXCL10, DDX58, FN1, IFIH1, IFIT3, IFITM1, IGFBP3, ISG15, OAS3, P4HB, PCNA, PSME1, PSME2, RALB, SERPINA3, STAT1, TRIM25, VIM, XDH |
| IRF2 | transcription regulator | 0.9 | 2.55 × 10⁻¹⁵ | B2M, CFB, CTSS, CXCL10, GBP1, HLA-B, ISG15, LCN2, NAMPT, PSMB10, PSMB8, PSMB9, PSME1, PSME2, TAP1, TAP2, TAPBP, UBE2L6 |
Publisher’s Note: MDPI stays neutral with regard to jurisdictional claims in published maps and institutional affiliations. |
© 2022 by the authors. Licensee MDPI, Basel, Switzerland. This article is an open access article distributed under the terms and conditions of the Creative Commons Attribution (CC BY) license (https://creativecommons.org/licenses/by/4.0/).
Share and Cite
Giusti, L.; Tesi, M.; Ciregia, F.; Marselli, L.; Zallocco, L.; Suleiman, M.; De Luca, C.; Del Guerra, S.; Zuccarini, M.; Trerotola, M.; et al. The Protective Action of Metformin against Pro-Inflammatory Cytokine-Induced Human Islet Cell Damage and the Mechanisms Involved. Cells 2022, 11, 2465. https://doi.org/10.3390/cells11152465
Giusti L, Tesi M, Ciregia F, Marselli L, Zallocco L, Suleiman M, De Luca C, Del Guerra S, Zuccarini M, Trerotola M, et al. The Protective Action of Metformin against Pro-Inflammatory Cytokine-Induced Human Islet Cell Damage and the Mechanisms Involved. Cells. 2022; 11(15):2465. https://doi.org/10.3390/cells11152465
Chicago/Turabian StyleGiusti, Laura, Marta Tesi, Federica Ciregia, Lorella Marselli, Lorenzo Zallocco, Mara Suleiman, Carmela De Luca, Silvia Del Guerra, Mariachiara Zuccarini, Marco Trerotola, and et al. 2022. "The Protective Action of Metformin against Pro-Inflammatory Cytokine-Induced Human Islet Cell Damage and the Mechanisms Involved" Cells 11, no. 15: 2465. https://doi.org/10.3390/cells11152465