Article

KANPHOS: A Database of Kinase-Associated Neural Protein Phosphorylation in the Brain

1
Department of Cell Pharmacology, Graduate School of Medicine, Nagoya University, 65 Tsurumai, Nagoya 466-8550, Japan
2
Institute for Comprehensive Medical Science, Fujita Health University, Toyoake 470-1192, Japan
3
Division of Information Science, Graduate School of Science and Technology, Nara Institute of Science and Technology, Ikoma 630-0192, Japan
4
Department of Bioinformatics and Genomics, Graduate School of Advanced Preventive Medical Science, Kanazawa University, Kanazawa 920-8640, Japan
5
Department of Neuropsychopharmacology and Hospital Pharmacy, Graduate School of Medicine, Nagoya University, 65 Tsurumai, Nagoya 466-8550, Japan
6
Division of Behavioral Neuropharmacology, International Center for Brain Science (ICBS), Fujita Health University, Toyoake 470-1192, Japan
*
Author to whom correspondence should be addressed.
Cells 2022, 11(1), 47; https://doi.org/10.3390/cells11010047
Submission received: 3 December 2021 / Revised: 19 December 2021 / Accepted: 21 December 2021 / Published: 24 December 2021
(This article belongs to the Special Issue Pathophysiological Mechanism of Neurodevelopmental Disorders)

Abstract

:
Protein phosphorylation plays critical roles in a variety of intracellular signaling pathways and physiological functions that are controlled by neurotransmitters and neuromodulators in the brain. Dysregulation of these signaling pathways has been implicated in neurodevelopmental disorders, including autism spectrum disorder, attention deficit hyperactivity disorder and schizophrenia. While recent advances in mass spectrometry-based proteomics have allowed us to identify approximately 280,000 phosphorylation sites, it remains largely unknown which sites are phosphorylated by which kinases. To overcome this issue, previously, we developed methods for comprehensive screening of the target substrates of given kinases, such as PKA and Rho-kinase, upon stimulation by extracellular signals and identified many candidate substrates for specific kinases and their phosphorylation sites. Here, we developed a novel online database to provide information about the phosphorylation signals identified by our methods, as well as those previously reported in the literature. The “KANPHOS” (Kinase-Associated Neural Phospho-Signaling) database and its web portal were built based on a next-generation XooNIps neuroinformatics tool. To explore the functionality of the KANPHOS database, we obtained phosphoproteomics data for adenosine-A2A-receptor signaling and its downstream MAPK-mediated signaling in the striatum/nucleus accumbens, registered them in KANPHOS, and analyzed the related pathways.

1. Introduction

Protein phosphorylation and dephosphorylation are critical post-translational modifications in the regulation of cell signaling networks, especially in the nervous system, where these mechanisms contribute to brain development, functions and disorders [1,2,3,4,5]. The levels of protein phosphorylation are regulated by the combined actions of protein kinases and phosphatases. Over 500 protein kinases are encoded in the human genome, and more than 280,000 phosphorylation sites have been characterized [6]. Protein phosphorylation events in the brain have been extensively studied since the early 1970s, and it has become apparent that nerve cells, like other cell types, are highly regulated by phosphorylation signals [7]. Dysregulation of these signaling pathways has been implicated in neurodevelopmental disorders, including autism spectrum disorder, attention deficit hyperactivity disorder and schizophrenia, as the therapeutic agents for these diseases are involved in phosphorylation signals. For example, the atypical antipsychotic agents risperidone and aripiprazole are used to treat exacerbations of autism spectrum disorder (ASD) [8,9], while chlorpromazine and haloperidol, typical antipsychotic agents, are utilized to treat schizophrenia [10,11]. These antipsychotic agents target the receptors of monoamines such as dopamine, serotonin and adrenaline, which are coupled to specific G protein-coupled receptors (GPCRs), and their downstream protein kinases [12,13,14]. Therefore, the identification of phosphorylated proteins and sites, together with the kinases and phosphatases responsible for regulating their phosphorylation, is very important for revealing cell signaling in the brain and finding associations with neurological disease pathogenesis. However, despite its importance, data describing phosphoproteins in the brain and their phosphorylation sites remain limited.
With the advancement of mass spectrometry (MS)-based proteomics approaches, a variety of databases have been developed to document experimentally verified in vivo and/or in vitro phosphorylation sites from numerous biological samples. Several phosphoproteomics databases have been developed, including UniProtKB [15], PhosphoELM [16], PhosphoSitePlus [17], PHOSIDA [18], SysPTM [19], jPOST [20], and Human Protein Reference Database (HPRD) [21]. However, none of these phosphoproteomics databases focus on brain phosphorylation events, and they fail to explain the upstream signaling events for phosphorylation because the identities of the kinases that phosphorylate the listed sites remain largely unknown. Many studies have attempted to predict the kinases responsible for phosphorylation at specific sites based on consensus amino acid sequence motifs [22,23,24], but these predictions are currently of little practical use because knowledge of the consensus sequence motifs for various kinases remains limited. To obtain kinase-oriented protein phosphorylation information, including data on phosphoproteins, phosphorylation sites and responsible kinases, we developed the kinase-interacting substrate screening (KISS) method for in vitro phosphoproteins [25,26,27] and the kinase-oriented substrate screening (KIOSS) method for in vivo phosphorylation signaling [26,27,28].
In this study, we developed and presented an online database named KANPHOS (Kinase-Associated Neural PHOspho-Signaling), (available online: https://kanphos.neuroinf.jp/ (accessed on 2 December 2021)) which provides phosphorylation signaling information, including data on phosphoproteins, phosphorylation sites and responsible kinases, in the brain. Moreover, we performed KIOSS to obtain novel phosphoproteomics data for adenosine-A2a-receptor signaling, including downstream MAPK-mediated signaling, in the striatum/nucleus accumbens and registered them in KANPHOS.

2. Materials and Methods

2.1. System Configuration and Application Software

The KANPHOS database is designed as a web-based database that is accessible from a web browser to allow simple and widespread use by researchers. It was built based on the neuroinformatics platform system named XooNIps (XOOPS module for Neuroinformatics) version 4.0 (RIKEN Brain science institute, Wako, Japan) [29]. XooNIps is an extended module of the extensible object-oriented portal system (XOOPS) (available online: https://xoops.org/ (accessed on 1 December 2021)), which is an OS-independent content management system (CMS) web application written in PHP (Hypertext Preprocessor, available online: https://www.php.net/ (accessed on 20 November 2021)). In KANPHOS, XooNIps runs on CentOS (available online: https://www.centos.org/ (accessed on 1 December 2021)) using Apache (The Apache HTTP Server Project, available online: https://httpd.apache.org/ (accessed on 21 November 2021)) as the web server and MySQL (available online: https://www.mysql.com/ (accessed on 24 November 2021)) as the database management system.
The stable operation and updating of web-based databases requires substantial familiarity with web and network systems. To solve these problems, CMSs for the construction and management of web-based databases have become popular. The database we sought to develop needed to be able to handle a very large and continuously increasing amount of experimental data on protein kinases and phosphorylation sites. XooNIps is an easy-to-use software that can facilitate the construction of web-based databases for organizing vast amounts of information with metadata in various electronic formats and sharing it with users around the world on the internet.

2.2. Data Collection, Management and Analysis Tool

As of October 2021, approximately 10,000 records have been registered in KANPHOS. Each record is composed of a pair, a protein phosphorylation site and its modifier (i.e., the corresponding kinase or extracellular signal, such as a neurotransmitter). Of these, 6228 records were identified based on our experimental results, while 3736 records were based on publications from other groups. To facilitate analysis, KANPHOS supports three search modes: (1) search for substrates phosphorylated by a specific kinase; (2) search for kinases phosphorylating a specific protein; and (3) search for kinases and their target substrates in a specific signaling pathway. All proteins registered in KANPHOS are associated with a UniProt ID to facilitate linkage with 12 external databases (Table S1). In particular, protein associations with Gene Ontology (GO) terms and KEGG pathways are useful for exploring potential as yet unidentified functions.

2.3. Preparation and Incubation of Coronal Slices

Coronal slices were prepared from male C57BL/6 mice as described previously [30]. In our adenosine and MAPK experiment, we try to minimize the number mice sacrifice. For each experiment, one male C57BL/6 mice (total 6) were sacrificed humanely by decapitation. From one mouse, we dissected striatal/accumbal slices and distributed them into 3 or 4 treatment conditions. The brain was removed and kept in Krebs-HCO3 buffer (124 mM NaCl, 4 mM KCl, 26 mM NaHCO3, 1.5 mM CaCl2, 1.25 mM KH2PO4, 1.5 mM MgSO4, and 10 mM D-glucose, pH 7.4). Coronal brain slices (350 μm) were prepared using a VT1200S vibratome (Leica Microsystems, Wetzlar, Germany). After dissecting of the whole striatum/NAc, coronal slices were incubated at 30 °C in Krebs-HCO3 buffer with 10 μg/mL adenosine deaminase (Roche, Basel, Switzerland) for 30 min under constant oxygenation with 95% O2/5% CO2. The buffer was replaced with fresh Krebs-HCO3 buffer and preincubated for 30 min. Coronal slices were pretreated with the indicated inhibitors (quinpirole 1 μM for 10 min, U0126 10 μM for 30 min) and then stimulated with the indicated activators (CGS21680 5 μM for 5 min, okadaic acid 1 μM for 60 min). After stimulation, slices were immediately frozen in liquid nitrogen and stored at −80 °C. The slices were lysed in lysis buffer (1% SDS, 1 mM EDTA, 1 mM DTT, phosphatase inhibitor cocktail (Roche, Indianapolis, IN, USA), protease inhibitor cocktail (Roche), pH 7.0) and sonicated for 20 s. The protein concentration of lysates was determined by BCA assay (FUJIFILM Wako). The A2AR-specific agonist CGS21680 (Cat No: Sigma-Aldrich Co., St. Louis, MO, USA), D2R-specific agonist quinpirole (Cat No., 1061; TOCRIS Bioscience, Bristol, UK), phosphatase inhibitor okadaic acid (OA) (primarily a PP2A inhibitor) (Wako Chemicals, Osaka, Japan), and MEK1/2 inhibitor U0126 (Cat No., 1144; TOCRIS Bioscience, Bristol, UK) were used for slice culture treatment.

2.4. Mass Spectrometry

Mass spectrometry (MS) was performed as previously described [26] with some modifications. Frozen mouse brain slices were lysed in lysis buffer (1 mM EDTA, 50 mM Tris/HCl, 150 mM NaCl, 0.5% sodium deoxycholate, 1% NP-40, 0.1% SDS, PhosStop (Roche), and protease inhibitor cocktail (Roche), pH 7.5) and sonicated for 15 s. Supernatant was collected after centrifugation of lysate at 15,000 rpm for 10 min at 4 °C. Protein concentrations of lysates were equalized before incubation with GST-14-3-3ζ (500 pmol) immobilized on glutathione sepharose 4B beads (GE Healthcare Bio-Sciences AB, Uppsala, Sweden) for 60 min at 4 °C. The beads were washed with lysis buffer three times, followed by wash with wash buffer (1 mM EDTA, 50 mM Tris/HCl and150 mM NaCl, pH 7.5) three times. Using guanidine solution (7 M guanidine and 50 mM Tris), bound proteins were removed from the beads, followed by reduction with 5 mM dithiothreitol for 30 min, and alkylation by10 mM iodoacetamide for 1 h at dark. The proteins were digested with Trypsin/Lys-C (Promega) and incubated overnight at 37 °C. Demineralization was performed using SPE c-tips (Nikkyo Technos, Tokyo, Japan) and phosphopeptide was enriched by TiO2 column (Titansphere® Phos-TiO kit, GL Sciences, Tokyo, Japan) according to the manufacturer’s instructions. Finally, all the peptides were analyzed by liquid chromatography/mass spectrometry (LC/MS) using an Orbitrap Fusion mass spectrometer (Thermo Fisher Scientific Inc., Waltham, MA, USA), which was coupled with an UltiMate3000 RSLCnano LC system (Dionex Co., Amsterdam, The Netherlands) using a nano High-performance liquid chromatography (HPLC) capillary column, C18, 3 µm, 150 mm × 75 µm (Nikkyo Technos Co., Tokyo, Japan) via a nanoelectrospray ion source. Reversed-phase chromatography was performed with solvent A (2% acetonitrile, 0.1% formic acid) and solvent B (95% acetonitrile, 0.1% formic acid) with a linear gradient (0 min, 5% B; 100 min, 40% B) at a flow rate of 300 nL/min. Prior to MS/MS analysis, a precursor ion scan was carried out using a 400–1600 mass to charge ratio (m/z) and then MS/MS analysis was performed by isolation at 0.8 Th with the quadrupole, HCD fragmentation with a normalized collision energy of 30%, and rapid scan MS analysis in the ion trap. Precursor ions with charge states of 2–6 were sampled for MS2 only. The instrument was run in a top speed mode with 3 s per cycle. Phosphoprotein identification was performed by MaxQuant software (version 1.4.1.2) (Max-Planck-Institute of Biochemistry, Computational Systems Biochemistry, Planegg, Germany) against the reference Mus musculus proteome database obtained from UniProtKB (release in November 2018) (accessed on 4 June 2021) [31]. We set carbamidomethylation of cysteine as a fixed modification, whereas methionine oxidation, Ser/Thr/Tyr phosphorylation, and N-terminal acetylation were set as variable modifications. False discovery rates (FDRs) for the peptide, protein, and site levels were set to 0.01. The ion peak intensities obtained from three independent experiments were analyzed. Gene Ontology (GO) analysis (biological process) and KEGG pathway analysis were performed using DAVID bioinformatics resources (available online: https://david.ncifcrf.gov/ (accessed on 7 November 2021)) and Reactome analysis (available online: http://www.reactome.org/, accessed on 7 November 2021).

2.5. SDS-PAGE and Immunoblotting

The proteins were separated via SDS-PAGE using 8% polyacrylamide gels (Nacalai Tesque, Kyoto, Japan) and transferred to polyvinylidene difluoride membranes (Immobilon-FL, Merck). The membranes were blocked for 30 min at room temperature with Blocking-One (Nacalai Tesque) and then incubated with primary antibody for overnight at 4 °C. Following primary antibodies were used: rabbit monoclonal anti-phospho-GluR1 (S845) (RRID: AB_10860773) from CST; mouse monoclonal anti-GluR1 (RRID: AB_11212678) from EMD Millipore; rabbit monoclonal anti-phospho-p44/42 MAPK (ERK1/2) (T202/Y204) (RRID: AB_2315112), mouse monoclonal anti-p44/42 MAPK (ERK1/2) (RRID: AB_10695739) from CST; anti-phospho-Rap1gap (S563) [32], rabbit anti-Rap1gap (RRID: AB_777621) from Abcam (Cambridge, UK), anti-phospho-Rasgrp2 (S116/117) [26], and rabbit polyclonal anti-Rasgrp2 (Abcam Cat# ab126039, RRID:AB_11128113). Membranes were washed with Tris-buffered saline (TBST; 20 mM Tris, 150 mM NaCl, 0.05% Tween 20, pH 7.6) three times and incubated with secondary antibodies: goat anti-mouse IgG, Alexa Fluor 680 (RRID: AB_2535724, Thermo Fisher Scientific), goat anti-rabbit IgG Alexa Fluor 680 (RRID: AB_2535758, Thermo Fisher Scientific), or anti-mouse IgG (H+L) DyLight 800 conjugate (RRID: AB_10693543, Cell Signaling Technology) at room temperature for 30 min. Specific binding of proteins was detected using an infrared imaging system (LI-COR Biosciences, Lincoln, NE, USA) and band intensities were quantified by Image Studio software (version 3.1.4) (RRID: SCR_015795, LI-COR Biosciences, Lincoln, NE, USA).

3. Results

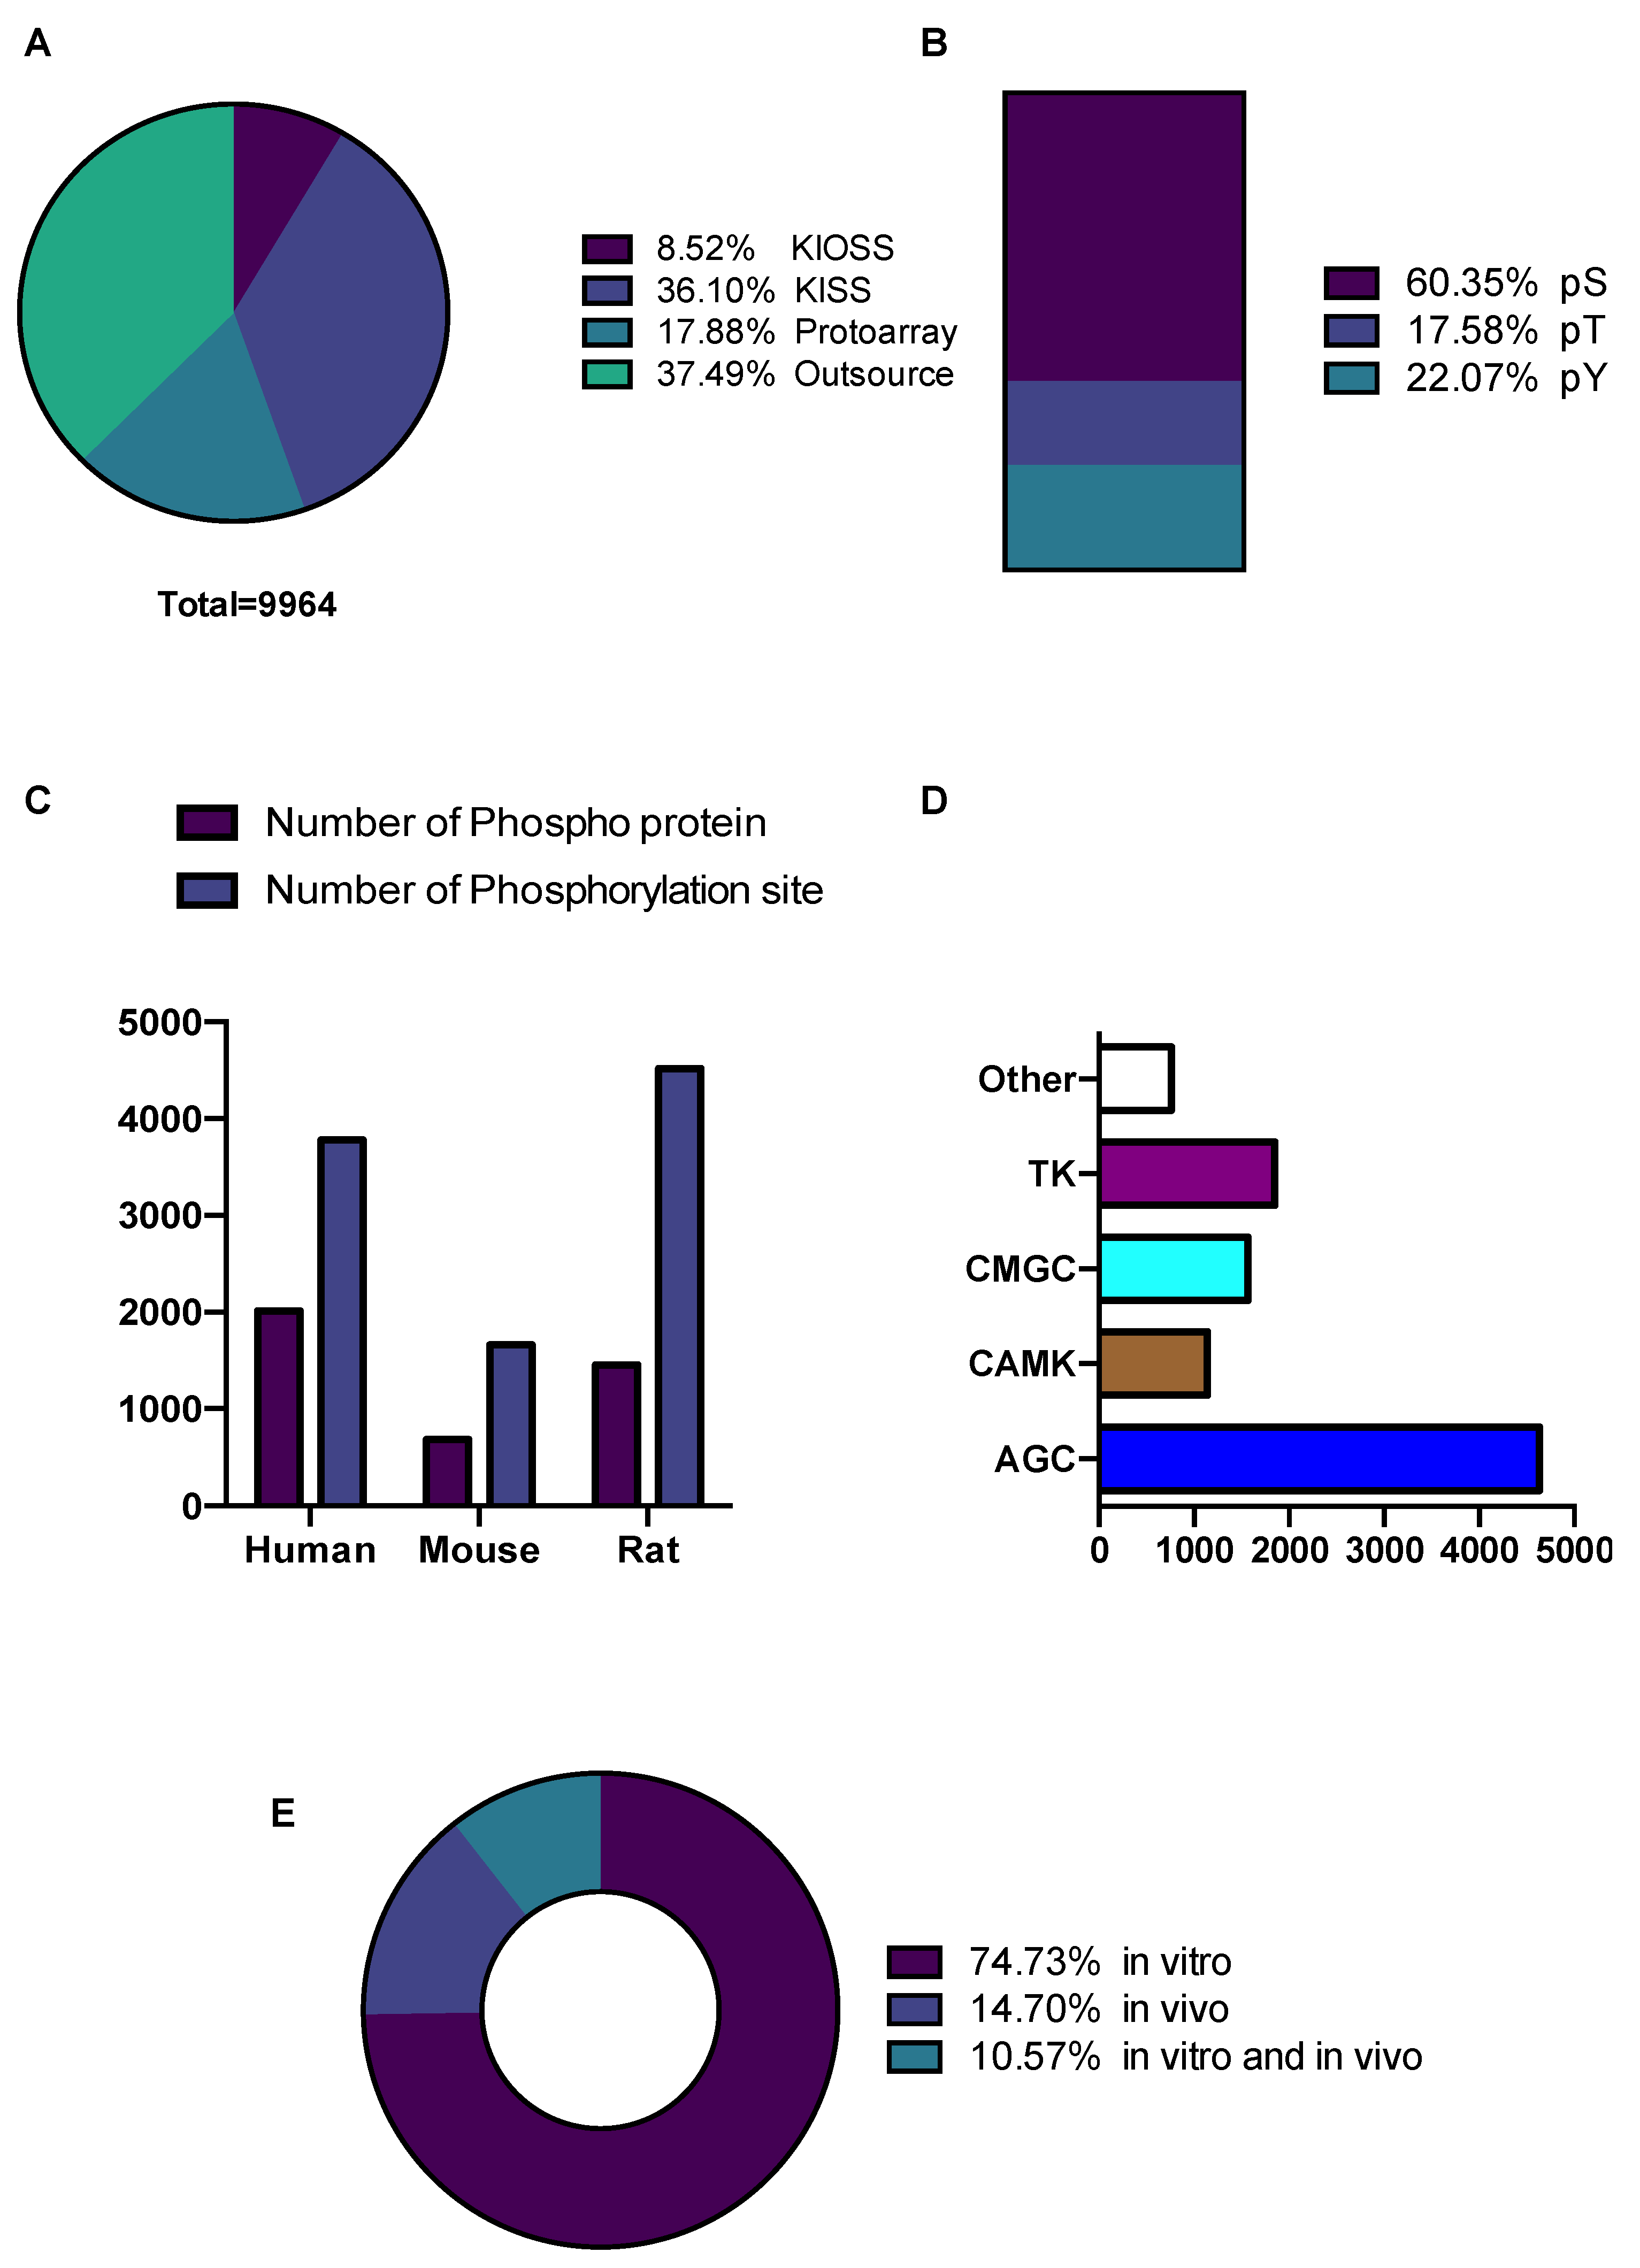
3.1. Construction and Content of the KANPHOS Database

To construct the KANPHOS database of protein phosphorylation modification in the brain, we integrated data mainly from our own developed phosphoproteomic method (45%), from the literature (37%) and from Protoarray (18%) (Figure 1 and Figure 2A). To obtain kinase-oriented protein phosphorylation information, we developed the KISS method for in vitro phosphoproteins [33] and the KIOSS approach for in vivo phosphorylation dependent signaling [34]. In the KISS method, an active catalytic domain of the kinase of interest is used as bait to enrich the substrates, and the interacting proteins were subsequently phosphorylated by the active catalytic domain by incubation with or without ATP (Figure 1A). Liquid chromatography/tandem mass spectrometry (LC/MS/MS) phosphoproteomics was performed to identify the kinase-interacting proteins (candidate substrates) and their phosphorylation sites. We applied the KISS approach to a wide range of Ser/Thr and Tyr protein kinase families: Rho-kinase, Protein Kinase A (PKA), Protein Kinase B (PKB or Akt), protein kinase N (PKN), calcium/calmodulin-dependent protein kinase I (CaMK1), mitogen-activated protein kinases (MAPK), cyclin-dependent kinase 5 (CDK5), p21 (RAC1) activated kinase 7 (PAK7), Glycogen Synthase Kinase 3 Beta (GSK3β), Casein kinase 2 (CK2), Lck/Yes-related novel protein tyrosine kinase (LYN) and FYN oncogenes related to SRC, FGR, and YES (FYN) (Table 1) [25,35,36].
In the KIOSS method, cell or tissue cultures were treated with an agonist, kinase inhibitor, and/or phosphatase inhibitor, and phosphoproteins were enriched from the lysate with phospho-Ser/Thr-binding proteins, followed by LC-MS/MS analyses to identify phosphoproteins and their phosphorylation sites (Figure 1B). We chose the 14-3-3ζ protein, tryptophan–tryptophan (WW) domain, and forkhead-associated (FHA) domain as the phospho-Ser/Thr-binding modules because these modules contain proteins that broadly regulate the function of their target proteins in a phosphorylation state-dependent manner and contribute to cellular phospho-signaling networks [37]. We performed KIOSS to analyze Rho-kinase-mediated phosphorylation in HeLa cells [27], PKA and dopamine D1 receptor-mediated phosphorylation in the mouse striatum [26]. The ratio of protein phosphorylation sites identified using the KISS method was 36%, whereas the KIOSS method identified 9% of the total entries (Figure 2A).
Published phosphoproteomics datasets were collected from the literature by searching PubMed using keywords including ‘phosphoproteomic’, ‘phosphoproteomics’ and ‘phosphoproteome’. The retrieved literature was manually reviewed and curated by our professional staff; experimentally identified candidate substrates and phosphorylation site information were collected and cross-checked with other databases, such as UniProt, PhosphositePlus, and PhosphoELM. In addition to manual curation from the literature, data were also collected from Protoarray, which provides data generated by substrate screening for proteins phosphorylated by recombinant kinases. Each kinase was assayed at 5 nM and 50 nM in the presence of γ33P ATP to explore the phosphorylation of more than 9000 human proteins printed on the Protoarray® microarray (Kinase Substrate Identification service, Invitrogen) [38,39]. However, these data did not contain information relating to protein phosphorylation sites. The ratio of the protein phosphorylation identified from the published literature and the Protoarray method was 37% and 18% of the total entries, respectively (Figure 2A).
The distribution of phosphoproteins and their phosphorylation sites, different residue types, and species are summarized and represented in Figure 2. In total, 9964 phosphorylation sites were identified in 4141 phosphoproteins. The numbers (and percentages) of phosphoserine (pS), phosphothreonine (pT), and phosphotyrosine (pY) were 4937 (60%), 1438 (18%), and 1850 (22%), respectively (Figure 2B); a higher ratio of pY was detected because of data obtained from FYN and LYN kinase using the KISS method. Most of the identified phosphorylation sites were phosphoserine. Although data from different species were included in KANPHOS, most of the phosphorylation events listed here are from rodents. The three species with the highest levels of phosphoproteins (phosphorylation sites) were humans (2010 (3782)), rats (1452 (4520)), and mice (680 (1662)) (Figure 2C). Furthermore, the potential upstream kinases associated with these phosphorylation sites were annotated using kinase motif preferences (Figure 2D). Most of the predicted phosphorylation sites belonged to the AGC family kinase (4631). The other kinase families, CAMK, CMGC, and TK, contain 1141, 1564 and 1850 phosphorylation sites, respectively. Among the predicted phosphorylation sites, 7445 (75%) were detected in vitro, 1465 (15%) were detected in vivo and approximately 1053 (10%) were detected both in vitro and in vivo (Figure 2E).

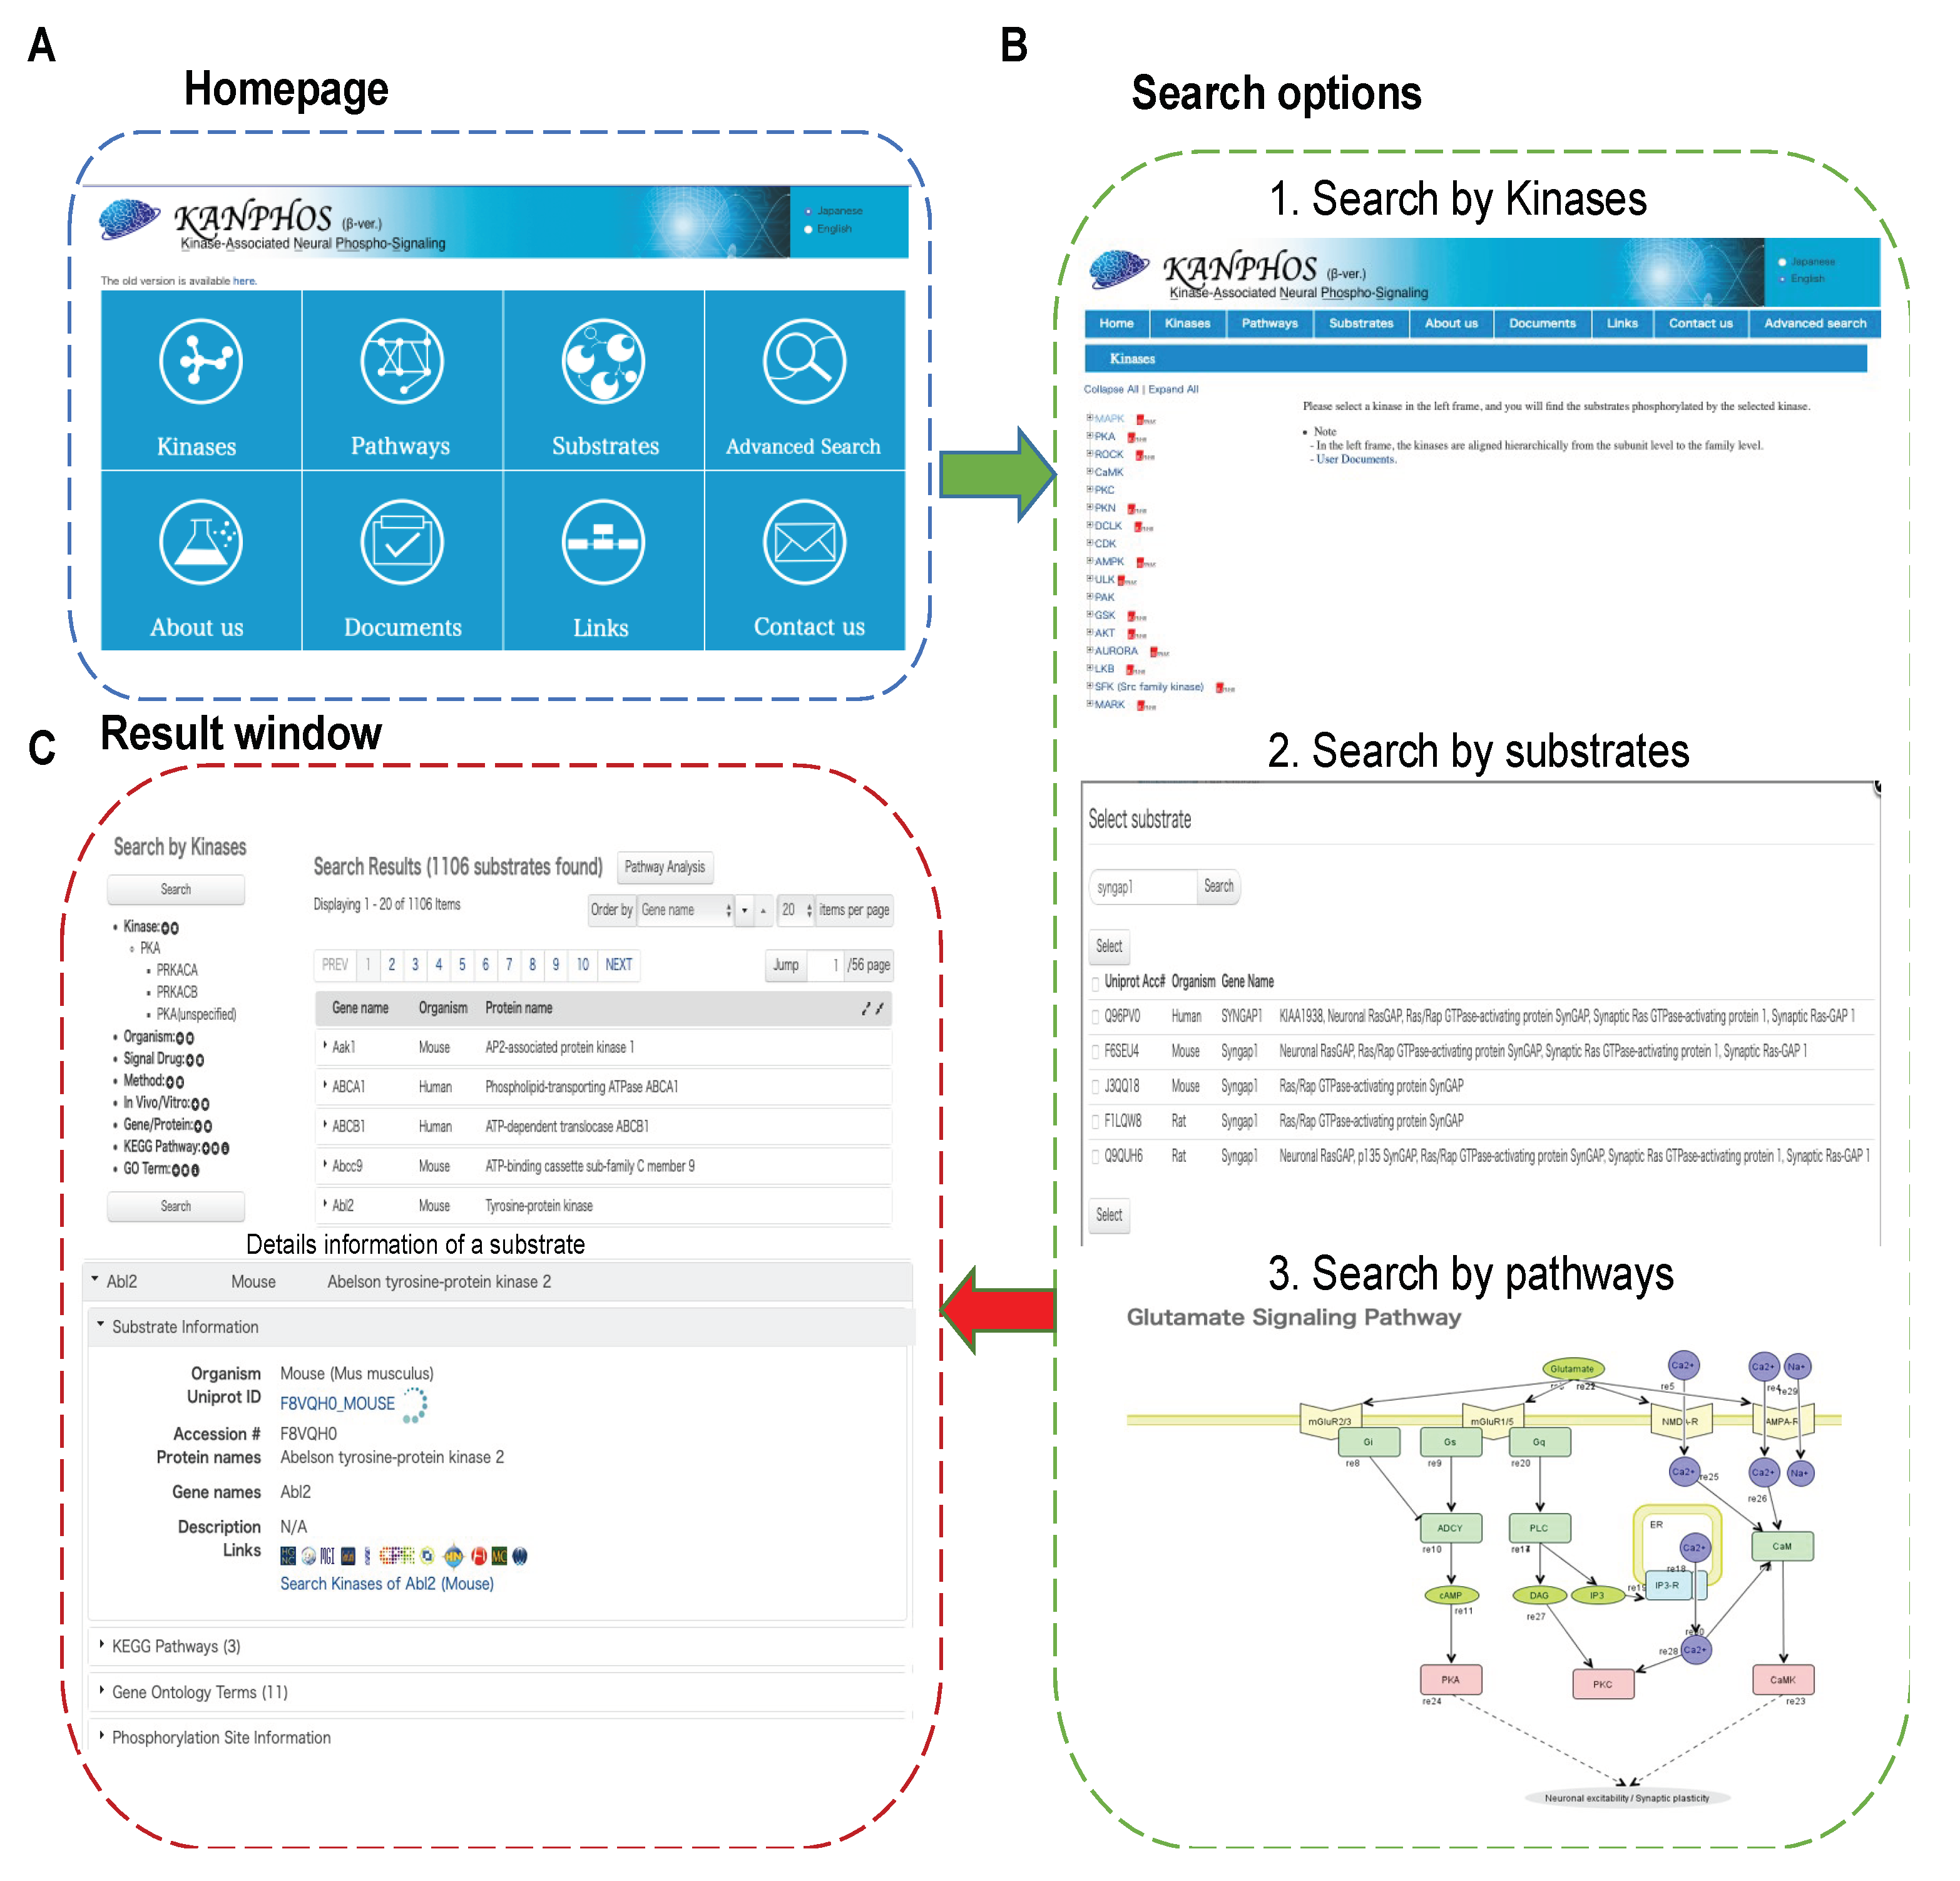
3.2. Data Accessibility and KANPHOS Workflow

To facilitate access to the KANPHOS database in a user-friendly manner, a web interface was developed with browsing and search options to facilitate the query of protein phosphorylation events. An overview of the KANPHOS workflow is shown in Figure 3. Three search options were provided on the KANPHOS homepage: 1. search for the proteins phosphorylated by selected kinases; 2. search for the kinase responsible for phosphorylating selected substrates; and 3. search for phosphorylated proteins along with responsible kinase within pathway maps. Advanced search options are available to allow search by gene symbol/protein names, species, KEGG pathways, and Gene Ontology in a window at the left of the results list (Figure S1). The search results can be further filtered by experimental conditions, methods, extracellular signals, in vivo/in vitro, and chemical treatments (Figure S1). When advanced search options and/or experimental conditions are selected, only the candidate substrates that contain the string that is entered will be displayed in the search results, which enables users to quickly retrieve their data of interest. In the search results page, the results are listed, and detailed protein information can be shown by clicking the protein names. Under the selected protein, general information about the proteins, associated pathways, annotated GO terms, and phosphorylation sites can be seen on the same page. Small icons that directly link to the protein data in HUGO, rat genome database (RGD), mouse genome informatics (MGI) database, GeneCards, Allen Brain Atlas, HomoloGene, HuGENavigator, H-inv, MalaCards, and Diseases are displayed next to the general information (Table S1). Users can click the phosphorylation site information option to view the detailed information, which includes the responsible kinases, phosphorylation positions and residue types, peptide sequences, experimental methods, extracellular signals and associated drug treatment (Figure S2).

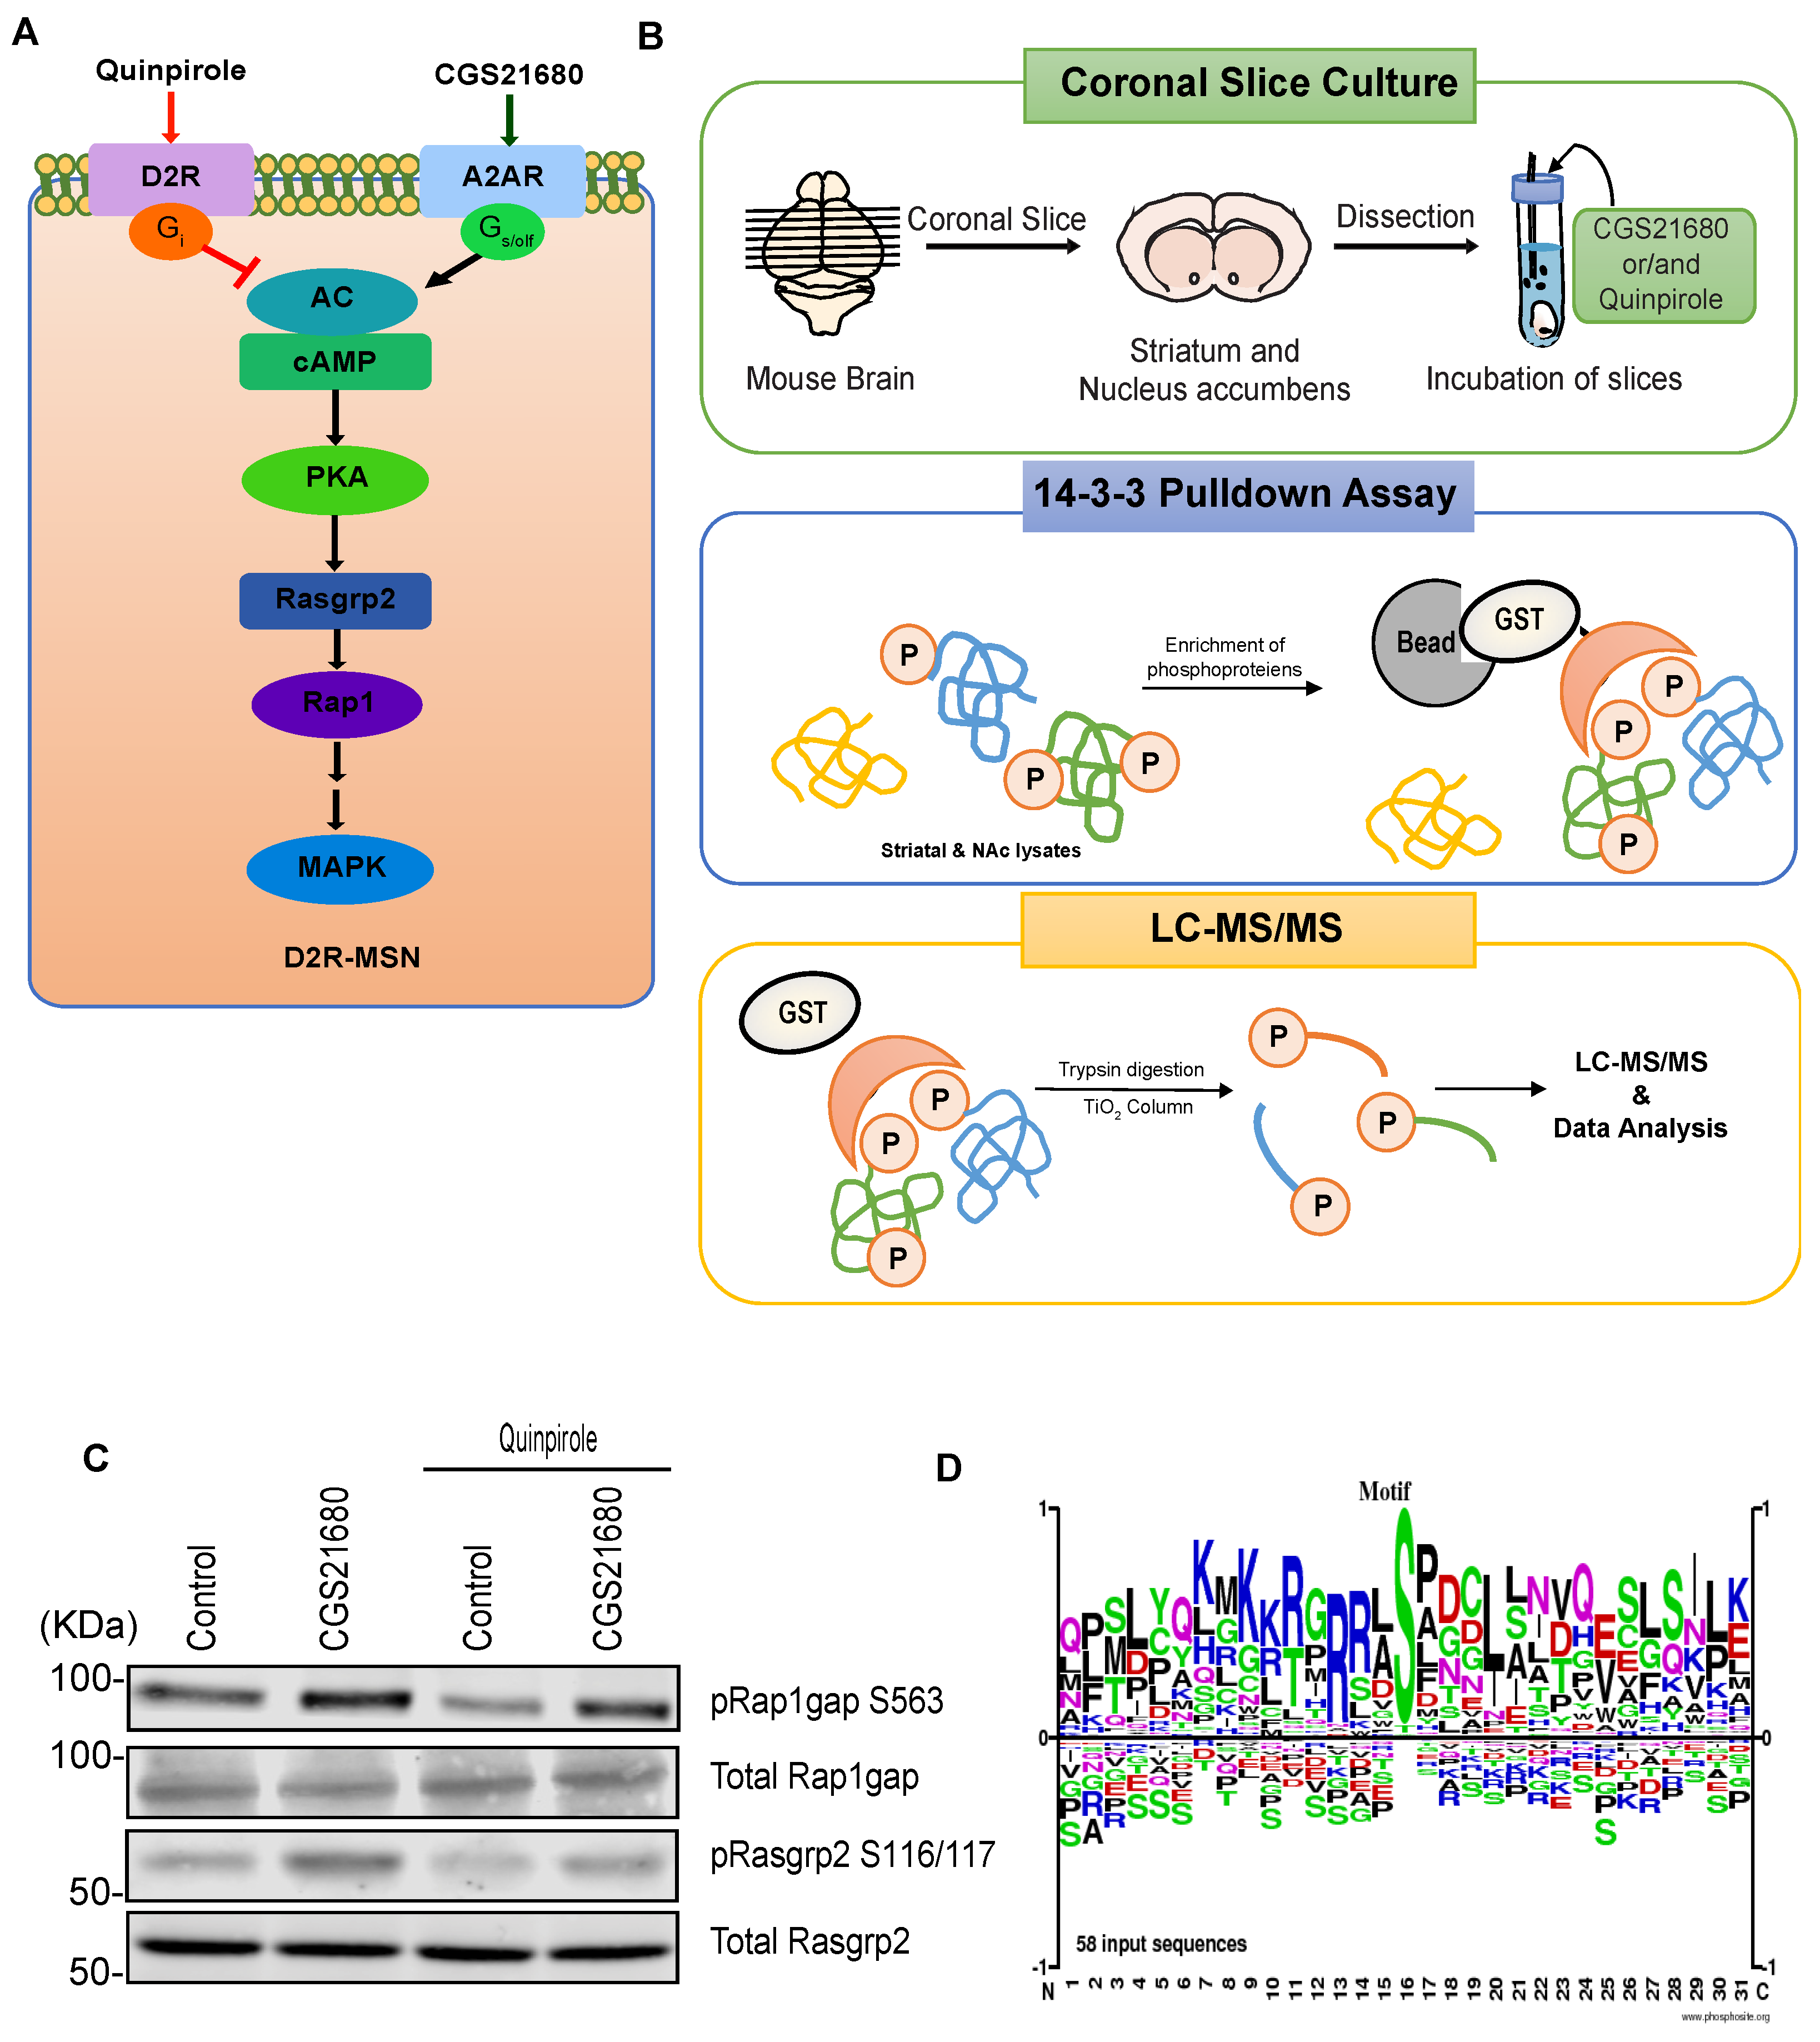
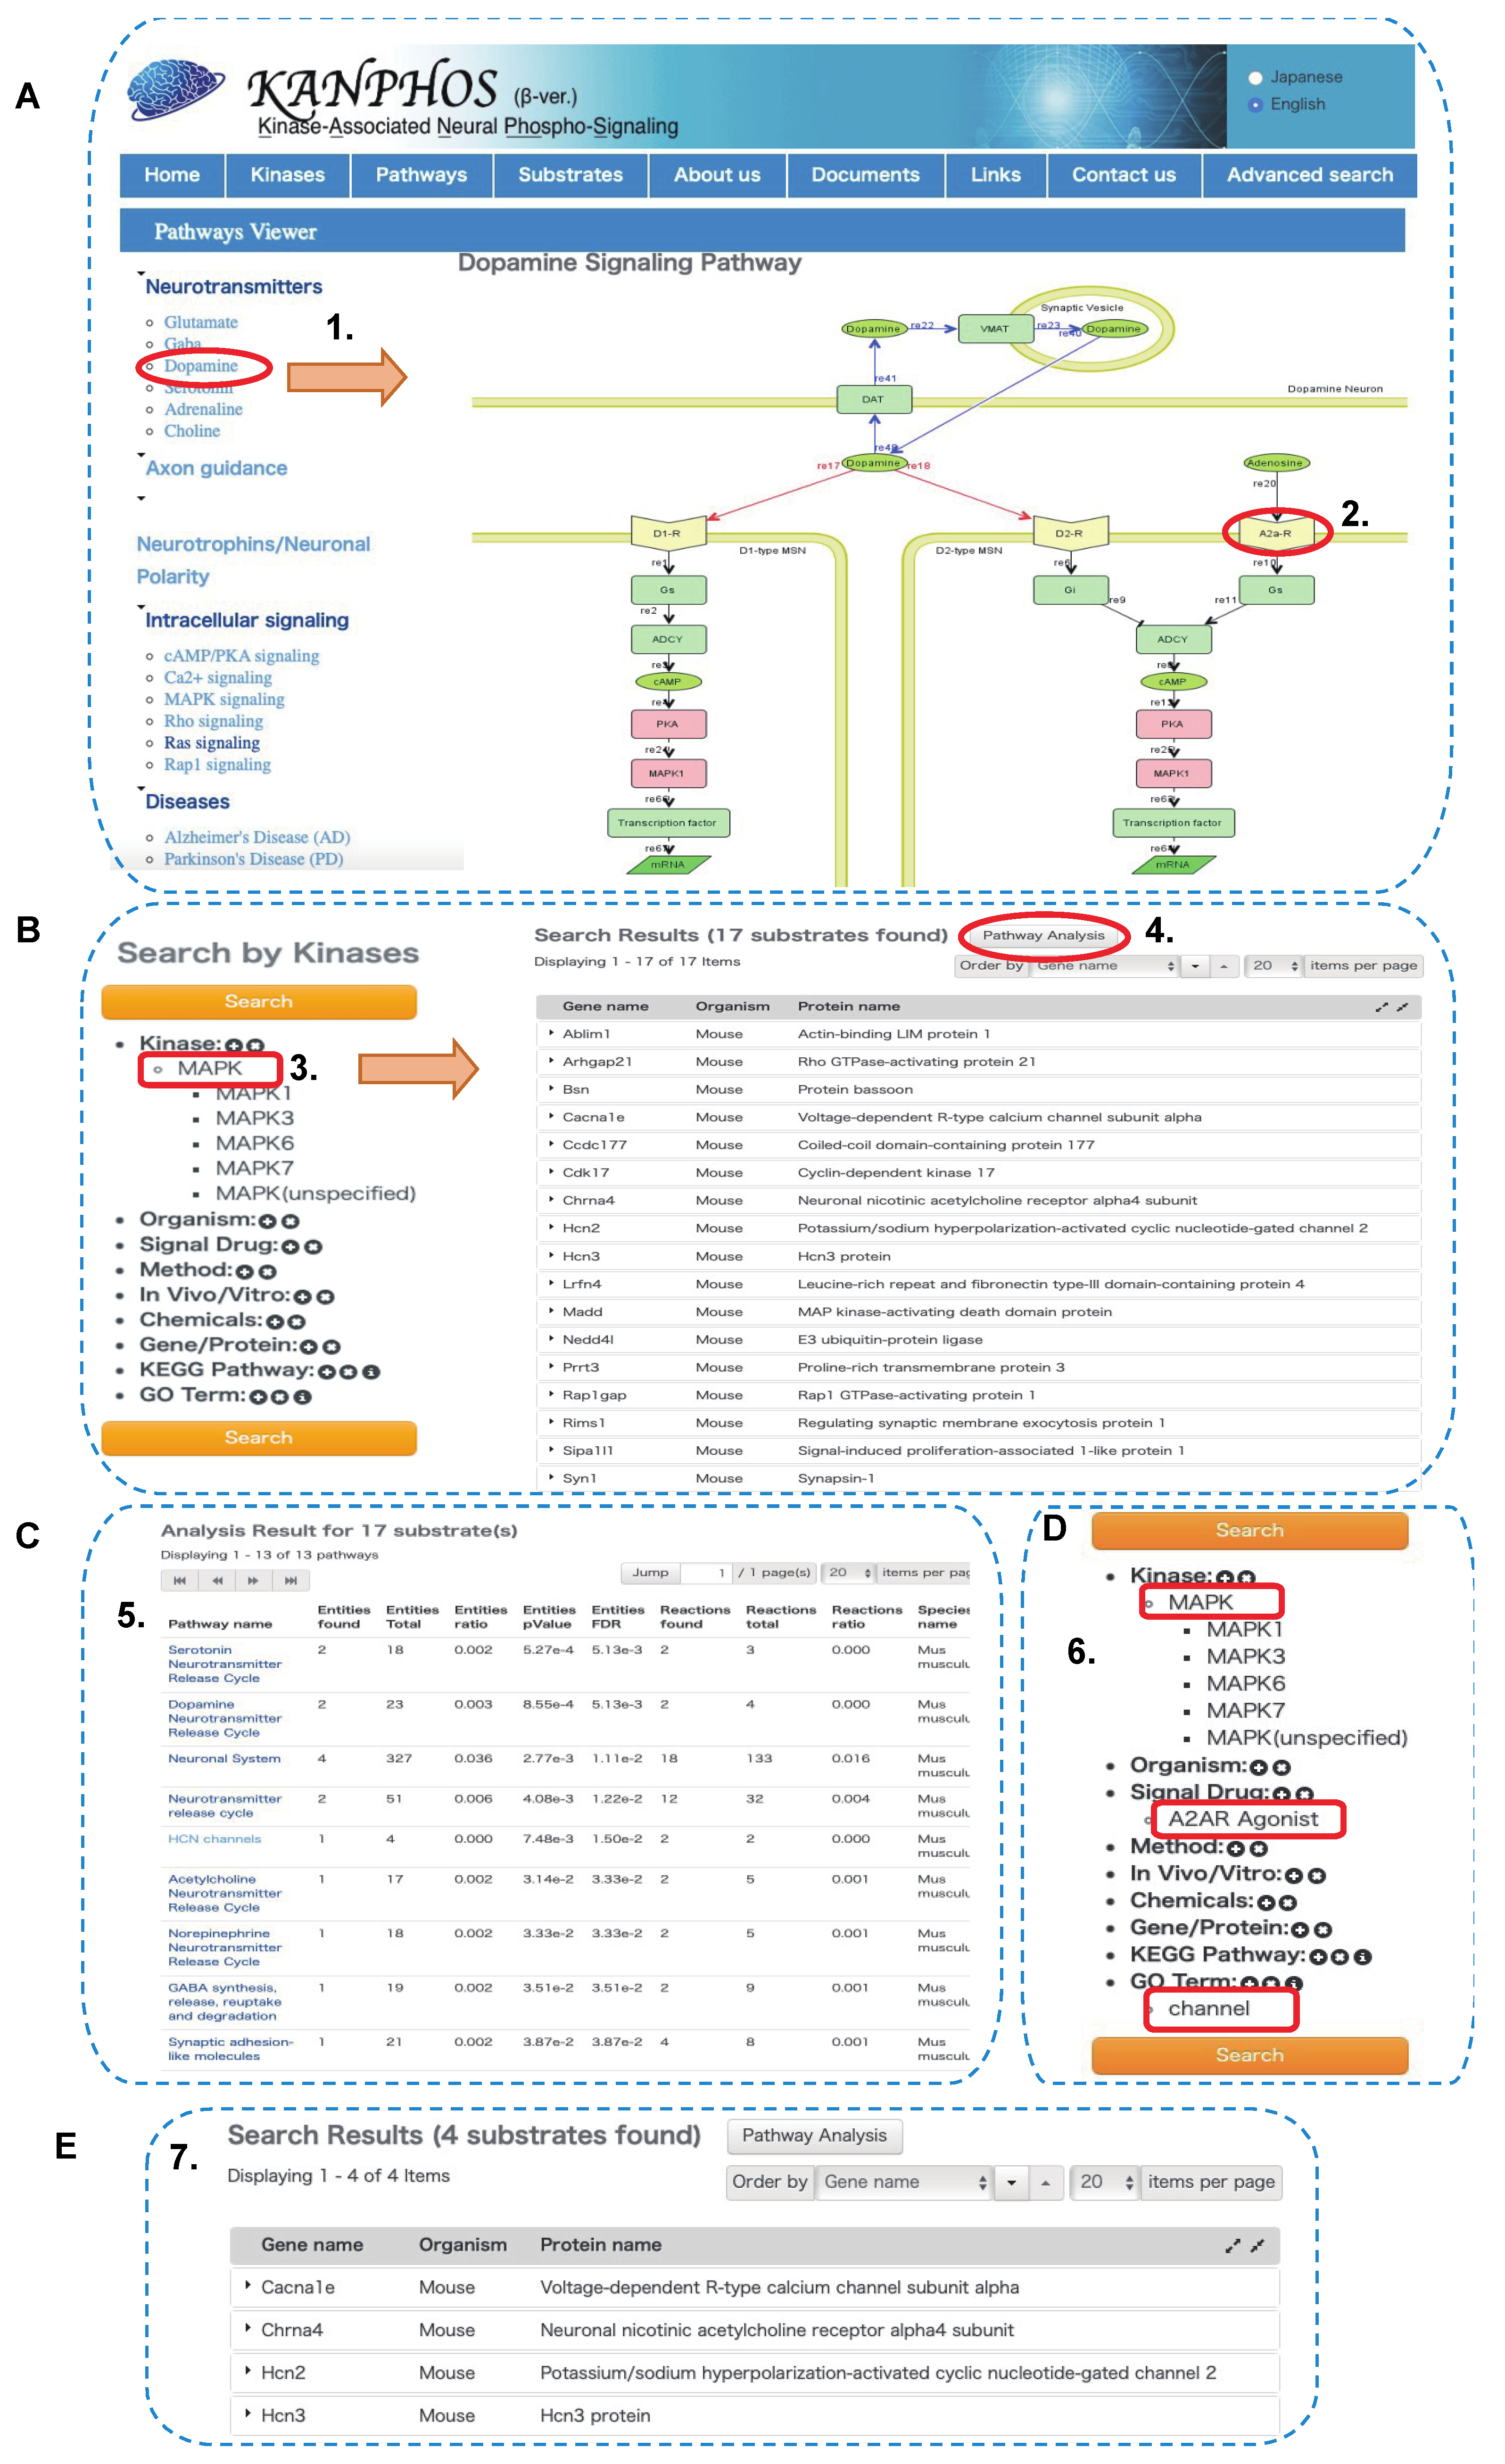
3.3. Case Study: Identification of Adenosine-A2A Receptor Signaling and MAPK-Mediated Signaling Molecules Using KANPHOS

To examine how the KANPHOS database works, we performed KIOSS to obtain phosphoproteomic data downstream of the adenosine signaling pathway in the striatum/NAc. We used this study as a model to demonstrate the ability of the KANPHOS database to identify novel phosphorylation-dependent signaling dynamics in the brain.
Adenosine is an important neuromodulator in the striatum/NAc that acts through adenosine A1 receptor (A1R) or adenosine A2A receptor (A2AR) [40]. Approximately 95% of striatal and accumbal neurons are medium spiny neurons (MSNs) that express either the dopamine D1 receptor (D1R-MSNs) or dopamine D2 receptor (D2R-MSNs) [41,42]. In the striatum/NAc, D2R-MSNs express A2AR, which couples to the Golf protein, whereas D1R-MSNs express A1R, which couples to the Gi protein [43,44,45]. Thus, PKA activity in D2R-MSNs was positively regulated by adenosine-A2AR and negatively regulated by dopamine-D2R (Figure 4A). To identify novel phosphoproteins downstream of adenosine-A2AR signaling, mouse striatum/NAc slices were treated with the A2AR agonist CGS21680 and the D2R agonist quinpirole (Figure 4B). PKA activity was confirmed by monitoring the phosphorylation level of well-known PKA substrates (Rap1gap at S563, and Rasgrp2 at S116/117) by immunoblotting [46,47]. Treatment of slices with CGS21680 increased the phosphorylation level of Rap1gap at S563, and Rasgrp2 at S116/117 (Figure 4C). The CGS21680-stimulated phosphorylation of Rap1gap at S563, and Rasgrp2 at S116/117 was blocked by pretreatment with quinpirole (Figure 4C). These results suggest that adenosine A2AR regulates PKA activity in the striatum and NAc.
Next, we performed phosphoproteomic analysis using the KIOSS method, in which affinity beads coated with the pS/T-binding domain 14-3-3ζ were used to enrich phosphorylated proteins. The bound proteins were digested using trypsin/Lys-C and loaded onto a TiO2 column to enrich for phosphopeptides, followed by LC-MS/MS to identify the phosphorylated proteins and their phosphorylation sites (Figure 4B). Almost 80% of the phosphoproteins enhanced by A2AR agonists were inhibited by D2R agonists; thus, these phosphoproteins represent candidate substrates of adenosine signaling. These candidates were listed in Table 2. Motif analysis using the amino acid sequence logo of the identified phosphopeptides revealed that approximately 55% of the phosphorylation sites contained basic residues at the -3 and -2 positions, suggesting that the AGC group of protein kinase such as PKA was responsible for these phosphorylation events (Figure 4D). Proline at the +1 position was observed at about 20% of these sites, suggesting that they are phosphorylation sites for proline-oriented kinases such as MAPK1/3.
We previously found that adenosine activated Rap1 through the phosphorylation of Rap1gap and Rasgrp2, thereby activating the MEK-MAPK pathway, which plays a critical role in adenosine-mediated aversive learning [48]. We next performed the KIOSS approach to explore MAPK-mediated signaling. The striatum/NAc slices were treated with a phosphatase inhibitor (okadaic acid) and/or a MEK inhibitor (U0126). Treatment of the slices with okadaic acid increased the phosphorylation of MAPK1/3 at T202/Y204, whereas pretreatment with a MEK inhibitor (U0126) reduced this okadaic acid mediated phosphorylation (Figure 5A). Treatment with okadaic acid also increased the phosphorylation of known PKA substrate GluR1 at S845, but pretreatment with U0126 did not affect this phosphorylation, indicating that U0126 specifically inhibited MAPK1/3 activation. The cell lysates were pulled down by beads coated with 14-3-3ζ to enrich for phosphoproteins. The bound proteins were subjected to tryptic digestion and LC-MS/MS to identify the phosphorylated proteins and their phosphorylation sites. The okadaic acid treatment induced the phosphorylation of huge numbers of proteins, including MAPK substrates, and pretreatment with U0126 specifically inhibited MAPK-mediated phosphorylation. Thus, the comparison between the treatments with okadaic acid and okadaic acid with U0126 identified more than hundreds of MAPK candidate substrates (Table 3). Comparison of MAPK candidate substrates with A2AR downstream phosphoproteins identified 22 phosphoproteins that were phosphorylated by MAPK downstream of adenosine signaling (Figure 5C,D). There were more candidate substrates obtained by the KIOSS method than those phosphorylated by MAPK downstream of the A2AR agonist. The candidate substrates did not overlap much. This may be due to the higher sensitivity of the KIOSS method. The identification of the related signaling pathways to the obtained phosphoproteins by using the Reactome database (available online: http://www.reactome.org/ (accessed on 7 November 2021)) revealed several potassium and Hyperpolarization-activated cyclic nucleotide gated (HCN) channels that may potentially be involved in neuronal excitability (Figure 5B).
Among the identified phosphoproteins, Arhgap21 was detected as a candidate substrate for both PKA and MAPK downstream of adenosine signaling. In the next section, we describe the use of the KANPHOS database using Arhgap21 as an example. Phosphorylated proteins can be searched by clicking the “Kinases” icon on the home page, which will open the “kinases” page. Protein kinases are listed on the left of the page, and subtype cascades can be opened by clicking the “plus” icon associated with each kinase (Figure 6A). There are links to the IUPHAR (International union of basic and clinical pharmacology) protein kinase pages for each kinase. As we previously described, adenosine signaling activates PKA; therefore, if we choose PKA from the kinase list, the result page will be open. Using the advanced search window on the left side of the result page, we can further filter the candidate substrates list by selecting “Signal drug” (A2AR agonist) to identify phosphoproteins downstream of adenosine signaling. A list of candidate phosphoproteins will appear, listing only perfect matches to the string that was entered. From the list of candidate substrates, we chose Arhgap21 and clicked on it to obtain general information about the protein and detailed information about the phosphorylation sites (Figure 6A).
To identify the kinase responsible for phosphorylating a specific substrate, the user can click on “Substrates” icons on the home page and then enter the substrate name (Figure 6B). Here, we entered Arhgap21 and then clicked the “Search” button to generate a list of available substrate of Arhgap21 in various species. We then selected only those substrate data that were obtained from mice and clicked the “Select” button to add the substrate name. This opened a list of kinases that phosphorylate Arhgap21 in mice. A similar filter option was applied in the advanced search option “Signal drug” (A2AR agonist) to identify kinases (PKA, MAPK) that phosphorylate Arhgap21 in adenosine signaling (Figure 6B).

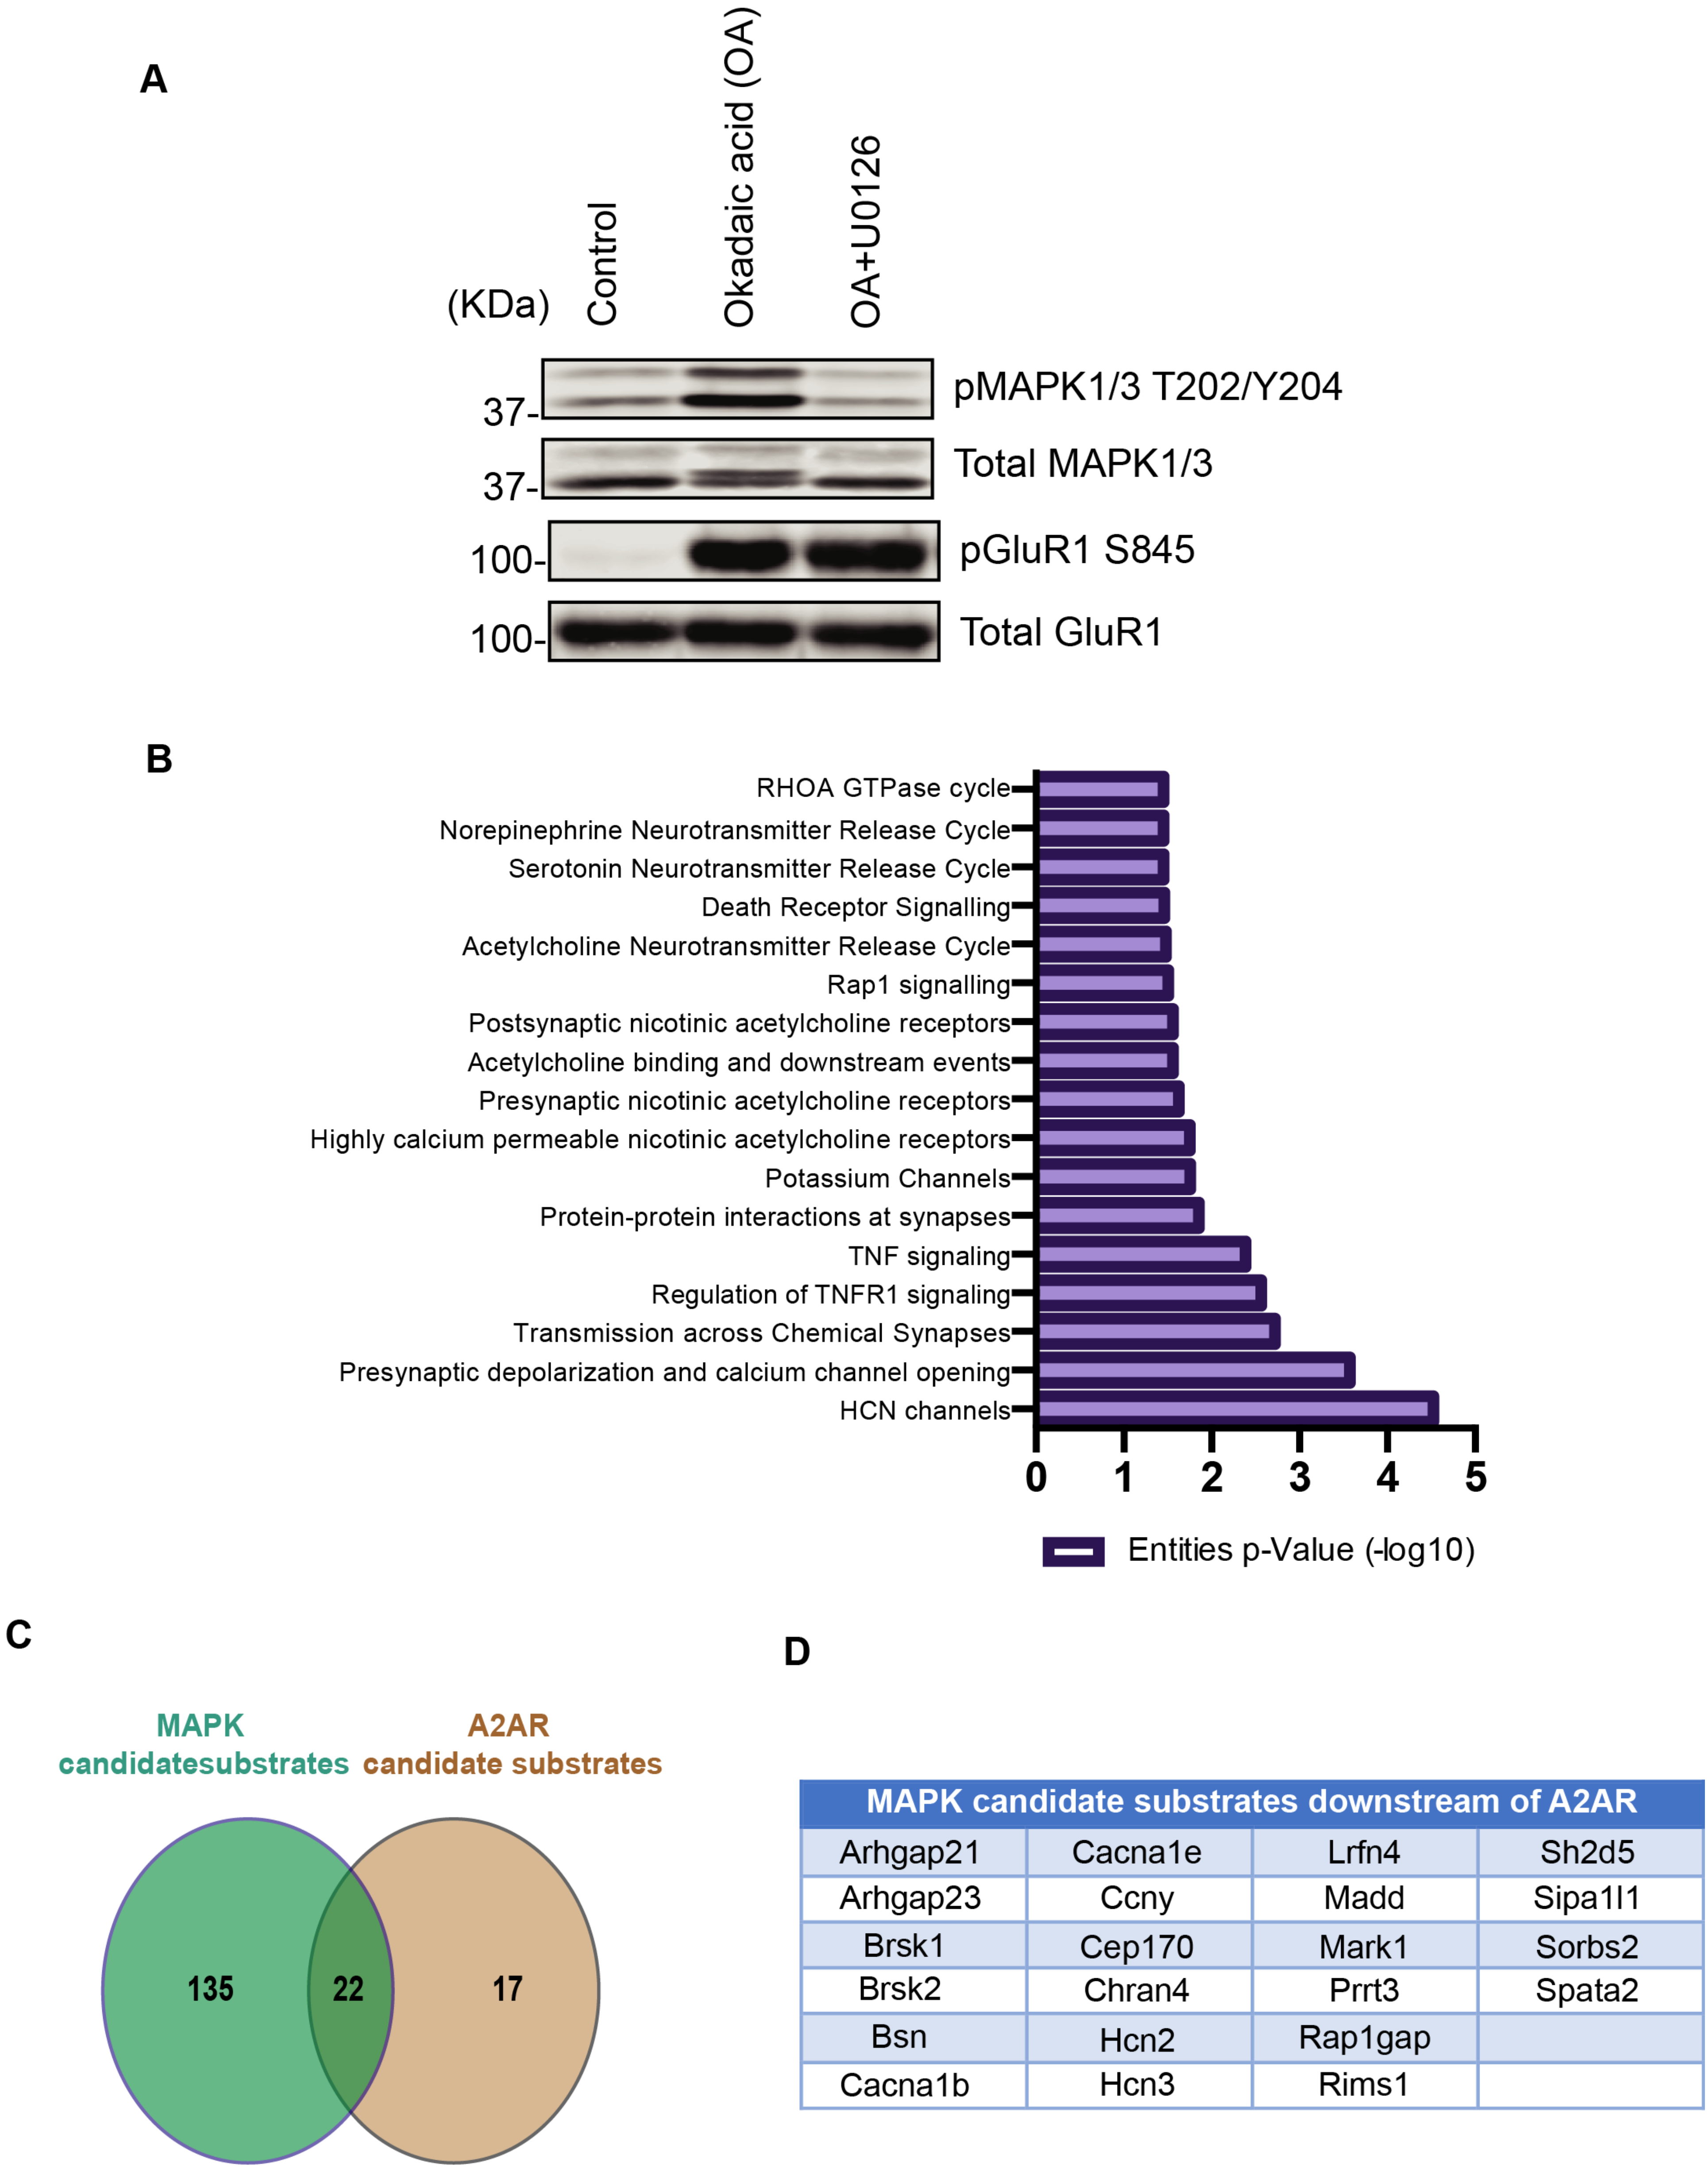
3.4. Pathway Analysis Using KANPHOS Revealed That HCN and Calcium Channel Proteins Are Involved in the MEK-MAPK Pathway Downstream of A2AR

Protein phosphorylation orchestrates neurotransmitter release, neuronal polarity, and neuronal signaling pathways and is involved in the pathogenesis of many neurological diseases; thus, pathway analysis using the KANPHOS database could provide a means to understand how phosphorylation events can regulate neuronal signaling events. In the previous section, we identified MAPK candidate substrates. Here, we propose a workflow for analyzing MAPK phosphoproteomics data using KANPHOS pathway analysis as a model study to identify novel phosphoproteins downstream of the MEK-MAPK pathway in A2AR (Figure 7). First, click on the “Pathways” icon on the home page, which opens the pathway viewer window. Here, we can find five main search options on the left frame: 1. neurotransmitter, 2. axon guidance, 3. neuronal polarity, 4. intracellular signaling, and 5. neuronal diseases. Additionally, each option is composed of several other search options that users can select according to their interests. As we wanted to focus on A2AR signaling, we began with the neurotransmitter section by choosing dopamine, which opened the pathway viewer image of dopamine signaling in dopamine neurons (Figure 7A). Effector molecules are designated as green, and kinases are designated as pink. Clicking on a specific kinase opens the detailed view of its substrate list along with all phosphorylation information. MAPK was selected from the D2R-MSN signaling pathway, and 17 phosphoproteins were found to be candidate substrates of MAPK downstream of A2AR signaling (Figure 7B). To obtain more information on the identified candidate substrates, the user can perform pathway analysis by clicking on the upper right corner of the substrate list to reveal the associated Gene Ontology terms. All the identified pathways related to the candidate substrates will appear in a tabular format according to their p-value (Figure 7C). Here, we found several phosphoproteins that are involved in regulating hyperpolarization-activated cyclic-nucleotide gated (HCN) channels. To further find which phosphoproteins are involved in this channel regulation process downstream of A2AR, next we go to the advance search option and from which we select Kinase (MAPK), signal drug (A2AR Agonist) and GO term (Channel) (Figure 7D). After choosing this option, the search can be conducted and results will appear including phosphoprotein name. Here, we identified, HCN channels (Hcn2, Hcn3), and voltage-dependent R-type Calcium voltage-gated channel Alpha 1E subunit (Cacna1e) (Figure 7E). Previously, it was reported that MAPK was involved in regulating HCN channel [49,50] and calcium channel function [51]. Thus, KANPHOS pathway analysis can help researchers to explore further associations between MAPK and HCN and calcium channel properties downstream of A2AR signaling. The bottom left corner of the pathway search window displays specific sections for neuronal diseases, e.g., Alzheimer’s disease, Parkinson’s disease, and schizophrenia. By clicking on a specific disease, a KANPHOS pathway search can also be initiated to identify the relationships between the neurological disease and phosphorylation-dependent signaling events (Figure S3). In the pathway analysis of KANPHOS, a search for Alzheimer’s disease pathways reveals that CDK5 and GSK3β are important kinases involved in the pathogenesis of Alzheimer’s disease. Currently, 208 and 128 phosphoproteins are registered in KANPHOS as candidate substrates for CDK5 and GSK3β, respectively. For example, in these lists, CRMP2 (collapsin response mediator protein 2; also known as dihydropyrimidinase-like protein-2, DRP2 or DPYSL2) is an abundant protein in the brain that regulates axonal growth and neuronal polarity, is phosphorylated by CDK5 at S522 and GSK3β at T509, T514, and S518, and is involved in the pathogenesis of Alzheimer’s disease [52,53,54]. These phosphorylations are abnormally high in the brains of Alzheimer’s disease patients [55]. Thus, using KANPHOS pathway analysis, it is possible to search for kinases and their substrates involved in Alzheimer’s disease, which is useful in the search for new drug targets for the treatment of Alzheimer’s disease.

4. Discussion

Protein phosphorylation is one of several general mechanisms that regulates the function of proteins and signal transduction in the cell, which regulates many biological processes, including cell proliferation, growth, differentiation, and metabolism. To understand the biological role of phosphorylation, it is necessary to characterize upstream signal transduction, including the kinases responsible for phosphorylation and the functional changes in downstream molecules. Phosphorylation signaling cascades vary among tissues, and completely different cellular reactions can result from the same protein phosphorylation event in different tissues due to slight differences in the cascade components. Our KANPHOS database is designed to refer not only to phosphorylation and the responsible kinases but also to related diseases, genetic polymorphisms, and knockout mice. By examining these associated data and pathway analysis of the protein phosphorylation selected in the KANPHOS search results, the signaling cascades participating in the phosphorylation of the target protein can be predicted. Compared to the other conventional databases, brain-specific, signal transduction and kinase-oriented phosphorylation data collection is unique to KANPHOS, and would provide high quality data with good usability for neuroscientists.
Our current phosphorylation data are derived mainly from the mouse striatum and from cell lines such as HeLa cells, but other tissues such as the mouse forebrain, hippocampus, liver, muscle, and cancer cell lines could be further targets of our KISS/KIOSS phosphoproteomics research. With recent improvements to the CRISPR system, kinases can be easily knocked out in various cell lines. Our in vivo protein phosphorylation screening method, KIOSS, can be used to monitor phosphorylation-dependent signaling cascades that completely lack the target kinases. However, there remain several limitations for improving in KANPHOS. The tissues and cells deposited in the database are mainly brain and neuronal cells. We need to obtain and process phosphoproteomic data from other repositories, along with empirically examining other tissues and cell lines to produce additional tissues/cell-specific phosphoproteomic profiles, to add to our database. The number of target kinases in KIOSS is limited because we need to establish effective agonist/antagonist treatment conditions for each kinase, but knockdown of each kinase by improved gene targeting methods will help us to systematically perform KIOSS analysis on kinases of interest. As a future perspective, we will continuously update KANPHOS by incorporating phosphoproteomics data based on our experimental results and links with other databases. We are preparing the data of phosphorylation-dependent signaling by several neurotransmitters in the specific brain regions, and mounting search options to narrow down the result by brain regions as the next step.
Protein kinases such as Pak3, Limk1, ERK, and RSK2 have been implicated in intellectual disability [56,57]. However, the mechanisms by which these protein kinases are involved in intellectual disability are largely unknown. Neurodevelopment is thought to be involved in the pathogenesis of psychiatric disorders such as ASD, schizophrenia, and bipolar disorder, but the causes and etiology of these diseases are unknown. For schizophrenia, the dopamine hypothesis has been proposed because D2R antagonists are widely used as therapeutic agents for schizophrenia [58]. The glutamate hypothesis has also been proposed, since long-term administration of phencyclidine, an NMDA-R antagonist, causes schizophrenia-like symptoms [59]. D2R antagonist activates the adenosine-MAPK pathway [32]. This database will be useful to understand the pathogenesis of neurodevelopmental disorders, including intellectual disability and schizophrenia, to understand the mechanism of action of D2R antagonists and to develop new therapeutic drugs.

Supplementary Materials

The following are available online at https://www.mdpi.com/article/10.3390/cells11010047/s1: Figure S1: Details information and search options on result window of a phosphoprotein. Figure S2: Advance search options in KANPHOS. Figure S3: Identification of signaling network and phosphoproteins involvement in Alzheimer’s disease by KANPHOS pathway analysis. Table S1: List of external databases associated with KANPHOS database.

Author Contributions

Conceptualization, K.K.; software, T.K. and J.Y.; formal analysis, R.U.A., T.N. (Tomoki Nishioka) and M.A.; investigation, R.U.A., Y.F., D.T., M.O.F.; Y.Y., T.N. (Taku Nagai), M.A. and T.N. (Tomoki Nishioka); data curation, R.U.A., J.Y., T.K., T.N. (Tomoki Nishioka) and M.A.; writing—original draft preparation, R.U.A. and T.N. (Tomoki Nishioka); writing—review and editing, K.K., M.A. Y.F. and T.N. (Tomoki Nishioka); supervision, K.K. and K.Y.; project administration, K.K.; funding acquisition, K.K. All authors have read and agreed to the published version of the manuscript.

Funding

This work was supported by the following funding sources: ‘‘Bioinformatics for Brain Sciences’’ performed under SRPBS from MEXT and AMED (K.K.); AMED grant numbers: JP18dm0207005 (K.K.), JP21dm0207075 (K.K.), JP21wm0425017 (Taku Nagai), J.Y. and Y.F.) and JP21wm0425008 (J.Y.); JSPS KAKENHI grant numbers JP16K18393 (Y.F.), JP17H01380 (K.K.), JP17K07383 (M.A.), JP17H02220 (Taku Nagai), JP17K19483 (Taku Nagai), JP18K14849 (Y.F.), JP19K16370 (Y.Y.), JP21K06428 (Y.F.) and JP21K06427 (D.T.); MEXT KAKENHI grant numbers JP17H05561 (K.K.), JP19H05209 (K.K.) and JP21H00196 (K.K.); the Uehara Memorial Foundation; the Takeda Science Foundation; and the Hori Sciences and Arts Foundation.

Institutional Review Board Statement

All animal experiments were approved and performed in accordance with the guidelines for the care and use of laboratory animals established by the Animal Experiments Committee of Nagoya University Graduate School of Medicine (approval number: 20094) and Fujita Health University (approval number: AP20037). All experiments were conducted in compliance with the ARRIVE guidelines.

Informed Consent Statement

Not applicable.

Data Availability Statement

The data presented in this study are available in Amano et al., 2015 [25] and Nagai et al., 2016 [26], and the other data are openly available online: “https://kanphos.neuroinf.jp” (accessed on 1 December 2021).

Acknowledgments

We thank K. Kuroda, S. Nakamuta, M. H. Shohag, X. Zhang, E. Hossen, and other Kaibuchi lab members for their skilled assistance and helpful discussions, K. Taki for help with MS data acquisition, S. Usui (The Electronics-Inspired Interdisciplinary Research Institute, Toyohashi University of Technology) for advice on database construction and T. Ishii for secretarial assistance. We also thank the Division for Research on Laboratory Animals and Medical Research Engineering of Nagoya University Graduate School of Medicine and the Education and Research Center of Animal Models for Human Diseases in Fujita Health University.

Conflicts of Interest

The authors declare no conflict of interest.

References

  1. Cohen, P. The origins of protein phosphorylation. Nat. Cell. Biol. 2002, 4, E127–E130. [Google Scholar] [CrossRef] [PubMed]
  2. Pawson, T.; Scott, J.D. Protein phosphorylation in signaling—50 years and counting. Trends Biochem. Sci. 2005, 30, 286–290. [Google Scholar] [CrossRef] [PubMed]
  3. Collins, M.O.; Yu, L.; Coba, M.P.; Husi, H.; Campuzano, I.; Blackstock, W.P.; Choudhary, J.S.; Grant, S.G. Proteomic analysis of in vivo phosphorylated synaptic proteins. J. Biol. Chem. 2005, 280, 5972–5982. [Google Scholar] [CrossRef] [PubMed] [Green Version]
  4. Trinidad, J.C.; Specht, C.G.; Thalhammer, A.; Schoepfer, R.; Burlingame, A.L. Comprehensive identification of phosphorylation sites in postsynaptic density preparations. Mol. Cell. Proteom. 2006, 5, 914–922. [Google Scholar] [CrossRef] [PubMed] [Green Version]
  5. Cohen, P. The role of protein phosphorylation in human health and disease. The Sir Hans Krebs Medal Lecture. Eur. J. Biochem. 2001, 268, 5001–5010. [Google Scholar] [CrossRef]
  6. Manning, G.; Whyte, D.B.; Martinez, R.; Hunter, T.; Sudarsanam, S. The protein kinase complement of the human genome. Science 2002, 298, 1912–1934. [Google Scholar] [CrossRef] [PubMed] [Green Version]
  7. Nestler, E.J.; Greengard, P. Protein phosphorylation in the brain. Nature 1983, 305, 583–588. [Google Scholar] [CrossRef]
  8. Ghanizadeh, A.; Sahraeizadeh, A.; Berk, M. A head-to-head comparison of aripiprazole and risperidone for safety and treating autistic disorders, a randomized double blind clinical trial. Child Psychiatry Hum. Dev. 2014, 45, 185–192. [Google Scholar] [CrossRef] [PubMed]
  9. Posey, D.J.; Stigler, K.A.; Erickson, C.A.; McDougle, C.J. Antipsychotics in the treatment of autism. J. Clin. Investig. 2008, 118, 6–14. [Google Scholar] [CrossRef]
  10. Woods, S.W. Chlorpromazine equivalent doses for the newer atypical antipsychotics. J. Clin. Psychiatry 2003, 64, 663–667. [Google Scholar] [CrossRef]
  11. Leucht, S.; Cipriani, A.; Spineli, L.; Mavridis, D.; Orey, D.; Richter, F.; Samara, M.; Barbui, C.; Engel, R.R.; Geddes, J.R.; et al. Comparative efficacy and tolerability of 15 antipsychotic drugs in schizophrenia: A multiple-treatments meta-analysis. Lancet 2013, 382, 951–962. [Google Scholar] [CrossRef]
  12. Meltzer, H.Y. The role of serotonin in antipsychotic drug action. Neuropsychopharmacology 1999, 21 (Suppl. S2), 106S–115S. [Google Scholar] [CrossRef]
  13. Millan, M.J. Improving the treatment of schizophrenia: Focus on serotonin (5-HT)(1A) receptors. J. Pharmacol. Exp. Ther. 2000, 295, 853–861. [Google Scholar]
  14. Mailman, R.B.; Murthy, V. Third generation antipsychotic drugs: Partial agonism or receptor functional selectivity? Curr. Pharm. Des. 2010, 16, 488–501. [Google Scholar] [CrossRef] [PubMed] [Green Version]
  15. UniProt, C. UniProt: A hub for protein information. Nucleic Acids Res. 2015, 43, D204–D212. [Google Scholar]
  16. Diella, F.; Gould, C.M.; Chica, C.; Via, A.; Gibson, T.J. Phospho.ELM: A database of phosphorylation sites—Update 2008. Nucleic Acids Res. 2008, 36, D240–D244. [Google Scholar] [CrossRef]
  17. Hornbeck, P.V.; Kornhauser, J.M.; Tkachev, S.; Zhang, B.; Skrzypek, E.; Murray, B.; Latham, V.; Sullivan, M. PhosphoSitePlus: A comprehensive resource for investigating the structure and function of experimentally determined post-translational modifications in man and mouse. Nucleic Acids Res. 2012, 40, D261–D270. [Google Scholar] [CrossRef] [PubMed] [Green Version]
  18. Gnad, F.; Gunawardena, J.; Mann, M. PHOSIDA 2011: The posttranslational modification database. Nucleic Acids Res. 2011, 39, D253–D260. [Google Scholar] [CrossRef] [PubMed] [Green Version]
  19. Li, H.; Xing, X.; Ding, G.; Li, Q.; Wang, C.; Xie, L.; Zeng, R.; Li, Y. SysPTM: A systematic resource for proteomic research on post-translational modifications. Mol. Cell. Proteom. 2009, 8, 1839–1849. [Google Scholar] [CrossRef] [Green Version]
  20. Moriya, Y.; Kawano, S.; Okuda, S.; Watanabe, Y.; Matsumoto, M.; Takami, T.; Kobayashi, D.; Yamanouchi, Y.; Araki, N.; Yoshizawa, A.C.; et al. The jPOST environment: An integrated proteomics data repository and database. Nucleic Acids Res. 2019, 47, D1218–D1224. [Google Scholar] [CrossRef] [PubMed]
  21. Peri, S.; Navarro, J.D.; Kristiansen, T.Z.; Amanchy, R.; Surendranath, V.; Muthusamy, B.; Gandhi, T.K.; Chandrika, K.N.; Deshpande, N.; Suresh, S.; et al. Human protein reference database as a discovery resource for proteomics. Nucleic Acids Res. 2004, 32, D497–D501. [Google Scholar] [CrossRef] [PubMed]
  22. Su, M.G.; Lee, T.Y. Incorporating substrate sequence motifs and spatial amino acid composition to identify kinase-specific phosphorylation sites on protein three-dimensional structures. BMC Bioinform. 2013, 14 (Suppl. S16), S2. [Google Scholar] [PubMed] [Green Version]
  23. Linding, R.; Jensen, L.J.; Ostheimer, G.J.; van Vugt, M.A.; Jorgensen, C.; Miron, I.M.; Diella, F.; Colwill, K.; Taylor, L.; Elder, K.; et al. Systematic discovery of in vivo phosphorylation networks. Cell 2007, 129, 1415–1426. [Google Scholar] [CrossRef] [PubMed] [Green Version]
  24. Huang, H.D.; Lee, T.Y.; Tzeng, S.W.; Wu, L.C.; Horng, J.T.; Tsou, A.P.; Huang, K.T. Incorporating hidden Markov models for identifying protein kinase-specific phosphorylation sites. J. Comput. Chem. 2005, 26, 1032–1041. [Google Scholar] [CrossRef] [PubMed]
  25. Amano, M.; Hamaguchi, T.; Shohag, M.H.; Kozawa, K.; Kato, K.; Zhang, X.; Yura, Y.; Matsuura, Y.; Kataoka, C.; Nishioka, T.; et al. Kinase-interacting substrate screening is a novel method to identify kinase substrates. J. Cell. Biol. 2015, 209, 895–912. [Google Scholar] [CrossRef] [PubMed] [Green Version]
  26. Nagai, T.; Nakamuta, S.; Kuroda, K.; Nakauchi, S.; Nishioka, T.; Takano, T.; Zhang, X.; Tsuboi, D.; Funahashi, Y.; Nakano, T.; et al. Phosphoproteomics of the Dopamine Pathway Enables Discovery of Rap1 Activation as a Reward Signal In Vivo. Neuron 2016, 89, 550–565. [Google Scholar] [CrossRef] [PubMed] [Green Version]
  27. Nishioka, T.; Nakayama, M.; Amano, M.; Kaibuchi, K. Proteomic screening for Rho-kinase substrates by combining kinase and phosphatase inhibitors with 14-3-3zeta affinity chromatography. Cell Struct. Funct. 2012, 37, 39–48. [Google Scholar] [CrossRef] [PubMed] [Green Version]
  28. Funahashi, Y.; Watanabe, T.; Kaibuchi, K. Advances in defining signaling networks for the establishment of neuronal polarity. Curr. Opin. Cell Biol. 2020, 63, 76–87. [Google Scholar] [CrossRef] [PubMed]
  29. Yamaji, K.; Sakai, H.; Okumura, Y.; Usui, S. Customizable neuroinformatics database system: XooNIps and its application to the pupil platform. Comput. Biol. Med. 2007, 37, 1036–1041. [Google Scholar] [CrossRef]
  30. Nishi, A.; Snyder, G.L.; Greengard, P. Bidirectional regulation of DARPP-32 phosphorylation by dopamine. J. Neurosci. 1997, 17, 8147–8155. [Google Scholar] [CrossRef] [Green Version]
  31. Cox, J.; Mann, M. MaxQuant enables high peptide identification rates, individualized p.p.b.-range mass accuracies and proteome-wide protein quantification. Nat. Biotechnol. 2008, 26, 1367–1372. [Google Scholar] [CrossRef] [PubMed]
  32. Zhang, X.; Nagai, T.; Ahammad, R.U.; Kuroda, K.; Nakamuta, S.; Nakano, T.; Yukinawa, N.; Funahashi, Y.; Yamahashi, Y.; Amano, M.; et al. Balance between dopamine and adenosine signals regulates the PKA/Rap1 pathway in striatal medium spiny neurons. Neurochem. Int. 2019, 122, 8–18. [Google Scholar] [CrossRef]
  33. Amano, M.; Nishioka, T.; Yura, Y.; Kaibuchi, K. Identification of Protein Kinase Substrates by the Kinase-Interacting Substrate Screening (KISS) Approach. Curr. Protoc. Cell Biol. 2016, 72, 11–12. [Google Scholar] [CrossRef] [PubMed]
  34. Nishioka, T.; Amano, M.; Funahashi, Y.; Tsuboi, D.; Yamahashi, Y.; Kaibuchi, K. In Vivo Identification of Protein Kinase Substrates by Kinase-Oriented Substrate Screening (KIOSS). Curr. Protoc. Chem. Biol. 2019, 11, e60. [Google Scholar] [CrossRef] [PubMed] [Green Version]
  35. Takano, T.; Wu, M.; Nakamuta, S.; Naoki, H.; Ishizawa, N.; Namba, T.; Watanabe, T.; Xu, C.; Hamaguchi, T.; Yura, Y.; et al. Discovery of long-range inhibitory signaling to ensure single axon formation. Nat. Commun. 2017, 8, 33. [Google Scholar] [CrossRef] [PubMed]
  36. Koike, R.; Amano, M.; Kaibuchi, K.; Ota, M. Protein kinases phosphorylate long disordered regions in intrinsically disordered proteins. Protein Sci. 2020, 29, 564–571. [Google Scholar] [CrossRef]
  37. Shohag, M.H.; Nishioka, T.; Ahammad, R.U.; Nakamuta, S.; Yura, Y.; Hamaguchi, T.; Kaibuchi, K.; Amano, M. Phosphoproteomic Analysis Using the WW and FHA Domains as Biological Filters. Cell Struct. Funct. 2015, 40, 95–104. [Google Scholar] [CrossRef] [PubMed] [Green Version]
  38. Mok, J.; Im, H.; Snyder, M. Global identification of protein kinase substrates by protein microarray analysis. Nat. Protoc. 2009, 4, 1820–1827. [Google Scholar] [CrossRef] [PubMed] [Green Version]
  39. Meng, L.; Michaud, G.A.; Merkel, J.S.; Zhou, F.; Huang, J.; Mattoon, D.R.; Schweitzer, B. Protein kinase substrate identification on functional protein arrays. BMC Biotechnol. 2008, 8, 22. [Google Scholar] [CrossRef] [PubMed] [Green Version]
  40. Wardas, J. Neuroprotective role of adenosine in the CNS. Pol. J. Pharmacol. 2002, 54, 313–326. [Google Scholar] [PubMed]
  41. Kemp, J.M.; Powell, T.P. The structure of the caudate nucleus of the cat: Light and electron microscopy. Philos. Trans. R. Soc. Lond. B Biol. Sci. 1971, 262, 383–401. [Google Scholar] [PubMed]
  42. Gerfen, C.R.; Engber, T.M.; Mahan, L.C.; Susel, Z.; Chase, T.N.; Monsma, F.J., Jr.; Sibley, D.R. D1 and D2 dopamine receptor-regulated gene expression of striatonigral and striatopallidal neurons. Science 1990, 250, 1429–1432. [Google Scholar] [CrossRef] [PubMed]
  43. Fink, J.S.; Weaver, D.R.; Rivkees, S.A.; Peterfreund, R.A.; Pollack, A.E.; Adler, E.M.; Reppert, S.M. Molecular cloning of the rat A2 adenosine receptor: Selective co-expression with D2 dopamine receptors in rat striatum. Brain Res. Mol. Brain Res. 1992, 14, 186–195. [Google Scholar] [CrossRef]
  44. Ferre, S.; O’Connor, W.T.; Svenningsson, P.; Bjorklund, L.; Lindberg, J.; Tinner, B.; Stromberg, I.; Goldstein, M.; Ogren, S.O.; Ungerstedt, U.; et al. Dopamine D1 receptor-mediated facilitation of GABAergic neurotransmission in the rat strioentopenduncular pathway and its modulation by adenosine A1 receptor-mediated mechanisms. Eur. J. Neurosci. 1996, 8, 1545–1553. [Google Scholar] [CrossRef] [PubMed]
  45. Kull, B.; Svenningsson, P.; Fredholm, B.B. Adenosine A(2A) receptors are colocalized with and activate g(olf) in rat striatum. Mol. Pharmacol. 2000, 58, 771–777. [Google Scholar] [CrossRef] [PubMed] [Green Version]
  46. McAvoy, T.; Zhou, M.M.; Greengard, P.; Nairn, A.C. Phosphorylation of Rap1GAP, a striatally enriched protein, by protein kinase A controls Rap1 activity and dendritic spine morphology. Proc. Natl. Acad. Sci. USA 2009, 106, 3531–3536. [Google Scholar] [CrossRef] [PubMed] [Green Version]
  47. Snyder, G.L.; Allen, P.B.; Fienberg, A.A.; Valle, C.G.; Huganir, R.L.; Nairn, A.C.; Greengard, P. Regulation of phosphorylation of the GluR1 AMPA receptor in the neostriatum by dopamine and psychostimulants in vivo. J. Neurosci. 2000, 20, 4480–4488. [Google Scholar] [CrossRef] [PubMed] [Green Version]
  48. Lin, Y.H.; Yamahashi, Y.; Kuroda, K.; Faruk, M.O.; Zhang, X.; Yamada, K.; Yamanaka, A.; Nagai, T.; Kaibuchi, K. Accumbal D2R-medium spiny neurons regulate aversive behaviors through PKA-Rap1 pathway. Neurochem. Int. 2021, 143, 104935. [Google Scholar] [CrossRef] [PubMed]
  49. Poolos, N.P.; Bullis, J.B.; Roth, M.K. Modulation of h-channels in hippocampal pyramidal neurons by p38 mitogen-activated protein kinase. J. Neurosci. 2006, 26, 7995–8003. [Google Scholar] [CrossRef] [PubMed]
  50. Jung, S.; Bullis, J.B.; Lau, I.H.; Jones, T.D.; Warner, L.N.; Poolos, N.P. Downregulation of dendritic HCN channel gating in epilepsy is mediated by altered phosphorylation signaling. J. Neurosci. 2010, 30, 6678–6688. [Google Scholar] [CrossRef] [PubMed] [Green Version]
  51. Fitzgerald, E.M. Regulation of voltage-dependent calcium channels in rat sensory neurones involves a Ras-mitogen-activated protein kinase pathway. J. Physiol. 2000, 527, 433–444. [Google Scholar] [CrossRef] [PubMed]
  52. Cole, A.R.; Knebel, A.; Morrice, N.A.; Robertson, L.A.; Irving, A.J.; Connolly, C.N.; Sutherland, C. GSK-3 phosphorylation of the Alzheimer epitope within collapsin response mediator proteins regulates axon elongation in primary neurons. J. Biol. Chem. 2004, 279, 50176–50180. [Google Scholar] [CrossRef] [Green Version]
  53. Uchida, Y.; Ohshima, T.; Sasaki, Y.; Suzuki, H.; Yanai, S.; Yamashita, N.; Nakamura, F.; Takei, K.; Ihara, Y.; Mikoshiba, K.; et al. Semaphorin3A signalling is mediated via sequential Cdk5 and GSK3beta phosphorylation of CRMP2: Implication of common phosphorylating mechanism underlying axon guidance and Alzheimer’s disease. Genes Cells 2005, 10, 165–179. [Google Scholar] [CrossRef] [PubMed]
  54. Yoshimura, T.; Kawano, Y.; Arimura, N.; Kawabata, S.; Kikuchi, A.; Kaibuchi, K. GSK-3beta regulates phosphorylation of CRMP-2 and neuronal polarity. Cell 2005, 120, 137–149. [Google Scholar] [CrossRef] [Green Version]
  55. Cole, A.R.; Noble, W.; van Aalten, L.; Plattner, F.; Meimaridou, R.; Hogan, D.; Taylor, M.; LaFrancois, J.; Gunn-Moore, F.; Verkhratsky, A.; et al. Collapsin response mediator protein-2 hyperphosphorylation is an early event in Alzheimer’s disease progression. J. Neurochem. 2007, 103, 1132–1144. [Google Scholar] [CrossRef]
  56. Castillon, C.; Gonzalez, L.; Domenichini, F.; Guyon, S.; Da Silva, K.; Durand, C.; Lestaevel, P.; Vaillend, C.; Laroche, S.; Barnier, J.V.; et al. The intellectual disability PAK3 R67C mutation impacts cognitive functions and adult hippocampal neurogenesis. Hum. Mol. Genet. 2020, 29, 1950–1968. [Google Scholar] [CrossRef] [PubMed]
  57. Pavlowsky, A.; Chelly, J.; Billuart, P. Emerging major synaptic signaling pathways involved in intellectual disability. Mol. Psychiatry 2012, 17, 682–693. [Google Scholar] [CrossRef] [PubMed] [Green Version]
  58. Weiwer, M.; Xu, Q.; Gale, J.P.; Lewis, M.; Campbell, A.J.; Schroeder, F.A.; Van de Bittner, G.C.; Walk, M.; Amaya, A.; Su, P.; et al. Functionally Biased D2R Antagonists: Targeting the beta-Arrestin Pathway to Improve Antipsychotic Treatment. ACS Chem. Biol. 2018, 13, 1038–1047. [Google Scholar] [CrossRef] [PubMed]
  59. Nakazawa, K.; Jeevakumar, V.; Nakao, K. Spatial and temporal boundaries of NMDA receptor hypofunction leading to schizophrenia. NPJ Schizophr. 2017, 3, 7. [Google Scholar] [CrossRef] [PubMed]
Figure 1. The schema for the construction of KANPHOS. (A) Schematic representation of the Kinase-Interacting Substrate Screening (KISS). In KISS method, rodent brain lysates were extracted and incubated with specific kinase-tag beads and ATP. The bound proteins were subjected to liquid chromatography tandem mass spectrometry (LC-MS/MS) to identify the phosphorylated proteins and their phosphorylation sites. (B) Schematic representation of the Kinase-Oriented Substrate Screening (KIOSS) method. In KIOSS method, mouse coronal brain slices were treated with specific kinase activator/receptor agonist or kinase inhibitor/receptor antagonist to stimulate a specific signaling pathway and then incubated with GST tag pS/T binding domain (such as 14-3-3ζ) to enrich phosphoproteins. The bound proteins were subjected to LC-MS/MS to identify the phosphorylated proteins and their phosphorylation sites. (C) In addition to our own developed phosphoproteomic method, data were also manually curated from the literature and protoarray.
Cells 11 00047 g001
Figure 2. Data statistics and content of KANPHOS database. (A) Number of phosphorylation sites that were enlisted in KANPHOS using different methods; (B) Percentage of phosphoserine (pS), phosphothreonine (pT), and phosphotyrosine (pY) distribution; (C) Number of Phosphoprotein and phosphorylation sites identified in different species; (D) Distribution of phosphorylation sites among kinase families; (E) Percentage of phosphorylation sites identified in vitro, in vivo, and both in vitro and in vivo.
Cells 11 00047 g002
Figure 3. Overview of the KANPHOS workflow. (A) Homepage and browse function; (B) Simple search options (1) Search by kinases,(2) Search by substrates, and (3) Search by pathways; (C) Result window containing information about the phosphorylation sites, possible upstream signal and kinase.
Cells 11 00047 g003
Figure 4. Identification of signaling molecules downstream of Adenosine-A2AR pathway in striatum/NAc. (A) Model of A2AR signaling pathway in D2R-MSN; (B) Scheme for the phosphoproteomic analysis used to identify candidate substrates downstream of the A2AR pathway. Striatal/accumbal slices were stimulated with CGS21680 (5 μM) for 5 min after pretreatment with quinpirole (1 μM) for 10 min to induce A2AR-mediated phosphorylation of the phosphoprotein and then subjected to 14-3-3ζ affinity chromatography followed by LC-MS/MS; (C) Stimulation of adenosine A2AR promotes PKA-mediated phosphorylation of Rap1gap, and Rasgrp2 in striatal/accumbal slices; (D) Motif analysis of the identified phosphopeptides downstream of A2AR signaling is shown.
Cells 11 00047 g004
Figure 5. Identification of MAPK candidate substrates downstream of A2AR signaling in striatum/NAc. (A) Screening of phosphoproteins downstream of MAPK-mediated signaling. Striatal/accumbal slices were treated with okadaic acid (1 μM) for 60 min after pretreatment of MEK inhibitor U0126 (10 µM) for 30 min. OA induced the phosphorylation ERK at T202/Y204 and PKA substrate GluR1 at S845, whereas the pretreatment of MEK inhibitor reduced the phosphorylation of ERK but had no effect on PKA substrate GluR1 phosphorylation; (B) In silico analysis of the identified MAPK candidate substrates using the Reactome database (available online: http://www.reactome.org/ (accessed on 7 November 2021)) is shown; (C) Overlapping of MAPK and A2AR candidate substrates; (D) List of MAPK candidate substrates downstream of A2AR signaling.
Cells 11 00047 g005
Figure 6. Workflow of KANPHOS for the identification of adenosine-A2A receptor-mediated signaling molecules. (A) Identification of Arhgap21 as a PKA candidate substrate downstream of adenosine signaling using “Kinases” search. Red circle represents the selected option and arrow indicates result outcome after each selection; (B) Identification of kinases which may phosphorylate Arhgap21 downstream of adenosine signaling using “Substrates” search. Red rectangle represents the selected search option and arrow indicates result outcome after each selection.
Cells 11 00047 g006
Figure 7. A case study of the KANPHOS revealed that phosphorylation of HCN and calcium channel were involved in the MEK-MAPK pathway downstream of A2AR. (A) Pathway viewer window showed dopamine signaling pathway in D1R-MSN and D2R-MSN; (B) List of MAPK candidate substrates downstream of A2AR in KANPHOS; (C) Results of pathway analysis using KANPHOS; (D) Advanced search option for the identification of channel protein in the MEK-MAPK pathway downstream of A2AR; (E) List of channel protein involved in the MEK-MAPK pathway downstream of A2AR. Here, number (1–7) indicate the workflow step by step, red circle and red rectangle represent the selected search options, and arrow indicates result output after each selection.
Cells 11 00047 g007
Table 1. Statistics of the KANPHOS database.
Method/StimulationKinaseNo. of Phos. Site
KIOSS (1433z)/ForskolinPKA, MAPK and other278
KIOSS (1433z)/OA&U0126MAPK and other324
KIOSS (1433z)/D1R AgonistPKA, MAPK and other185
KIOSS (1433z)/A2AR AgonistPKA, MAPK and other62
KISSCaMKI, CDK5, FYN, LYN, MAPK1, PAK7, PKA, PKN, ROCK23597
ProtoarrayAKT1, CaMK2A, CDK5, LRRK2, LYN, MAPK1, PRKCA, PRKACA, ROCK21782
OutsourceAurA, AurB, CaMKI, CaMKII, CaMK4, CDK5, GSK3B, LYN, MAPK, MARK1, PKA, AMPK, PRKCA, PRKCE, ROCK, STK11(LKB1)3736
Table 2. List of phosphoproteins along with phosphorylation site downstream of adenosine (A2AR) signaling.
MotifIdentified Phosphoprotein and Phosphorylation Site
PKAArhgap21Arhgap21Arhgap21Arhgap23Brsk1Brsk2
S472S851S875S401S324S383
BsnBsnCacna1bCcdc177CcnyCdk17
S1987S2860S2219S303S301S180
Chrna4Fam126bGpr75Hcn2Kcnh7Kif21b
S540S521S317S840S174S1150
MaddMark1Nedd4lNf1Prickle2Prrt3
S1038S394T353S2524S752S846
Rap1gapRims1Sik3Syn1Taf4bTtc32
S245S887S454S427S707S24
MAPKAblim1Arhgap21BsnCacna1eCcdc177Cdk17
S89S42Y3020S791S308T11
Chrna4Chrna4Hcn3Lrfn4MaddMadd
S540S543S633S627S1038T1045
Nedd4lPrrt3Rap1gapSipa1l1Sorbs2Spata2
S329S834S213S1528S944S247
Syn1
S427
OthersArhgap21Atp6v1hCep170Gpr75Kcnh2Khnyn
S856Y125S353T313S322S43
MaddMapk8Rsl1d1Rsl1d1Sh2d5Ttc32
S1089S210T314S316S126T18
Table 3. List of phosphoproteins identified as a MAPK candidate substrates.
Identified MAPK Candidate Substrates List
2010300C02RikAtg9aCdk18Epb4.1l3Lppr3Osbpl6Rasgrp2Ssh2
Aak1Bai1Cdkl5Epb49Lrfn4Pak7Rem2Stim1
Abi1Baiap2Cep170Erc2Lrrc7Panx2Rims1Syn1
Abi2BcrChrna4Etl4MaddPcloRims2Syn2
Agap2BegainClasp2Fam171a1Map3k5Pfkfb2Rph3aSyn3
Agfg1Brsk1Crtc2Fam171a2Map4Pip5k1cRradSynpo
Akap6Brsk2Ctnnd2Fam171bMark1Pitpnm3Sh2d5Syt7
Als2BsnCyth3Frmd4aMark3Plekha5Shank3Tanc2
Ampd2C17orf59Dab2ipGab2Mast1Plekho2Shisa7Tpd52
Ank2C2cd4cDennd1aGit1Mast3Pola1Sipa1l1Tpd52l1
Ankrd34aCacna1bDennd4cGm1568MbpPpfia2Sipa1l2Tsc2
Ankrd34bCacna1eDgkqGm15800Mink1Ppfia3Slc4a4Uhrf1bp1l
Anks1bCamk2gDlgap2Gpr158Mllt4Ppfia4Sorbs1Ulk1
Arhgap21Camkk1Dlgap3Hcn2MpripPrrt3Sorbs2Ulk2
Arhgap23Camkk2DosHcn3Nav1PsdSpata2Usp31
Arhgap32Camsap2Dpysl2Iqsec1Nav3Psd3Specc1Usp8
Arhgap39Caskin1Dpysl5Kcnb1Ndel1Rab11fip2SpegWdr47
Arhgef2Ccdc22DstnKiaa0284NelfRalgapa1Srcin1
Arhgef6CcnyDtnaKiaa0528Nhsl2Rap1gapSrgap3
Atat1Ccnyl1Eif3dKiaa1211Nyap2Rapgef2Ssfa2
Total 157
Publisher’s Note: MDPI stays neutral with regard to jurisdictional claims in published maps and institutional affiliations.

