Article

Comparative Mapping of the Macrochromosomes of Eight Avian Species Provides Further Insight into Their Phylogenetic Relationships and Avian Karyotype Evolution

by
Lucas G. Kiazim
1,
Rebecca E. O’Connor
1,
Denis M. Larkin
2,
Michael N. Romanov
1,
Valery G. Narushin
3,4,
Evgeni A. Brazhnik
5 and
Darren K. Griffin
1,*
1
School of Biosciences, University of Kent, Canterbury CT2 7NJ, UK
2
Department of Comparative Biomedical Sciences, Royal Veterinary College, University of London, London NW1 0T, UK
3
Research Institute for Environment Treatment, 69032 Zaporozhye, Ukraine
4
Vita-Market Ltd., 69032 Zaporozhye, Ukraine
5
BIOTROF+ Ltd., Pushkin, St. Petersburg 196602, Russia
*
Author to whom correspondence should be addressed.
Cells 2021, 10(2), 362; https://doi.org/10.3390/cells10020362
Submission received: 31 December 2020 / Revised: 30 January 2021 / Accepted: 2 February 2021 / Published: 9 February 2021
(This article belongs to the Collection Non-human Chromosome Analysis)

Abstract

:
Avian genomes typically consist of ~10 pairs of macro- and ~30 pairs of microchromosomes. While inter-chromosomally, a pattern emerges of very little change (with notable exceptions) throughout evolution, intrachromosomal changes remain relatively poorly studied. To rectify this, here we use a pan-avian universally hybridising set of 74 chicken bacterial artificial chromosome (BAC) probes on the macrochromosomes of eight bird species: common blackbird, Atlantic canary, Eurasian woodcock, helmeted guinea fowl, houbara bustard, mallard duck, and rock dove. A combination of molecular cytogenetic, bioinformatics, and mathematical analyses allowed the building of comparative cytogenetic maps, reconstruction of a putative Neognathae ancestor, and assessment of chromosome rearrangement patterns and phylogenetic relationships in the studied neognath lineages. We observe that, as with our previous studies, chicken appears to have the karyotype most similar to the ancestor; however, previous reports of an increased rate of intrachromosomal change in Passeriformes (songbirds) appear not to be the case in our dataset. The use of this universally hybridizing probe set is applicable not only for the re-tracing of avian karyotype evolution but, potentially, for reconstructing genome assemblies.

1. Introduction

Most birds exhibit a highly distinctive, “typical” avian karyotype, where chromosomes are characteristically divided into around 10 macrochromosomes and around 30 similarly-sized, morphologically indistinguishable microchromosomes. Around two thirds of species have a karyotype 2n = 76–82 [1,2,3]. Studying overall genome structure is an essential element to understanding avian biology; however, most avian species have no structural (karyotypic) data associated with their genome [4] despite ~460 avian genomes having been sequenced (4% of all species). As of May 2019 [5], only 16 genomes have been assembled to a chromosome-level (i.e., a single scaffold for each chromosome from the p- to q-terminus). To address this problem coupling classical cytogenetics with molecular cytogenetics, such as fluorescence in situ hybridisation (FISH), provides a finer resolution of genomic structure and can be used to anchor genome sequence to the chromosomes and thence identify chromosome rearrangements by determining interspecies homology. Chromosome painting by FISH has resulted in numerous comparative genomic and evolutionary studies in birds (e.g., [3,6,7,8,9,10,11,12]); however, chromosome paints are limited in their ability to identify intrachromosomal rearrangements such as inversions and duplications. These limitations can be circumvented through the use of bacterial artificial chromosome (BAC) clone probes, providing a finer resolution to detect small rearrangements. Through the use of a universal BAC probe set developed by Damas et al. [13], these rearrangements can be mapped by measuring the fractional length relative to the p-terminus (FLpter) value [14]. Using a reference genome with known BAC order for comparison, the mapping of BACs can thereafter be used to track chromosomal rearrangements between different species, providing an inexpensive way to characterise genomic rearrangements without the need for sequencing data. These data can also be used to generate comparative maps that lay the foundation for other studies, including upgrading assemblies to a chromosome-level [13,15].
In order to explore the extent of chromosomal rearrangement in the macrochromosomes of birds relative to chromosomes of the chicken (Gallus gallus; the order Galliformes), the best cytogenomically studied bird [16,17,18], and ultimately, a reconstructed hypothetical ancestor for the infraclass Neognathae, we selected seven further avian species, providing representatives for six of the 32 neognath orders (Table 1). These included two songbirds, the common blackbird (Turdus merula, TME), and Atlantic canary (Serinus canaria, SCD), both representatives of the order Passeriformes. Passerine birds comprise over half of all avian species [19]; known for their phenotypic diversity and for their vocal learning, they are often used for studies related to brain development [20,21]. An assembled and annotated canary genome is available; however, not currently to a chromosome-level [22]. Further selected species included the Eurasian woodcock (Scolopax rusticola, SRU; Charadriiformes), houbara bustard (Chlamydotis undulata, CUN; Otidiformes), and the rock dove, or pigeon (Columba livia, CLI; Columbiformes). The Eurasian woodcock is a wading bird known for its 360-degree vision and recognised among game hunters for its erratic flight patterns, speed, and size in addition to having an atypical diploid number of 2n = 96 [23,24,25]. The houbara bustard is culturally significant in Arabian countries, in addition to being listed by the IUCN as vulnerable [26]. The pigeon exhibits extreme phenotypic diversity not seen within any wild avian species [27]. The pigeon genome has also recently been upgraded to a chromosome-level [13], thereby providing an additional reference point for BAC mapping in other species and ensuring further validation of this method for identifying chromosomal rearrangements without sequencing data. Among the basal superorder Galloanserae, the mallard duck (Anas platyrhynchos, APL; Anseriformes) and the helmeted guinea fowl (Numida meleagris, NME; Galliformes) were chosen; the former being a particularly well explored species for immunology studies [28] as well as having a whole genome radiation hybrid panel [29]. It also last shared a common ancestor with chicken more recently than the other species in this study (~47 million years ago; [30]). Finally, the helmeted guinea fowl provides an additional representative of the Galliformes, ensuring that any chicken specific features are not overly represented for this order in this dataset.
In these species, we used a pan-avian universally hybridising probe set [13,15,31] to trace macrochromosomal evolution through the generation of comparative cytogenetic maps. This approach permits identification of fissions, fusions, duplications, and inversions, all of which contribute to the chromosomal changes that influence speciation, the phylogenetic relationships between the eight species and the lineage-specific chromosomal rearrangements as additionally explored with bioinformatic/mathematical tools.

2. Materials and Methods

2.1. Cell Culture and Chromosome Preparation

Chicken embryonic fibroblasts were obtained from The Pirbright Institute, Woking, Surrey, GU24 0NF, UK (chicken embryonic fibroblast DF-1). All other cell lines for the common blackbird, Atlantic canary, Eurasian woodcock, helmeted guinea fowl, houbara bustard, mallard duck, and rock dove (pigeon) are available through the Malcolm Ferguson-Smith collection, CryoArks, National History Museum, London, UK, and are available on request via enquiries@cryoarks.org (there are no specific accession numbers). No animals were used in the course of this study and hence no ethical oversight required. Briefly, fibroblasts were cultured at 40 °C with 5% CO2 in Alpha MEM (Gibco/Thermo Fisher Scientific, Inc., Waltham, MA, USA), supplemented with 10% foetal bovine serum (Gibco) and 1% Penicillin-Streptomycin-L-Glutamine (Sigma-Aldrich, St. Louis, MO, USA). Chromosome suspension preparation followed standard protocols where colcemid solution (Gibco) at a concentration of 5.0 μg/mL was added to flasks for 1 h prior to hypotonic treatment with 75 mM pre-warmed (37 °C) KCl for 1 h and subsequent fixation in 3:1 absolute methanol:glacial acetic acid.

2.2. Preparation of BAC Probes for FISH

The 74 chicken BACs were selected as a pan-avian universally hybridising probe set according to Damas et al. [13] and O’Connor et al. [15,31,32]. DNA was isolated from BAC clones using the QIAGEN (Hilden, Germany) miniprep kit and was subsequently amplified, then labelled directly by nick translation. Probes were labelled with Texas red-12-dUTP (Invitrogen/Thermo Fisher Scientific, Inc., Waltham, MA, USA) and FITC-fluorescein-12-UTP (Roche Diagnostics, Rotkreuz, Switzerland) prior to purification with the QIAGEN nucleotide removal kit.

2.3. Fluorescence In Situ Hybridisation (FISH)

Metaphase preparations were fixed to slides and run through an ethanol series (2 min each in 2× SSC, 70%, 85%, and 100% ethanol at room temperature). Dual colour FISH was set up with FITC and Texas Red labelled probes mixed with COT-1 DNA (Insight Biotechnology, Wembley, UK) and Hybridisation solution I (Cytocell Ltd., Cambridge, UK). Probe and target DNA were simultaneously denatured on a 75 °C hotplate for 2 min, then left to hybridise in a humidified chamber for 72 h at 37 °C. Post-hybridisation washes were 30 s in 2× SSC/0.05% Tween 20 at room temperature prior to counterstaining using VECTASHIELD antifade mounting medium with DAPI (Vector Laboratories, Inc., Burlingame, CA, USA). Slides were visualised under an Olympus BX61 epifluorescence microscope. A cooled CCD camera captured images with DAPI, Texas Red, FITC, and Aqua filters. Images were captured at 100× magnification using SmartCapture3 software (Digital Scientific UK, Cambridge, UK).

2.4. Karyotype Analysis and Ideogram Generation

Taking into consideration the nomenclature described by the International System for Standardised Avian Karyotypes [33] regarding chromosome size, karyotype images were produced per species using SmartType3 software (Digital Scientific, UK). In the case of the songbirds, the nomenclature describing chicken chromosome homology was used. Ideograms were created based on the karyotype images produced using Microsoft PowerPoint (Microsoft, Redmond, WA, USA). Banding patterns were replicated by visual interpretation, with measurements (where possible) being made for a degree of accuracy. The results were verified by comparing multiple karyotype images to account for any variance in banding between metaphase spreads. FLpter measurements were made for each probe using ImageJ [34]. For visual clarity, the 74 BACs were numbered in ascending order based on their position on the chicken chromosome, with number 1 being at the topmost position of the p-arm. Using the species-specific ideograms, the comparative cytogenetic maps were generated showing the position for 74 BAC hybridisation sites and centromeres on each chromosome.

2.5. MLGO (Maximum Likelihood for Gene Order Analysis) Analysis for Ancestral Genome Reconstruction

To deconvolute lineage-specific rearrangement patterns in the seven new species plus the reference chicken genome, we first reconstructed in situ chromosomes for their most common ancestor, i.e., hypothetical ancestor for all Neognathae birds. An estimation of the neognath ancestral genome was inferred using the MLGO (Maximum Likelihood for Gene Order Analysis) web server [35]. The advantage of this reconstruction tool is that it can handle not only simple rearrangements like inversions, but also insertion, deletion, duplication and translocation events, while being capable to process large-scale datasets for nuclear genomes including information of missing BACs if any of them failed to hybridise in any species. To reconstruct the presumptive neognath ancestral genome, we employed the FISH data for the ostrich (Struthio camelus; order Struthioniformes, infraclass Palaeognathae) as an outgroup that were obtained in our previous study [15] using the same pan-avian 74-BAC set [13,15,31,32]. As an MLGO input phylogenetic tree for the eight birds plus ostrich, we took as a basis the tree shown in Figure 1 that was derived from the comprehensive [36] phylogeny for the class Aves.
Importantly, using MLGO, we were also able not only to treat chromosome-specific order of the 74 BAC hybridisation sites, but also introduce the individually numbered centromeres. This enabled to compose species-specific MLGO input datasets for up to 84 sites per genome, with the position of the 74 BAC hybridisation sites being oriented relative to each other and to the respective centromere. This approach provided the most appropriate reconstruction of the suppositive neognath ancestral genome as well as the most accurate and precise assessment of the possible lineage-specific intra- and interchromosomal rearrangements in the eight birds studied.

2.6. GRIMM (Genome Rearrangements In Man and Mouse) Analysis for Chromosome Rearrangement

Using the MLGO-assisted reconstructed Neognathae ancestral genome, we further exploited the GRIMM (Genome Rearrangements in Man and Mouse) web tool [38] to examine lineage-specific rearrangement patterns among the infraclass Neognathae. GRIMM analysis involved design of multichromosomal genome inputs based on the same chromosome-specific order of the 74 BAC hybridisation sites in the putative neognath ancestor and eight birds studied using the same format for a genome representation as in the MLGO datasets. Intra- and interchromosomal rearrangements were explored and summarised in pairs of genomes, with one being the neognath ancestor and the other one being an individual bird. The pairwise GRIMM outputs were double checked manually to ensure the correct rearrangement assignment and interpretation.

2.7. Mathematical Analyses

To estimate relations between lineage-specific rearrangement profiles and genome divergence among the eight studied bird karyotypes, the respective graphs were built, and pairwise Pearson’s/multiple correlation coefficients were calculated using Microsoft Excel and STATISTICA 5.5 (StatSoft, Inc./TIBCO, Palo Alto, CA, USA; see details in Supplementary Note S1). Principal Component Analysis (PCA), Fuzzy Analysis Clustering (FAC), and average linkage clustering (ALC) were performed using R and libraries for R environment, and Euclidean distance metric (see details in Supplementary Note S2).

3. Results

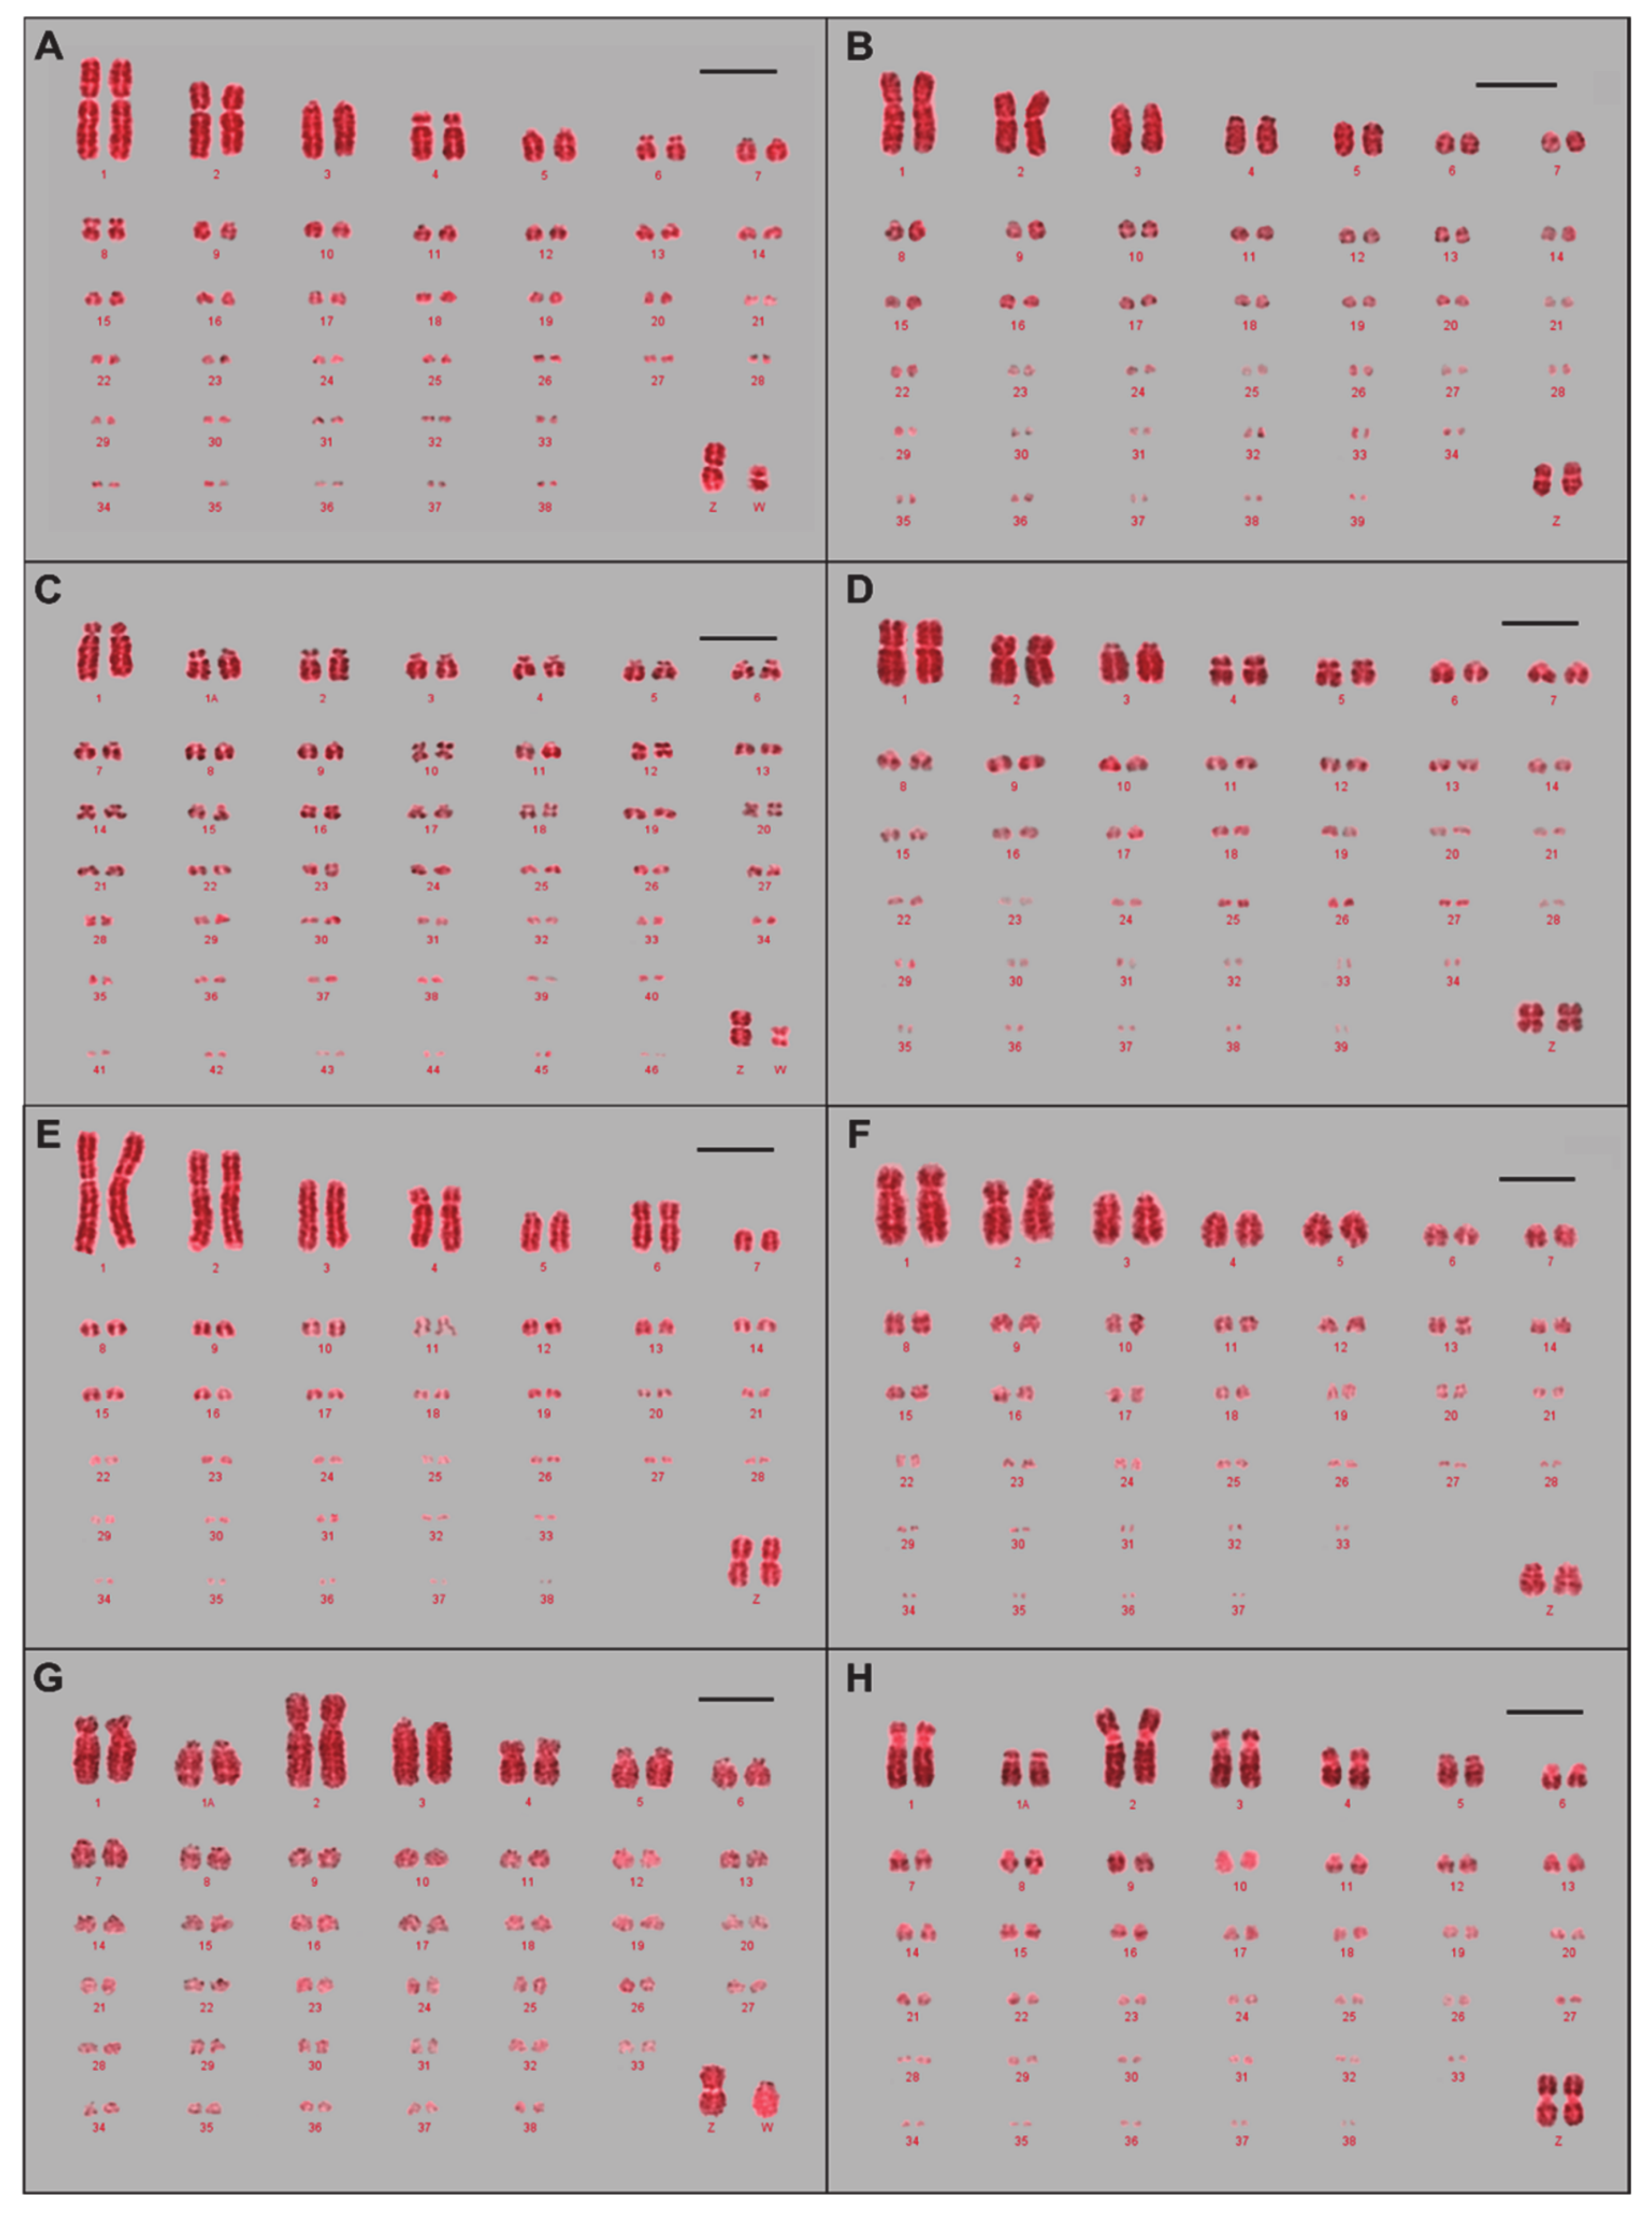
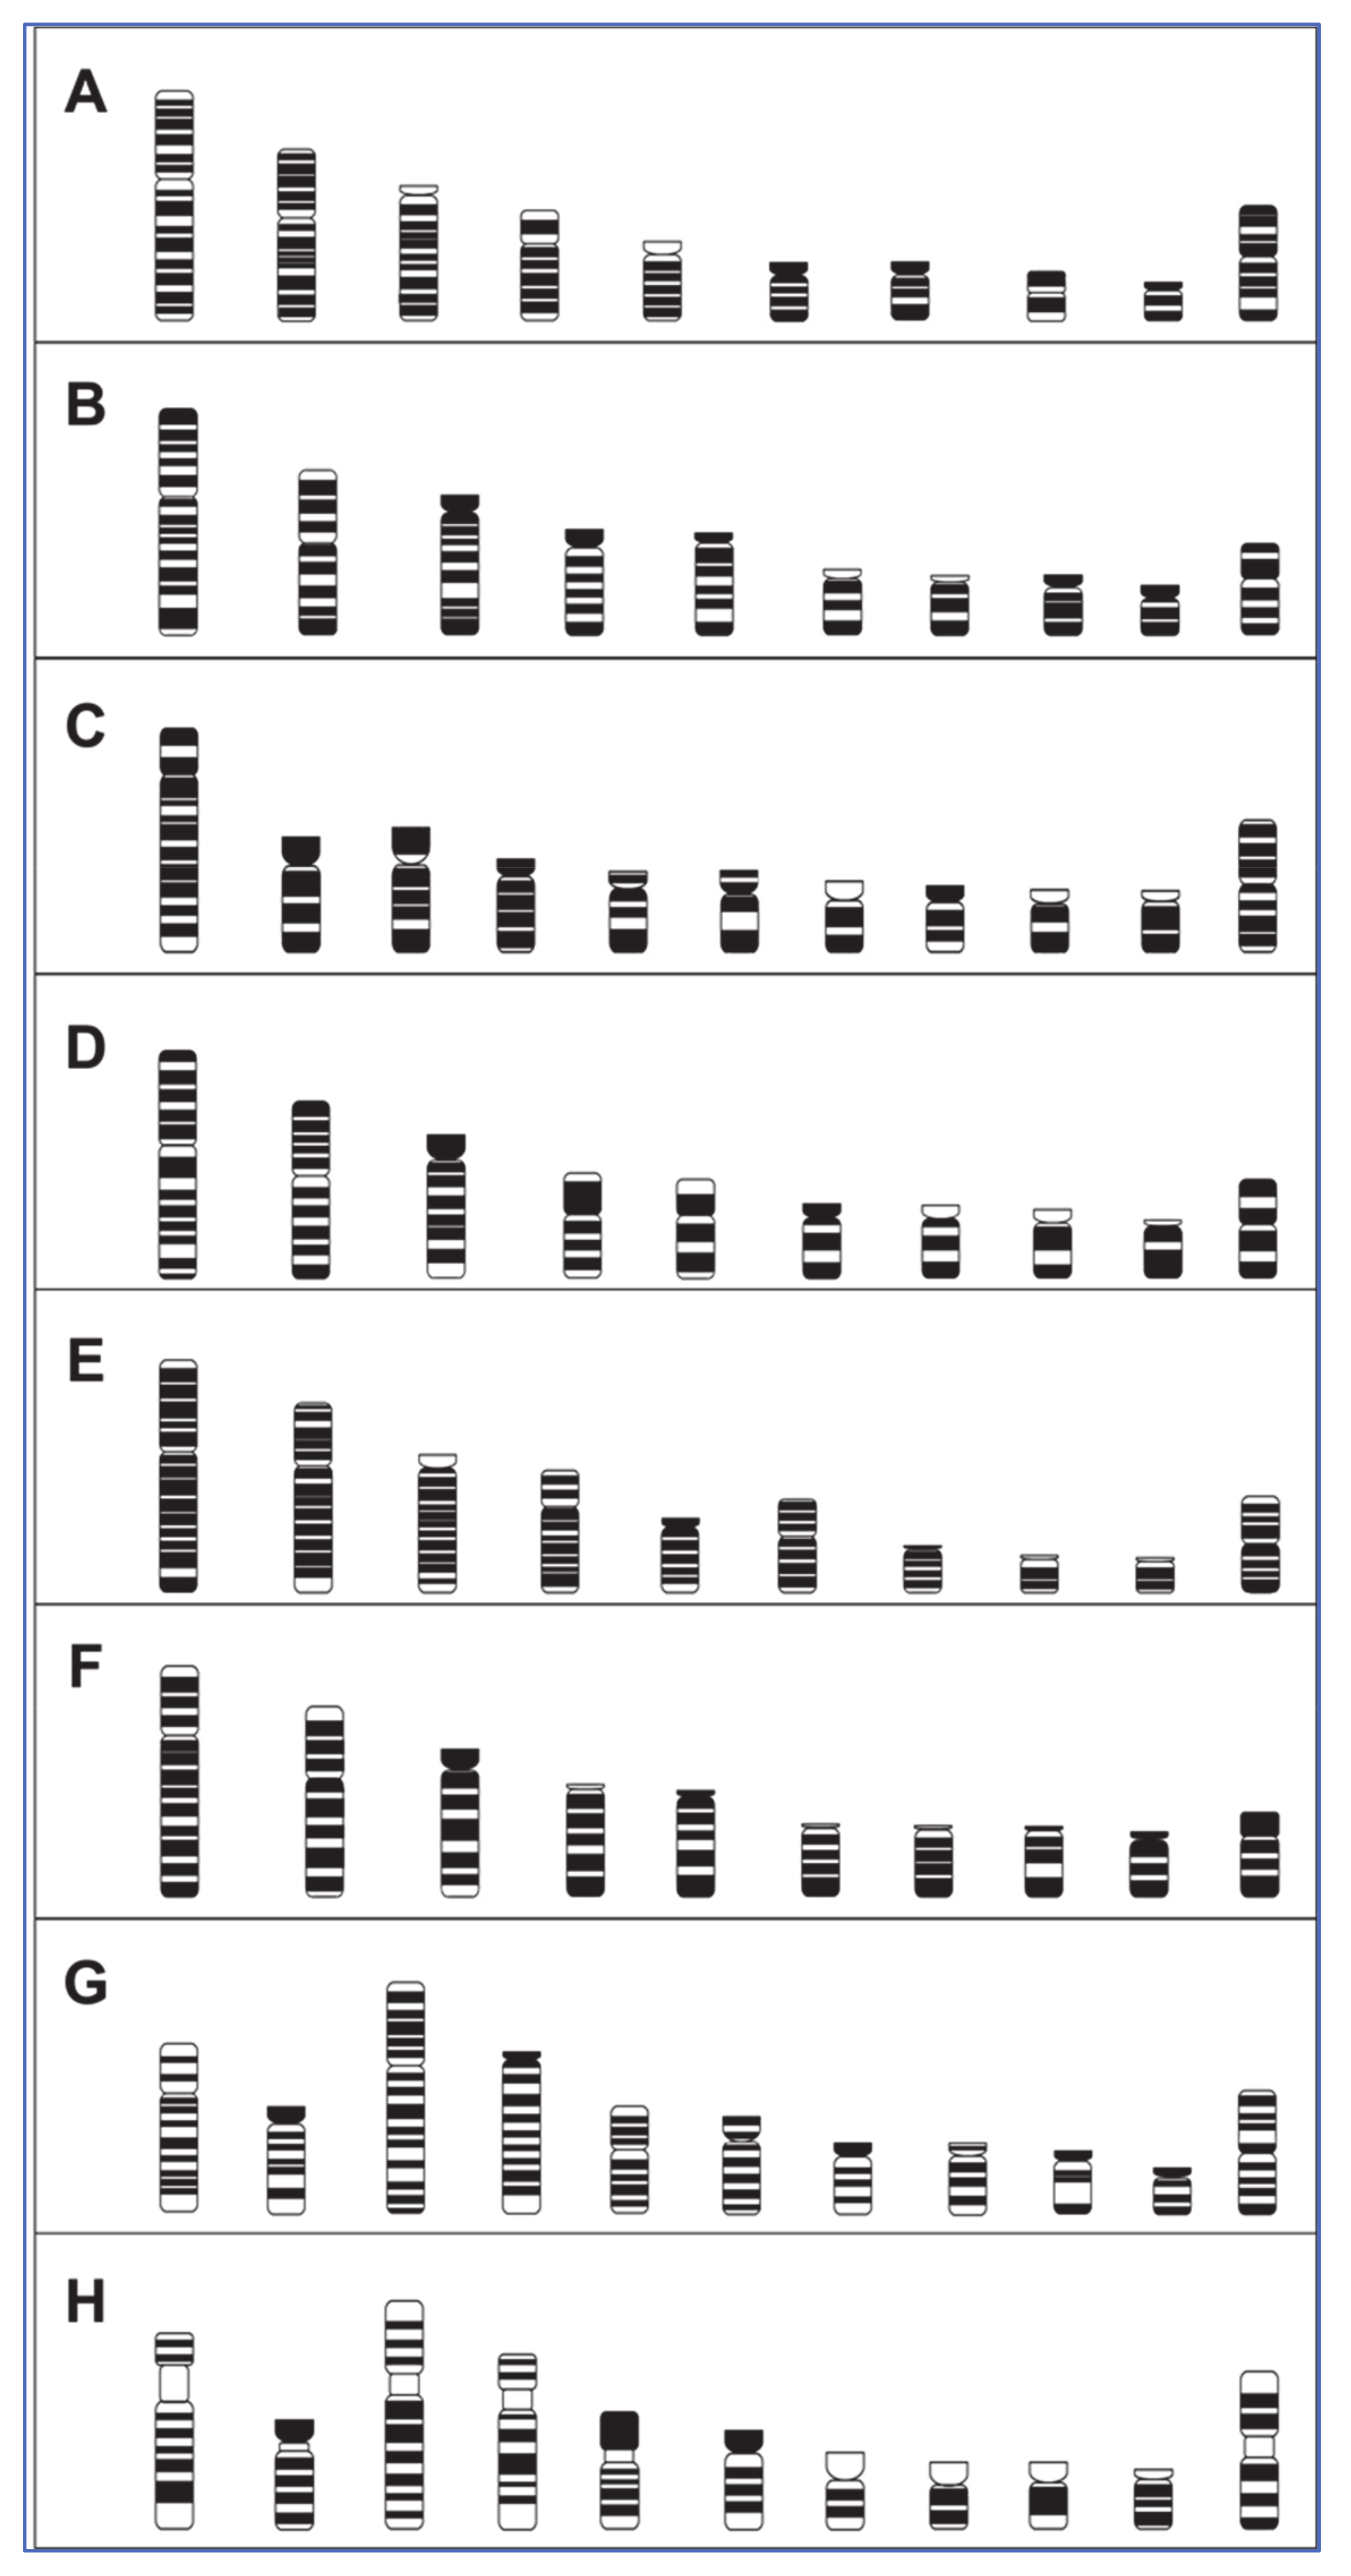
3.1. Karyotypes and Ideograms for Eight Avian Species

Conventional analysis of metaphases from all eight avian species revealed diploid numbers ranging between 76 and 96 chromosomes. Table 1 summarises the chromosomal findings of each species studied.
Karyotypes were completed based on existing studies [10,13,15,32,40,41,42]. The houbara bustard had conflicting karyotype data in the literature, with either a diploid number of 76 [32] or 78 [43]. However, karyotypes performed for this study determined a diploid number of 76. For species where no literature was present, karyotypes were completed following ISSAK classifications [33]. An example of the typical avian karyotype (2n = ~80) is shown in Figure 2A,B, representing the chicken and the mallard duck. Figure 2C,H, representing the Eurasian woodcock and the Atlantic canary, demonstrate different karyotypes that vary either in diploid number or deviate from the ISSAK classification of being ordered by size (chromosome 1 and 1A being ordered before chromosome 2, the largest chromosome in the Atlantic canary).
Using visual inspection and measurements of the chromosome arms, respective chromosome length, and width of bands, ideograms were generated from the karyotypes of the macrochromosomes (1–9, Z, and W). These ideograms (shown in Figure 3) demonstrate differences in chromosome morphology and banding. For instance, helmeted guinea fowl chromosomes in Figure 3E are more heavily banded than chicken chromosomes in 2A, which may not have been apparent in the karyotype images.

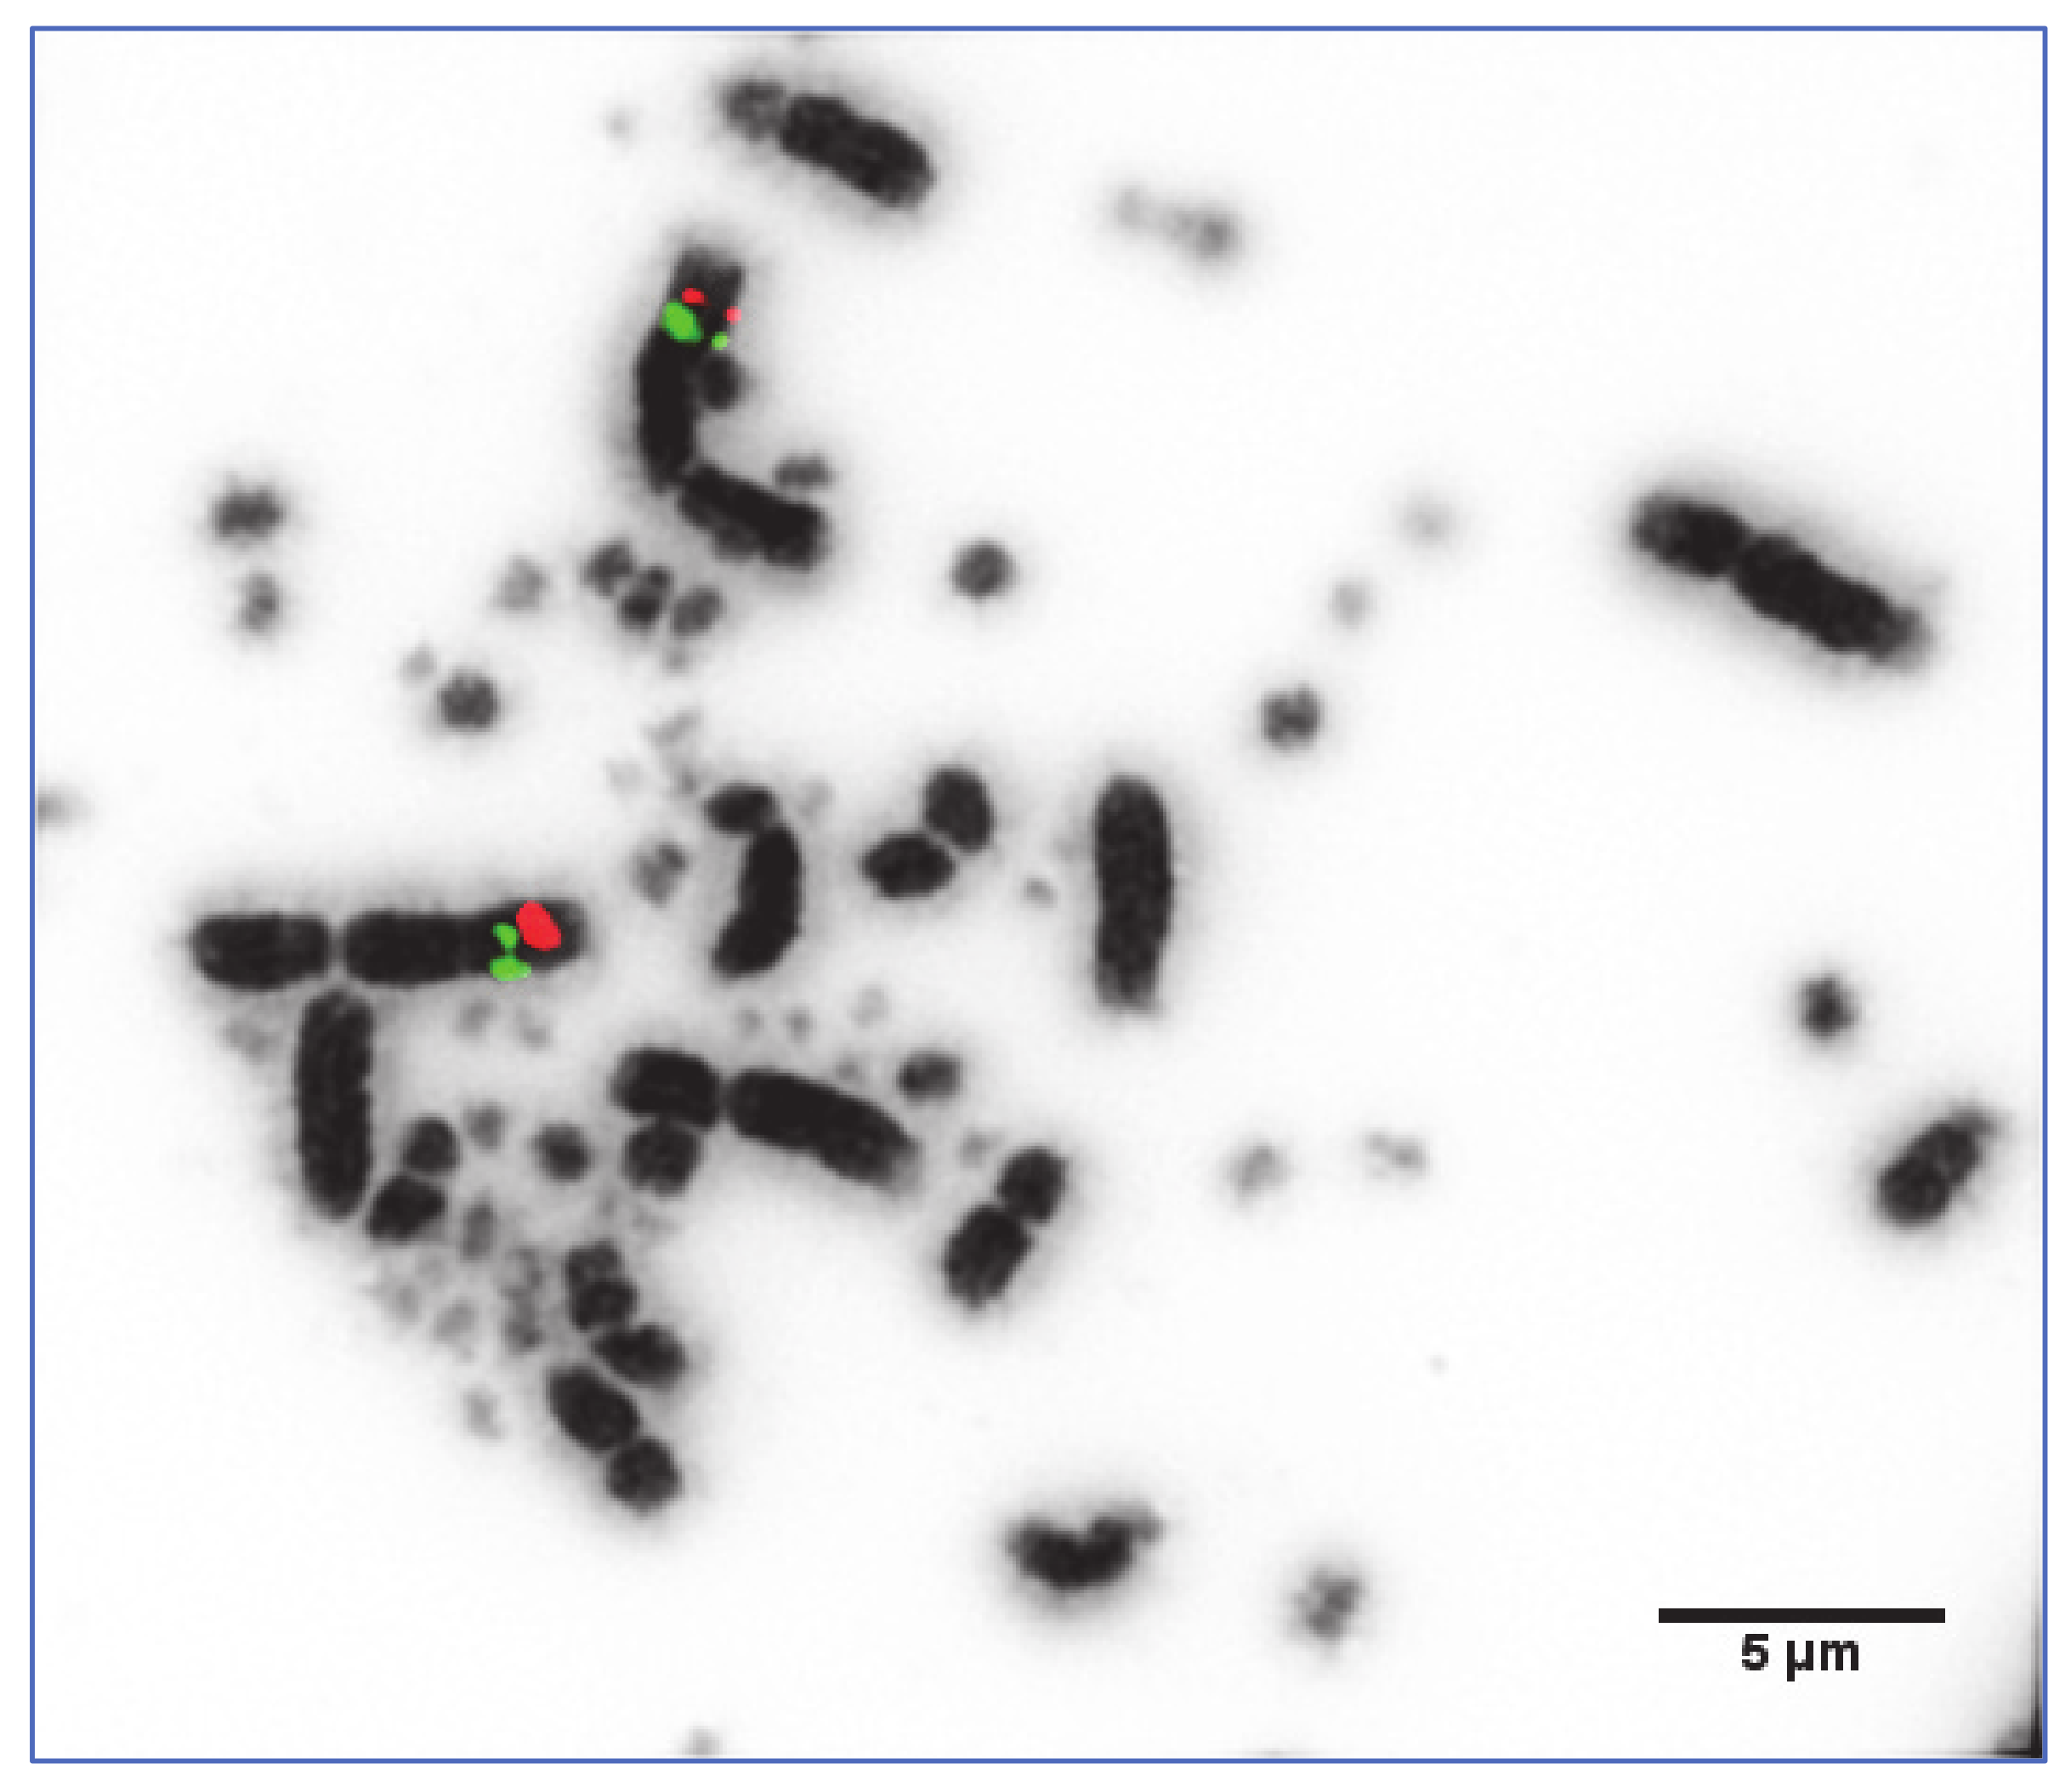
3.2. Application of a Panel of 74 Selected Chicken BACs for the Fine Mapping of Macrochromosome Homologs 1–9 and Z

The 74 conserved BAC clones were selected based on work developed by Damas et al. [13] for hybridisation to the macrochromosomes, with the complete list of BACs and their coordinates in the chicken genome given in the Supplementary Table S1. The degree of successful hybridisations varied between species, with an overall success rate for all 74 BACs given in Table 1.
For BACs that were successfully hybridised (as exemplified in Figure 4 and Figure 5), FLpter values, standard deviations, and the number of mitotic chromosomes measured were recorded. The full tables of results for all species are shown in Supplementary Tables S2–S17.

3.3. Reconstructing the Neognathae Ancestor and Rearrangements

Following MLGO and GRIMM analyses (see Materials and Methods) and using the eight species in this study and ostrich as an outgroup, the presumed neognath ancestral karyotype was reconstructed and the number of changes that occurred from the ancestor noted (Table 2). Chicken had the lowest number (4) followed by guinea fowl (6), duck (8), houbara (9), blackbird (10), canary and pigeon (11 each), and woodcock with the most at 16. The 11 canary rearrangements included two apparent duplications in which extra BAC signals were clearly seen in this species but not in others (and not for other BACs). Intrachromosomal rearrangements identified were both inversions and intrachromosomal duplications. The interchromosomal rearrangements consisted of fusions, fissions, interchromosomal duplications, and translocations. The greater number seen in woodcock is largely accounted for by inter-chromosomal rearrangements (including fissions) whereas pigeon had the most intra-chromosomal rearrangements.
Correlation analysis for the eight avian species (see Supplementary Note S1) revealed an association between chromosomal rearrangement patterns, on the one hand, and overall karyotype/genome organisation and divergence time, on the other. PCA/FAC/ALC-based assessments (see Supplementary Note S2) provided further information in support of the cytogenetically observed specifics of chromosome changes within and between individual lineages in the infraclass Neognathae.
In particular, there was a certain linear correlation between the percentage of failed chicken BAC probes and total numbers of rearrangements in the eight birds (R2 = 0.6378, p < 0.05; Supplementary Figure SN1a). When we used an integrative genome/divergence index (IGDI; see details in Supplementary Note 1), this showed a higher linear correlation with total number of rearrangements (R2 = 0.8427, p < 0.01; Figure 6A).
By employing the multiple correlation procedure (see details in Supplementary Note 1), a 3D surface plot was produced (Figure 6b) that demonstrates that total number of rearrangements (VAR1) grows if both FISH success rate (VAR2) and ratio of diploid number of chromosomes to the typical avian karyotype (2n/80; VAR3) increase (R = 0.983, p < 0.001).
The eight-species clustering patterns in the correlation and PCA/FAC/ALC analyses (see details in Supplementary Note S2) were in agreement with the known phylogeny for this set of the eight neognath birds (Figure 1), except for the duck tending to be closer to the houbara–pigeon pair than to the chicken–guinea fowl pair (see a clustering example on the PCA score plot in Figure 7).

4. Discussion

Use of a universally hybridizing BAC set was successful in detecting multiple chromosomal rearrangements during evolution of the eight species studied. Where our previous studies have used this approach to determine that microchromosomes have undergone few chromosomal rearrangements throughout evolution (O’Connor et al., 2019), the results presented here show that macrochromosomes exhibit both intra- and interchromosomal rearrangements, with the type and number of rearrangement dependent on the lineage. Compared to mammals however, changes are still relatively few, although rearrangement rates can be variable in different lineages (e.g., [44]). A number of patterns emerge, first that, in agreement, with several of our previous studies, chicken appears to be the genome organisation closest to the ancestor. Second however, while previous studies have shown a greater number of intrachromosomal rearrangements in Passeriformes, we find no such evidence, with pigeon, woodcock, and houbara all having similar numbers to canary and blackbird. Previous studies have correlated the greater number of intrachromosomal rearrangements with greater levels of speciation in songbirds (e.g., [45]). This hypothesis may need to be re-assessed in the light of these results.

4.1. Comparative Macrochromosome Maps

Comparative mapping provides insight into patterns of conservation and rearrangement between species. For some chromosomes, there were rearrangement patterns already observed between species within the same order (chromosome 1 fission in the common blackbird and Atlantic canary), which were absent when compared to species from other orders. Other examples can be seen in chromosome 5 for the blackbird, canary, and woodcock, and chromosome 7 in the blackbird, guinea fowl, houbara, and pigeon; each of these patterns is usually in the form of an inversion of the same loci.
The use of comparative mapping aids in the identification of homologous synteny blocks and the evolutionary breakpoints between them, both of which contribute to the evolutionary changes that result in lineage-specific traits (e.g., [31]). However, it is widely debated whether patterns of chromosome evolution are caused by fixed deleterious mutations or high mutation rates resulting in genetic drift [46,47,48]. Nevertheless, chromosomal rearrangements have been found to play a role in speciation as a result of enhanced reproductive isolation through reduced hybrid fitness, and also due to barriers to gene flow in non-recombining regions [49,50].
Moreover, the identification of patterns between species despite divergence times of millions of years signifies an evolutionary role in promoting speciation. For example, the inversions identified here indicate the occurrence of double stranded DNA breaks, and the recurrent use of these breakpoints are due to fragile genomic regions [51]. Larkin et al. [52] established that these evolutionary breakpoint regions have a propensity for promoting chromosomal rearrangement as they are found within gene-dense areas, in which the genes are related to lineage-specific traits [53,54,55]. We later demonstrated that genes near evolutionary breakpoints have a higher chance to change expression profiles due to regulation modifications caused by novel enhancers [56]. Furthermore, it can be suggested that the recurrent breakpoint use could generate novel combinations of genes/regulation networks that may help to promote adaptation.

4.2. Chromosome Paints vs. BAC Mapping

The generation of avian chromosome paints [57] was a significant breakthrough for comparative studies, allowing for the detection of large syntenic relationships between both closely and distantly related species. These chromosome paints have been tested on more than 70 different species (e.g., [3,6,9,58,59]). However, there are many limitations with chromosome paints that restrict comparative studies: the orientation of syntenic regions cannot be established, meaning any number of inversions could be undetected. Moreover, cross-species chromosome painting can yield ambiguous results with non-specific binding, which could either be interpreted as a duplication or translocation, or if a small rearrangement is present, it could be dismissed entirely.
Some of the species studied here have previously had chromosome paints applied to their macrochromosomes [60,61,62], with the main conclusion being that there was high conservation of synteny. Whilst fissions and fusions were detected, the depth of detail provided by the paints was limited. The availability of avian genomic sequences for a well-defined library of BACs has increased the number of genetic markers, allowing for a greater detection of chromosomal rearrangements. For example, studies of the helmeted guinea fowl have shown a fusion of chromosome 6 and 7 to form chromosome 5 (when ordered by size). The BAC mapping in this study not only detected this fusion, but also detected whether there were any intrachromosomal rearrangements within chromosomes 6 and 7, and which orientation the chromosomes fused. Thus, the resolution of detail provided in this study surpasses that of the chromosome painting data and provides more depth to comparative studies of avian species.

4.3. Centromere Position

An interesting aspect of these analyses is centromere position. There are several examples of the order of BACs not changing, but the relative position of the centromere being different compared to them. The “floating centromere” hypothesis was first proposed by Jackson [63,64], while “centromere repositioning” was more recently described in mammalian genomes (e.g., [65]). According to these observations, centromeres can disappear and re-form in different places on the chromosome, without changing gene order; the results presented here provide further evidence of this phenomenon in birds.

4.4. A Potential Tool for Genome Assembly
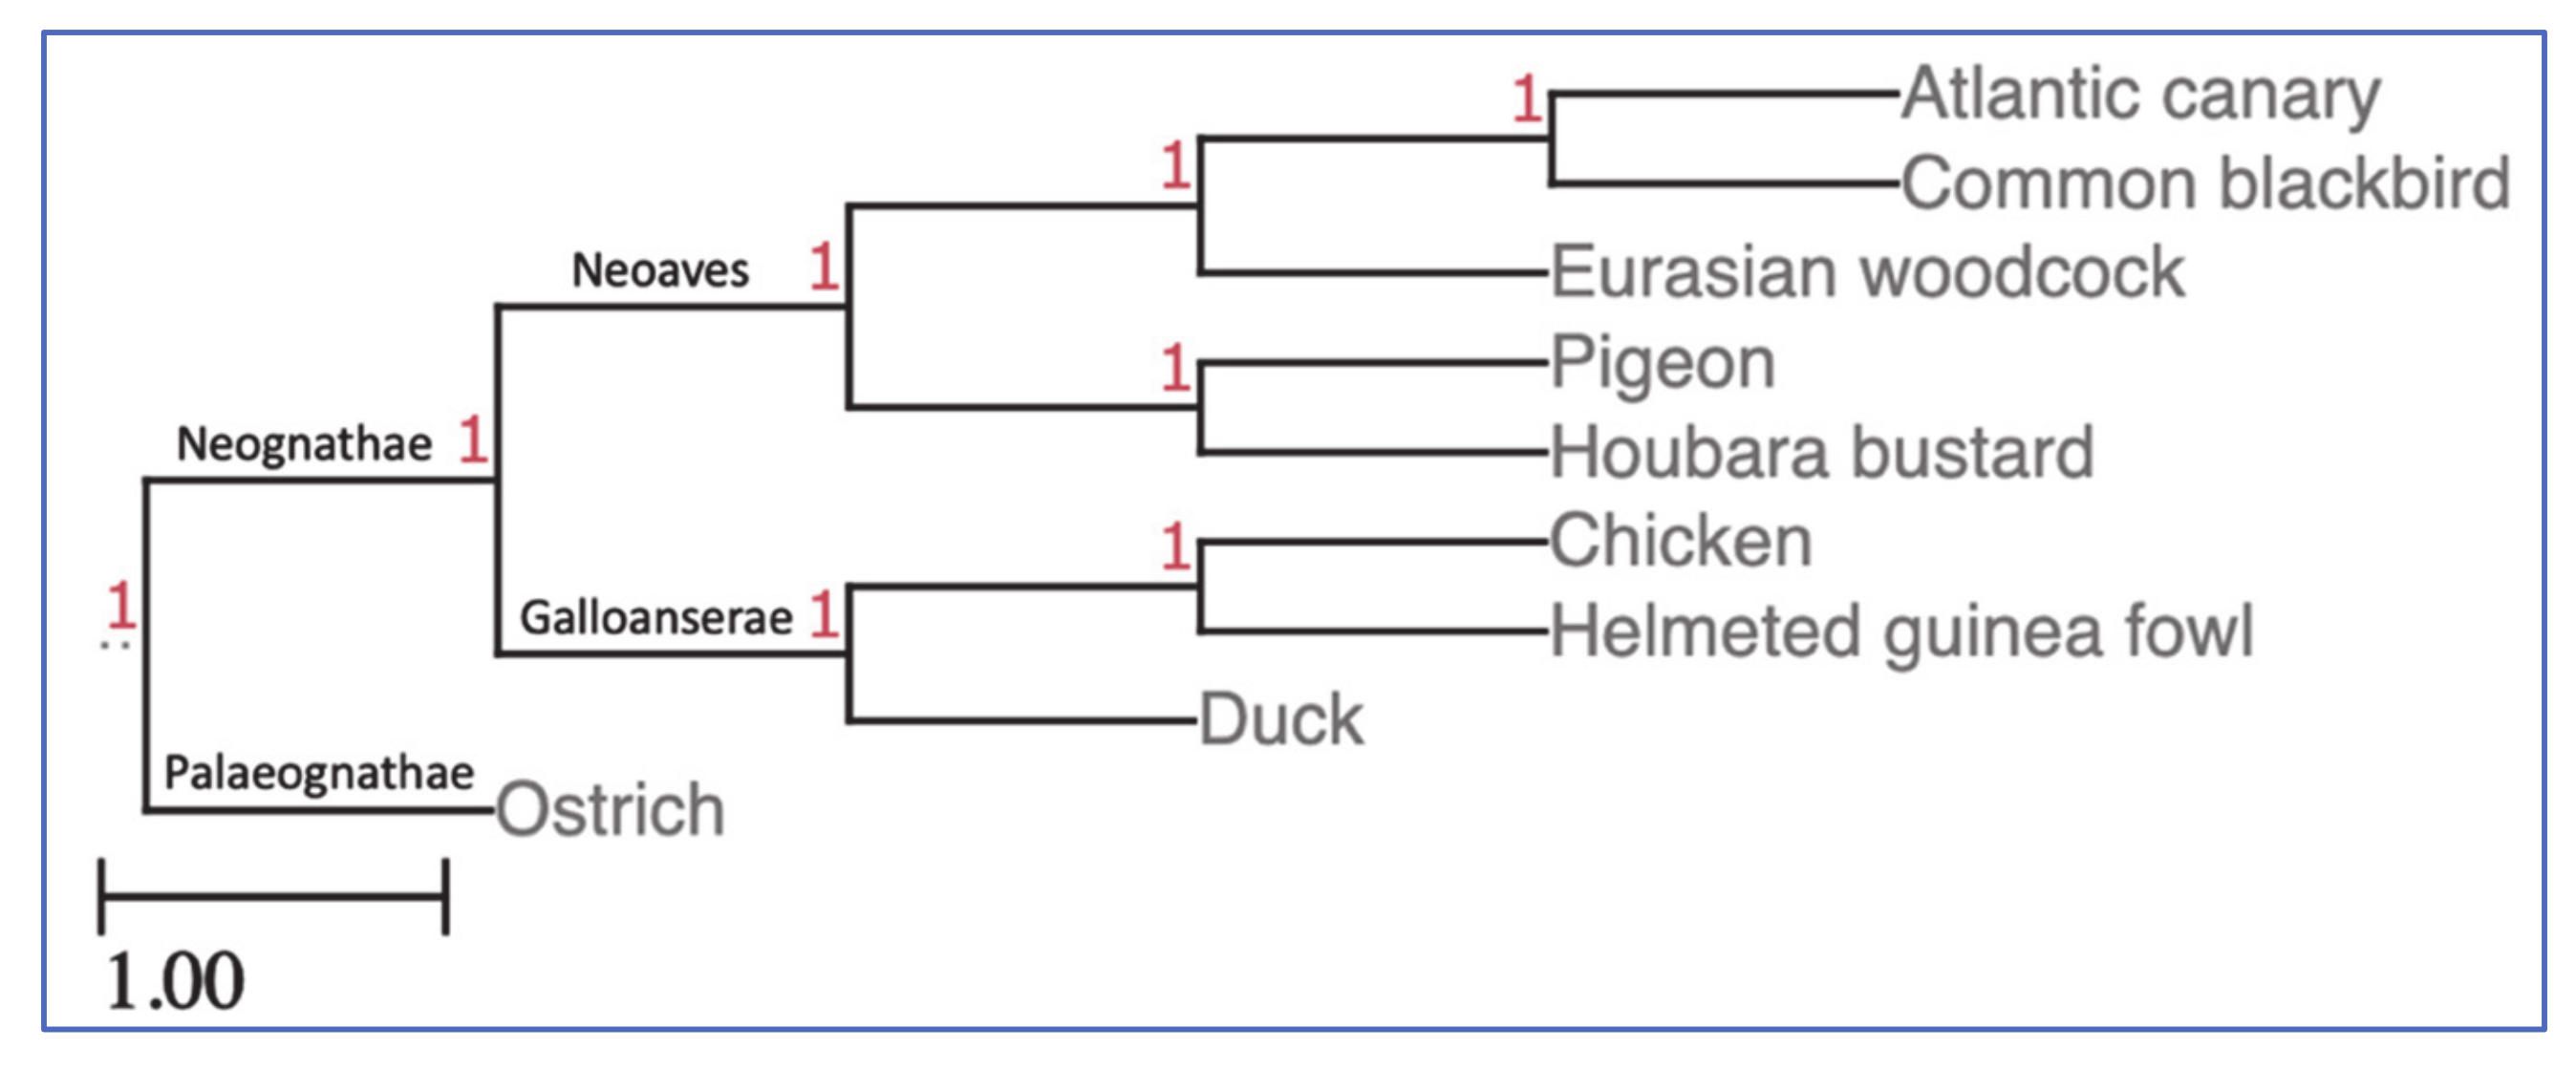
Finally, while some of the species studied here have chromosome-level genome assemblies associated with them, others do not. Indeed, some have not been sequenced at all. In previous studies, we designed BACs to help complete genome assemblies [13,15]. Here, we use the same BAC set on multiple species, demonstrating proof of principle that the data could be retrofitted to a genome assembly of sufficient quality, i.e., with sufficiently few large super-scaffolds such that, for the most part, at least one BAC will be located on them. While genome assemblies continue to improve, some achieving near-chromosome level, a BAC set such as this one would provide confirmatory evidence of the overall genome organisation (e.g., [66,67]).

4.5. Phylogenetics

In terms of phylogenetic relationships as revealed by correlation and PCA/FAC/ALC analyses (see details in Supplementary Notes S1 and S2 [68,69,70,71,72,73,74,75,76]), the observed species grouping basically followed the known phylogeny for this set of eight birds (Figure 1). The only exception was the duck that tends to be closer to the houbara–pigeon pair than to the chicken–guinea fowl pair that might be an evidence that resolution power of the selected 74 BAC probes for interspecies hybridisation, bioinformatic tools used and/or few additional divergence/karyotype characteristics chosen for mathematical analyses [68,69,70,71,72,73,74,75,76] seemed insufficient in verifying the known avian phylogeny for the duck.

5. Conclusions

In conclusion, the results presented here provide hitherto implicit information on the overall chromosome-level organisation of the avian genome and the changes that occurred from the suppositional common Neognathae ancestor. A universally hybridising BAC set is presented that is a main component of the toolbox useful both for genome assembly and phylogenomics of many avian (and possibly other reptilian) species. Comparative cytogenetic maps and chromosome changes analysed here for the eight birds exemplifies efficient applicability of cytogenomic techniques to tackle common and peculiar features of genome organisation and evolution in the class Aves [67]. The observed genomic “variadicity” and specific chromosomal rearrangements are compatible with the available information on general makeup, stability, and variation of the genomes in certain avian taxa with the reference to their ancestors [16,67].

Supplementary Materials

The following are available online at https://www.mdpi.com/2073-4409/10/2/362/s1, Supplementary Note S1: Correlation analyses; and Supplementary Note S2: PCA, FAC and ALC clustering analyses.

Author Contributions

Conceptualization, R.E.O. and D.K.G.; methodology, all authors; validation, L.G.K., R.E.O., M.N.R., D.M.L., and D.K.G.; formal analysis, L.G.K., R.E.O., V.G.N., E.A.B., M.N.R., and D.K.G.; investigation, all authors; data curation, L.G.K., R.E.O., V.G.N., E.A.B., and M.N.R.; writing—original draft preparation, L.G.K. and D.K.G.; writing—review and editing, all authors; visualisation, L.G.K. and R.E.O.; supervision, R.E.O. and D.K.G.; project administration, R.E.O. and D.K.G.; funding acquisition, R.E.O., D.M.L., and D.K.G. All authors have read and agreed to the published version of the manuscript.

Funding

R.E.O. and L.G.K. were funded by grant BBSRC-BB/P020054/1 awarded to D.K.G. and BB/K008226/1 awarded to D.M.L.

Institutional Review Board Statement

Not applicable.

Informed Consent Statement

Not applicable.

Data Availability Statement

All data is contained within the manuscript and supplement, individual FISH images and karyotypes available from the authors on request.

Acknowledgments

We are grateful to our colleagues at CryoArks for housing the cell lines.

Conflicts of Interest

The authors declare no conflict of interest. The funders had no role in the design of the study; in the collection, analyses, or interpretation of data; in the writing of the manuscript, or in the decision to publish the results.

References

  1. Christidis, L.B. Aves. In Animal Cytogenetics; John, B., Ed.; Gebrüder Bornträger: Berlin, Germany; Stuttgart, Germany, 1990; Volume 4, 116p. [Google Scholar]
  2. Masabanda, J.S.; Burt, D.W.; O’Brien, P.C.; Vignal, A.; Fillon, V.; Walsh, P.S.; Cox, H.; Tempest, H.G.; Smith, J.; Habermann, F.; et al. Molecular cytogenetic definition of the chicken genome: The first complete avian karyotype. Genetics 2004, 166, 1367–1373. [Google Scholar] [CrossRef] [PubMed] [Green Version]
  3. Griffin, D.K.; Robertson, L.B.; Tempest, H.G.; Skinner, B.M. The evolution of the avian genome as revealed by comparative molecular cytogenetics. Cytogenet. Genome Res. 2007, 117, 64–77. [Google Scholar] [CrossRef] [PubMed]
  4. Kretschmer, R.; Ferguson-Smith, M.A.; de Oliveira, E.H.C. Karyotype evolution in birds: From conventional staining to chromosome painting. Genes 2018, 9, 181. [Google Scholar] [CrossRef] [PubMed] [Green Version]
  5. Stiller, J.; Zhang, G. Comparative phylogenomics, a stepping stone for bird biodiversity studies. Diversity 2019, 11, 115. [Google Scholar] [CrossRef] [Green Version]
  6. Shetty, S.; Griffin, D.K.; Graves, J.A. Comparative painting reveals strong chromosome homology over 80 million years of bird evolution. Chromosome Res. 1999, 7, 289–295. [Google Scholar] [CrossRef] [PubMed]
  7. Nanda, I.; Shan, Z.; Schartl, M.; Burt, D.W.; Koehler, M.; Nothwang, H.; Grützner, F.; Paton, I.R.; Windsor, D.; Dunn, I.; et al. 300 million years of conserved synteny between chicken Z and human chromosome 9. Nat. Genet. 1999, 21, 258–259. [Google Scholar] [CrossRef]
  8. Nanda, I.; Benisch, P.; Fetting, D.; Haaf, T.; Schmid, M. Synteny conservation of chicken macrochromosomes 1–10 in different avian lineages revealed by cross-species chromosome painting. Cytogenet. Genome Res. 2011, 132, 165–181. [Google Scholar] [CrossRef] [PubMed]
  9. Raudsepp, T.; Houck, M.L.; O’Brien, P.C.; Ferguson-Smith, M.A.; Ryder, O.A.; Chowdhary, B.P. Cytogenetic analysis of California condor (Gymnogyps californianus) chromosomes: Comparison with chicken (Gallus gallus) macrochromosomes. Cytogenet. Genome Res. 2002, 98, 54–60. [Google Scholar] [CrossRef]
  10. Shibusawa, M.; Nishida-Umehara, C.; Masabanda, J.; Griffin, D.K.; Isobe, T.; Matsuda, Y. Chromosome rearrangements between chicken and guinea fowl defined by comparative chromosome painting and FISH mapping of DNA clones. Cytogenet. Genome Res. 2002, 98, 225–230. [Google Scholar] [CrossRef] [PubMed]
  11. Itoh, Y.; Arnold, A.P. Chromosomal polymorphism and comparative painting analysis in the zebra finch. Chromosome Res. 2005, 13, 47–56. [Google Scholar] [CrossRef]
  12. Nishida, C.; Ishijima, J.; Kosaka, A.; Tanabe, H.; Habermann, F.A.; Griffin, D.K.; Matsuda, Y. Characterization of chromosome structures of Falconinae (Falconidae, Falconiformes, Aves) by chromosome painting and delineation of chromosome rearrangements during their differentiation. Chromosome Res. 2008, 16, 171–181. [Google Scholar] [CrossRef] [Green Version]
  13. Damas, J.; O’Connor, R.; Farré, M.; Lenis, V.P.E.; Martell, H.J.; Mandawala, A.; Fowler, K.; Joseph, S.; Swain, M.T.; Griffin, D.K.; et al. Upgrading short-read animal genome assemblies to chromosome level using comparative genomics and a universal probe set. Genome Res. 2017, 27, 875–884. [Google Scholar] [CrossRef] [Green Version]
  14. Lichter, P.; Tang, C.J.; Call, K.; Hermanson, G.; Evans, G.A.; Housman, D.; Ward, D.C. High-resolution mapping of human chromosome 11 by in situ hybridization with cosmid clones. Science 1990, 247, 64–69. [Google Scholar] [CrossRef]
  15. O’Connor, R.E.; Farré, M.; Joseph, S.; Damas, J.; Kiazim, L.; Jennings, R.; Bennett, S.; Slack, E.A.; Allanson, E.; Larkin, D.M.; et al. Chromosome-level assembly reveals extensive rearrangement in saker falcon and budgerigar, but not ostrich, genomes. Genome Biol. 2018, 19, 171. [Google Scholar] [CrossRef] [PubMed] [Green Version]
  16. Romanov, M.N.; Farré, M.; Lithgow, P.E.; Fowler, K.E.; Skinner, B.M.; O’Connor, R.; Fonseka, G.; Backström, N.; Matsuda, Y.; Nishida, C.; et al. Reconstruction of gross avian genome structure, organization and evolution suggests that the chicken lineage most closely resembles the dinosaur avian ancestor. BMC Genom. 2014, 15, 1060. [Google Scholar] [CrossRef] [PubMed] [Green Version]
  17. Romanov, M.N.; O’Connor, R.; Skinner, B.M.; Martell, H.; Farré, M.; Larkin, D.M.; Griffin, D.K. Comparative Cytogenomics Enhanced with Bioinformatic Tools Provides Further Insights into Genome Evolution of Birds and Other Amniotes. In Proceedings of the 2nd Annual Food, Nutrition and Agriculture Genomics Congress, London, UK, 29–30 April 2015. [Google Scholar]
  18. Schmid, M.; Smith, J.; Burt, D.W.; Aken, B.L.; Antin, P.B.; Archibald, A.L.; Ashwell, C.; Blackshear, P.J.; Boschiero, C.; Brown, C.T.; et al. Third Report on Chicken Genes and Chromosomes 2015. Cytogenet. Genome Res. 2015, 145, 78–179. [Google Scholar] [CrossRef] [PubMed] [Green Version]
  19. Ricklefs, R.E. Species richness and morphological diversity of passerine birds. Proc. Natl. Acad. Sci. USA 2012, 109, 14482–14487. [Google Scholar] [CrossRef] [PubMed] [Green Version]
  20. Nowicki, S.; Searcy, W.A.; Peters, S. Brain development, song learning and mate choice in birds: A review and experimental test of the “nutritional stress hypothesis”. J. Comp. Physiol. A Neuroethol. Sens. Neural Behav. Physiol. 2002, 188, 1003–1014. [Google Scholar] [CrossRef]
  21. Olson, C.R.; Mello, C.V. Significance of vitamin A to brain function, behavior and learning. Mol. Nutr. Food Res. 2010, 54, 489–495. [Google Scholar] [CrossRef] [Green Version]
  22. Frankl-Vilches, C.; Kuhl, H.; Werber, M.; Klages, S.; Kerick, M.; Bakker, A.; de Oliveira, E.H.; Reusch, C.; Capuano, F.; Vowinckel, J.; et al. Using the canary genome to decipher the evolution of hormone-sensitive gene regulation in seasonal singing birds. Genome Biol. 2015, 16, 19. [Google Scholar] [CrossRef] [PubMed] [Green Version]
  23. Hoodless, A. Studies of West Palearctic birds. 195. Eurasian Woodcock Scolopax rusticola. BR Birds 1995, 88, 578–592. [Google Scholar]
  24. Braña, F.; Prieto, L.; González-Quirós, P. Habitat change and timing of dusk flight in the Eurasian woodcock: A trade-off between feeding and predator avoidance? Ann. Zool. Fenn. 2010, 47, 206–214. [Google Scholar] [CrossRef] [Green Version]
  25. Duriez, O.; Eraud, C.; Barbraud, C.; Ferrand, Y. Factors affecting population dynamics of Eurasian woodcocks wintering in France: Assessing the efficiency of a hunting-free reserve. Biol. Conserv. 2005, 122, 89–97. [Google Scholar] [CrossRef]
  26. BirdLife International. Species Factsheet: Chlamydotis Undulata. 2020. Available online: http://datazone.birdlife.org/species/factsheet/african-houbara-chlamydotis-undulata (accessed on 24 December 2020).
  27. Vickrey, A.I.; Bruders, R.; Kronenberg, Z.; Mackey, E.; Bohlender, R.J.; Maclary, E.T.; Maynez, R.; Osborne, E.J.; Johnson, K.P.; Huff, C.D.; et al. Introgression of regulatory alleles and a missense coding mutation drive plumage pattern diversity in the rock pigeon. eLife 2018, 7, e34803. [Google Scholar] [CrossRef] [PubMed]
  28. Jourdain, E.; Gunnarsson, G.; Wahlgren, J.; Latorre-Margalef, N.; Bröjer, C.; Sahlin, S.; Svensson, L.; Waldenström, J.; Lundkvist, A.; Olsen, B. Influenza virus in a natural host, the mallard: Experimental infection data. PLoS ONE 2010, 5, e8935. [Google Scholar] [CrossRef] [Green Version]
  29. Rao, M.; Morisson, M.; Faraut, T.; Bardes, S.; Fève, K.; Labarthe, E.; Fillon, V.; Huang, Y.; Li, N.; Vignal, A. A duck RH panel and its potential for assisting NGS genome assembly. BMC Genom. 2012, 13, 513. [Google Scholar] [CrossRef] [PubMed] [Green Version]
  30. Hedges, S.B.; Marin, J.; Suleski, M.; Paymer, M.; Kumar, S. Tree of life reveals clock-like speciation and diversification. Mol. Biol. Evol. 2015, 32, 835–845. [Google Scholar] [CrossRef]
  31. O’Connor, R.E.; Romanov, M.N.; Kiazim, L.G.; Barrett, P.M.; Farré, M.; Damas, J.; Ferguson-Smith, M.; Valenzuela, N.; Larkin, D.M.; Griffin, D.K. Reconstruction of the diapsid ancestral genome permits chromosome evolution tracing in avian and non-avian dinosaurs. Nat. Commun. 2018, 9, 1883. [Google Scholar] [CrossRef] [Green Version]
  32. O’Connor, R.E.; Kiazim, L.; Skinner, B.; Fonseka, G.; Joseph, S.; Jennings, R.; Larkin, D.M.; Griffin, D.K. Patterns of microchromosome organization remain highly conserved throughout avian evolution. Chromosoma 2019, 128, 21–29. [Google Scholar] [CrossRef] [Green Version]
  33. Ladjali-Mohammedi, K.; Bitgood, J.J.; Tixier-Boichard, M.; Ponce De Leon, F.A. International system for standardized avian karyotypes (ISSAK): Standardized banded karyotypes of the domestic fowl (Gallus domesticus). Cytogenet. Cell Genet. 1999, 86, 271–276. [Google Scholar] [CrossRef] [PubMed]
  34. Rasband, W.S. ImageJ: Image processing and analysis in Java. ASCL 2012. [Google Scholar]
  35. Hu, F.; Lin, Y.; Tang, J. MLGO: Phylogeny reconstruction and ancestral inference from gene-order data. BMC Bioinform. 2014, 15, 354. [Google Scholar] [CrossRef] [Green Version]
  36. Prum, R.O.; Berv, J.S.; Dornburg, A.; Field, D.J.; Townsend, J.P.; Lemmon, E.M.; Lemmon, A.R. A comprehensive phylogeny of birds (Aves) using targeted next-generation DNA sequencing. Nature 2015, 526, 569–573. [Google Scholar] [CrossRef] [PubMed]
  37. Huerta-Cepas, J.; Serra, F.; Bork, P. ETE 3: Reconstruction, analysis, and visualization of phylogenomic data. Mol. Biol. Evol. 2016, 33, 1635–1638. [Google Scholar] [CrossRef] [PubMed] [Green Version]
  38. Tesler, G. GRIMM: Genome rearrangements web server. Bioinformatics 2002, 18, 492–493. [Google Scholar] [CrossRef]
  39. Kumar, S.; Stecher, G.; Suleski, M.; Hedges, S.B. TimeTree: A resource for timelines, timetrees, and divergence times. Mol. Biol. Evol. 2017, 34, 1812–1819. [Google Scholar] [CrossRef] [PubMed]
  40. Fillon, V.; Vignoles, M.; Crooijmans, R.P.; Groenen, M.A.; Zoorob, R.; Vignal, A. FISH mapping of 57 BAC clones reveals strong conservation of synteny between Galliformes and Anseriformes. Anim. Genet. 2007, 38, 303–307. [Google Scholar] [CrossRef] [PubMed]
  41. Hammar, B.O. The karyotypes of thirty-one birds. Hereditas 1970, 65, 29–58. [Google Scholar] [CrossRef]
  42. Dos Santos, M.D.; Kretschmer, R.; Frankl-Vilches, C.; Bakker, A.; Gahr, M.; O’Brien, P.C.; Ferguson-Smith, M.A.; de Oliveira, E.H. Comparative cytogenetics between two important songbird models: The zebra finch and the canary. PLoS ONE 2017, 12, e0170997. [Google Scholar] [CrossRef]
  43. Mahiddine-Aoudjit, L.; Boucekkine, O.; Ladjali-Mohammedi, K. Banding cytogenetics of the vulnerable species Houbara bustard (Otidiformes) and comparative analysis with the Domestic fowl. Comp. Cytogenet. 2019, 13, 1–17. [Google Scholar] [CrossRef] [Green Version]
  44. Bourque, G.; Zdobnov, E.M.; Bork, P.; Pevzner, P.A.; Tesler, G. Comparative architectures of mammalian and chicken genomes reveal highly variable rates of genomic rearrangements across different lineages. Genome Res. 2005, 15, 98–110. [Google Scholar] [CrossRef] [PubMed] [Green Version]
  45. Kretschmer, R.; Gunski, R.J.; Garnero Adel, V.; Furo Ide, O.; O’Brien, P.C.; Ferguson-Smith, M.A.; de Oliveira, E.H. Molecular cytogenetic characterization of multiple intrachromosomal rearrangements in two representatives of the genus Turdus (Turdidae, Passeriformes). PLoS ONE 2014, 9, e103338. [Google Scholar] [CrossRef]
  46. Burt, D.W.; Bruley, C.; Dunn, I.C.; Jones, C.T.; Ramage, A.; Law, A.S.; Morrice, D.R.; Paton, I.R.; Smith, J.; Windsor, D.; et al. The dynamics of chromosome evolution in birds and mammals. Nature 1999, 402, 411–413. [Google Scholar] [CrossRef] [PubMed]
  47. Navarro, A.; Barton, N.H. Chromosomal speciation and molecular divergence--accelerated evolution in rearranged chromosomes. Science 2003, 300, 321–324. [Google Scholar] [CrossRef] [PubMed] [Green Version]
  48. Edwards, S.V.; Kingan, S.B.; Calkins, J.D.; Balakrishnan, C.N.; Jennings, W.B.; Swanson, W.J.; Sorenson, M.D. Speciation in birds: Genes, geography, and sexual selection. Proc. Natl. Acad. Sci. USA 2005, 102, 6550–6557. [Google Scholar] [CrossRef] [Green Version]
  49. Noor, M.A.; Grams, K.L.; Bertucci, L.A.; Reiland, J. Chromosomal inversions and the reproductive isolation of species. Proc. Natl. Acad. Sci. USA 2001, 98, 12084–12088. [Google Scholar] [CrossRef] [PubMed] [Green Version]
  50. Rieseberg, L.H. Chromosomal rearrangements and speciation. Trends Ecol. Evol. 2001, 16, 351–358. [Google Scholar] [CrossRef]
  51. Pevzner, P.; Tesler, G. Human and mouse genomic sequences reveal extensive breakpoint reuse in mammalian evolution. Proc. Natl. Acad. Sci. USA 2003, 100, 7672–7677. [Google Scholar] [CrossRef] [PubMed] [Green Version]
  52. Larkin, D.M.; Pape, G.; Donthu, R.; Auvil, L.; Welge, M.; Lewin, H.A. Breakpoint regions and homologous synteny blocks in chromosomes have different evolutionary histories. Genome Res. 2009, 19, 770–777. [Google Scholar] [CrossRef] [PubMed] [Green Version]
  53. Bovine Genome Sequencing and Analysis Consortium. The genome sequence of taurine cattle: A window to ruminant biology and evolution. Science 2009, 324, 522–528. [Google Scholar] [CrossRef] [Green Version]
  54. Groenen, M.A.; Archibald, A.L.; Uenishi, H.; Tuggle, C.K.; Takeuchi, Y.; Rothschild, M.F.; Rogel-Gaillard, C.; Park, C.; Milan, D.; Megens, H.J.; et al. Analyses of pig genomes provide insight into porcine demography and evolution. Nature 2012, 491, 393–398. [Google Scholar] [CrossRef]
  55. Farré, M.; Narayan, J.; Slavov, G.T.; Damas, J.; Auvil, L.; Li, C.; Jarvis, E.D.; Burt, D.W.; Griffin, D.K.; Larkin, D.M. Novel insights into chromosome evolution in birds, archosaurs, and reptiles. Genome Biol. Evol. 2016, 8, 2442–2451. [Google Scholar] [CrossRef] [PubMed] [Green Version]
  56. Farré, M.; Kim, J.; Proskuryakova, A.A.; Zhang, Y.; Kulemzina, A.I.; Li, Q.; Zhou, Y.; Xiong, Y.; Johnson, J.L.; Perelman, P.L.; et al. Evolution of gene regulation in ruminants differs between evolutionary breakpoint regions and homologous synteny blocks. Genome Res. 2019, 29, 576–589. [Google Scholar] [CrossRef] [PubMed] [Green Version]
  57. Griffin, D.K.; Haberman, F.; Masabanda, J.; O’Brien, P.; Bagga, M.; Sazanov, A.; Smith, J.; Burt, D.W.; Ferguson-Smith, M.; Wienberg, J. Micro- and macrochromosome paints generated by flow cytometry and microdissection: Tools for mapping the chicken genome. Cytogenet. Cell Genet. 1999, 87, 278–281. [Google Scholar] [CrossRef]
  58. Hansmann, T.; Nanda, I.; Volobouev, V.; Yang, F.; Schartl, M.; Haaf, T.; Schmid, M. Cross-species chromosome painting corroborates microchromosome fusion during karyotype evolution of birds. Cytogenet. Genome Res. 2009, 126, 281–304. [Google Scholar] [CrossRef] [PubMed]
  59. Nie, W.; O’Brien, P.C.; Ng, B.L.; Fu, B.; Volobouev, V.; Carter, N.P.; Ferguson-Smith, M.A.; Yang, F. Avian comparative genomics: Reciprocal chromosome painting between domestic chicken (Gallus gallus) and the stone curlew (Burhinus oedicnemus, Charadriiformes)—An atypical species with low diploid number. Chromosome Res. 2009, 17, 99–113. [Google Scholar] [CrossRef] [PubMed] [Green Version]
  60. Guttenbach, M.; Nanda, I.; Feichtinger, W.; Masabanda, J.S.; Griffin, D.K.; Schmid, M. Comparative chromosome painting of chicken autosomal paints 1–9 in nine different bird species. Cytogenet. Genome Res. 2003, 103, 173–184. [Google Scholar] [CrossRef]
  61. Derjusheva, S.; Kurganova, A.; Habermann, F.; Gaginskaya, E. High chromosome conservation detected by comparative chromosome painting in chicken, pigeon and passerine birds. Chromosome Res. 2004, 12, 715–723. [Google Scholar] [CrossRef]
  62. Shibusawa, M.; Nishida-Umehara, C.; Tsudzuki, M.; Masabanda, J.; Griffin, D.K.; Matsuda, Y. A comparative karyological study of the blue-breasted quail (Coturnix chinensis, Phasianidae) and California quail (Callipepla californica, Odontophoridae). Cytogenet. Genome Res. 2004, 106, 82–90. [Google Scholar] [CrossRef]
  63. Jackson, R.C. Interspecific hybridization in Haplopappus and its bearing on chromosome evolution in the Blepharodon section. Am. J. Bot. 1962, 49, 119–132. [Google Scholar] [CrossRef]
  64. Jackson, R.C. The karyotype in systematics. Annu. Rev. Ecol. Evol. Syst. 1971, 2, 327–368. [Google Scholar] [CrossRef]
  65. Rocchi, M.; Archidiacono, N.; Schempp, W.; Capozzi, O.; Stanyon, R. Centromere repositioning in mammals. Heredity 2012, 108, 59–67. [Google Scholar] [CrossRef] [PubMed]
  66. Houde, P. Special Issue: Genomic Analyses of Avian Evolution. Diversity 2019, 11, 178. [Google Scholar] [CrossRef] [Green Version]
  67. Romanov, M.N.; Kiazim, L.; O’Connor, R.; Griffin, D.K. Current Molecular Genetic and Genomic Technologies in the Field of Studying the Avian Biology. In Proceedings of the Molecular Genetic Technologies for Analysis of Gene Expression of Productivity and Resistance to Diseases of Animals, Materials of the 2nd International Conference, Moscow, Russia, 25 December 2020; Sel’skokhozyaistvennye Tekhnologii: Moscow, Russia, 2020; pp. 34–44. [Google Scholar] [CrossRef]
  68. Romanov, M.N.; Farré-Belmonte, M.; Lithgow, P.E.; O’Connor, R.; Fowler, K.E.; Larkin, D.M.; Griffin, D.K. In silico Reconstruction of Chromosomal Rearrangements and an Avian Ancestral Karyotype. In Proceedings of the International Plant and Animal Genome XXII Conference, San Diego, CA, USA, 10–14 January 2014; Scherago International: San Diego, CA, USA, 2014. [Google Scholar]
  69. RDocumentation. The R Base Package by R-core R-core@R-project.org; Base v3.6.2. Scale Function. 2019. Available online: https://www.rdocumentation.org/packages/base/versions/3.6.2/topics/scale (accessed on 22 December 2020).
  70. Shitikov, V.K.; Mastitsky, S.E. 10.4.2 Fuzzy k-Means Method (Fuzzy Analysis Clustering). In Classification, Regression, Data Mining Algorithms Using R; Electronic Book; 2017; Available online: https://ranalytics.github.io/data-mining/104-Other-Clustering-Methods.html#sec_10_4_2 (accessed on 22 December 2020).
  71. Fanny: Fuzzy Analysis Clustering. Documentation for Package ‘Cluster’ Version 2.1.0. “Finding Groups in Data”: Cluster Analysis Extended Rousseeuw et al. 2019. Available online: https://rdrr.io/cran/cluster/man/fanny.html (accessed on 22 December 2020).
  72. Suzuki, R.; Shimodaira, H. Pvclust: An R package for assessing the uncertainty in hierarchical clustering. Bioinformatics 2006, 22, 1540–1542. [Google Scholar] [CrossRef]
  73. Zhao, Q.; Hautamaki, V.; Fränti, P. Knee Point Detection in BIC for Detecting the Number of Clusters. In International Conference on Advanced Concepts for Intelligent Vision Systems—ACIVS 2008; Lecture Notes in Computer Science; Blanc-Talon, J., Bourennane, S., Philips, W., Popescu, D., Scheunders, P., Eds.; Springer: Berlin/Heidelberg, Germany, 2008; Volume 5259, pp. 664–673. ISBN 978-3-540-88457-6. [Google Scholar]
  74. Smith, M.R. TreeDist: Distances between Phylogenetic Trees (Version v0.0.0.9000). Zenodo 2019. Available online: https://zenodo.org/record/3528124 (accessed on 24 December 2020). [CrossRef]
  75. Smith, M.R. Information theoretic Generalized Robinson-Foulds metrics for comparing phylogenetic trees. Bioinformatics 2020. [Google Scholar] [CrossRef]
  76. Smith, M.R. Visualise a Matching–VisualizeMatching. TreeDist 1.2.1. 2020. Available online: https://ms609.github.io/TreeDist/reference/VisualizeMatching.html (accessed on 22 December 2020).
Figure 1. The Maximum Likelihood for Gene Order Analysis (MLGO input phylogenetic tree for the eight birds plus ostrich taken as an outgroup genome. The tree was visualised using the ETE v3 toolkit [37]. The respective Newick format tree can be written as (((((Atlantic canary, Common blackbird), Eurasian woodcock), (Pigeon, Houbara bustard)), ((Chicken, Helmeted guinea fowl), Duck)), Ostrich); as inferred from the Prum et al. [36] phylogeny for birds. Provisional support values (1) are shown in red.
Cells 10 00362 g001
Figure 2. The variety of avian karyotypes observed in the seven avian species compared to chicken: (A) chicken (Gallus gallus), (B) mallard duck (Anas platyrhynchos), (C) Eurasian woodcock (Scolopax rusticola), (D) rock dove/pigeon (Columba livia), (E) helmeted guinea fowl (Numida meleagris), (F) houbara bustard (Chlamydotis undulata), (G) common blackbird (Turdus merula), (H) Atlantic canary (Serinus canaria). Scale bar 5 μm.
Cells 10 00362 g002
Figure 3. Ideograms of the macrochromosomes from all of the seven avian species compared to chicken. (A) chicken (Gallus gallus), (B) mallard duck (Anas platyrhynchos), (C) Eurasian woodcock (Scolopax rusticola), (D) rock dove/pigeon (Columba livia), (E) helmeted guinea fowl (Numida meleagris), (F) houbara bustard (Chlamydotis undulata), (G) common blackbird (Turdus merula), (H) Atlantic canary (Serinus canaria). Scale bar 5 μm.
Cells 10 00362 g003
Figure 4. BAC clones hybridised to helmeted guinea fowl chromosome 1. The FITC (green) labelled signal represents CH261-107E2 (chicken 1 homolog), the Texas red labelled signal represents CH261-184E5 (chicken 1 homolog).
Cells 10 00362 g004
Figure 5. Ideograms indicating relative hybridisation positions of BACs for chicken chromosome 1, with BACs labelled 1-17 in order of position on the chicken chromosome. BAC positions are indicated for chicken (GGA) chromosome 1, mallard (APL) 1, pigeon (CLI) 1, helmeted guinea fowl (NME) 1, and houbara bustard (CUN) 1. For the common blackbird (TME), Atlantic canary (SCD), and Eurasian woodcock (SRU), BACs are indicated for chromosomes 1A (top) and 1 (bottom). The remaining chromosomal rearrangements are given in Supplementary Figures S1–S9.
Cells 10 00362 g005
Figure 6. Graphical representation for correlations between rearrangement/divergence characteristics in the eight avian genomes studied. Upper (A): Simple linear correlation between the integrative genome/divergence index (IGDI; see details in Supplementary Note 1) and total rearrangements: C, chicken; G, helmeted guinea fowl; D, mallard duck; P, pigeon; H, houbara bustard; B, common blackbird; A, Atlantic canary; and W, Eurasian woodcock. Lower (B): Multiple correlation 3D surface plot (see details in Supplementary Note 1) for total number of rearrangements (VAR1), fluorescence in situ hybridisation (FISH) success rate (VAR2) and ratio of diploid number of chromosomes to the typical avian karyotype (2n/80; VAR3) across the eight avian species studied.
Cells 10 00362 g006
Figure 7. Principal Component Analysis (PCA) score plot generated for the eight bird species studied using four characteristics: BAC hybridisation success rate (Rate), and numbers of total (Total), intra- (Intra rearrangements) and interchromosomal (Inter rearrangements) rearrangements.
Cells 10 00362 g007
Table 1. Summary of karyotype, divergence, and percentage of successful bacterial artificial chromosome (BAC) hybridisation in the eight avian species studied.
InfraclassOrderCommon Name2nDivergence 1 (Mya 2)Hybridisation Success Rate (%)
NeognathaeGalliformeschicken78 3100
Galliformeshelmeted guinea fowl78 347100
Anseriformesduck (mallard)80 48085.1
Columbiformesrock dove (pigeon)80 59893.2
Otidiformeshoubara bustard76 69887.8
Passeriformescommon blackbird80 79878.4
PasseriformesAtlantic canary80 89873.0
CharadriiformesEurasian woodcock96 69873.0
PalaeognathaeStruthioniformesostrich 980 614083.8
1 As estimated between the chicken and any other studied bird using TimeTree [39]. 2 Million years ago. 2n, diploid number of chromosomes, according to: 3 Shibusawa et al. [10]; 4 Fillon et al. [40]; 5 Damas et al. [13]; 6 O’Connor et al. [32]; 7Hammar [41]; 8 Dos Santos et al. [42]. 9 Ostrich is added (from O’Connor et al. [15,32]) for comparison.
Table 2. Summary of chromosomal rearrangements occurring from the common ancestor, as determined by Genome Rearrangements in Man and Mouse (GRIMM).
SpeciesInversionsDuplicationsIntra-Chromosomal TranslocationsInter-Chromosomal TranslocationsFusionsFissionsTotal
Chicken3 1 4
Guinea fowl4 2 6
Duck8 8
Houbara 9 9
Pigeon11 11
Blackbird9 110
Canary4222 111
Woodcock8 3 516
Publisher’s Note: MDPI stays neutral with regard to jurisdictional claims in published maps and institutional affiliations.

