
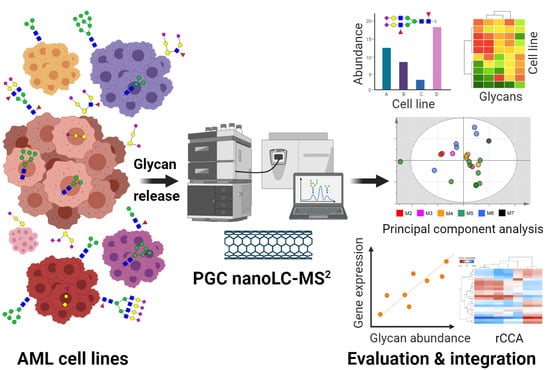
Integrated N- and O-Glycomics of Acute Myeloid Leukemia (AML) Cell Lines

 , ,
, ,  ,
,  , and
, and
Abstract
:
1. Introduction
2. Materials and Methods
2.1. Cell Culture
2.2. Sample Preparation
2.3. PGC Nano-LC-MS2
2.4. Data Evaluation
3. Results
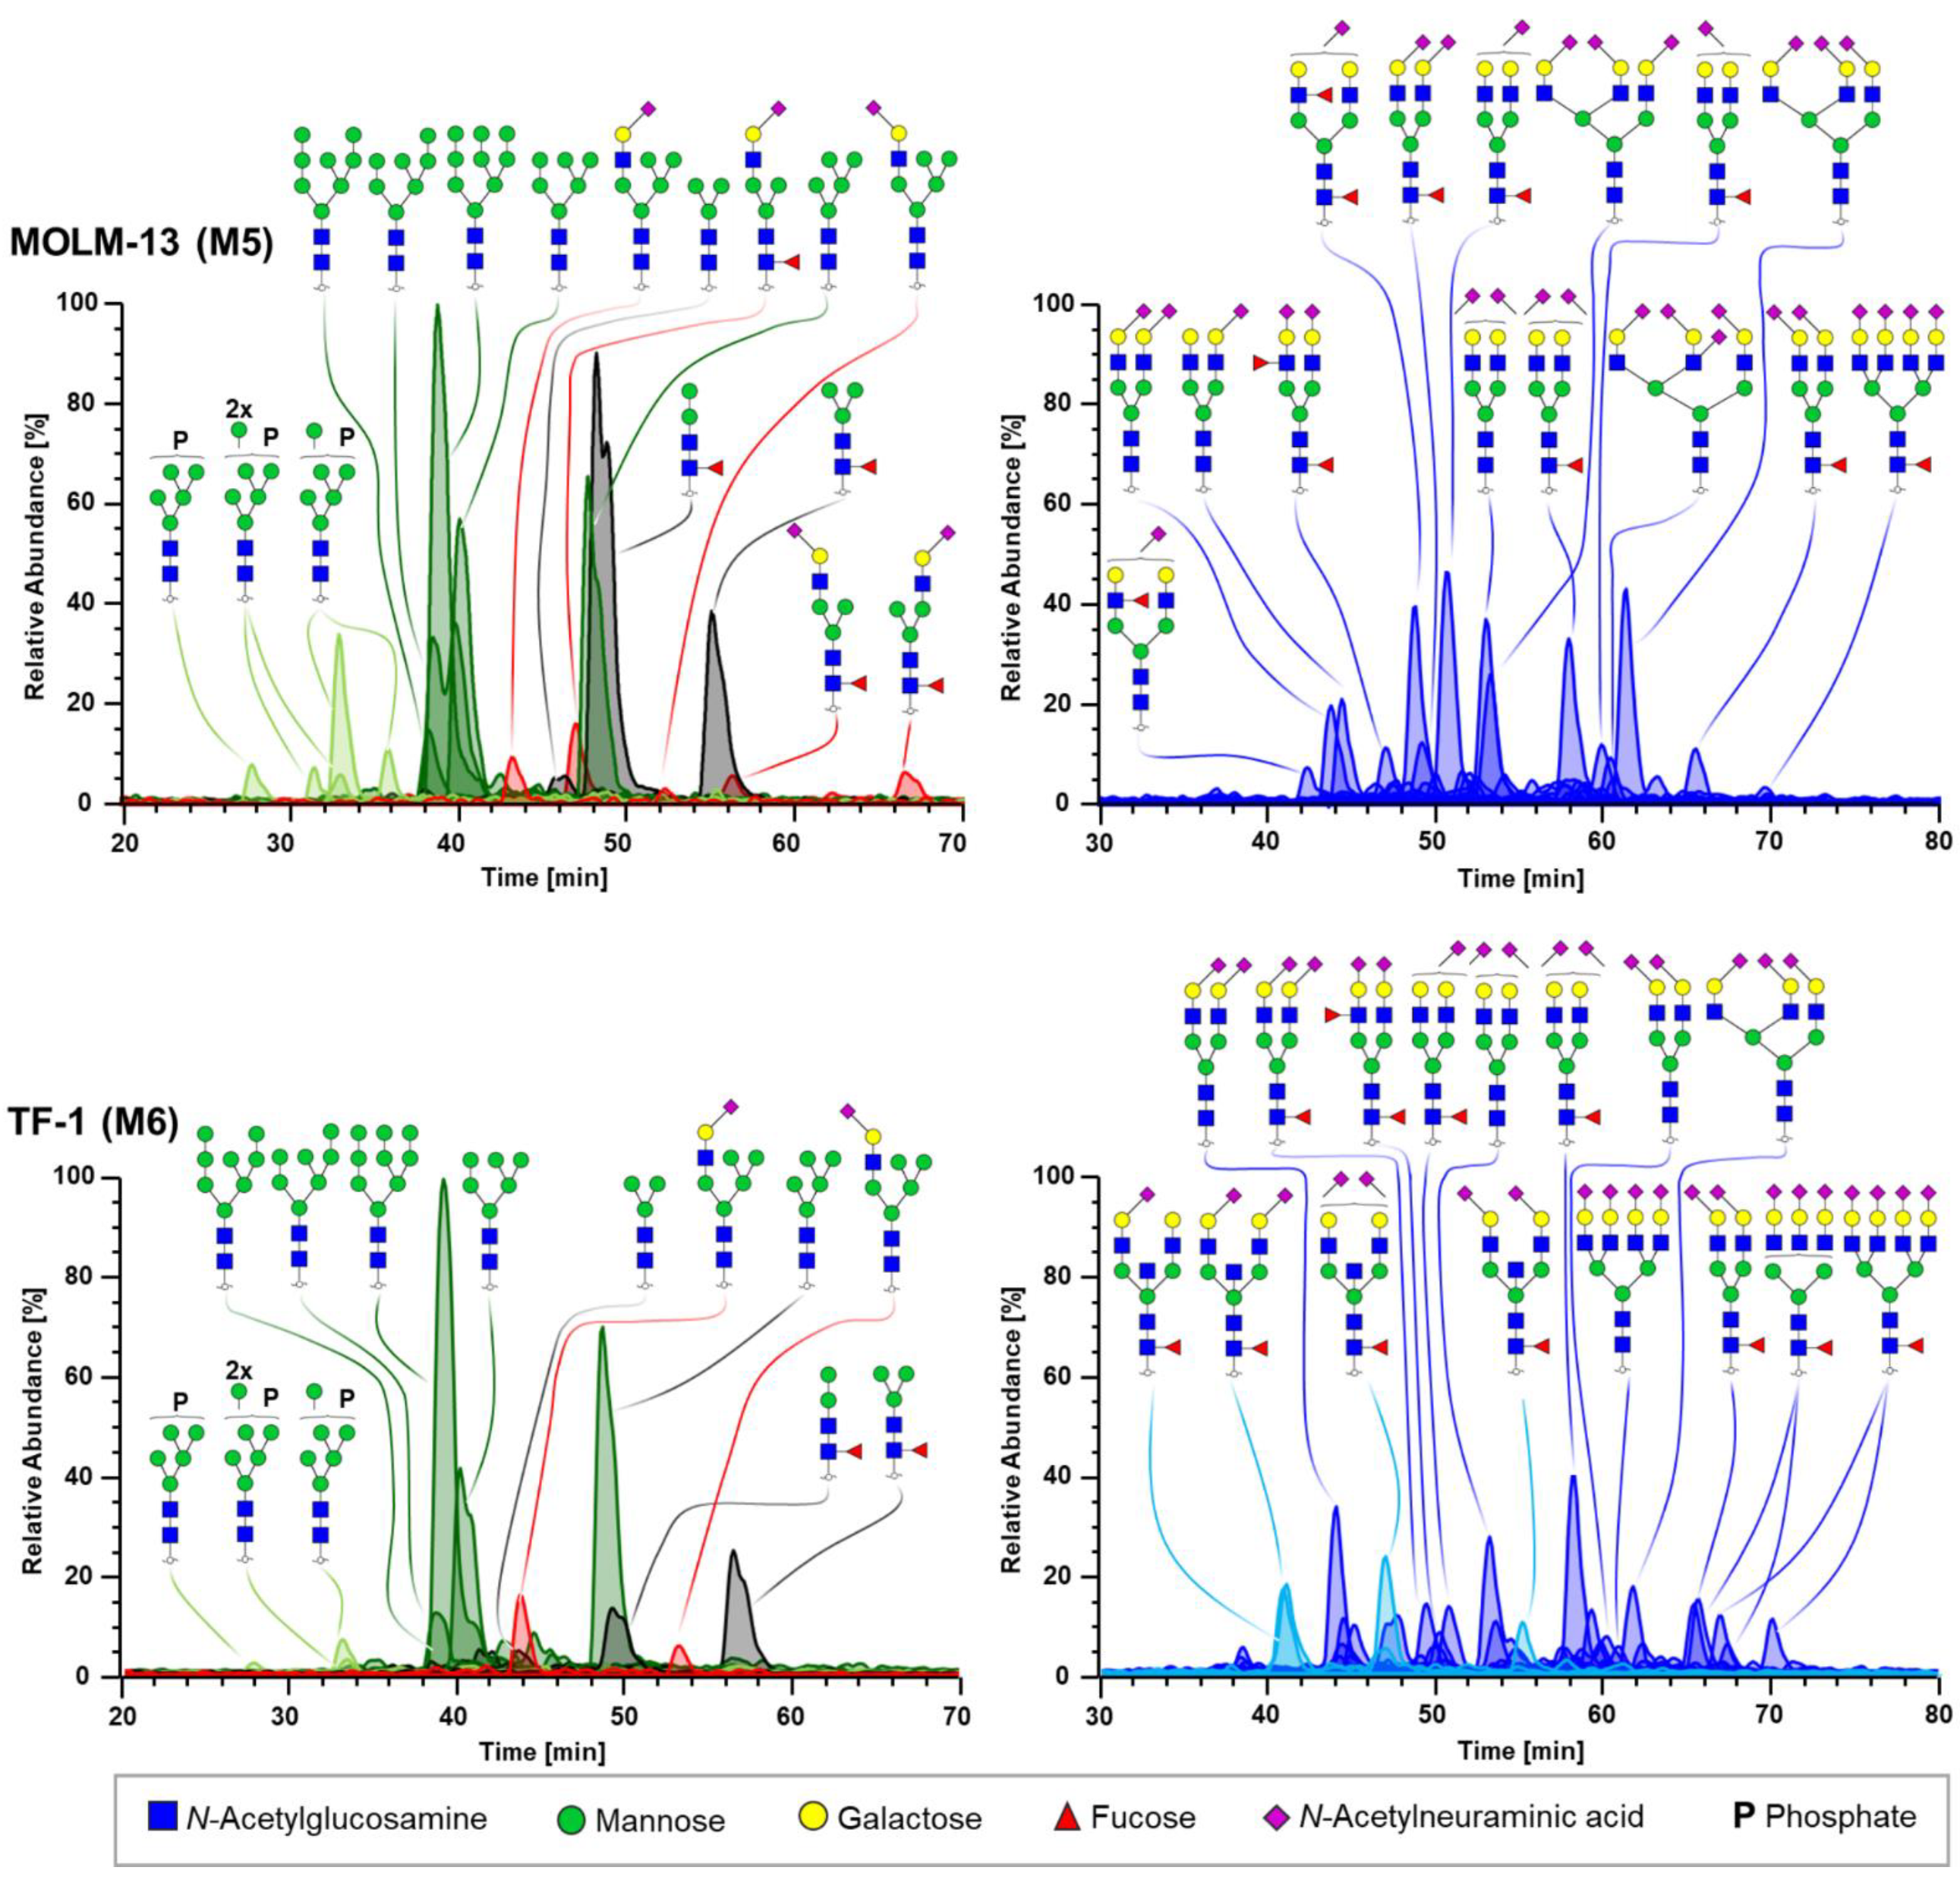
3.1. N-Glycomics
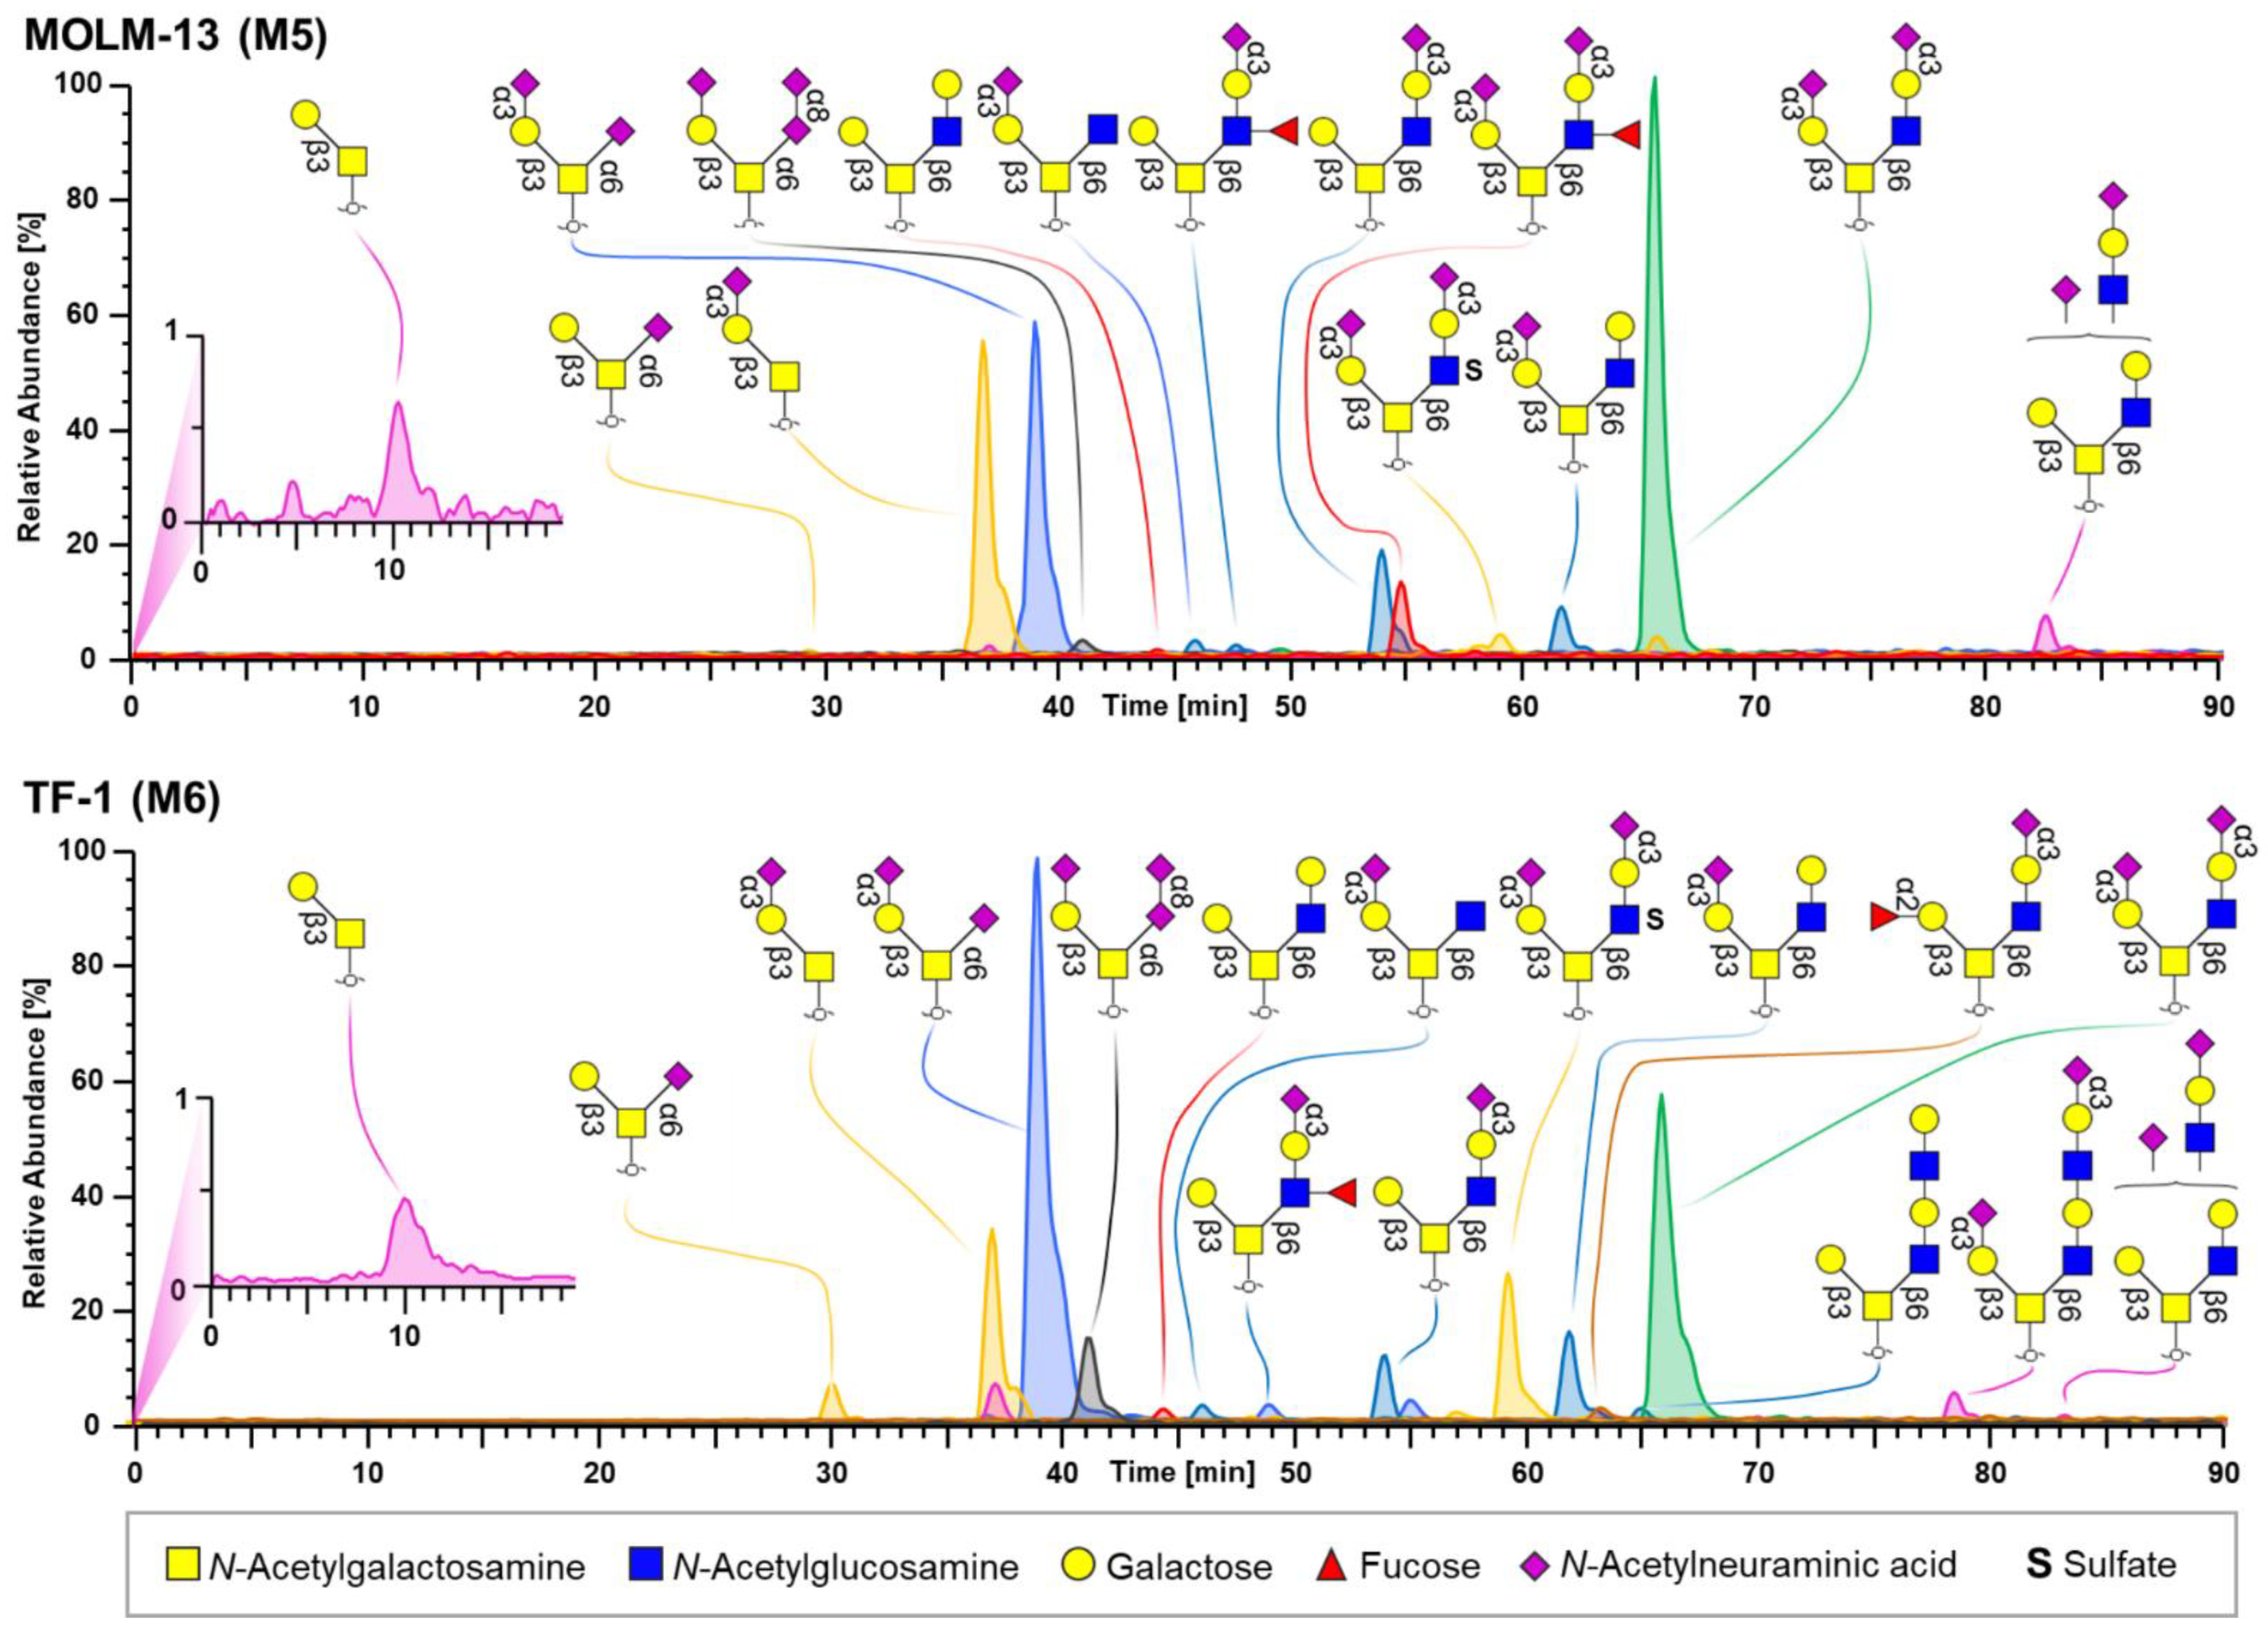
3.2. O-Glycomics
3.3. Integrated N- and O-Glycomics
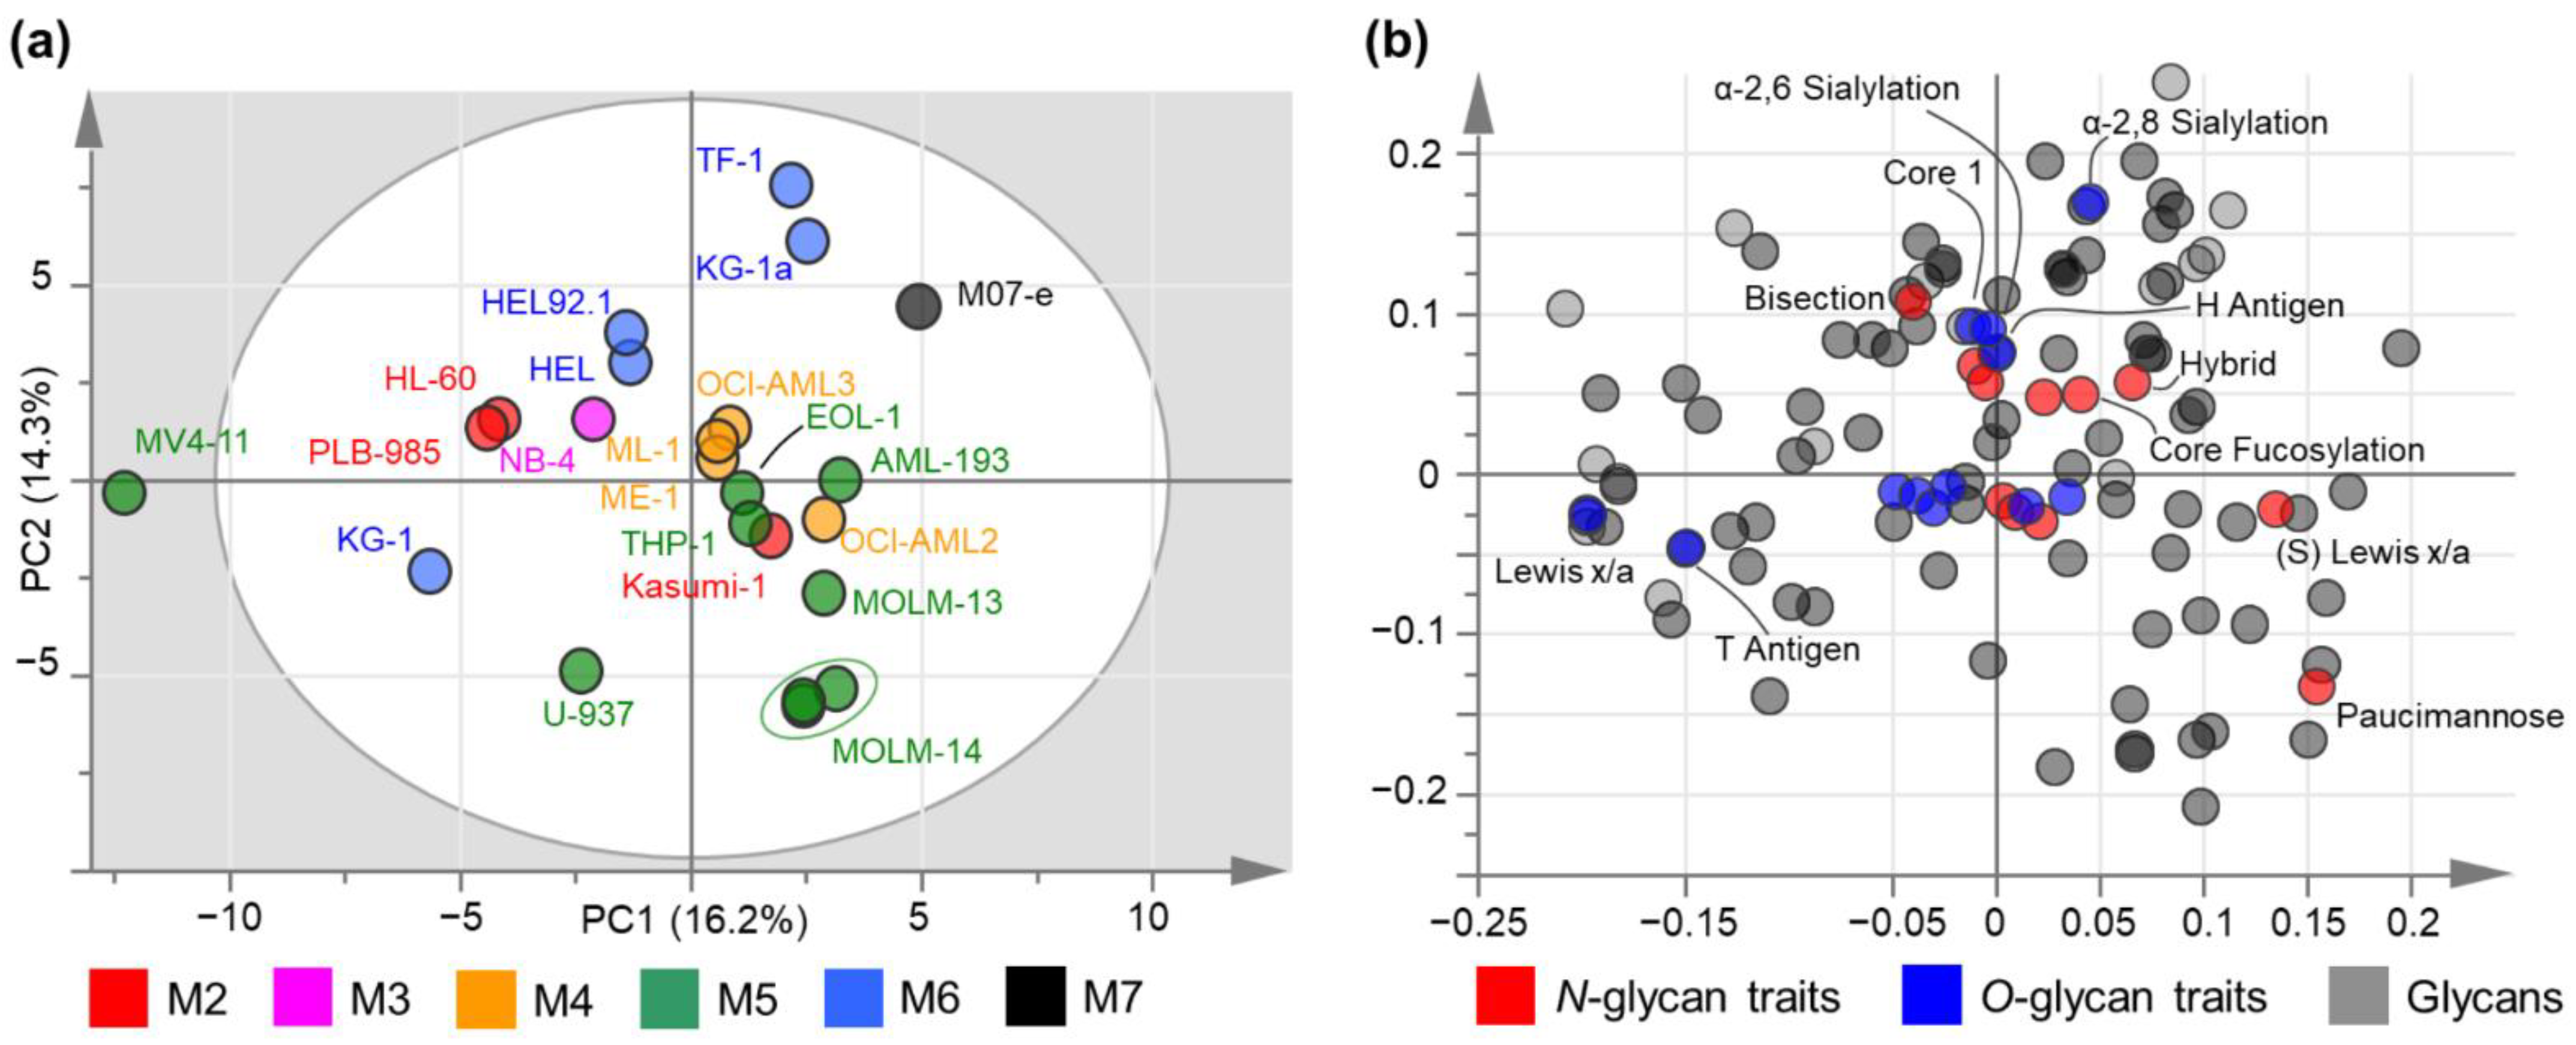
3.3.1. Principal Component Analysis
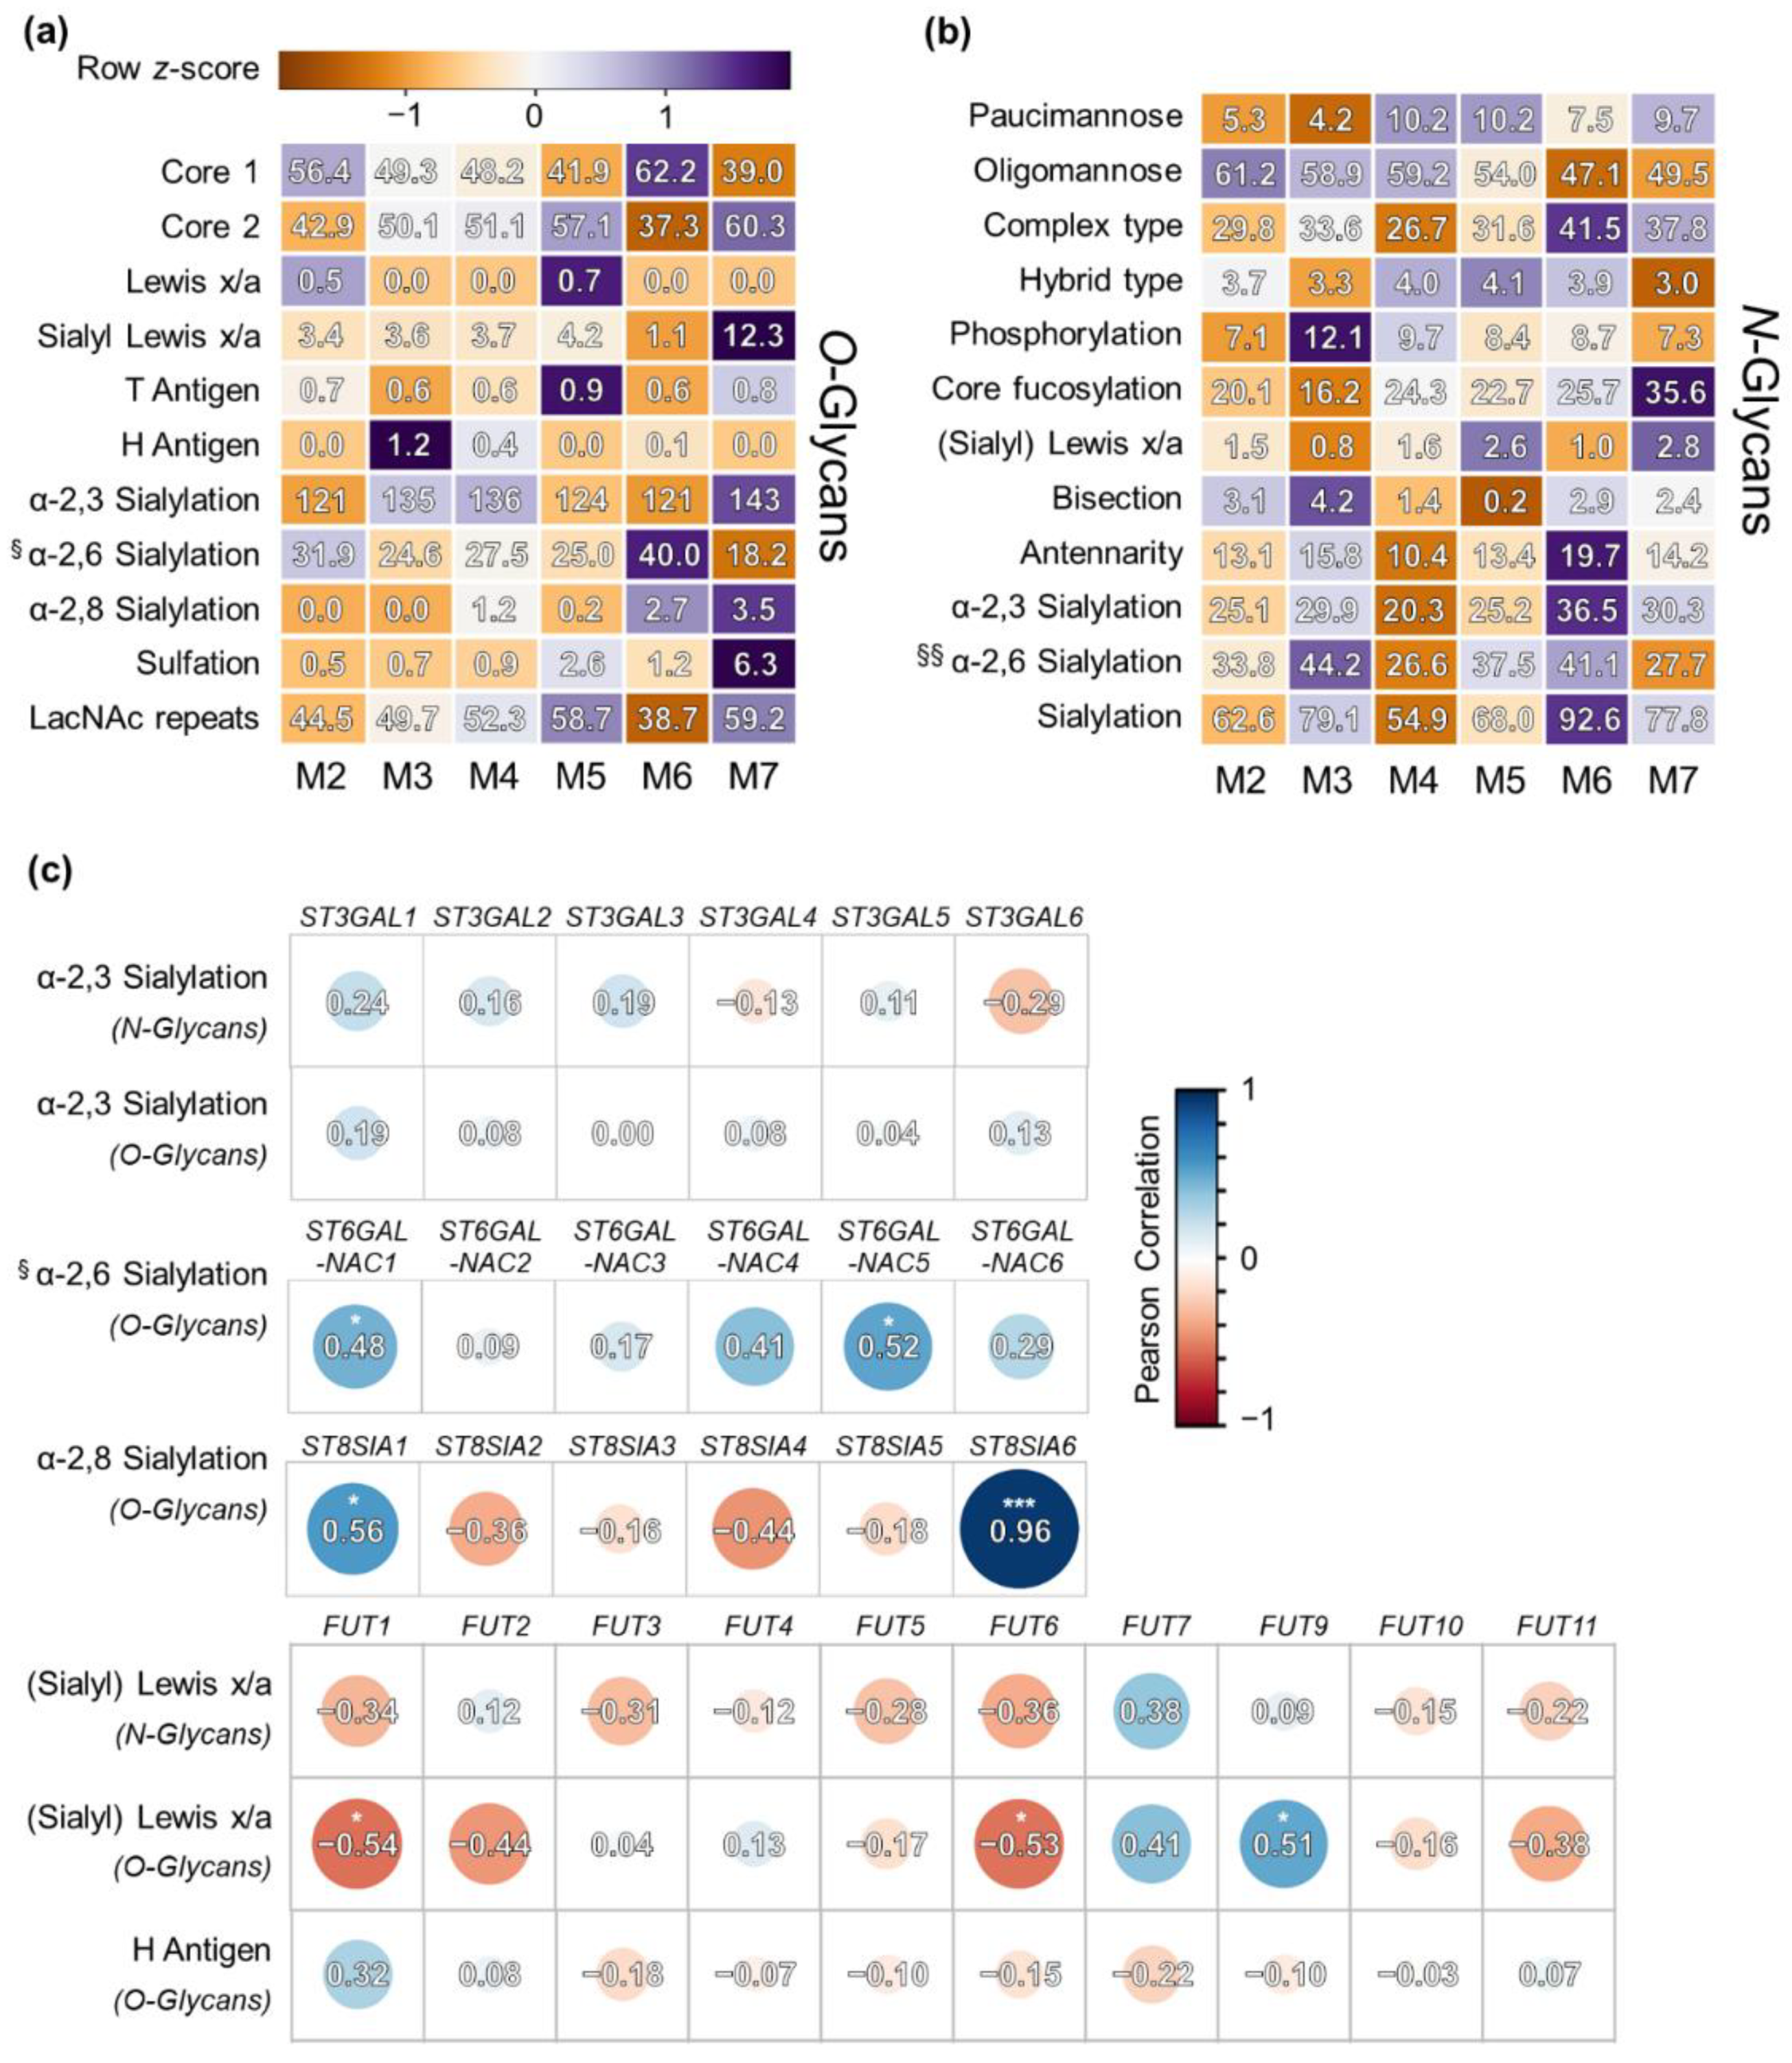
3.3.2. FAB-Grouped Glycan Features
3.3.3. Correlation of Glycan Features with GST Expression
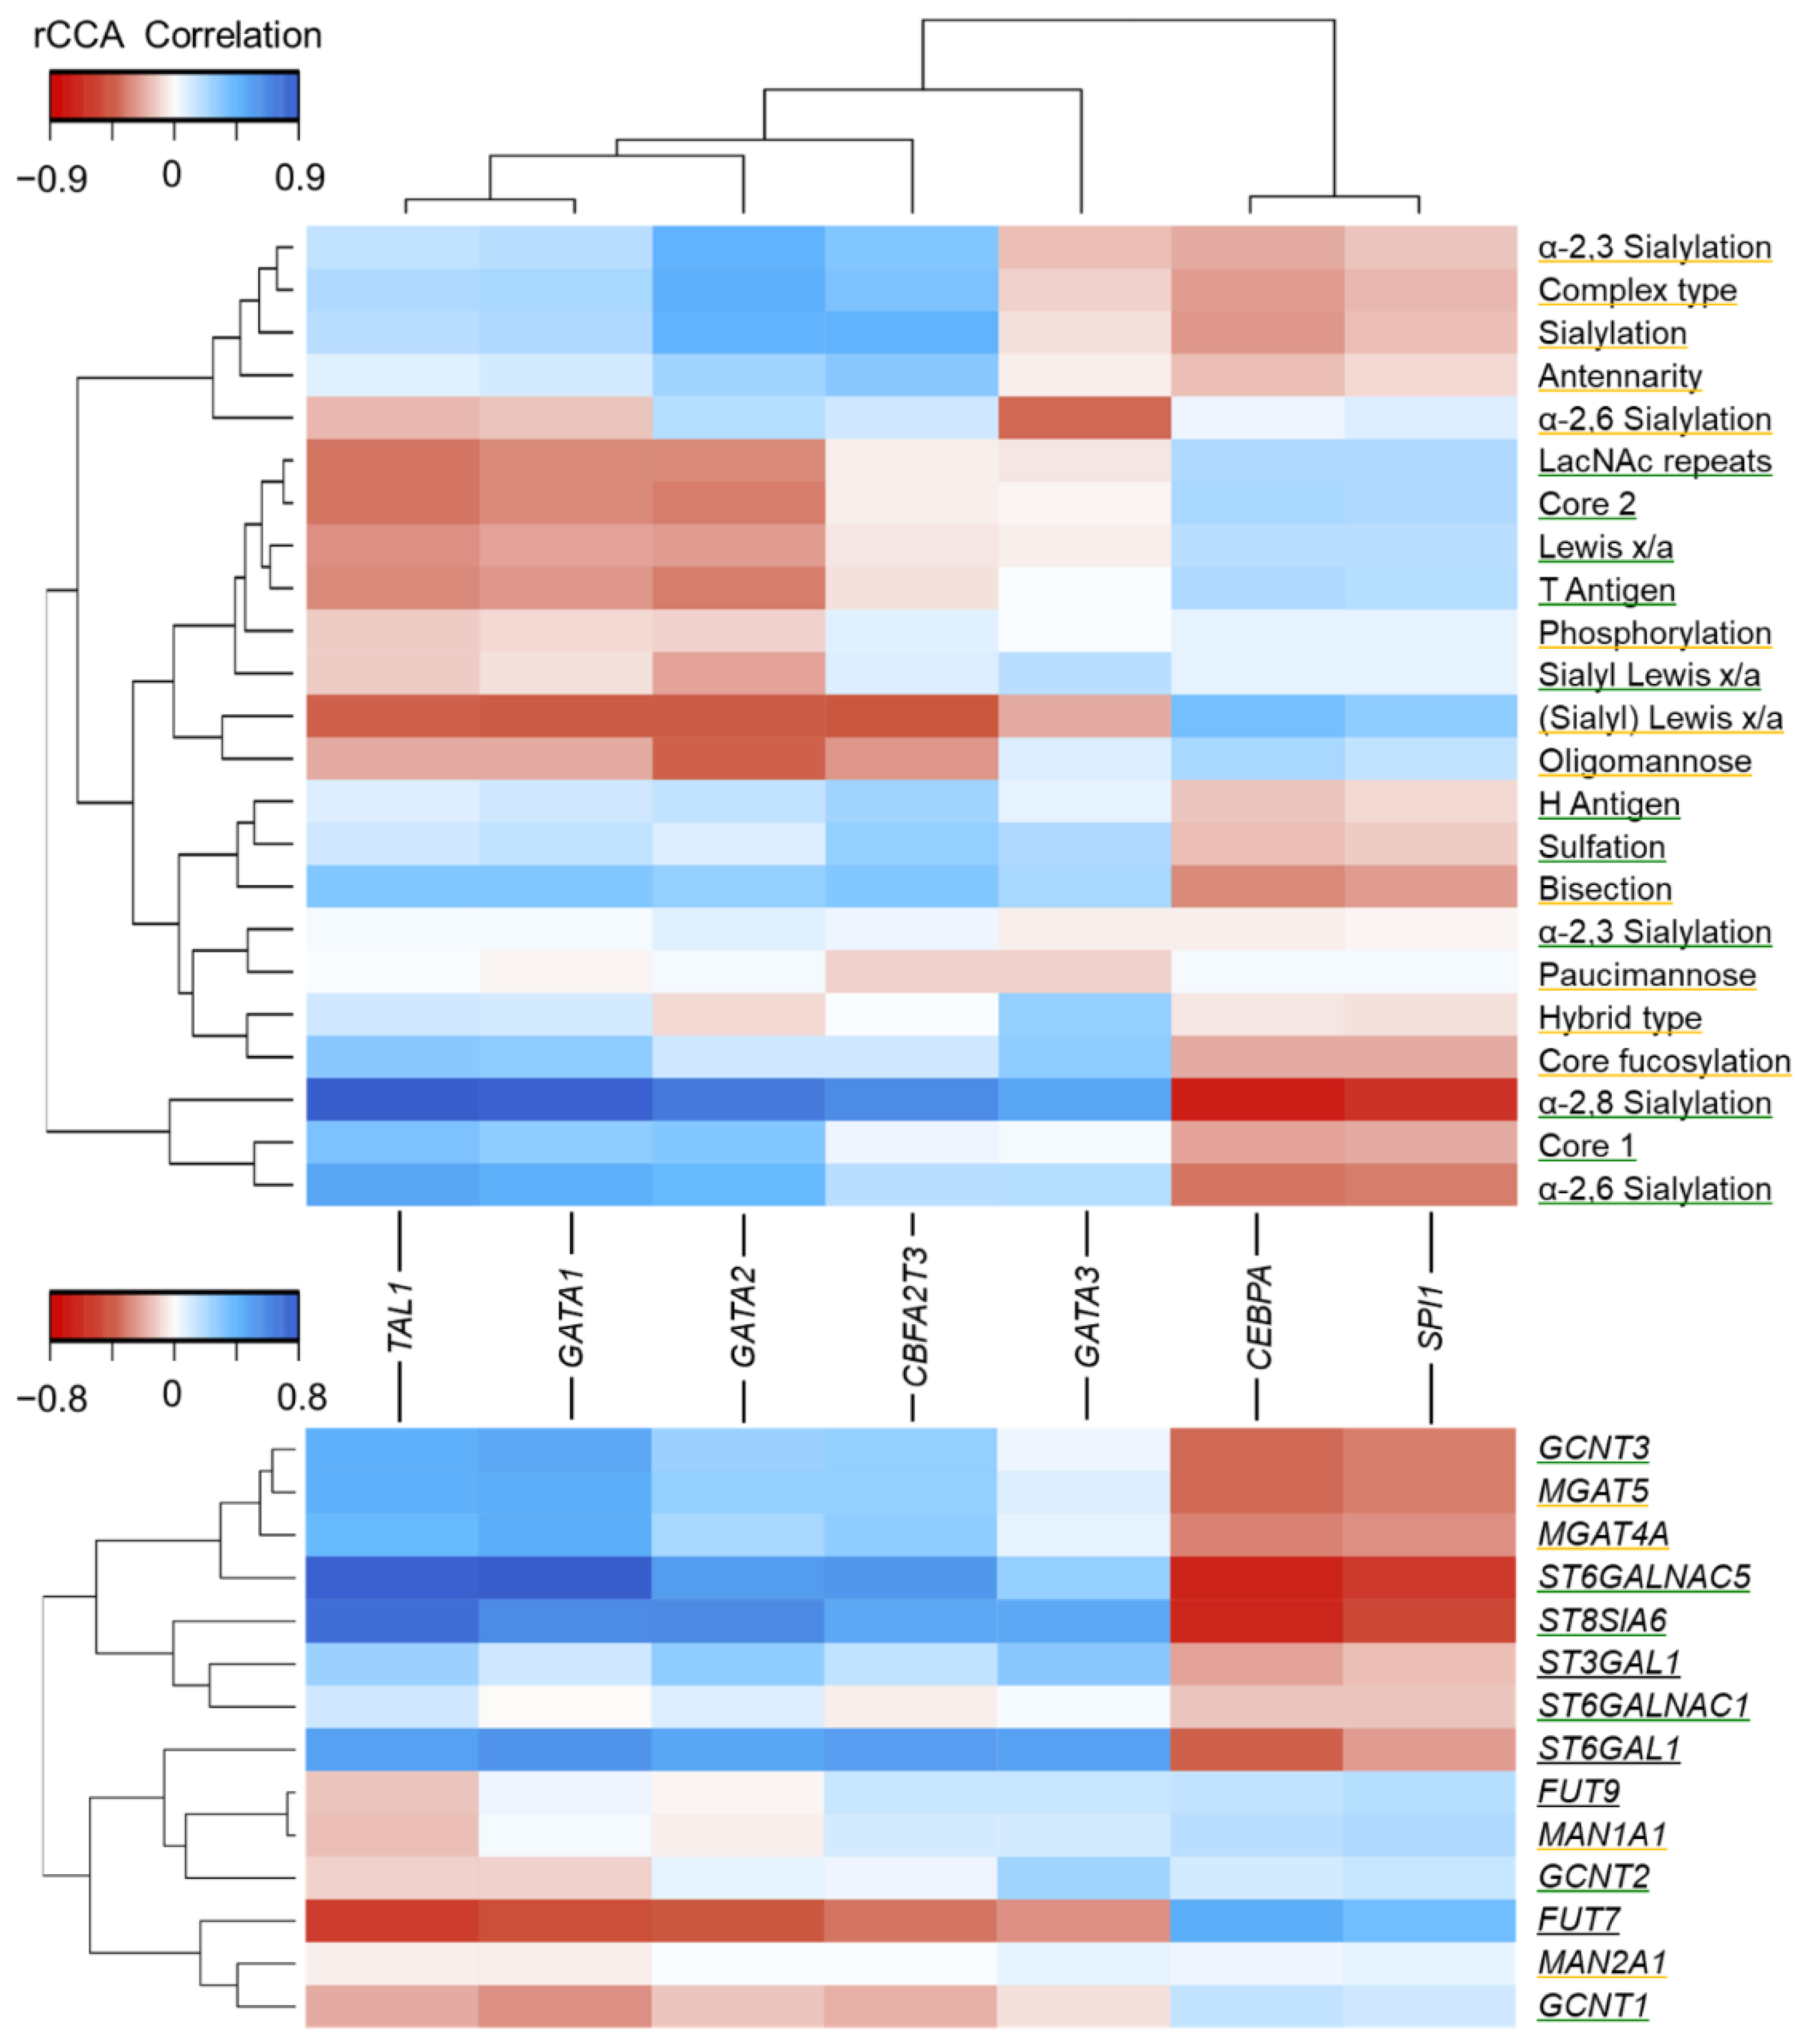
3.4. Association of Glycan Features with Hematopoietic TFs
4. Discussion
5. Conclusions
Supplementary Materials
Author Contributions
Funding
Institutional Review Board Statement
Informed Consent Statement
Data Availability Statement
Acknowledgments
Conflicts of Interest
References
- Saultz, J.N.; Garzon, R. Acute Myeloid Leukemia: A Concise Review. J. Clin. Med. 2016, 5, 33. [Google Scholar] [CrossRef] [Green Version]
- De Kouchkovsky, I.; Abdul-Hay, M. Acute myeloid leukemia: A comprehensive review and 2016 update. Blood Cancer J. 2016, 6, e441. [Google Scholar] [CrossRef]
- Howlader, N.N.A.; Krapcho, M.; Miller, D.; Brest, A.; Yu, M.; Ruhl, J.; Tatalovich, Z.; Mariotto, A.; Lewis, D.R.; Chen, H.S.; et al. SEER Cancer Statistics Review, 1975–2018; National Cancer Institute: Bethesda, MD, USA, 2021. [Google Scholar]
- Dohner, H.; Weisdorf, D.J.; Bloomfield, C.D. Acute Myeloid Leukemia. N. Engl. J. Med. 2015, 373, 1136–1152. [Google Scholar] [CrossRef] [PubMed] [Green Version]
- Bennett, J.M.; Catovsky, D.; Daniel, M.T.; Flandrin, G.; Galton, D.A.; Gralnick, H.R.; Sultan, C. Proposals for the classification of the acute leukaemias. French-American-British (FAB) co-operative group. Br. J. Haematol. 1976, 33, 451–458. [Google Scholar] [CrossRef]
- Harris, N.L.; Jaffe, E.S.; Diebold, J.; Flandrin, G.; Muller-Hermelink, H.K.; Vardiman, J.; Lister, T.A.; Bloomfield, C.D. World Health Organization classification of neoplastic diseases of the hematopoietic and lymphoid tissues: Report of the Clinical Advisory Committee meeting-Airlie House, Virginia, November 1997. J. Clin. Oncol. 1999, 17, 3835–3849. [Google Scholar] [CrossRef] [PubMed] [Green Version]
- Arber, D.A.; Orazi, A.; Hasserjian, R.; Thiele, J.; Borowitz, M.J.; Le Beau, M.M.; Bloomfield, C.D.; Cazzola, M.; Vardiman, J.W. The 2016 revision to the World Health Organization classification of myeloid neoplasms and acute leukemia. Blood 2016, 127, 2391–2405. [Google Scholar] [CrossRef] [PubMed]
- Dohner, H.; Estey, E.H.; Amadori, S.; Appelbaum, F.R.; Buchner, T.; Burnett, A.K.; Dombret, H.; Fenaux, P.; Grimwade, D.; Larson, R.A.; et al. Diagnosis and management of acute myeloid leukemia in adults: Recommendations from an international expert panel, on behalf of the European LeukemiaNet. Blood 2010, 115, 453–474. [Google Scholar] [CrossRef] [PubMed]
- DeWolf, S.; Tallman, M.S. How I treat relapsed or refractory AML. Blood 2020, 136, 1023–1032. [Google Scholar] [CrossRef] [PubMed]
- Tabe, Y.; Konopleva, M. Role of Microenvironment in Resistance to Therapy in AML. Curr. Hematol. Malig. Rep. 2015, 10, 96–103. [Google Scholar] [CrossRef]
- Shafat, M.S.; Gnaneswaran, B.; Bowles, K.M.; Rushworth, S.A. The bone marrow microenvironment-Home of the leukemic blasts. Blood Rev. 2017, 31, 277–286. [Google Scholar] [CrossRef] [Green Version]
- Isidori, A.; Salvestrini, V.; Ciciarello, M.; Loscocco, F.; Visani, G.; Parisi, S.; Lecciso, M.; Ocadlikova, D.; Rossi, L.; Gabucci, E.; et al. The role of the immunosuppressive microenvironment in acute myeloid leukemia development and treatment. Expert Rev. Hematol. 2014, 7, 807–818. [Google Scholar] [CrossRef] [PubMed]
- Ladikou, E.E.; Sivaloganathan, H.; Pepper, A.; Chevassut, T. Acute Myeloid Leukaemia in Its Niche: The Bone Marrow Microenvironment in Acute Myeloid Leukaemia. Curr. Oncol. Rep. 2020, 22, 27. [Google Scholar] [CrossRef] [Green Version]
- RodrIguez, E.; Schetters, S.T.T.; van Kooyk, Y. The tumour glyco-code as a novel immune checkpoint for immunotherapy. Nat. Rev. Immunol. 2018, 18, 204–211. [Google Scholar] [CrossRef] [PubMed]
- Pearce, O.M.; Laubli, H. Sialic acids in cancer biology and immunity. Glycobiology 2016, 26, 111–128. [Google Scholar] [CrossRef] [PubMed] [Green Version]
- Pang, X.; Li, H.; Guan, F.; Li, X. Multiple Roles of Glycans in Hematological Malignancies. Front. Oncol. 2018, 8, 364. [Google Scholar] [CrossRef] [PubMed]
- Winkler, I.G.; Barbier, V.; Nowlan, B.; Jacobsen, R.N.; Forristal, C.E.; Patton, J.T.; Magnani, J.L.; Levesque, J.P. Vascular niche E-selectin regulates hematopoietic stem cell dormancy, self renewal and chemoresistance. Nat. Med. 2012, 18, 1651–1657. [Google Scholar] [CrossRef]
- Erbani, J.; Tay, J.; Barbier, V.; Levesque, J.P.; Winkler, I.G. Acute Myeloid Leukemia Chemo-Resistance Is Mediated by E-selectin Receptor CD162 in Bone Marrow Niches. Front. Cell Dev. Biol. 2020, 8, 668. [Google Scholar] [CrossRef] [PubMed]
- Krause, D.S.; Lazarides, K.; Lewis, J.B.; von Andrian, U.H.; Van Etten, R.A. Selectins and their ligands are required for homing and engraftment of BCR-ABL1+ leukemic stem cells in the bone marrow niche. Blood 2014, 123, 1361–1371. [Google Scholar] [CrossRef] [Green Version]
- Barbier, V.; Erbani, J.; Fiveash, C.; Davies, J.M.; Tay, J.; Tallack, M.R.; Lowe, J.; Magnani, J.L.; Pattabiraman, D.R.; Perkins, A.C.; et al. Endothelial E-selectin inhibition improves acute myeloid leukaemia therapy by disrupting vascular niche-mediated chemoresistance. Nat. Commun. 2020, 11, 2042. [Google Scholar] [CrossRef]
- Muz, B.; Abdelghafer, A.; Markovic, M.; Yavner, J.; Melam, A.; Salama, N.N.; Azab, A.K. Targeting E-selectin to Tackle Cancer Using Uproleselan. Cancers 2021, 13, 335. [Google Scholar] [CrossRef]
- DeAngelo, D.J.; Erba, H.P.; Jonas, B.A.; O’Dwyer, M.; Marlton, P.; Huls, G.A.; Liesveld, J.; Cooper, B.W.; Bhatnagar, B.; Armstrong, M.; et al. A phase III trial to evaluate the efficacy of uproleselan (GMI-1271) with chemotherapy in patients with relapsed/refractory acute myeloid leukemia. J. Clin. Oncol. 2019, 37, TPS7066. [Google Scholar] [CrossRef]
- DeAngelo, D.J.; Jonas, B.A.; Liesveld, J.L.; Bixby, D.L.; Advani, A.S.; Marlton, P.; O’Dwyer, M.E.; Fogler, W.E.; Wolfgang, C.D.; Magnani, J.L.; et al. Uproleselan (GMI-1271), an E-Selectin Antagonist, Improves the Efficacy and Safety of Chemotherapy in Relapsed/Refractory (R/R) and Newly Diagnosed Older Patients with Acute Myeloid Leukemia: Final, Correlative, and Subgroup Analyses. Blood 2018, 132, 331. [Google Scholar] [CrossRef]
- Marjon, K.D.; Termini, C.M.; Karlen, K.L.; Saito-Reis, C.; Soria, C.E.; Lidke, K.A.; Gillette, J.M. Tetraspanin CD82 regulates bone marrow homing of acute myeloid leukemia by modulating the molecular organization of N-cadherin. Oncogene 2016, 35, 4132–4140. [Google Scholar] [CrossRef] [PubMed] [Green Version]
- Wang, H.; Zhang, W.; Zhao, J.; Zhang, L.; Liu, M.; Yan, G.; Yao, J.; Yu, H.; Yang, P. N-Glycosylation pattern of recombinant human CD82 (KAI1), a tumor-associated membrane protein. J. Proteom. 2012, 75, 1375–1385. [Google Scholar] [CrossRef] [PubMed]
- Floren, M.; Restrepo Cruz, S.; Termini, C.M.; Marjon, K.D.; Lidke, K.A.; Gillette, J.M. Tetraspanin CD82 drives acute myeloid leukemia chemoresistance by modulating protein kinase C alpha and beta1 integrin activation. Oncogene 2020, 39, 3910–3925. [Google Scholar] [CrossRef] [PubMed]
- Ma, H.; Zhou, H.; Song, X.; Shi, S.; Zhang, J.; Jia, L. Modification of sialylation is associated with multidrug resistance in human acute myeloid leukemia. Oncogene 2015, 34, 726–740. [Google Scholar] [CrossRef] [Green Version]
- Zhang, Z.; Zhao, Y.; Jiang, L.; Miao, X.; Zhou, H.; Jia, L. Glycomic alterations are associated with multidrug resistance in human leukemia. Int. J. Biochem. Cell Biol. 2012, 44, 1244–1253. [Google Scholar] [CrossRef] [PubMed]
- Sritharan, S.; Sivalingam, N. A comprehensive review on time-tested anticancer drug doxorubicin. Life Sci. 2021, 278, 119527. [Google Scholar] [CrossRef]
- Hu, X.; Chen, F. Targeting on glycosylation of mutant FLT3 in acute myeloid leukemia. Hematology 2019, 24, 651–660. [Google Scholar] [CrossRef] [PubMed] [Green Version]
- Larrue, C.; Saland, E.; Vergez, F.; Serhan, N.; Delabesse, E.; Mansat-De Mas, V.; Hospital, M.A.; Tamburini, J.; Manenti, S.; Sarry, J.E.; et al. Antileukemic Activity of 2-Deoxy-d-Glucose through Inhibition of N-Linked Glycosylation in Acute Myeloid Leukemia with FLT3-ITD or c-KIT Mutations. Mol. Cancer Ther. 2015, 14, 2364–2373. [Google Scholar] [CrossRef] [Green Version]
- Williams, A.B.; Li, L.; Nguyen, B.; Brown, P.; Levis, M.; Small, D. Fluvastatin inhibits FLT3 glycosylation in human and murine cells and prolongs survival of mice with FLT3/ITD leukemia. Blood 2012, 120, 3069–3079. [Google Scholar] [CrossRef] [Green Version]
- Tsitsipatis, D.; Jayavelu, A.K.; Muller, J.P.; Bauer, R.; Schmidt-Arras, D.; Mahboobi, S.; Schnoder, T.M.; Heidel, F.; Bohmer, F.D. Synergistic killing of FLT3ITD-positive AML cells by combined inhibition of tyrosine-kinase activity and N-glycosylation. Oncotarget 2017, 8, 26613–26624. [Google Scholar] [CrossRef] [PubMed]
- Zhang, T.; Madunic, K.; Holst, S.; Zhang, J.; Jin, C.; Ten Dijke, P.; Karlsson, N.G.; Stavenhagen, K.; Wuhrer, M. Development of a 96-well plate sample preparation method for integrated N- and O-glycomics using porous graphitized carbon liquid chromatography-mass spectrometry. Mol. Omics 2020, 16, 355–363. [Google Scholar] [CrossRef] [Green Version]
- Varki, A.; Cummings, R.D.; Esko, J.D.; Stanley, P.; Hart, G.W.; Aebi, M.; Darvill, A.G.; Kinoshita, T.; Packer, N.H.; Prestegard, J.H.; et al. Essentials of Glycobiology. In Essentials of Glycobiology; Cold Spring Harbor: New York, NY, USA, 2015. [Google Scholar]
- Ceroni, A.; Maass, K.; Geyer, H.; Geyer, R.; Dell, A.; Haslam, S.M. GlycoWorkbench: A tool for the computer-assisted annotation of mass spectra of glycans. J. Proteome Res. 2008, 7, 1650–1659. [Google Scholar] [CrossRef] [PubMed] [Green Version]
- Harvey, D.J. Negative ion mass spectrometry for the analysis of N-linked glycans. Mass Spectrom. Rev. 2020, 39, 586–679. [Google Scholar] [CrossRef] [PubMed]
- Everest-Dass, A.V.; Abrahams, J.L.; Kolarich, D.; Packer, N.H.; Campbell, M.P. Structural feature ions for distinguishing N- and O-linked glycan isomers by LC-ESI-IT MS/MS. J. Am. Soc. Mass Spectrom. 2013, 24, 895–906. [Google Scholar] [CrossRef] [PubMed]
- Hayes, C.A.; Karlsson, N.G.; Struwe, W.B.; Lisacek, F.; Rudd, P.M.; Packer, N.H.; Campbell, M.P. UniCarb-DB: A database resource for glycomic discovery. Bioinformatics 2011, 27, 1343–1344. [Google Scholar] [CrossRef] [PubMed] [Green Version]
- Adams, K.J.; Pratt, B.; Bose, N.; Dubois, L.G.; St John-Williams, L.; Perrott, K.M.; Ky, K.; Kapahi, P.; Sharma, V.; MacCoss, M.J.; et al. Skyline for Small Molecules: A Unifying Software Package for Quantitative Metabolomics. J. Proteome Res. 2020, 19, 1447–1458. [Google Scholar] [CrossRef] [PubMed]
- Rohart, F.; Gautier, B.; Singh, A.; Le Cao, K.A. mixOmics: An R package for ’omics feature selection and multiple data integration. PLoS Comput. Biol. 2017, 13, e1005752. [Google Scholar] [CrossRef] [PubMed] [Green Version]
- Tsherniak, A.; Vazquez, F.; Montgomery, P.G.; Weir, B.A.; Kryukov, G.; Cowley, G.S.; Gill, S.; Harrington, W.F.; Pantel, S.; Krill-Burger, J.M.; et al. Defining a Cancer Dependency Map. Cell 2017, 170, 564–576.e516. [Google Scholar] [CrossRef] [Green Version]
- Abrahams, J.L.; Campbell, M.P.; Packer, N.H. Building a PGC-LC-MS N-glycan retention library and elution mapping resource. Glycoconj. J. 2018, 35, 15–29. [Google Scholar] [CrossRef]
- Palmisano, G.; Larsen, M.R.; Packer, N.H.; Thaysen-Andersen, M. Structural analysis of glycoprotein sialylation–part II: LC-MS based detection. Rsc Adv. 2013, 3, 22706–22726. [Google Scholar] [CrossRef] [Green Version]
- Drexler, H.G. The Leukemia-Lymphoma Cell Line Factsbook; Academic Press: Cambridge, MA, USA, 2000. [Google Scholar]
- Quentmeier, H.; Reinhardt, J.; Zaborski, M.; Drexler, H.G. FLT3 mutations in acute myeloid leukemia cell lines. Leukemia 2003, 17, 120–124. [Google Scholar] [CrossRef] [Green Version]
- Rosenbauer, F.; Koschmieder, S.; Steidl, U.; Tenen, D.G. Effect of transcription-factor concentrations on leukemic stem cells. Blood 2005, 106, 1519–1524. [Google Scholar] [CrossRef] [PubMed] [Green Version]
- Sportoletti, P.; Celani, L.; Varasano, E.; Rossi, R.; Sorcini, D.; Rompietti, C.; Strozzini, F.; Del Papa, B.; Guarente, V.; Spinozzi, G.; et al. GATA1 epigenetic deregulation contributes to the development of AML with NPM1 and FLT3-ITD cooperating mutations. Leukemia 2019, 33, 1827–1832. [Google Scholar] [CrossRef] [Green Version]
- Menendez-Gonzalez, J.B.; Vukovic, M.; Abdelfattah, A.; Saleh, L.; Almotiri, A.; Thomas, L.A.; Agirre-Lizaso, A.; Azevedo, A.; Menezes, A.C.; Tornillo, G.; et al. Gata2 as a Crucial Regulator of Stem Cells in Adult Hematopoiesis and Acute Myeloid Leukemia. Stem. Cell Rep. 2019, 13, 291–306. [Google Scholar] [CrossRef] [PubMed] [Green Version]
- Steinauer, N.; Guo, C.; Huang, C.; Wong, M.; Tu, Y.; Freter, C.E.; Zhang, J. Myeloid translocation gene CBFA2T3 directs a relapse gene program and determines patient-specific outcomes in AML. Blood Adv. 2019, 3, 1379–1393. [Google Scholar] [CrossRef] [PubMed]
- Holst, S.; Deuss, A.J.; van Pelt, G.W.; van Vliet, S.J.; Garcia-Vallejo, J.J.; Koeleman, C.A.; Deelder, A.M.; Mesker, W.E.; Tollenaar, R.A.; Rombouts, Y.; et al. N-glycosylation Profiling of Colorectal Cancer Cell Lines Reveals Association of Fucosylation with Differentiation and Caudal Type Homebox 1 (CDX1)/Villin mRNA Expression. Mol. Cell Proteom. 2016, 15, 124–140. [Google Scholar] [CrossRef] [PubMed] [Green Version]
- Holst, S.; Belo, A.I.; Giovannetti, E.; van Die, I.; Wuhrer, M. Profiling of different pancreatic cancer cells used as models for metastatic behaviour shows large variation in their N-glycosylation. Sci. Rep. 2017, 7, 16623. [Google Scholar] [CrossRef] [PubMed] [Green Version]
- Hua, S.; Saunders, M.; Dimapasoc, L.M.; Jeong, S.H.; Kim, B.J.; Kim, S.; So, M.; Lee, K.S.; Kim, J.H.; Lam, K.S.; et al. Differentiation of cancer cell origin and molecular subtype by plasma membrane N-glycan profiling. J. Proteome Res. 2014, 13, 961–968. [Google Scholar] [CrossRef] [Green Version]
- Chatterjee, S.; Lee, L.Y.; Kawahara, R.; Abrahams, J.L.; Adamczyk, B.; Anugraham, M.; Ashwood, C.; Sumer-Bayraktar, Z.; Briggs, M.T.; Chik, J.H.L.; et al. Protein Paucimannosylation Is an Enriched N-Glycosylation Signature of Human Cancers. Proteomics 2019, 19, e1900010. [Google Scholar] [CrossRef] [PubMed]
- Hare, N.J.; Lee, L.Y.; Loke, I.; Britton, W.J.; Saunders, B.M.; Thaysen-Andersen, M. Mycobacterium tuberculosis Infection Manipulates the Glycosylation Machinery and the N-Glycoproteome of Human Macrophages and Their Microparticles. J. Proteome Res. 2017, 16, 247–263. [Google Scholar] [CrossRef] [PubMed]
- Crotts, S.B.; Friedman, D.J.; Wang, Z.; Shapiro, M.J.; Rajcula, M.; McCue, S.; Sun, J.; Shapiro, V.S. Regulation of the immune response by ST8Sia6. J. Immunol. 2020, 204, 228.18. [Google Scholar]
- Ruhaak, L.R.; Miyamoto, S.; Lebrilla, C.B. Developments in the identification of glycan biomarkers for the detection of cancer. Mol. Cell Proteom. 2013, 12, 846–855. [Google Scholar] [CrossRef] [PubMed] [Green Version]
- Zhang, W.; Yang, Z.; Gao, X.; Wu, Q. Advances in the discovery of novel biomarkers for cancer: Spotlight on protein N-glycosylation. Biomark. Med. 2020, 14, 1031–1045. [Google Scholar] [CrossRef]
- Thomas, D.; Rathinavel, A.K.; Radhakrishnan, P. Altered glycosylation in cancer: A promising target for biomarkers and therapeutics. Biochim. Biophys. Acta Rev. Cancer 2021, 1875, 188464. [Google Scholar] [CrossRef] [PubMed]
- Canaani, J.; Beohou, E.; Labopin, M.; Socie, G.; Huynh, A.; Volin, L.; Cornelissen, J.; Milpied, N.; Gedde-Dahl, T.; Deconinck, E.; et al. Impact of FAB classification on predicting outcome in acute myeloid leukemia, not otherwise specified, patients undergoing allogeneic stem cell transplantation in CR1: An analysis of 1690 patients from the acute leukemia working party of EBMT. Am. J. Hematol. 2017, 92, 344–350. [Google Scholar] [CrossRef] [PubMed] [Green Version]
- Vajaria, B.N.; Patel, P.S. Glycosylation: A hallmark of cancer? Glycoconj. J. 2017, 34, 147–156. [Google Scholar] [CrossRef]
- Delannoy, C.P.; Rombouts, Y.; Groux-Degroote, S.; Holst, S.; Coddeville, B.; Harduin-Lepers, A.; Wuhrer, M.; Elass-Rochard, E.; Guerardel, Y. Glycosylation Changes Triggered by the Differentiation of Monocytic THP-1 Cell Line into Macrophages. J. Proteome Res. 2017, 16, 156–169. [Google Scholar] [CrossRef] [PubMed]
- Leonti, A.R.; Pardo, L.; Alonzo, T.A.; Gerbing, R.B.; Eidenschink Brodersen, L.; Ries, R.E.; Smith, J.L.; Le, Q.; Aplenc, R.; Kolb, E.A.; et al. Transcriptome Profiling of Glycosylation Genes Defines Correlation with E-Selectin Ligand Expression and Clinical Outcome in AML. Blood 2019, 134, 3772. [Google Scholar] [CrossRef]
- Zhang, P.; Iwasaki-Arai, J.; Iwasaki, H.; Fenyus, M.L.; Dayaram, T.; Owens, B.M.; Shigematsu, H.; Levantini, E.; Huettner, C.S.; Lekstrom-Himes, J.A.; et al. Enhancement of hematopoietic stem cell repopulating capacity and self-renewal in the absence of the transcription factor C/EBP alpha. Immunity 2004, 21, 853–863. [Google Scholar] [CrossRef] [PubMed] [Green Version]
- Greville, G.; Llop, E.; Huang, C.; Creagh-Flynn, J.; Pfister, S.; O’Flaherty, R.; Madden, S.F.; Peracaula, R.; Rudd, P.M.; McCann, A.; et al. Hypoxia Alters Epigenetic and N-Glycosylation Profiles of Ovarian and Breast Cancer Cell Lines in-vitro. Front. Oncol. 2020, 10, 1218. [Google Scholar] [CrossRef] [PubMed]
- Greville, G.; Llop, E.; Howard, J.; Madden, S.F.; Perry, A.S.; Peracaula, R.; Rudd, P.M.; McCann, A.; Saldova, R. 5-AZA-dC induces epigenetic changes associated with modified glycosylation of secreted glycoproteins and increased EMT and migration in chemo-sensitive cancer cells. Clin. Epigenetics 2021, 13, 34. [Google Scholar] [CrossRef] [PubMed]
- Sandberg, R.; Ernberg, I. Assessment of tumor characteristic gene expression in cell lines using a tissue similarity index (TSI). Proc. Natl. Acad. Sci. USA 2005, 102, 2052–2057. [Google Scholar] [CrossRef] [PubMed] [Green Version]
- Thaysen-Andersen, M.; Kolarich, D.; Packer, N.H. Glycomics & Glycoproteomics: From Analytics to Function. Mol. Omics 2021, 17, 8–10. [Google Scholar] [CrossRef] [PubMed]
- Watanabe, Y.; Aoki-Kinoshita, K.F.; Ishihama, Y.; Okuda, S. GlycoPOST realizes FAIR principles for glycomics mass spectrometry data. Nucleic Acids Res. 2021, 49, D1523–D1528. [Google Scholar] [CrossRef] [PubMed]


Publisher’s Note: MDPI stays neutral with regard to jurisdictional claims in published maps and institutional affiliations. |
© 2021 by the authors. Licensee MDPI, Basel, Switzerland. This article is an open access article distributed under the terms and conditions of the Creative Commons Attribution (CC BY) license (https://creativecommons.org/licenses/by/4.0/).
Share and Cite
Blöchl, C.; Wang, D.; Madunić, K.; Lageveen-Kammeijer, G.S.M.; Huber, C.G.; Wuhrer, M.; Zhang, T. Integrated N- and O-Glycomics of Acute Myeloid Leukemia (AML) Cell Lines. Cells 2021, 10, 3058. https://doi.org/10.3390/cells10113058
Blöchl C, Wang D, Madunić K, Lageveen-Kammeijer GSM, Huber CG, Wuhrer M, Zhang T. Integrated N- and O-Glycomics of Acute Myeloid Leukemia (AML) Cell Lines. Cells. 2021; 10(11):3058. https://doi.org/10.3390/cells10113058
Chicago/Turabian StyleBlöchl, Constantin, Di Wang, Katarina Madunić, Guinevere S. M. Lageveen-Kammeijer, Christian G. Huber, Manfred Wuhrer, and Tao Zhang. 2021. "Integrated N- and O-Glycomics of Acute Myeloid Leukemia (AML) Cell Lines" Cells 10, no. 11: 3058. https://doi.org/10.3390/cells10113058