Article

Stocking Methods and Soil Macronutrient Distributions in Southern Tallgrass Paddocks: Are There Linkages?

United States Department of Agriculture-Agricultural Research Service, El Reno, OK 73036, USA
*
Author to whom correspondence should be addressed.
Agronomy 2019, 9(6), 281; https://doi.org/10.3390/agronomy9060281
Submission received: 22 March 2019 / Revised: 26 April 2019 / Accepted: 16 May 2019 / Published: 31 May 2019
(This article belongs to the Special Issue Grassland Management for Sustainable Agroecosystems)

Abstract

:
Broad ranges of factors (parent materials, climate, plant community, landscape position, management) can influence macronutrient availability in rangeland soils. Two important factors in production-scale paddocks are the influences of location in space and land management. This study examined plant-available macronutrients (total mineral and nitrate-N, P, S, K, Ca, and Mg) in soils, with paired sets of probes (anion and cation exchange membranes) that simulate uptake by plant roots. Data were collected from sets of paddocks of southern tallgrass prairie in central Oklahoma, managed by four stocking methods during the 2015 growing season (mid-March, growth initiation by native grasses, and early-August, time of peak living plant biomass). Macronutrient availability in the 0–7.5 cm and 7.5–15 cm depths were determined at locations in close proximity to water (water tanks and 25% of the distance between tanks and paddock mid-points (PMP)), and distances near the mid-points of paddocks (70% of the distance between water and mid-points (0.7 PMP), and PMP). All of the tested stocking methods affected levels of availability of macronutrients at different times of the growing season, and among different locations within paddocks. Such responses indicated stocking methods may not result in uniform distributions of flux in plant-available macronutrients. The overall exposure of landscapes and arrangement of features within paddocks also appeared to influence macronutrient distributions.

1. Introduction

A diverse range of factors influence the availability of macronutrients in soils of native grasslands, often with a large degree of interaction among factors. The availability of macronutrients, and the forms of macronutrients, within soils of native grasslands generally reflects the nature of parent materials from which the soils evolved, and is further affected by plant communities, climate, position within landscapes, and management [1,2,3]. These factors result in variable spatial and temporal distribution patterns for plant-available macronutrients in soils of ecosystems dominated by perennial grasses [1,3]. Hence, the importance of macronutrients to landscape organization and biological function of grasslands [4,5,6].
Cattle can affect the distribution of plant-available macronutrients in grassland ecosystems by grazing plant biomass and; removing macronutrients from paddocks in weight gain (via consumption, rumination and conversion of macronutrients to animal mass), and by redistributing unincorporated macronutrients in excreta within paddocks in heterogeneous patterns [3,7,8,9]. The behavior of cattle and their preferential use of different zones of the landscape within paddocks are factors that can drive redistribution of macronutrients within paddocks [1,10,11]. The redistribution of macronutrients through excreta can be non-uniform, resulting in high concentrations of more labile forms in localized areas of paddocks [12,13]. There have been reported increases in amounts of labile forms of N, P, K, and S in areas near watering facilities, corners, and other structures within paddocks of grazed rangeland and perennial grasslands [9,14,15].
Some systems of stocking are thought to be capable of altering how cattle redistribute more labile forms of macronutrients, primarily N, P, K, and S within grazed landscapes [3,15,16]. This impact is of particular interest in cases where perennial grasslands are managed by different methods of rotational stocking, which may prevent high and disproportionate loadings in certain areas of paddocks [15]. However, the natural distribution of macronutrients, and physical properties, of soils in production-scale paddocks tend to be variable without overlaying the effects of applied grazing systems [1].
Given the naturally variable landscapes within production-scale paddocks, an important question is whether stocking methods can influence distributions of plant-available macronutrients within managed rangeland landscapes. The objective of this study was to apply a simple test for differences in levels of plant-available macronutrients in soils at two contrasting locations within paddocks (near water sources, near paddock centers) of southern tallgrass prairie managed under different methods of stocking. The working hypotheses were, that there would be no difference in the level of availability of eight macronutrients at these locations within paddocks, or differences in amounts at different times of growing seasons, in response to four stocking methods.

2. Materials and Methods

This study was conducted at the USDA-ARS Grazinglands Research Laboratory (35°33′29″ N, 98°1′50″ W; 435 m elevation) in central Oklahoma, USA. The entire site was located in a rolling upland landscape, with a range of features present. Included were local easterly and westerly-facing slopes (3 to 6%) on riser positions, and toe and tread slope positions (0 to 2% slopes), bordering the risers [17]. The long-term average (LTA; 1977 to 2012) precipitation [±1 standard deviation [SD) during calendar years was 941(±174) mm. The majority of precipitation received annually had a bimodal distribution with maxima in April through June (334 ± 58 mm), and September through October (175 ± 54 mm). Long-term monthly minimum and maximum temperatures (±1 s.d.) were recorded in January [2.8(± 2.7) °C; −4.0 to 8.6 °C] and July [28.1(± 1.5) °C; 25.6 to 32.4 °C].
The study was located within production-scale paddocks on 346 ha of native grassland defined as southern tallgrass prairie. The grasslands within the paddocks are remnants of the original southern tallgrass ecosystem that existed in central Oklahoma prior to settlement, and were never cultivated or replanted to native grasses following cultivation. The plant community was identified as a Loamy Prairie ecological site ([17], ecological site number 080AY056OK). Dominant grasses were the perennials big bluestem (Andropogon gerardii), little bluestem (Schizachyrium scoparium), and Indiangrass (Sorghastrum nutans). These three indigenous species generate 60% to 80% of the total above-ground biomass produced annually within the area that was included in the study [18]. The area was historically (1977 to 2009) used to support cow herds that were managed to generate calves of different breed-types and crosses for research projects on production systems applied to yearling stocker cattle [19,20]. Stocking methods that were applied during the historical period were changed regularly to meet management requirements for yearling cattle used in research projects. Included were periods of management under either, or both, continuous and rotational stocking applied to portions of the area during growing seasons (April to September) at low densities (2.0 to 3.0 ha cow/calf pair−1 growing season−1).
A range of soils exists within the area [17,21], based on position within the landscape. Norge series silt loams (fine-silty, mixed, active thermic Udic Paleustolls), situated on riser (mid-slope) positions of the landscape were the most common soil [17]. The Norge series has three sub-types based on the location along risers, and degree of slope. Renfrow or Kirkland silt loams (fine, mixed-superactive, thermic Udertic Paleustolls) on tread positions (summit locations) and Port silt loams (fine-silty, mixed-superactive, thermic Cumulic Haplustolls) at toe positions bounded the Norge series within the study site. Up to six related soils are present as inclusions within the boundaries of each of these soils [17]. The surface soils of these series have near-neutral but variable pH levels (6.7 ± 0.6), a water-holding capacity of 3 ± 1 mm cm−1 soil, and permeability rates of 33 ± 17 mm h−1 [17]. These soils evolved from parent material, defined as Permian-aged Dog Creek shale, comprised of reddish-brown shale with thin inter-beds of siltstone and sandstone [21].
Two replicate 61(± 2) ha paddocks, managed by continuous yearlong stocking, were included in the study as controls. Additional sets of sub-paddocks that were components of two replicate 80(± 2) ha paddocks (10 sub-paddocks each) of rotationally-stocked rangeland were also included. The design and organization of paddocks and sub-paddocks used in this study were variable in size, shape, and dimensions. Two sets of additional small paddocks (0.4 and 0.2 ha) were also established within the areas of the continuous paddocks, with one set each at toe and tread positions. These small units were used to mimic the application of high-density short-duration rotational stocking (HDRG), known as mob stocking [22], and their impacts on plant communities and soil properties.
Grazing pressure was achieved by herds of cow–calf pairs (~500 kg cows and up to 249 kg calves at weaning) as animal units (AU) that were assigned to replicate experimental units receiving continuous and rotational stocking. Daily forage allotments per AU were 14 kg d−1, or ~5.1 Mg AU−1 yr−1. Herd sizes in the continuous paddocks and sets of rotational-stocked sub-paddocks were 18(± 3.4) and 26(± 2.5) AU yr−1 respectively, during 2009–2015. The total grazing pressure applied to the continuous and rotational paddocks averaged roughly 108 and 119 animal unit days (AUD) ha−1 yr−1. The cow herds assigned to continuous-stocked paddocks were used to apply the high-density short-duration stocking treatments, which are also known as mob stocking. These paddocks were grazed once per year for 24-h, with the timing of grazing varied annually. Cattle from the two continuous-stocked paddocks were randomly applied to one of the HDRG treatments on each replicate for 24 h, returned to the continuous paddocks for 48 h, and then applied to the remaining HDRG treatment for 24 h. The mob-stocked paddocks served as examples of two levels of high-density rapid-rotation stocking [18(± 3.4 head) for 24 h on 0.8 ha (HDRG-1×) and 0.4 ha (HDRG-2×) units, which applied 23 and 45 AUD ha−1 yr−1 of grazing pressure] that have garnered producer interest in Oklahoma, USA, in recent years. Cow–calf pairs assigned to the rotational-stocked paddocks grazed sub-paddocks in 7 to 10-day grazing bouts, up to four times per year, with the number and timing of bouts varied annually. Therefore, the applied rotational and HDRG systems were representative of different adaptive forms of rotational stocking [22]. All paddocks in this study were managed under their assigned stocking methods from 2009 through 2015.
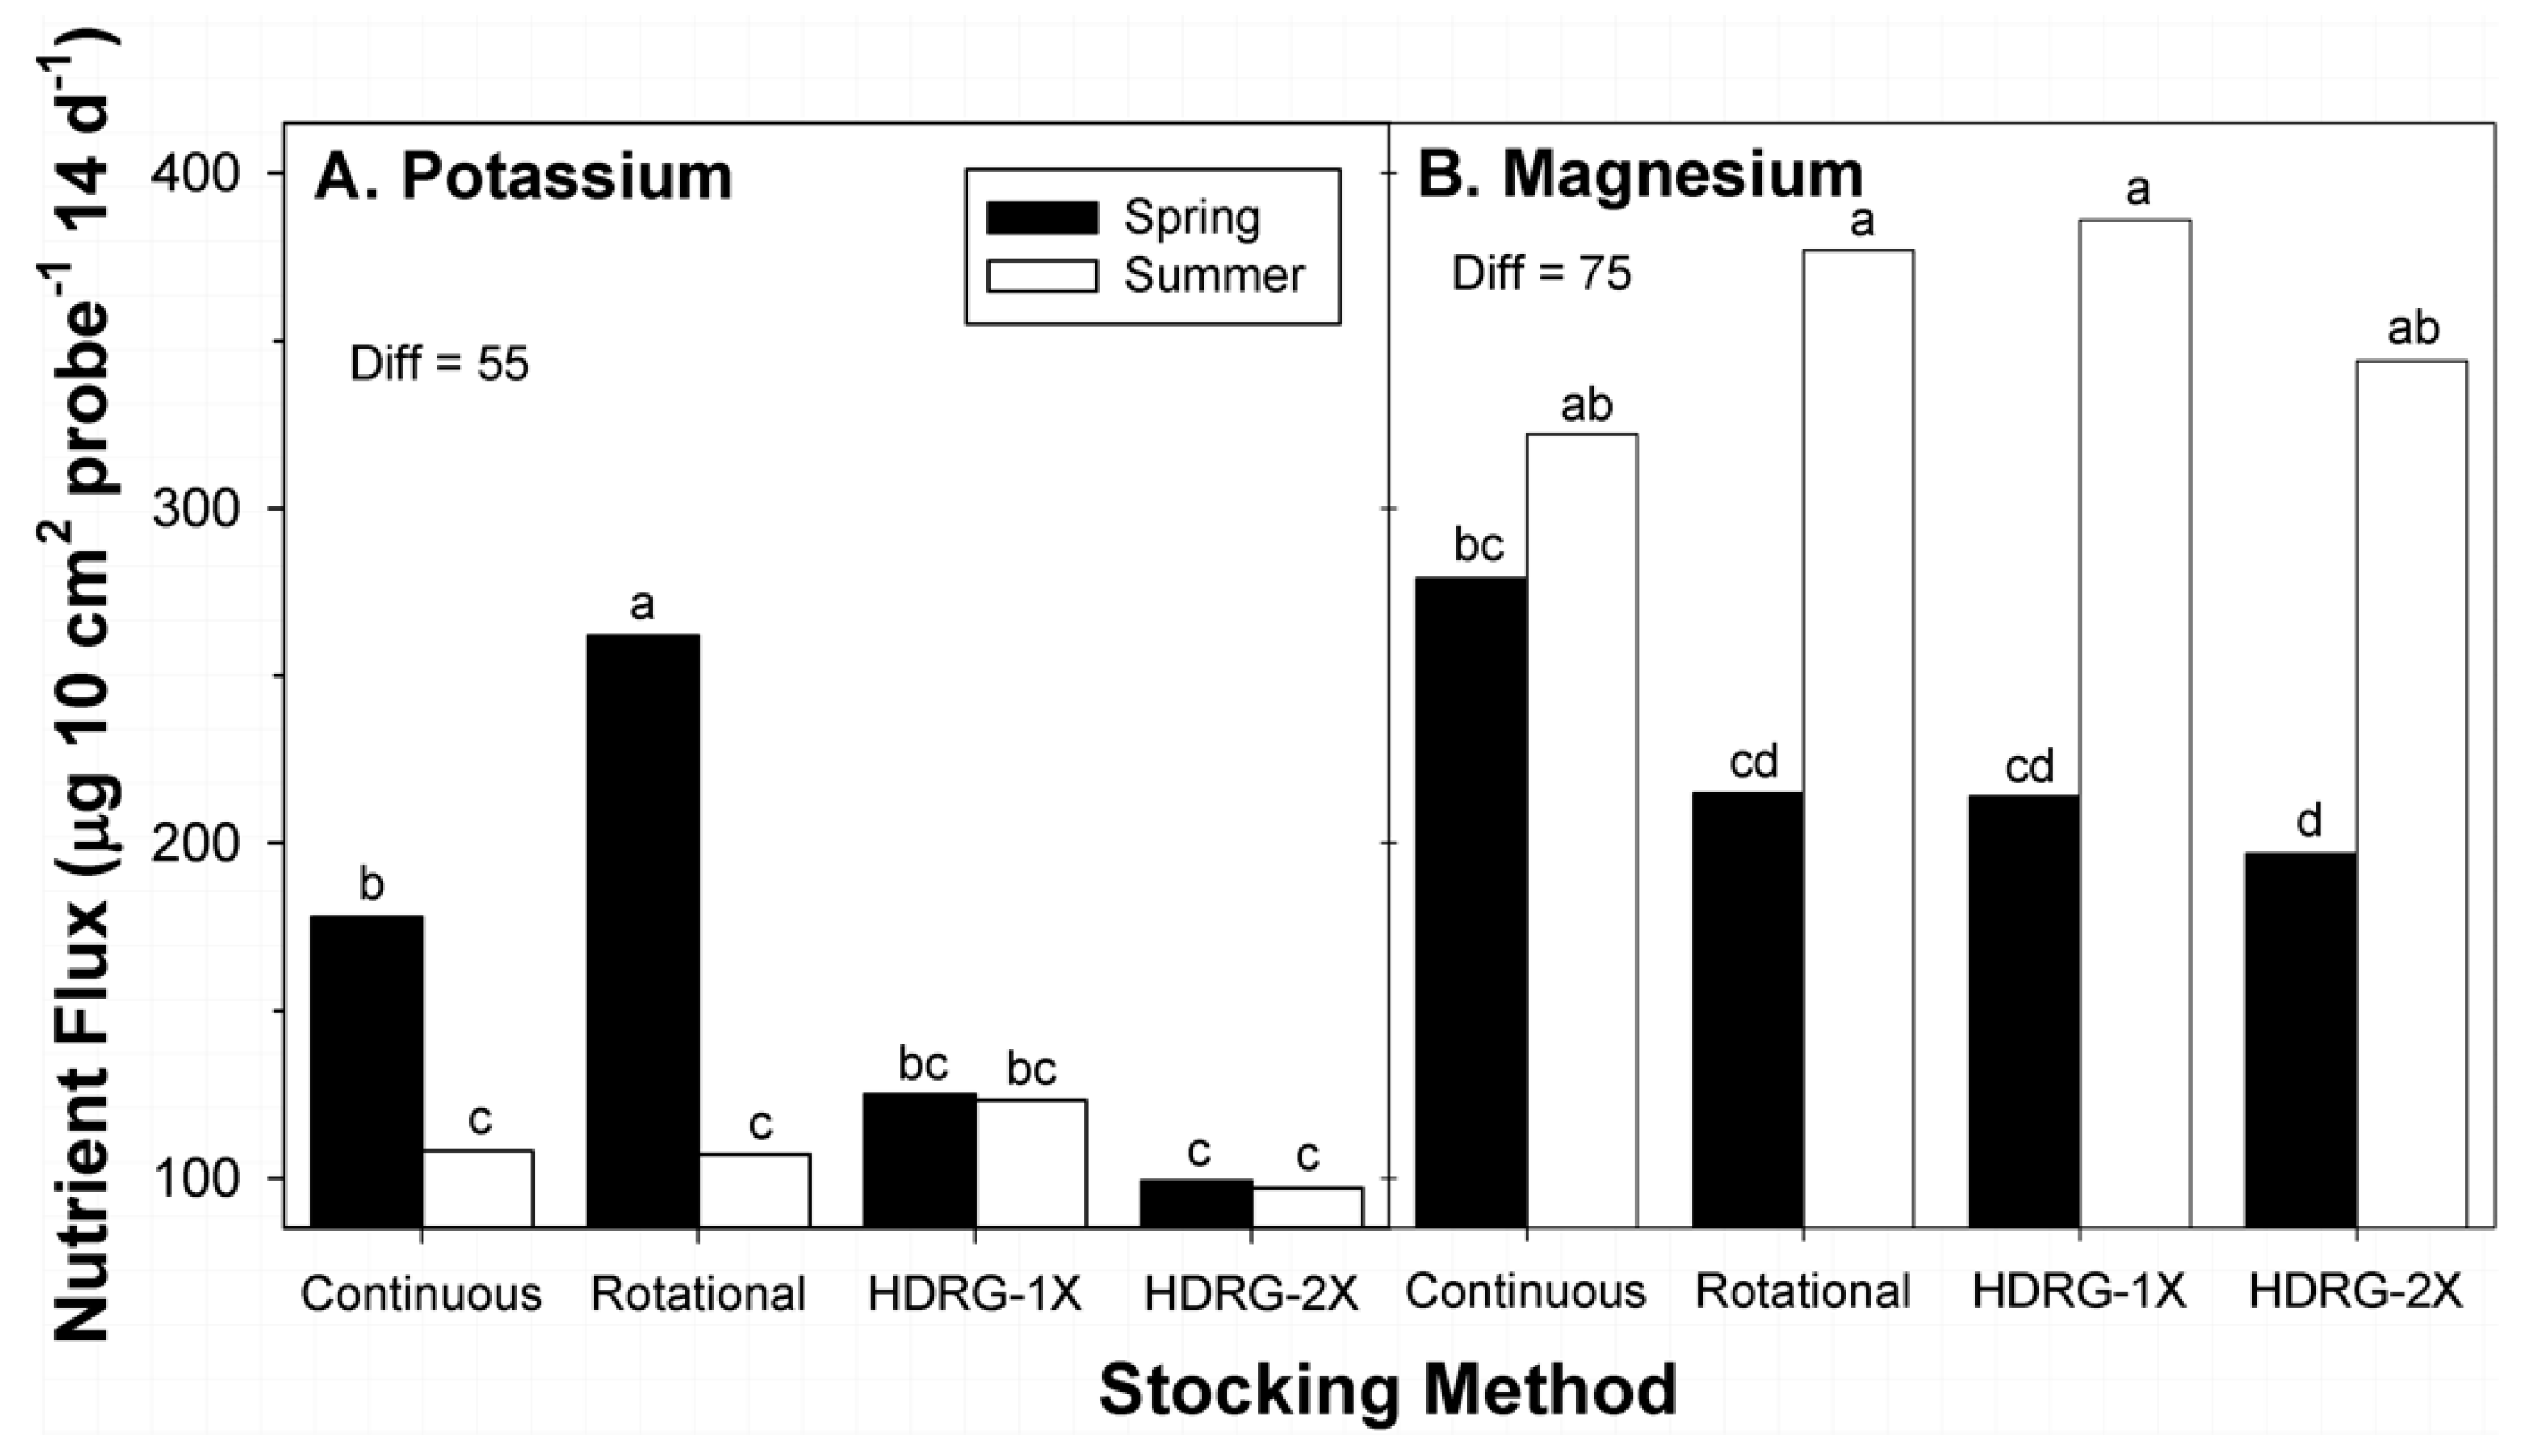
Data were collected at two times during the 2015 growing season: mid-March at the initiation of growth by native grasses, and early August, when peak living biomass occurs for southern tallgrass prairie during late summer [18]. Sub-paddocks within the rotational stocked units that were sampled in March 2015 were last grazed in mid-August 2014, while the mob-stocked paddocks were previously grazed in early September 2014. The ~7-month delay in sampling of the rotational and mob-stocked paddocks in March 2015 occurred because there was only one set of mob-stocked paddocks per replicate, and their planned timing of grazing for 2015 was late summer. Sampling of the rotational sub-paddocks and mob-stocked units in August 2015 occurred ~7 days after grazing by cattle. This coordination of sampling within the rotational and HDRG-stocked paddocks allowed for more effective comparisons among different forms of rotational stocking.
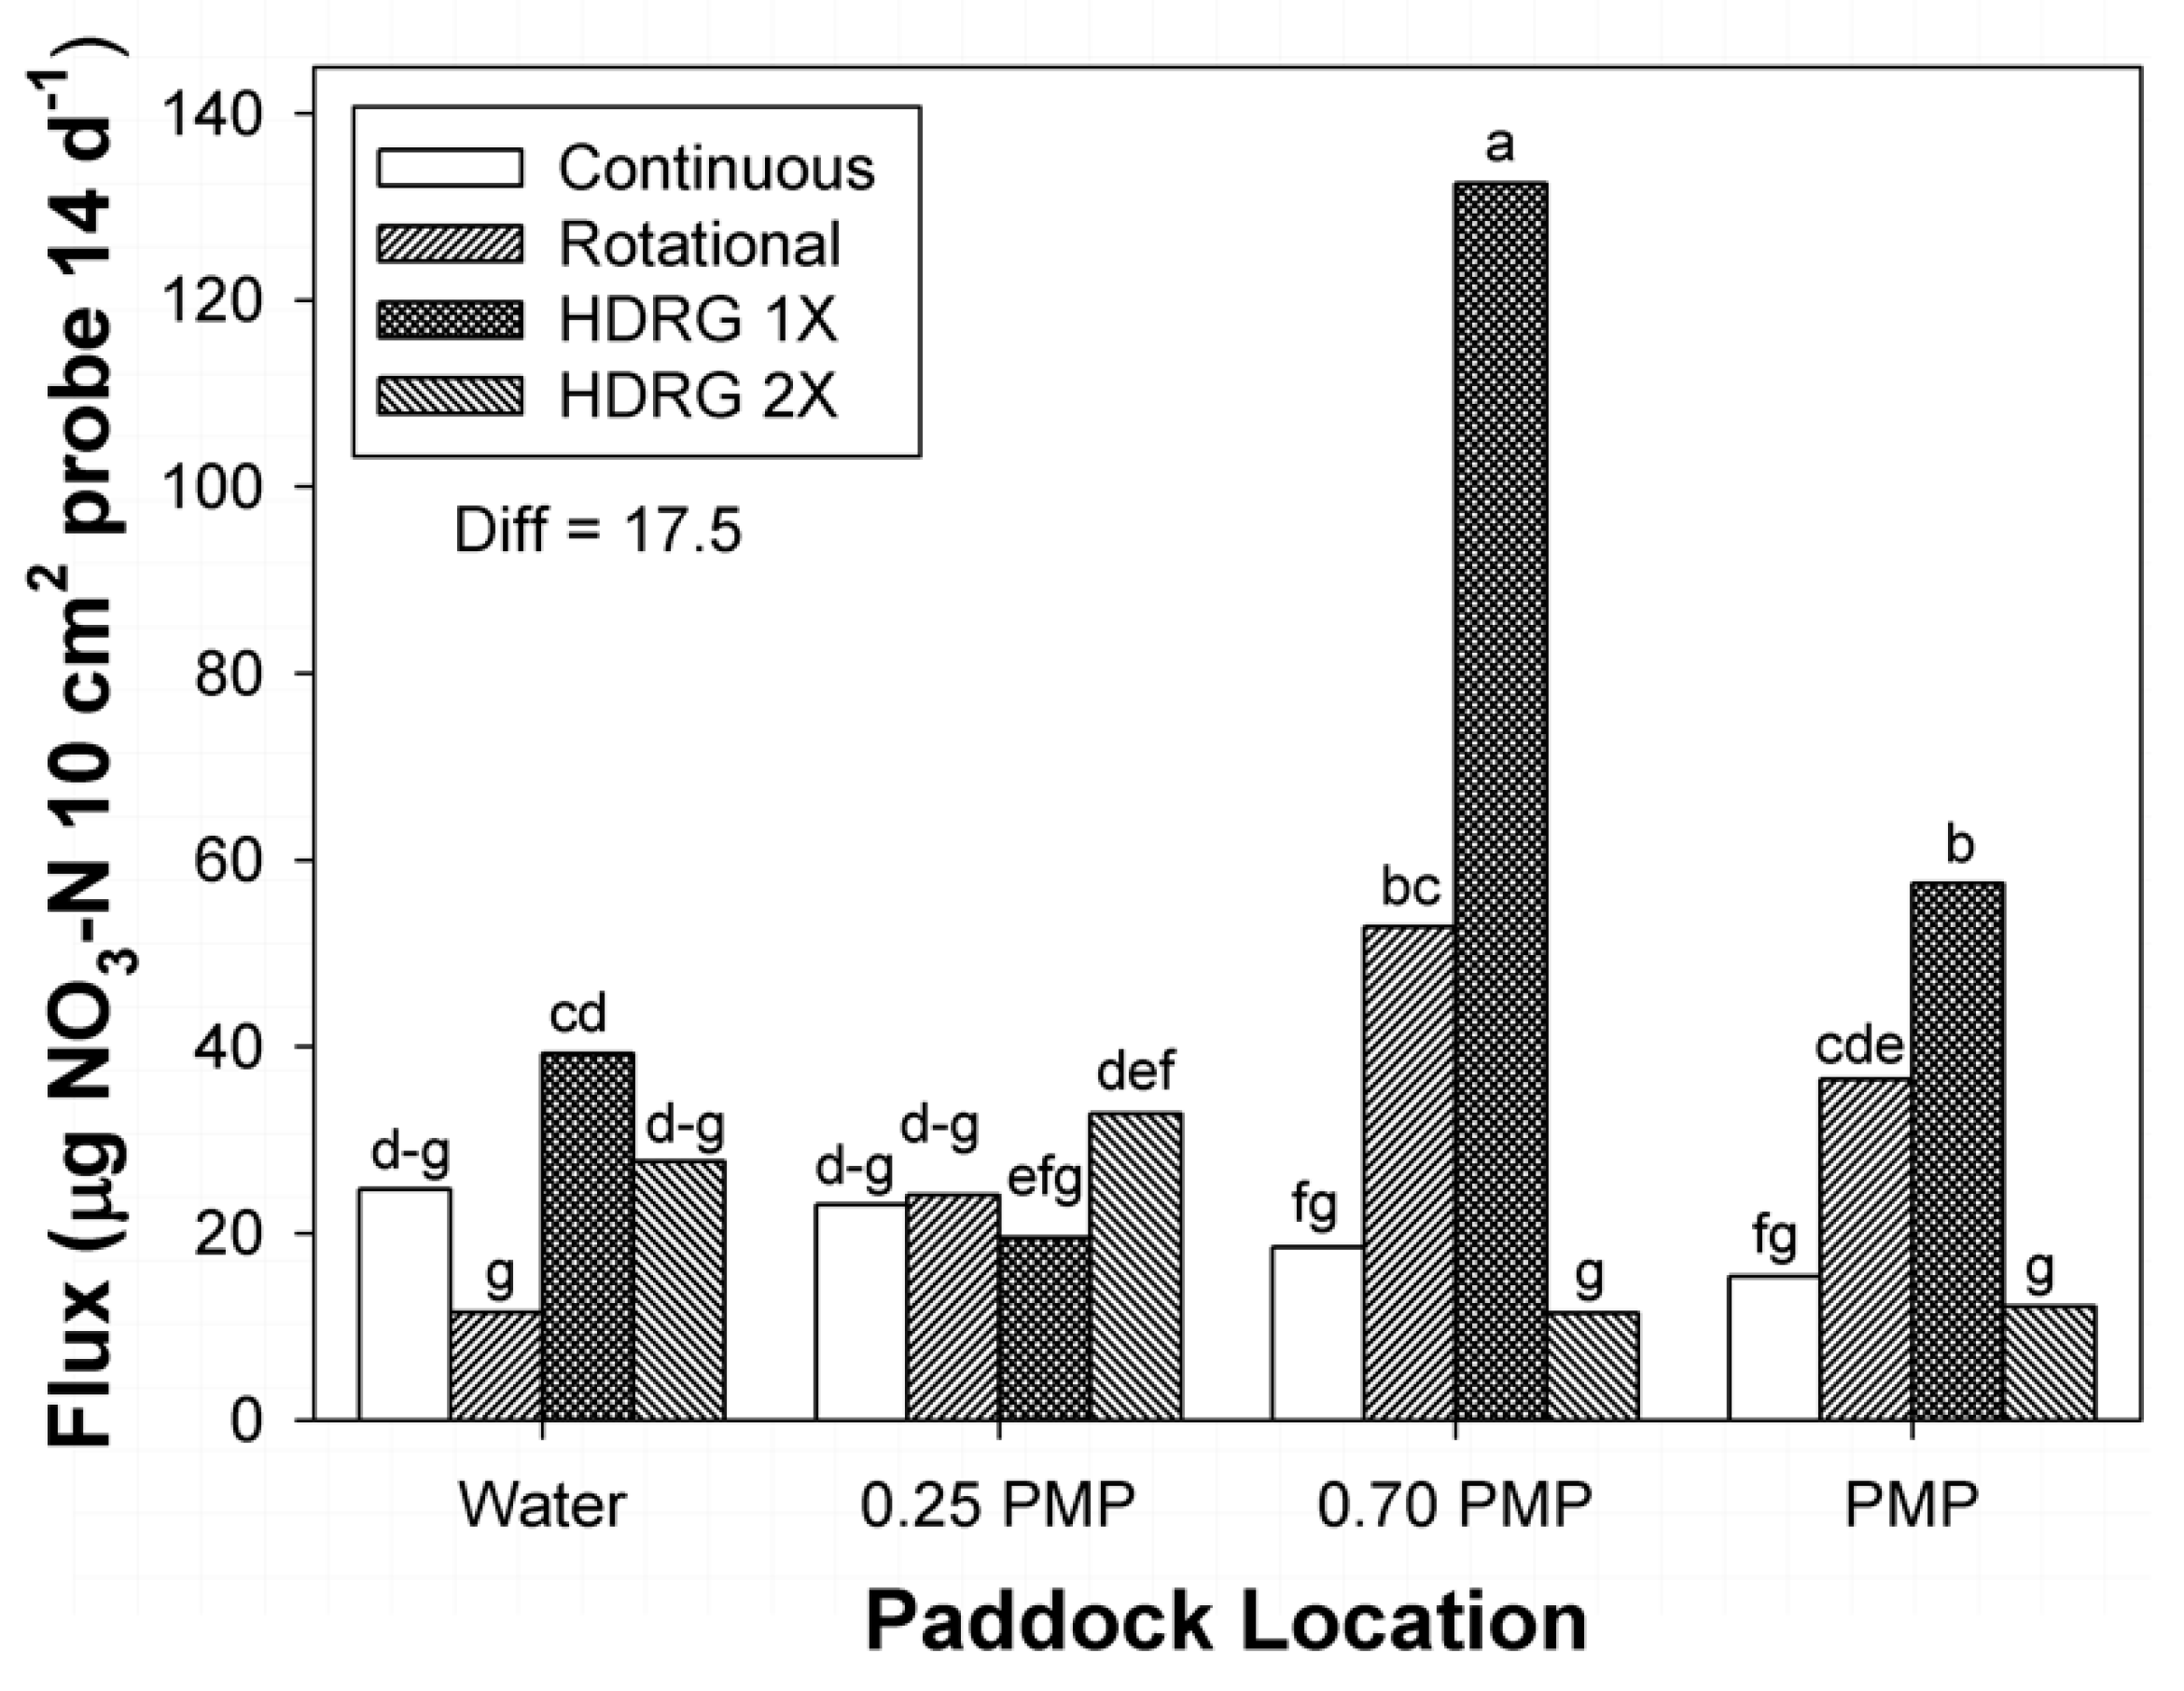
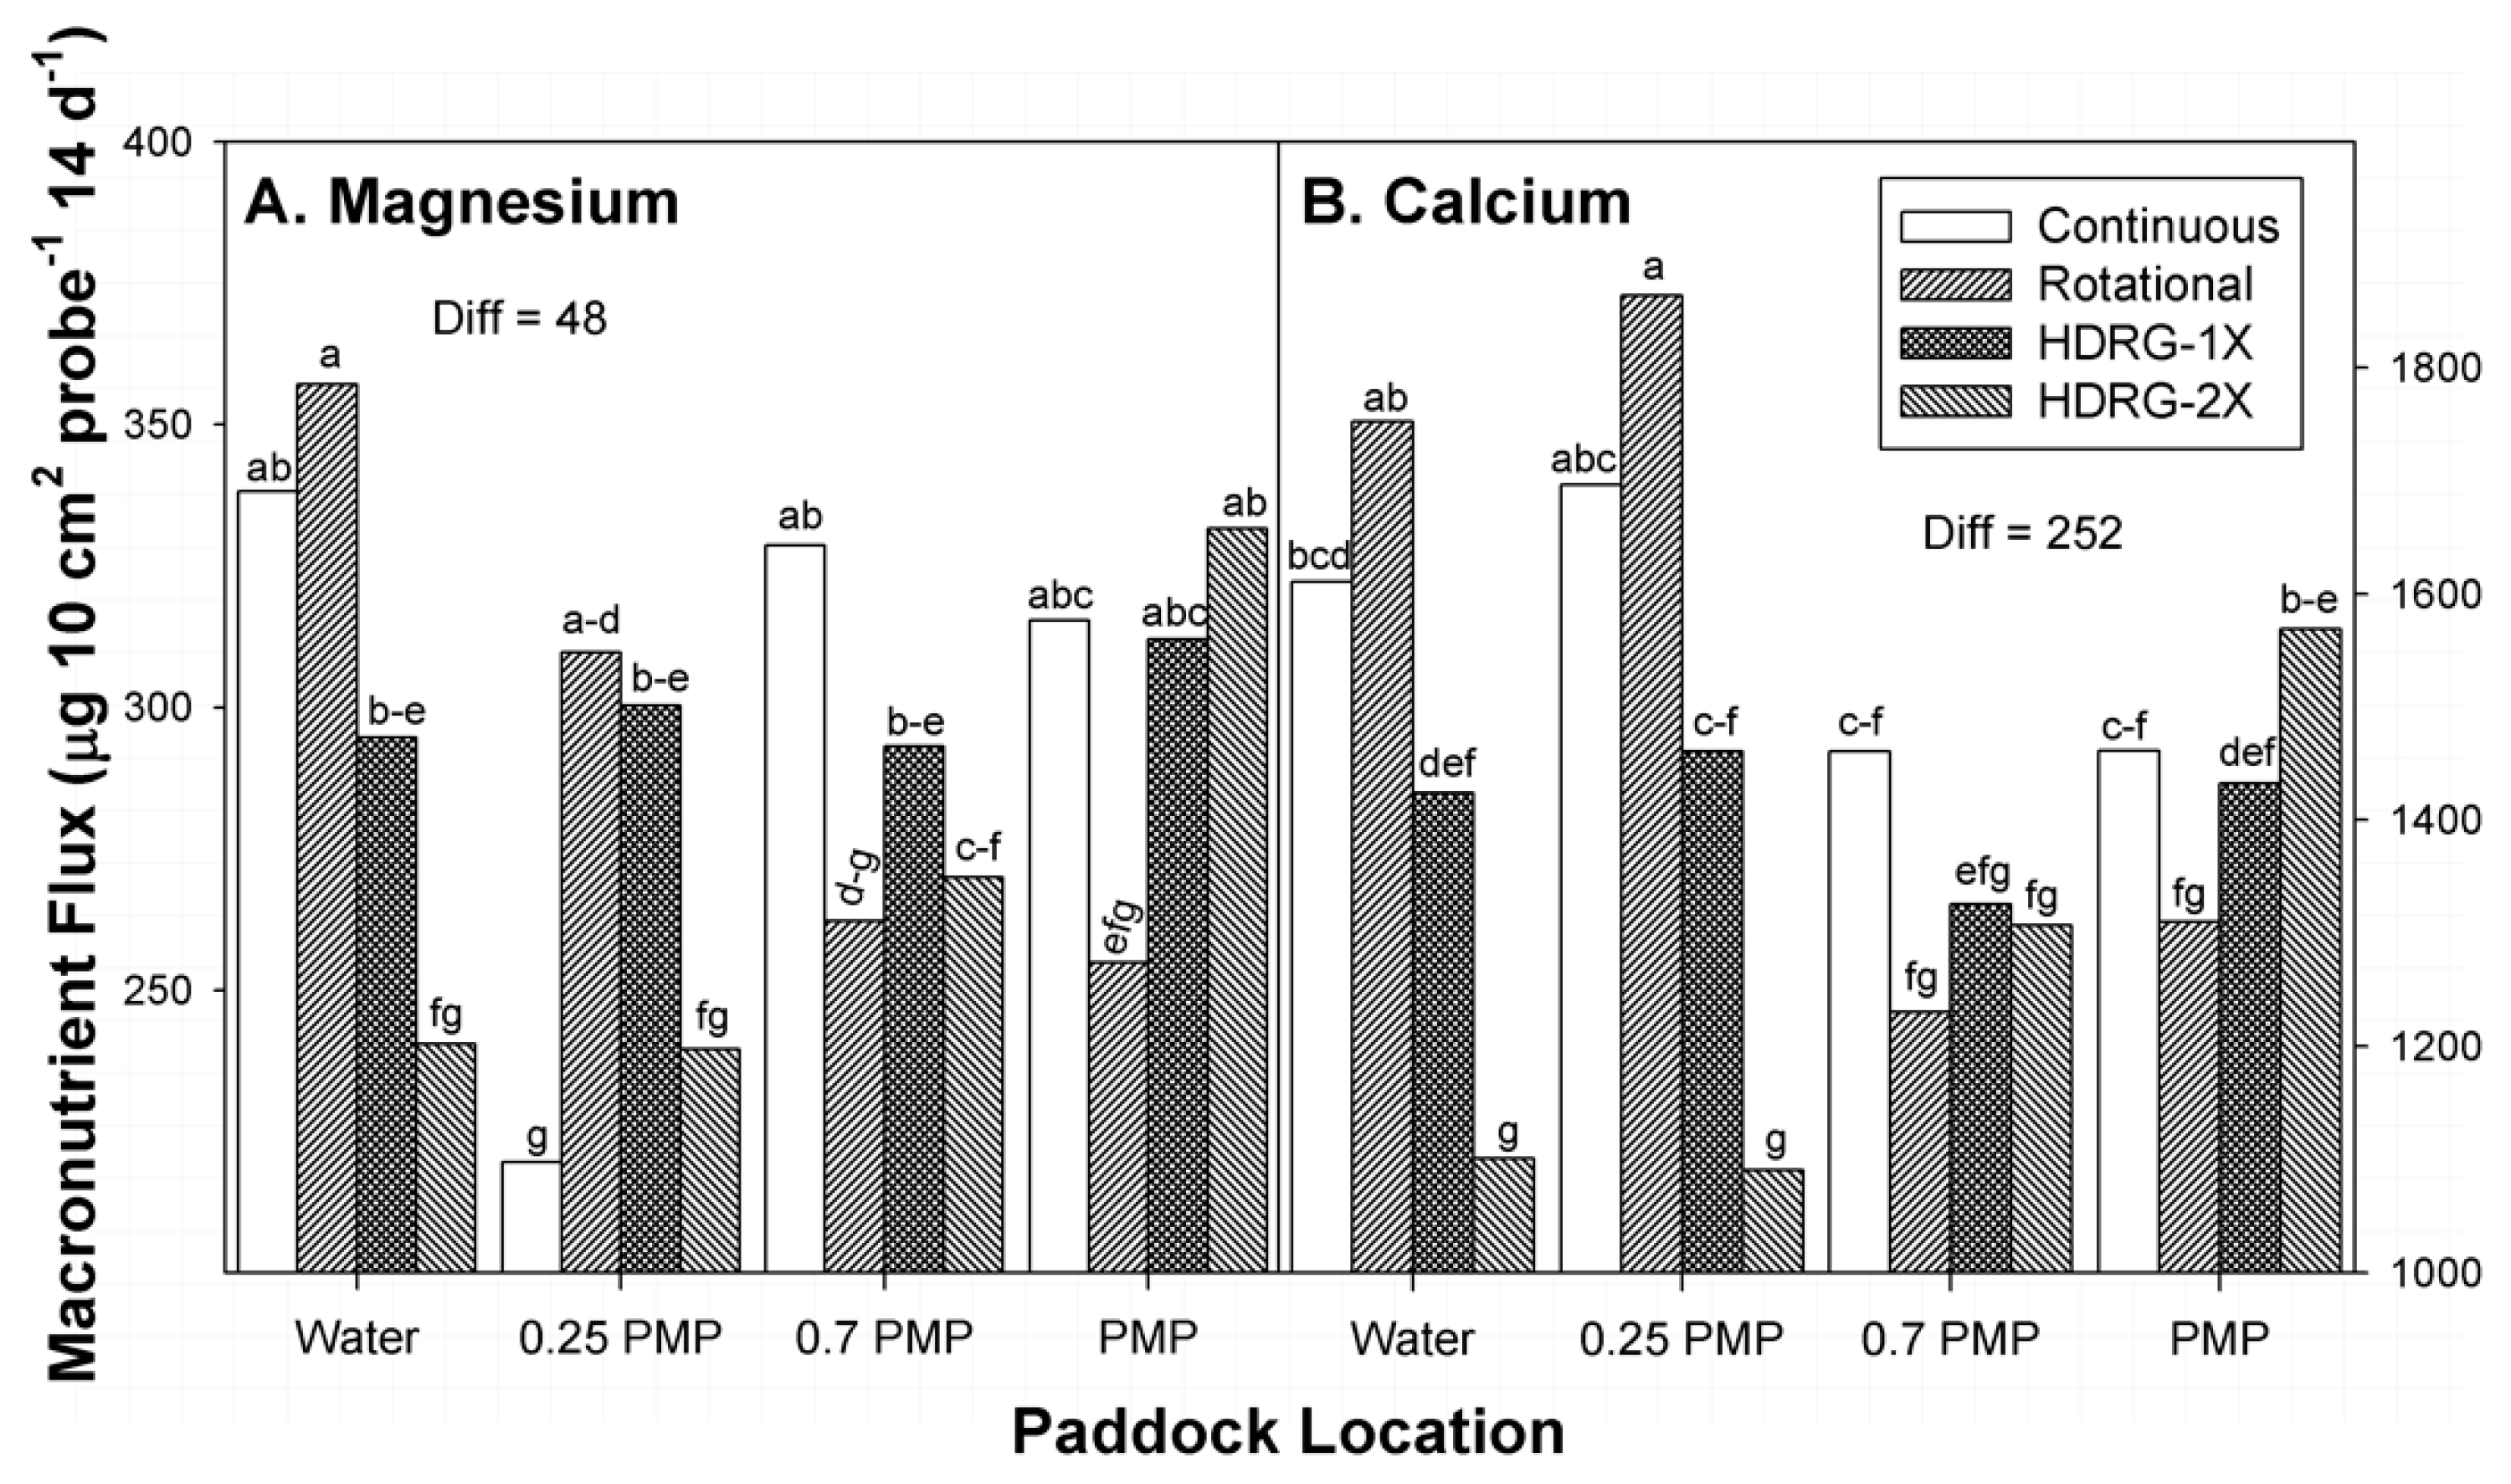
At each sampling date, the availability of macronutrients within the 0 to 7.5 cm and 7.5 to 15 cm depth increments of soil were determined at four locations within the paddocks at four locations within two replicate paddocks (or sub-paddocks) per stocking method. Locations were oriented along straight lines from water sources to centers of units. All water sources within paddocks or sub-paddocks of this study were located near paddock corners. Locations were: (1) 1.0 to 2.0 m distance from water tanks, (2) 25% of the distance between tanks and the mid-point of paddocks (0.25 PMP), (3) 70% of the distance between water and the mid-point of paddocks (0.7 PMP), and (4) at the mid-points of paddocks (PMP). The distances of 0.25 PMP, 0.7 PMP, and PMP locations from water within paddocks varied with size and shape of the individual paddocks and sub-paddocks that were sampled (Table 1). Therefore, all locations represented random locations within each paddock or sub-paddock due to pasture size, shape, and dimensions. These locations represented areas within rangeland paddocks with two divergent capacities to attract cattle: (1) areas where animals are guaranteed to interact with the soil and plant community (locations closer to water), and (2) areas at the furthest point from water and other attractant features (fence lines, corners) within paddocks [23].
Availability of macronutrients within soils was determined with Plant Root Simulator TM probes (Western Ag Innovations Inc., Saskatoon, SK, Canada). The probes consist of paired sets of anion and cation exchange membranes encased in plastic housings. At each sampled location within paddocks, two sets of probes with anion and cation membranes were co-located within 30 cm areas around paddock locations, at each soil depth. The probes were buried in situ during the March sampling for a 14-day incubation period. Soil moisture approximated field capacity in March [22(±3)% volumetric water] due to precipitation events that occurred prior to incubation periods.
Soil moisture at the time of the August sampling approximated permanent wilt-point [12(±1)% volumetric water] due to a prolonged dry period during summer. Therefore, replicate (n = 4) 5.38 cm diameter soil cores for each location and soil depth were collected and removed intact to a laboratory. Collected cores were wetted to field capacity with deionized water, dissected into two sections along the long axis of cores, and probes with anion and cation membranes were each sandwiched within two separate cores for incubation. The probes were removed following incubation periods for both sampling dates, lightly washed with deionized water to remove soil, packaged in groups by paddocks, refrigerated, and sent to the probe manufacturer for analyses. The manufacturer used colorimetric analyses via automated flow injection to determine NO3-N and NH4-N, and the other macronutrients (ions) were measured using inductively-coupled plasma spectrometry.
Two additional sets of soil cores were collected at times of sampling to define physical properties of soils, within a 50 cm diameter area as the probes, at the different sampled locations. Moist bulk densities of one set of samples (n = 8 soil depth−1 stocking method−1) were defined [24], followed by analyses of particle fractions by hydrometer methods in a sodium hexa-metasulfate solution [25]. A second set of soil samples (n = 8 soil depth−1 stocking method−1) were used to define estimates of soil organic matter based on low temperature [380 °C for 16 h on oven-dried (105 °C for 24 h) samples] loss on ignition [26].
Exploratory analyses were applied to amounts of macronutrients absorbed by the probes (Table 2) to determine whether data transformations were required for statistical tests [27]. We applied natural logarithm (Ln) transforms, as required, to improve the cumulative distribution functions of the populations of observations so they more closely fit a normal distribution. Transformed levels of flux of total mineral N, NO3, NH4, P, S, and K, and the raw values for Ca and Mg were analyzed in SAS 9.3 (SAS Institute, Cary, NC) by longitudinal (repeated) measures analyses [28] within mixed-models (PROC MIXED). Grazing regime, soil depth, and time of growing season were main effects in analyses, while sampled location within paddock was the longitudinal effect. Particle fractions, bulk density, organic matter, and distances between water sources and sampled locations were tested as covariates, to improve function and tests of statistical models. However, all physical attributes of soil were reported as non-significant for effects on analyses (0.23 < P < 0.88). Distances between water and sampled locations were retained as a covariate, as they differed among individual paddocks assigned to stocking methods, and tests indicated there was some influence on the function of statistical models [29]. Therefore, means and standard deviations (SD) of particle fractions, bulk density, and organic matter are reported to provide some estimates of soil properties at the sampled locations within paddocks.
Compound symmetry (CS) variance–covariance matrices [28] were used to account for covariance and autocorrelation among locations within paddocks as there were not enough degrees of freedom (d.f.) to utilize more complex matrix structures [29]. All analyses were restricted to 2-way interactions among main factors and the longitudinal factor due to a lack of d.f. required to test higher-order interactions [27]. The PDIFF procedure of SAS [29] was used to test for differences among means of significant main and interaction effects. Reported means were back-transformed to original scales of flux [27]. The level of significance of statistical tests was set at P = 0.10.

3. Results and Discussion

3.1. Physical Properties

Soils on the study site showed a degree of similarity for some physical attributes among paddocks assigned to the different stocking methods, while other attributes were more variable (Table 3). Particle fractions of soils in paddocks were not constant among paddocks assigned to the different stocking methods, based on SD. Soils in paddocks assigned to continuous stocking had proportions of sand and silt with coefficients of variation (c.v.) that ranged from 16% to 41%, while soils in the rotational and HDRG-stocked paddocks varied from 4% to 14%. Soils in the HDRG-2× and rotational-stocked paddocks had greater, and more uniform percentages of silt. Alternatively, soils in paddocks managed by continuous and HDRG-1× stocking had higher mean percentages of sand than was noted for rotational or HDRG-2× stocked paddocks. Percentages of clay in soils of all paddocks were relatively similar.
Moist bulk density of soils in paddocks managed under all stocking methods showed greater variance in the upper 7.5 cm (c.v. = 15% to 21%) than the 7.5 to 15 cm (c.v. = 7% to 12%) increment (Table 3). Bulk density was lower for the upper 7.5 cm increment in rotational-stocked paddocks compared to densities in paddocks assigned to the other stocking methods. Moist bulk density in all sampled paddocks increased with soil depth. Bulk density of the 7.5 to 15 cm increment was 36%, 75%, 39%, and 49% higher than the upper 7.5 cm increment in the continuous, rotational, HDRG-1×, and HDRG-2×-stocked paddocks, respectively.
Amounts of soil organic matter showed distinct differences within paddocks assigned to the different stocking methods. Paddocks managed by HDRG stocking had lower mean concentrations in the upper 7.5 cm of the profile than in paddocks managed by continuous or rotational stocking (Table 3). Soil organic matter in paddocks managed by HDRG and rotational stocking were more uniform among soil depths, while continuous grazing had lower concentrations in the 7.5 to 15 cm increment. Overall, soil organic matter was more variable in paddocks managed by continuous (c.v. = 25%) and rotational (c.v. = 29%) stocking than under HDRG-1× (c.v. = 23%) and HDRG-2× (c.v. = 8%) stocking, which was primarily due to the larger size of paddocks and broader ranges of soils encompassed within the paddocks [17].
The review of these properties indicated the physical attributes of soils within the paddocks included in the study were variable among paddocks assigned to stocking methods. Stocking methods may have affected some soil properties after sustained application from 2009 to 2015, particularly under rotational stocking. However, the amount of variability (c.v.) in the measured attributes indicated that such means were not consistent among the different larger-paddocks and sub-paddocks assigned to continuous and rotational stocking. The level of variability present in most of the physical attributes also declined with the size of the paddock. Therefore, the size, organization, and location of paddocks within the larger landscape of the study area likely had some effects on soil properties [1]. For example, the rotational-stocked paddocks had largely easterly exposures, while the continuous-stocked paddocks had predominantly westerly exposures [17]. Both the continuous- and rotational-stocked paddocks also included multiple slope positions, from toe slope through to tread positions. Such organizational features of the landscape within paddocks can have large effects on localized, catena-based development of soils, and their physical (and chemical) properties [1,2,30]. In contrast, the paddocks assigned to HDRG stocking were of sizes and dimensions that likely contained fewer soils, resulting in more consistent responses of macronutrients to stocking [15].
The stocking methods applied during this study also have some capacity to result in changes in organic matter and bulk density in soils of the US southern Great Plains (SGP). Research in Oklahoma, USA, [31] noted increased bulk density of soils of a perennial grassland in response to 10 years of different, increasing levels of stocking density applied by rotational grazing, compared to no grazing. Other research showed similar effects on bulk density after 27 years of different stocking methods [32]. However, bulk density and organic matter of soils of native grasslands in the SGP also have naturally variable distribution patterns, which appear to be related to the catenae-scale organization of plant–soil complexes that exist within landscapes of native prairies [32,33]. High levels of variance in both bulk density and organic matter were recorded within soil profiles at scales <20 m, both within and across a series of adjacent 1.6 ha experimental paddocks of tallgrass prairie managed by different stocking methods [33]. Such results indicated that soils in the area of the current study also have non-uniform distributions [17], and variable patterns of spatial distribution for soil properties beyond the effects related to the stocking method.

3.2. Mineral N

Main effects related to soil depth and time of growing season were significant for total mineral (P ≤ 0.02) and NO3-N (P ≤ 0.05). Higher amounts of total mineral and NO3-N were noted during the spring than summer (37.8 versus 27.1µg N 10 cm−2 probe−1 7.5 cm soil−1 14 d−1 (Diff = 5.7 µg); 31.8 versus 22.3 µg NO3 10 cm−2 probe 7.5 cm soil−1 14 d−1 (Diff = 8.2 µg)). The highest available amount of total mineral and NO3 N within significant effects of soil depth was noted for the upper 7.5 cm compared to the 7.5 to 15 cm depth (47.0 versus 21.8 µg N 10 cm−2 probe-1 7.5 cm soil−1 14 d−1 (Diff = 5.7 µg); 39.2 versus 18.1 µg NO3 10 cm−2 probe−1 7.5 cm soil−1 14 d−1 for (Diff = 8.2 µg)).
The stocking method × paddock location interaction was significant for both total mineral (F9, 96 = 4.8; P < 0.01) and NO3-N (F9, 96 = 3.3; P < 0.01); all other interactions among effects for both total and NO3--N were not significant (0.15 < P < 0.84). The highest flux in availability of total mineral (Table 4) and NO3--N within the interactions (Figure 1) were recorded at 0.7 PMP in paddocks receiving the HDRG-1× treatment. A group with the second-highest flux occurred at PMP of HDRG-1× paddocks, and 0.7 PMP in rotational-stocked paddocks. The group with the lowest flux recorded occurred at 0.7 PMP and PMP of HDRG-2×-stocked paddocks. Amounts of flux at all other locations within paddocks belonged to different intermediate, and usually multiple, groups of means. The amount of flux at 0.7 PMP of HDRG-1× paddocks was 510% greater overall than the amounts across all locations in continuous-stocked (control) paddocks, while the group with second-highest flux was 164% greater than those in the control paddocks. In contrast, the locations in HDRG-2×-stocked paddocks with the lowest amounts of recorded flux had amounts that were 49% to 52% lower than fluxes in NO3- and total N recorded in continuous-stocked paddocks.
Distribution of flux in plant-available NO3 -N and total mineral N were more uniform among sampled locations in paddocks that were continuous-stocked than in paddocks managed under the other stocking systems (Figure 1, Table 4). This was a surprising result given that these paddocks were grazed year-long by cattle (as a control treatment), and the sampled transects covered substantially larger areas than in either the rotational- or HDRG-stocked paddocks. There was an expectation of the occurrence of specific hotspots of mineral N (or higher overall amounts of mineral N) in soils within the continuous-stocked paddocks. This premise was based on the greater opportunity (longer occupancy time) for cattle to congregate in certain areas (e.g., water sources) of paddocks, resulting in less-even distributions [10]. However, the response of mineral N to the form of stocking can be variable. A study of the effects of 2- and 12-day rotations with continuous stocking on Bermudagrass (Cynodon dactylon) paddocks reported no differences in paddock-scale NO3-N, but greater accumulations closer to water and shade [15]. The same results were noted in Bahiagrass (Paspalum notatum) paddocks managed by similar stocking methods [34]. In comparison, the amount of NO3-N flux in the rotational- and HDRG-grazed paddocks of this study showed definable hotspots, and greater ranges in amounts of flux among locations within paddocks, despite the shorter residence times of cattle
This result runs counter to one of the hypothesized effects for systems of rotational stocking, i.e., that subdivision into smaller sub-paddocks would result in more uniform use of paddock areas by cattle, and hence, provide more uniform distribution of excreta by grazing animals [16,22]. However, the inherent behavior and preferences of cattle for certain features of landscapes may prevent the achievement of uniform distribution of grazing in production-scale paddocks, regardless of stocking method [23]. For example, cattle wearing global positioning system (GPS) collars on rangeland in northeastern Colorado spent ~27% of their total time on paddocks in locations (water sources and corners) that represented just 2.5% of the total area of 65 to 130 ha paddocks [13]. Cattle redistributed 49% of all N in consumed biomass to these areas [13]. Similar results have been reported for different types of perennial warm-season grasses managed under both continuous and rotational stocking [15,34]. In comparison, the current study on native tallgrass prairie showed a series of high-N areas at more distant locations from water under rotational and HDRG-1× stocking, but responses were not consistent across all forms of rotational stocking. Such results indicate that the application of more management-intensive methods of stocking cattle may not achieve uniform use of the entire area of paddocks, and hence, uniform distribution of NO3 or mineral N. Application of animal densities, that do not exceed carrying capacity of the plant community (as in the current study) to continuously-stocked paddocks may be as effective at preventing hotspots of labile NO3N as rotational methods.

3.3. Phosphorus

There were significant differences in main effects related to soil depth (F1, 96 = 29.3; P < 0.01) for flux of available phosphorus (P), with greater fluxes within the upper 7.5 cm than the 7.5–15 cm increment of soil profiles (4.0 versus 2.4 µg P 10 cm−2 probe 7.5 cm soil−1 14 d−1). Studies reporting the effects of rotational and continuous stocking on soil P in other perennial grasslands have noted similar effects related to soil depth [15,35] The stocking method × date (F3, 96 = 10.3; P < 0.01), paddock location × date (F9, 96 = 2.6; P = 0.01), and date × paddock location interactions (F3, 96 = 4.9; P < 0.01) were also significant, while all other interactions were not (0.47 < P < 0.93). Within stocking method × time of season interactions (Table 5), the largest P flux occurred under rotational stocking during spring, and the second-largest under continuous stocking during summer. All other levels of P flux within the interaction were low and belonged to the same means group. In spring, rotationally-stocked paddocks had 109% greater amounts of P flux than in continuously-stocked (control) paddocks. In comparison, paddocks managed under HDRG had 36% lower P flux than continuous-stocked paddocks.
Within the paddock location × time of season interaction (Table 5), the greatest flux in P occurred during spring at 0.25 PMP. This amount of P flux was 97% greater than the flux recorded at other locations in spring. During summer, the 0.7 PMP locations generated the second-largest flux in available P, with 33% greater flux than other locations within paddocks. All other fluxes in available P within the interaction were at similar low amounts. Within the stocking method × paddock location interaction (Table 6), the highest flux of available P in soils was noted at 0.25 PMP and PMP locations under continuous stocking. A group with the second-highest amounts of P flux was noted at 0.7 PMP in rotational-stocked paddocks and at water sources in continuous-stocked paddocks. Amounts of P flux in the elements of the interaction occurred at low and similar levels (1.3 to 2.1 µg). The highest amount of flux (0.25 PMP in continuous-stocked paddocks) was 34% greater than rotational-stocked paddocks at the same location, and 162% and 358% greater respectively, than P flux in HDRG-1× and 2×-stocked paddocks.
While significantly higher amounts of P flux were noted in all three interactions (Table 5 and Table 6), these amounts were not large, and may have limited biological significance. The entire range in flux of available P in the interactions was 4.4 (grazing regime × time of year), 4.0 (paddock location × time of year), and 4.3 (grazing regime × paddock location) µg per 10 cm2 surface area of probes 7.5 cm soil−1 14 d−1. The majority of the means of P flux noted in interactions also fell within narrow ranges (0.9 to 1.3 µg), when the statistically highest responses were excluded. Such results indicate that the amounts of plant-available P in soils in response to stocking method, time of year, and paddock locations was relatively small. Also, the higher amounts recorded (continuous and rotational stocking) were not consistent in terms of paddock locations or times of year, so variability was present in the responses. It is difficult to assess what these low fluxes in plant-available P represent, as it is only a portion of the entire P pool. Other research on P distributions within grass paddocks under rotational and continuous stocking methods noted differences in amounts related to lengths of applied grazing periods, and higher amounts close to water or shade (78–130 [15], 8–17 [34], and 15–22 [35] mg P kg−1) in different soils.
The primary source of plant-available P within perennial grasslands is largely derived through recycling of amounts in soil organic matter consumed by soil microbes, and through inputs from decomposition of livestock feces [3]. Therefore, amounts of plant-available P in grassland soils are generally low, compared to other macronutrients like N, K, Ca, and Mg [3,36]. Another likely driver for the lower amounts of P flux within paddocks receiving the HDRG forms of stocking may be the short periods that cattle were assigned to these units. Though large numbers of cattle were present on these small areas, they spent only 24 h on these paddocks each year, which limited the potential input of feces, compared to the longer residence times of cattle in continuous- and rotational-stocked paddocks. Other studies have reported more random forms of feces distribution under short-term (24 to 48 h) rotational stocking on small paddocks, instead of patterns related to water or shade [34]. Research on paddocks of introduced warm-season perennial grasses in Florida also reported greater amounts of soil P in closer proximity to water across longer rotational (10–14-day grazing periods) and continuous stocking systems [15,34], which was a different result from the current study.

3.4. Potassium

There were significant differences in main effects related to soil depth (F1, 96 = 22.8; P < 0.01) for plant-available potassium (K), with greater flux within upper 7.5 cm depth of profiles than the 7.5 to 15 cm increment (335 versus 137 μg 10 cm−2 probe area 14 d−1 in the 0−7.5 and 7.5−15 cm increments, respectively). Interactions between stocking method and date were also significant (F3, 96 = 2.7; P = 0.05), but the main effects of paddock location (P = 0.66) and all other interactions were not (0.23 < P < 0.93).
Within the stocking method × date interaction in flux of available K (Figure 2A), the greatest and second greatest amounts occurred, respectively, under rotational and continuous stocking during spring. The lowest flux in available K included a group of responses under HDRG-2× stocking during spring and summer, and continuous and rotational stocking in summer. The flux in available K in soils of rotational-stocked paddocks was 149% larger than under continuous stocking during the spring, while K flux under HDRG-1× and HDRG-2× stocking were 30% and 44% lower than the control. In contrast, there was little difference in amounts of flux in available K among stocking methods during summer.
The location of lounging areas of cattle within paddocks has been defined as a potential key to change in distribution of K within landscapes of paddocks [3]. Movement of K in excreta from the larger area of paddocks to high traffic zones can translate to higher amounts of K (and N) in plant biomass produced near urine patches, relative to amounts actually retained within the body mass of cattle [3,36]. Higher amounts of K were noted in lounging areas of Bermudagrass and Bahiagrass paddocks in Florida, USA [15,34], likely due to greater inputs of urine in such areas. In contrast, the current study found no notable redistribution of plant-available K within any of the sampled paddock locations related to stocking method. While the two sampled locations near water within paddocks represented extremes for positions near water, these locations may have missed lounging areas near water [34]. More intense sampling regimes within paddocks may be required to identify areas with high amounts of plant-available K. The only definable effects noted on flux of available K were related to conditions during different times of the year, with greater amounts of flux during spring (80% and 150% greater under continuous and rotational stocking), and 2.4 times less flux in the deeper section of sampled soil.

3.5. Magnesium

Main effects of soil depth were significant (F1, 96 = 9.4; P < 0.01), with the upper 7.5 cm increment having greater magnesium (Mg) flux than the 7.5 to 15 cm increment (342 versus 316 µg 10 cm−2 7.5 cm soil depth−1 14 d−1; Diff = 23 µg). Similar patterns in amount of Mg in different sections of the soil profile were noted in other grazed grasslands [34,35]. Stocking method × time of growing season (F3, 96 = 4.3; P = 0.01), and stocking method × paddock location (F9, 96 = 2.4; P = 0.02) interactions were also significant. All other interactions among main effects were not significant (0.19 < P < 0.78). Within the stocking method × time of year interaction, the greatest amount of Mg flux occurred in response to rotational and HDRG-1× stocking during summer (Figure 2B), and slightly lower levels of Mg flux were noted in response to continuous and HDRG-2× stocking. In contrast, the lowest amounts of flux were noted during spring under HDRG-2× stocking, while responses to the other stocking methods during spring belonged to means groups with intermediate and lower responses.
Rotational and HDRG stocking resulted in 23% to 29% lower flux in Mg during spring than continuous stocking, but 7% to 20% greater amounts of flux during summer (Figure 2B). In contrast, the amount of flux present under continuous stocking was more consistent during different times of year than responses to the other stocking methods. Magnesium flux between spring and summer under continuous stocking increased 15%, while rotational and HDRG stocking resulted in larger increases. Higher fluxes in available Mg occurred under all stocking methods during summer, with an average difference of 61%.
Factors that generated the stocking method × time of year interaction in Mg flux were not immediately evident. The longer residence time of cattle on the continuous stocked paddocks was thought to result in increased amounts of Mg (and other nutrients) within paddocks [34,36]. Sandier soils, such as those in the continuous-stocked paddocks also tend to have lower amounts of available Mg [3,34]. The difference in timing of sampling between spring (delayed seven months) and summer grazing might have provided the higher amounts of Mg during summer. However, the primary excretal source of Mg is from feces (>75% of total animal inputs) and has slower rates of movement than N or K into the soil [3]. The summer sampling event occurred within seven days of termination of grazing, so there was not enough time for Mg enrichment prior to summer sampling. A more likely agent for the interaction would be leaching of Mg from soil profiles during the delay between grazing and spring sampling [34,35,36].
Among stocking methods, both rotational and HDRG-1× stocking resulted in greater amounts of Mg during summer, despite being grazed for shorter periods than the continuous paddocks, and the drier conditions that were prevalent during summer. In comparison, research on Bahiagrass paddocks reported no differences in Mg concentrations within soils of paddocks in Florida after three years of different forms of rotational stocking were applied during summers [34]. Alternatively, research on tall fescue (Lolium arundinaceum) paddocks grazed during April through September reported differences in amounts of Mg in soils in response to a series of rotational stocking systems, and consistent declines in amounts across all systems after five years [35].
Within the stocking method × paddock location interaction, the highest and lowest flux in available Mg occurred respectively, in proximity to water tanks and the 0.25 PMP locations of rotational- and continuous-stocked paddocks (Figure 3A). The second-highest Mg flux occurred for a group of mean responses for locations near water tanks, 0.7 PMP and PMP locations in continuous-stocked paddocks, and PMP locations in HDRG-2×-stocked paddocks. A difference in distribution patterns of Mg flux was the driver of the interaction between stocking methods and paddock locations. Both continuous and rotational stocking had higher levels of Mg flux at locations closer to water tanks, while HDRG-1× stocking generated more uniform levels across locations, and HDRG-2× stocking resulted in increased flux in available Mg with increasing distance from water. This change in distribution pattern generated by stocking methods resulted in a range of responses belonging to the means groups with intermediate amounts of flux in available Mg. Other research on paddocks of warm-season grasses managed under continuous and rotational stocking reported increasing amounts of Mg in areas closer to water or shade [15,34]. A similar effect was noted in the current study, with the continuous and rotational paddock, though the effects was not consistent across or within all stocking methods.

3.6. Calcium

Main effects related to soil depth (F1, 96 = 13.7; P < 0.01) and time of growing season (F1, 96.1 = 102; P < 0.01) on calcium (Ca) flux were significant, as was the stocking method × paddock location interaction (F9, 96 = 1.7; P = 0.09). All other interactions were not significant (0.11 < P < 0.84). Among main effects related to soil depth, the upper 7.5 cm had greater flux in available Ca than the 7.5 to 15 cm increment (1779 versus 1551 μg 10 cm−2 probe area−1 7.5 cm soil−1 14 d−1; Diff = 59 µg). Among times of growing season, lower flux in available Ca was noted at the time of spring sampling compared to summer (1512 versus 1817 μg 10 cm-2 probe area−1 7.5 cm soil−1 14 d−1; Diff = 59 µg).
Within the stocking method × paddock location interaction, the highest flux in Ca occurred under rotational stocking at 0.25 PMP locations (Figure 3B). A group with the second-highest Ca flux included locations near water tanks in continuous- and rotational-stocked paddocks, and 0.25 PMP locations in continuous-stocked paddocks. In contrast, the lowest recorded Ca flux occurred near water in paddocks under HDRG-2× stocking. The interaction between stocking method and paddock locations was due to differences in the pattern of amounts of flux among forms of grazing. Both continuous and rotational stocking had higher levels of Ca flux at locations closer to water tanks. In contrast, HDRG-1× stocking generated more uniform levels of flux across locations, and HDRG-2× stocking resulted in increasing amounts of flux with distance from water tanks.
Calcium in animal excreta is primarily in feces; < 3% of animal inputs to soil are reported to be in urine [3]. Therefore, fecal sources have been considered a significant factor for flux in plant-available Ca, compared to decomposition of plant residues. However, amounts of Ca input to grassland soils via cattle excreta varies widely, and movement rates of Ca from dung to soils is not well-defined. Evidence suggests an increase in Ca flux with greater amounts of precipitation [36,37]. In comparison, the current study showed lower amounts of flux during spring, when greater amounts of soil moisture were present, compared to the amounts recorded during summer after a prolonged dry period. The delay between grazing and sampling for macronutrients may have contributed to this result. However, heavier rainfalls than those which were encountered during this study may be required. Movement of Ca from dung into soil without such events occurs at slower rates, similar to the change in amounts of organic matter in dung [38].

3.7. Sulfur

The effects of distance to water as a covariate in defining flux of plant-available sulfur (S) in soils were significant (F1, 12.9 = 3.7; P = 0.08), indicating distance between sampled locations and water sources were important to the amounts of flux recorded in plant-available S. However, the related effect of sample location of these distances (a measure of paddock organization) as a main effect (F3, 96 = 1.2; P = 0.30), and interaction of sample location with other factors, were not significant (0.12 < P < 0.72). Main effects of stocking method (F3, 93.1 = 8.8; P < 0.01) and soil depth (F1, 96 = 5.4; P = 0.02) were the only significant factors that affected flux in plant-available S in soils.
Among stocking methods, continuous and rotational stocking had the highest and second-highest flux (58.7 and 43.3µg S 10 cm−2 7.5 cm probe−1 soil depth−1 14 d−1; Diff = 4.4 µg), while HDRG-2× and HDRG-1× stocking had significantly lower and similar amounts (30.2 and 27.3 µg S, respectively). The range from greatest to least amounts of flux (31.4 µg) was 78% of the mean amount of flux across all stocking methods. In comparison, research on S in soils of other grasslands reported greater amounts in soils managed under rotational stocking with long residence times and continuous stocking, compared to rotations with short residence times on paddocks [15]. Among soil depths, the surface 7.5 cm increment had significantly more S flux than the 7.5 to 15 cm increment (47.1 versus 30.7 µg S 10 cm−2 probe−1 7.5 cm soil depth−1 14 d−1; Diff = 8.6).
Sulfur is present in soils in both organic and inorganic forms, and in variable amounts [3]. The amounts of S present in soils also depends on such factors as amounts and types of organic matter, mineral composition, and pH of soils [3,39]. The majority (>90%) of S in soils of temperate grasslands was found in the upper 10 cm of the profile, in organic forms derived from animal excreta and plant residues [35]. Large proportions of this S are labile forms, including water-soluble sulfates derived from excreta and residues [39]. In comparison, there was 53% more S flux in the upper 7.5 cm increment of soil in the current study, which corresponded to findings noted in earlier research [15].
Inputs to soils from excreta of grazing animals, primarily in urine, represent an important source of S flux in graze grasslands [15,39], and stocking method has been reported to effect distributions. Sources of plant-available S from grazing animals is related to both retention and throughput of forage consumed. Roughly 25% of S in the biomass of forage consumed by cattle is retained within animals, with the remainder excreted in urine and feces [3,15]. Amounts of S in both forms of excreta varies with type of grassland, location within landscape where deposited, and form of management.
In the current study, higher amounts of flux in available S appeared to occur in response to the length of time animals were assigned to paddocks, with a sequential decrease from the longest (continuous) to shortest (HDRG) periods of applied grazing. Research in Australia and New Zealand noted that 50% to 70% of S excreted by cattle was in urine, primarily in labile forms of sulfate [36,39]. In contrast, S concentration in dung tends to be small (~0.3% of dung dry matter) and generally in more stable organic forms that mineralize slowly, at rates similar to those noted in mineralization of soil organic matter [39]. Therefore, the longer residence times of cattle on the continuous and rotational paddocks was an important contributor to the greater amounts of plant-available S that were recorded.

4. Conclusions

Responses during this study provided a mixed result for defining how, or if, seven years of applied stocking methods affected levels and distributions of plant-available macronutrients at contrasting locations within production-scale paddocks. All stocking methods tested, from continuous through to different forms of rotational stocking, appeared to generate varied responses in different plant-available macronutrients among paddock locations and time of growing season, though amount of sampling was limited. These variable responses were likely driven by interactions of climate and local soil–plant assemblages (catenae) with paddock management and time of year [1,6,11,22], which were noted in a range of other studies [11,13,15,16,31,34,35,36]. Though the number of locations within paddocks, number of paddocks, and amount of sampling in the study were limited, such responses indicate that stocking methods may not prevent high levels of flux in plant-available macronutrients within paddocks, which is similar to results reported for other ecosystems [15,34,35]. Production-scale paddocks of tallgrass prairie are generally large in size, and variable in terms of landscape features and soils that are included within their boundaries. Such variability makes identifying changes in soil attributes to management a difficult and complex process. Though limited in number of locations within paddocks, number of paddocks sampled, and amount of sampling, the current study does provide a preliminary example of whether stocking methods influence distribution of macronutrients within paddocks after seven years of application. Longer and/or more detailed studies of macronutrient distributions across a broader range of landscape positions are required to better describe responses within production-scale paddocks.

Author Contributions

Conceptualization, P.J.S. and K.E.T.; methodology and experimental design, B.K.N., P.J.S., and K.E.T.; statistical analysis, B.K.N.; resource management and project administration, P.J.S., K.E.T. and B.K.N.; data curation, P.J.S. and B.K.N.; writing—original draft preparation, B.K.N.; review and editing, B.K.N., K.E.T. and P.J.S.; funding acquisition, P.J.S.

Funding

This research was partially supported by funds from the Agriculture and Food Research Initiative Competitive Projects 2012-02355 and 2013-69002-23146, USDA National Institute of Food and Agriculture.

Acknowledgments

This research is a contribution from the Long Term Agroecosystem Research (LTAR) network. The authors wish to recognize ARS technicians Kory Bollinger and Jeff Weik for their assistance in managing the experiment. Mention of trademarks, proprietary products, or vendors does not constitute guarantee or warranty of products by USDA and does not imply its approval to the exclusion of other products that may be suitable. All programs and services of the USDA are offered on a nondiscriminatory basis, without regard to race, color, national origin, religion, sex, age, marital status, or handicap.

Conflicts of Interest

The authors declare no conflict of interest.

References

  1. Archer, S.; Smeins, F.E. Ecosystem-level processes. In Grazing Management: An Ecological Perspective; Heitschmidt, R.K., Stuth, J.W., Eds.; Timber Press: Portland OR, USA, 1991; pp. 109–139. [Google Scholar]
  2. Jenny, H. Factors of Soil Formation: A System for Quantitative Pedology; Dover Publications: Mineola, NY, USA, 1994. [Google Scholar]
  3. Whitehead, D.C. Nutrient Elements in Grassland: Soil-Plant-Animal Relationships; CABI Publishing: New York, NY, USA, 2000. [Google Scholar]
  4. Oades, J.M. The role of biology in the formation, stabilization, and degradation of soil structure. Geoderma 1993, 56, 377–400. [Google Scholar] [CrossRef]
  5. Burke, I.; Lauenroth, W.; Vinton, M.; Hook, P.; Kelly, R.; Epstein, H.; Agular, M.; Robles, M.; Aguilera, M.; Murphy, M.; et al. Plant-soil interactions in temperate grasslands. Biogeochemistry 1998, 42, 121–143. [Google Scholar] [CrossRef]
  6. Hook, P.; Burke, I.C. Biogeochemistry in a shortgrass landscape: Control by topography, soil texture and microclimate. Ecology 2000, 81, 2686–2703. [Google Scholar] [CrossRef]
  7. Norman, M.J.T.; Green, J.O. The local influence of cattle dung and urine upon yield and botanical composition of permanent pasture. J. British Grassl. Soc. 1958, 13, 39–45. [Google Scholar] [CrossRef]
  8. Sheldrick, W.; Syers, J.K.; Lindgard, J. Contribution of livestock excreta to nutrient balances. Nutr. Cycl. Agroecosyst. 2003, 66, 119–131. [Google Scholar] [CrossRef]
  9. Orwin, K.H.; Bertram, J.E.; Clough, T.J.; Condron, L.M.; Sherlock, R.R.; O’Callaghan, M. Short-term consequences of spatial heterogeneity in soil nitrogen concentrations caused by urine patches of different sizes. Appl. Soil Ecol. 2009, 42, 271–278. [Google Scholar] [CrossRef]
  10. Bailey, D.W.; Gross, J.E.; Laca, E.A.; Rittenhouse, L.R.; Coughenor, M.B.; Swift, D.M.; Sims, P.L. Mechanisms that result in large herbivore grazing patterns. J. Range Manag. 1996, 49, 386–400. [Google Scholar] [CrossRef]
  11. Ganskopp, D.C.; Bohnert, D.W. Landscape nutritional patterns and cattle distribution in rangeland pastures. Appl. Anim. Behav. Sci. 2009, 116, 110–119. [Google Scholar] [CrossRef]
  12. Schnyder, H.; Locher, F.; Auerswald, K. Nutrient redistribution by grazing cattle drives patterns of topsoil N and P stocks in a low-input pasture ecosystem. Nutr. Cycl. Agroecosyst. 2010, 88, 183–195. [Google Scholar] [CrossRef]
  13. Augustine, D.J.; Milchunas, D.G.; Derner, J.D. Spatial redistribution of nitrogen by cattle in semiarid rangeland. Rangeland Ecol. Manag. 2013, 66, 56–62. [Google Scholar] [CrossRef]
  14. Saunders, W.H.M. Effects of cow urine and its major constituents on pasture properties. N. Z. J. Agric. Res. 1982, 25, 61–68. [Google Scholar] [CrossRef]
  15. Mathews, B.W.; Sollenberger, L.E.; Nair, V.D.; Staples, C.R. Impact of grazing management on soil nitrogen, phosphorus, potassium, and sulfur distribution. J. Environ. Qual. 1994, 23, 1006–1013. [Google Scholar] [CrossRef]
  16. Barnes, M.K.; Norton, B.E.; Maeno, M.; Malachek, J.C. Paddock size and stocking density affect spatial heterogeneity of grazing. Rangeland Ecol. Manag. 2008, 61, 380–388. [Google Scholar] [CrossRef]
  17. USDA-NRCS. Soil Survey of Canadian County, Oklahoma. Supplement Manuscript; USDA-NRCS and Okla. Agric. Exp. Stn.: Stillwater, OK, USA, 1999.
  18. Northup, B.K.; Phillips, W.A.; Daniel, J.A.; Mayeux, H.S. Managing southern tallgrass prairie: Case studies on grazing and climatic effects. In Proceedings of the 2nd National Conference on Grazing Lands, Nashville, TN, USA, 8–10 December 2003; Theurer, M., Peterson, J., Golla, M., Eds.; Omnipress Inc.: Madison, WI, USA, 2003; pp. 834–890. [Google Scholar]
  19. Phillips, W.A.; Coleman, S.A. Productivity and economic return of three warm-season grass stocker systems of the southern Great Plains. J. Prod. Agric. 1995, 8, 334–339. [Google Scholar] [CrossRef]
  20. Phillips, W.A.; Northup, B.K.; Mayeux, H.S.; Daniel, J.A. Performance and economic returns of stocker cattle on tallgrass prairie under different grazing management strategies. Prof. Anim. Sci. 2003, 19, 416–423. [Google Scholar] [CrossRef]
  21. Goodman, J.M. Physical environments of Oklahoma. In Geography of Oklahoma; Morris, J.W., Ed.; Oklahoma Historical Society: Oklahoma City, OK, USA, 1977; pp. 9–25. [Google Scholar]
  22. Briske, D.D.; Derner, J.D.; Brown, J.R.; Fuhlendorf, S.D.; Teague, W.R.; Havstad, K.M.; Gillen, R.L.; Ash, A.J.; Willms, W.D. Rotational grazing on rangelands: Reconciliation of perception and experimental evidence. Rangeland Ecol. Manag. 2008, 61, 3–17. [Google Scholar] [CrossRef]
  23. Arnold, G.W.; Dudzinski, M.L. Ethology of Free-Ranging Domestic Animals; Elsevier Scientific Publ.: New York, NY, USA, 1979. [Google Scholar]
  24. Grossman, R.B.; Reinsch, T.G. Bulk density and linear extensibility. In Methods of Soil Analysis. Part. 4. Physical Methods; Dane, J.H., Topp, G.C., Eds.; SSSA: Madison, WI, USA, 2002; pp. 201–228. [Google Scholar]
  25. Day, P.R. Particle fractionation and particle size analysis. In Methods of Soil Analysis, Part. I; Black, C.A., Evans, D.D., White, J.L., Ensminger, L.E., Clark, F.E., Eds.; Agronomy Monograph 9; ASA and SSSA: Madison, WI, USA, 1965; pp. 545–567. [Google Scholar]
  26. Nelson, D.W.; Sommers, L.E. Total carbon, organic carbon, and organic matter. In Methods of Soil Analysis: Part. 3. Chemical Methods; Sparks, D.L., Page, A.L., Helmke, P.A., Loeppert, R.H., Eds.; SSSA: Madison, WI, USA, 1996; pp. 961–1010. [Google Scholar]
  27. Steel, R.G.D.; Torrie, J.H. Principles and Procedures of Statistics: A Biometrical Approach, 2nd ed.; McGraw-Hill: New York, NY, USA, 1980. [Google Scholar]
  28. Littel, R.C.; Milliken, G.A.; Stroup, W.W.; Wolfinger, R.D. SAS Systems for Mixed Models; SAS Institute Inc.: Cary, NC, USA, 1996. [Google Scholar]
  29. Patetta, M. Longitudinal Data Analysis with Discrete and Continuous Responses: Course Notes for Instructor-Based Training; SAS Institute Inc.: Cary, NC, USA, 2005. [Google Scholar]
  30. Buol, S.W.; Hole, F.D.; McCracken, R.J. Soil Genesis and Classification, 2nd ed.; Iowa State University Press: Ames, IA, USA, 1980. [Google Scholar]
  31. Daniel, J.A.; Potter, K.N.; Altom, W.; Aljoe, H.; Stevens, R. Long-term grazing density impacts on soil compaction. Trans. ASAE. 2002, 45, 1911–1915. [Google Scholar] [CrossRef]
  32. Northup, B.K.; Daniel, J.A. Distribution of soil bulk density and organic matter along an elevation gradient in central Oklahoma. Trans. ASABE. 2010, 53, 1749–1757. [Google Scholar] [CrossRef]
  33. Williams, R.D.; Ahuja, L.R.; Naney, J.W.; Ross, J.D.; Barnes, B.B. Spatial trends and variability of soil properties and crop yield in a small watershed. Trans. ASAE. 1987, 30, 1653–1660. [Google Scholar] [CrossRef]
  34. Dubeux, J.C.B., Jr.; Sollenberger, L.E.; Vendramini, J.M.B.; Interrante, S.M.; Lira, M.A., Jr. Stocking methods, animal behavior, and soil nutrient redistribution: How are they linked? Crop. Sci. 2014, 54, 2341–2350. [Google Scholar] [CrossRef]
  35. Jones, G.B.; Tracy, B.J. Pasture soil and herbage nutrient dynamics through five years of rotational stocking. Crop. Sci. 2014, 54, 2351–2361. [Google Scholar] [CrossRef]
  36. Haynes, R.J.; Williams, P.H. Nutrient cycling and soil fertility in the grazed pasture ecosystem. Adv. Agron. 1993, 49, 119–199. [Google Scholar]
  37. Dickinson, C.H.; Craig, J. Effects of water on the decomposition and release of nutrients from cow pats. New Phytol. 1990, 115, 139–147. [Google Scholar] [CrossRef]
  38. Underhay, V.H.S.; Dickinson, C.H. Water, mineral and energy fluctuations in decomposing cow pats. J. Br. Grassl. Soc. 1978, 33, 189–196. [Google Scholar] [CrossRef]
  39. Nguyen, M.L.; Goh, K.M. Sulphur cycling and its implications on sulphur fertilizer requirements of grazed grassland ecosystems. Agric. Ecosys. Environ. 1994, 49, 173–206. [Google Scholar] [CrossRef]
Figure 1. Grazing treatment × location interactions in flux of NO3-N in soils; DIFF was significant difference used in means test. Columns with the same letter were not different at P = 0.10.
Agronomy 09 00281 g001
Figure 2. Stocking method × time of year interactions in flux of (A) K and (B) Mg in soils. Diff were significant differences used in means tests. Columns in panels with the same letter were not different at P = 0.10.
Agronomy 09 00281 g002
Figure 3. Stocking method × location interactions in (A) Mg and (B) Ca flux in soils; Diff were significant differences used in means tests. Columns in panels with the same letter were not different at P = 0.10.
Agronomy 09 00281 g003
Table 1. Paddock sizes and distances (±1 SD) between water and locations within paddocks.
PaddockPaddock Locations
Stocking MethodSizeWater0.25 PMP0.7 PMPPMP
(ha)--------------------- (m) ---------------------
Continuous61.0 (±2)2(±1)109(±7)301(±9)435(±8)
Rotational6.7 (±2)2(±1)43(±17)119(±33)174(±29)
HDRG-1×0.42(±1)10(±2)26(±2)37(±2)
HDRG-2×0.22(±1)9(±1)23(±2)35(±2)
Table 2. Descriptive statistics and distribution functions of populations of plant-available macronutrients in soils of paddocks managed under different stocking methods.
Macronutrients
Mineral NNO3-NPSKMgCa
------(µg 10 cm−2 probe 7.5 cm soil depth−1 14 d−1) ------
Statistics
Mean57534.293.92031444292
Std. deviation78746.4191.6142602111
Median 32302.127.41901465307
Minimum210.20.71011326
Maximum48142644.81124.17812770563
Distribution
Skewness3.43.14.03.71.2−0.1−0.2
Kurtosis13.911.219.514.42.3−0.6−0.5
K-S normality0.30.30.30.30.10.10.1
K-S P<0.01<0.01<0.01<0.01>0.2>0.2<0.2
Ln TransformYYYYYNN
Table 3. Mean (±1SD) particle fractions, bulk density, and organic matter of two soil depths (0–7.5 and 7.5–15 cm) in paddocks managed by different stocking methods; 8 samples depth−1 method−1.
Soil Properties
Particle Fractions
StockingClaySiltSandBulk DensityOrganic matter
Method 0–7.57.5–150–7.57.5–150–7.57.5–150–7.57.5–150–7.57.5–15
----------------------- (%) ----------------------------- (Mg m−3) ----------- (g kg−1) -----
Continuous20(5)26(6)34(14)36(10)46(9)38(6)0.99(0.15)1.35(0.15)42(10)34(9)
Rotational20(2)23(2)45(5)46(2)35(5)31(2)0.79(0.17)1.39(0.15)43(13)43(12)
HDRG-1×17(2)21(2)41(4)37(4)42(4)42(4)0.93(0.12)1.29(0.15)33(8)35(7)
HDRG-2×18(2)22(2)55(6)53(3)27(6)25(2)0.92(0.19)1.37(0.10)35(2)35(4)
HDRG-1× and HDRG-2× were high-density rapid-rotation stocking (62 and 123 AU ha−1 for 24 h respectively, each year).
Table 4. Stocking method × paddock location effects on flux of total mineral N in soils; LSD was least significant difference and numbers with the same letter were not different at P = 0.10.
Location
Stocking Method Water0.25 PMP0.7 PMPPMP
---(µg 10 cm−2 probe 7.5 cm soil−1 14 d−1) ---
Continuous31.7 cde27.2 def 23.1 efg25.0 ef
Rotational19.1 fg32.4 cde 61.0 b 42.5 c
HDRG-1×42.3 c22.2 efg 141.1 a61.2 b
HDRG-2×37.5 cd33.9 cde 11.9 g12.2 g
Diff11.9
PMP, pasture mid-point; HDRG-1× and HDRG-2× were high-density rapid-rotation grazing at one and two-times normal stocking density (62 and 123 AU ha−1 d−1, respectively).
Table 5. Stocking method × time of year, and paddock location × time of year, interactions in P flux (µg 10 cm−2 probe 7.5 cm soil depth−1 14 d−1) within soils. Diff were significant differences in means tests; numbers with the same letter were not different (P < 0.10).
Time of Year
Main EffectLevel of EffectSpringSummer
Stocking Method Continuous3.2 bc5.1 ab
Rotational6.7 a2.5 c
HDRG-1×2.4 c2.4 c
HDRG-2×2.3 c2.3 c
Diff2.5
Location Water3.2 b2.5 b
0.25 PMP6.3 a3.3 b
0.7 PMP2.3 b3.6 ab
PMP2.5 b2.3 b
Diff2.7
HDRG-1× and HDRG-2× were high-density rapid-rotation stocking at 62 and 124 AUD ha−1 24 h−1, respectively. PMP, pasture mid-point.
Table 6. Effect of stocking method × paddock location interactions on P flux. Diff was significant difference used in means test; numbers with the same letter were not different (P < 0.10).
Location
Stocking Method Water0.25 PMP0.7 PMPPMP
(µg P 10 cm−2 probe 7.5 cm soil depth−1 14 d−1)
Continuous3.2 cd5.5 a1.6 d1.3 d
Rotational1.5 d4.1 ab3.5 bc1.7 d
HDRG-1×1.3 d2.1 c1.1 d1.4 d
HDRG-2×1.4 d1.2 d1.5 d1.5 d
Diff1.9
PMP, pasture mid-point. HDRG-1× and HDRG-2× were high-density rapid-rotation grazing at one and two-times stocking density (62 and 123 AU ha−1 d−1, respectively).

