Article

Imbalanced Soil Chemical Properties and Mineral Nutrition in Relation to Growth and Yield Decline of Sesame on Different Continuously Cropped Upland Fields Converted Paddy

1
United Graduate School of Agricultural Sciences, Tottori University, 4-101 Koyama Minami, Tottori 680-8553, Japan
2
National Institute of Crop Science, National Agriculture and Food Research Organization (NARO), 2-1-2 Kannondai, Tsukuba, Ibaraki 305-8518, Japan
3
Department of Agricultural Production, Makerere University, P.O. Box 7062 Kampala, Uganda
4
Faculty of Life and Environmental Sciences, Shimane University, Matsue, Shimane 690-8504, Japan
5
Faculty of Agriculture, Tottori University, 4-101 Koyama Minami, Tottori 680-8553, Japan
*
Author to whom correspondence should be addressed.
Agronomy 2019, 9(4), 184; https://doi.org/10.3390/agronomy9040184
Submission received: 25 March 2019 / Accepted: 5 April 2019 / Published: 11 April 2019
(This article belongs to the Section Soil and Plant Nutrition)

Abstract

:
Sesame (Sesamum indicum L.) is an important oilseed crop, but is negatively affected by continuous cropping. There is still a lack of information on the effect of continuous cropping on soil chemical properties and mineral nutrition related to sesame growth and yield decline. Therefore, we investigated sesame growth and yield, nutrient concentration and soil chemical properties on five fields with continuous cropping history: non-continuous cropping (Year 0) and durations of two, four, five and six years on an upland field converted paddy in Tottori, Japan. Results show that plant height significantly decreased by 18.76%, 15.22%, and 13.64% in the Year 4, Year 5 and Year 6 fields, respectively, compared to Year 0. The effect of continuous cropping was more pronounced on the 1000-seed weight decline than seed yield. Compared to Year 0, seed yield decreased by 52.86% in Year 2 with no significant differences among the Year 2, Year 4, Year 5 and Year 6 fields, whereas the 1000-seed weight decreased by 6.68% and 12.20% in the Year 2 and Year 5 fields, respectively, compared to Year 0. Plant leaf tissue N concentration significantly decreased in the Year 2, Year 4 and Year 6 fields compared to Year 0, whereas leaf tissue K concentration decreased in the Year 6 field. The increase in duration of continuous cropping years gradually altered soil chemical properties. Soil pH, exchangeable Ca and Mg and cation exchange capacity (CEC) gradually increased in the long duration of continuous cropping, whereas total N and C, exchangeable NH4+-N, urease, dehydrogenase and catalase activities decreased. Our study suggested that the decrease in soil available N and enzyme activities, and decrease in K nutrition due to competitive ion effect as a result of increase in soil Ca and Mg could possibly contribute to the growth and yield decline of continuous sesame on upland field converted paddy.

1. Introduction

Sesame (Sesamum indicum L.) is an important oilseed crop and widely cultivated in the world for its edible oil and uses in food [1]. In Japan, the production of sesame seed has been on a negligible scale but is gradually increasing after reconsideration as a local specialty crop [2]. However, the domestic production is still low and cannot satisfy the rising demand for sesame seed. Hence, Japan is one of the leading sesame seed importers in the world. In 2016, Japan sesame seed import was estimated at 152,101 tons, second after China (931,159 tons) [3].
With the increase in abandoned paddy fields [4], sesame production is gradually increasing upon conversion of the abandoned fields for sesame cultivation. Given the profitability of sesame seed trade coupled with limited land area, continuous sesame cropping has become popular. Moreover, continuous cropping is one of the agricultural intensification practices towards increasing crop production at the expense of limited arable land [5,6]. However, continuous cropping for more than three years may lead to growth and yield decline in croplands [7]. The mechanisms of growth and yield decline may be associated with changes in nutrient availability, deterioration of soil physicochemical and biological characteristics, phytotoxins accumulation, and soil-borne pathogens [8,9]. This study primarily focused on understanding the changes in soil chemical properties and crop nutrition after long-term continuous cropping of sesame.
Several studies indicate that continuous cropping negatively influences soil chemical properties, nutrient absorption and yield of several crops [10,11,12,13]. For instance, continuous cropping leads to decrease in available K due to removal of K by crops [14]. Panda and Patra [14] reported lower dry matter yield accompanied by decrease in K absorption in the second cropping than in the first cropping cycle attributed to decrease in soluble and exchangeable K contents. In maize case, total organic C, total N, and available P were significantly decreased by seven years of continuous cropping [15]. Furthermore, soils under continuous cropping of garlic and onions for 1, 6–10, 11–15 and 16–20 years showed decrease in pH as well as exchangeable Ca and Mg with increase in the duration of continuous cropping [16]. Kim et al. [16] reported a decrease in exchangeable cation capacity (CEC) due to decrease in the exchangeable cations and an increase in soil available P caused the imbalance of nutrition, leading to yield and quality decline.
In addition to altering soil nutrient status, the effect of continuous cropping may influence soil enzyme activities [10]. Soil enzyme activity is directly or indirectly affected by agricultural practices such as tillage and fertilization, including continuous cropping [17,18]. Soil enzymes are important components of soil as they are related to changes in nutrient status. For instance, soil urease is involved in nutrient cycling, releasing available ammonium nitrogen (NH4+-N) [19]. Soil dehydrogenase plays a significant role in the biological oxidation of soil organic matter by transferring the hydrogen from organic substrates to inorganic acceptors, whereas catalase enzyme is related to soil carbon content and might be a good indicator of soil quality [19,20,21]. However, little is known on the effect of continuous sesame cropping on soil enzymes that could predict changes in the soil quality.
Although continuous cropping negatively affects sesame yield, most studies focus on changes in soil microbial diversity leading to soil borne diseases [22,23]. In addition, studies show that upland fields converted from rice paddy for cultivation of crops that require no constant flooding are often associated with changes in biological, chemical and physical properties [24,25]. Previous studies report that continuous cropping on upland fields converted paddy causes yield decline in other crops, which is partly attributed to changes in nutrient availability [26,27,28]. There is scarce information on changes in the soil chemical properties and mineral nutrition under continuous sesame cropping on upland fields converted paddy.
The purpose of this study was to evaluate the effect of continuous sesame cropping on mineral nutrition and changes in the soil chemical properties while comparing leaf tissue nutrient concentrations, soil nutrient contents including pH, EC and soil enzyme activities related to sesame growth and yield on fields of different durations of continuous cropping on upland field converted paddy.

2. Materials and Methods

2.1. Site Description and Field Weather Condition

The experiment was conducted on fields converted from paddy in Tottori, Japan (35° 29′ N, 134° 07′ E) in 2018. The soil chemical properties of the upland field converted from paddy before sesame cultivation was characterized by pH of 5.4 (1:5, soil/water), electrical conductivity (EC) of 0.05 dS m−1 (1:5, soil/water), total N (TN) of 2.14 g kg−1, total C (TC) of 22.37 g kg−1, C/N ratio of 10.45, available P of 29 mg kg−1, exchangeable K of 248 mg kg−1, exchangeable of Mg 107 mg kg−1, exchangeable Ca of 918 mg kg−1, and cation exchange capacity (CEC) of 10.4 cmolc kg−1.
Sesame was cultivated during the warm summer from June to September 2018. The total monthly rainfall received in June, July, August and September was 109.5, 321.0, 19.5 and 609.5 mm, respectively. The average daily maximum temperatures in June, July, August and September were 24.8, 30.7, 32.4 and 25.8 °C, respectively.

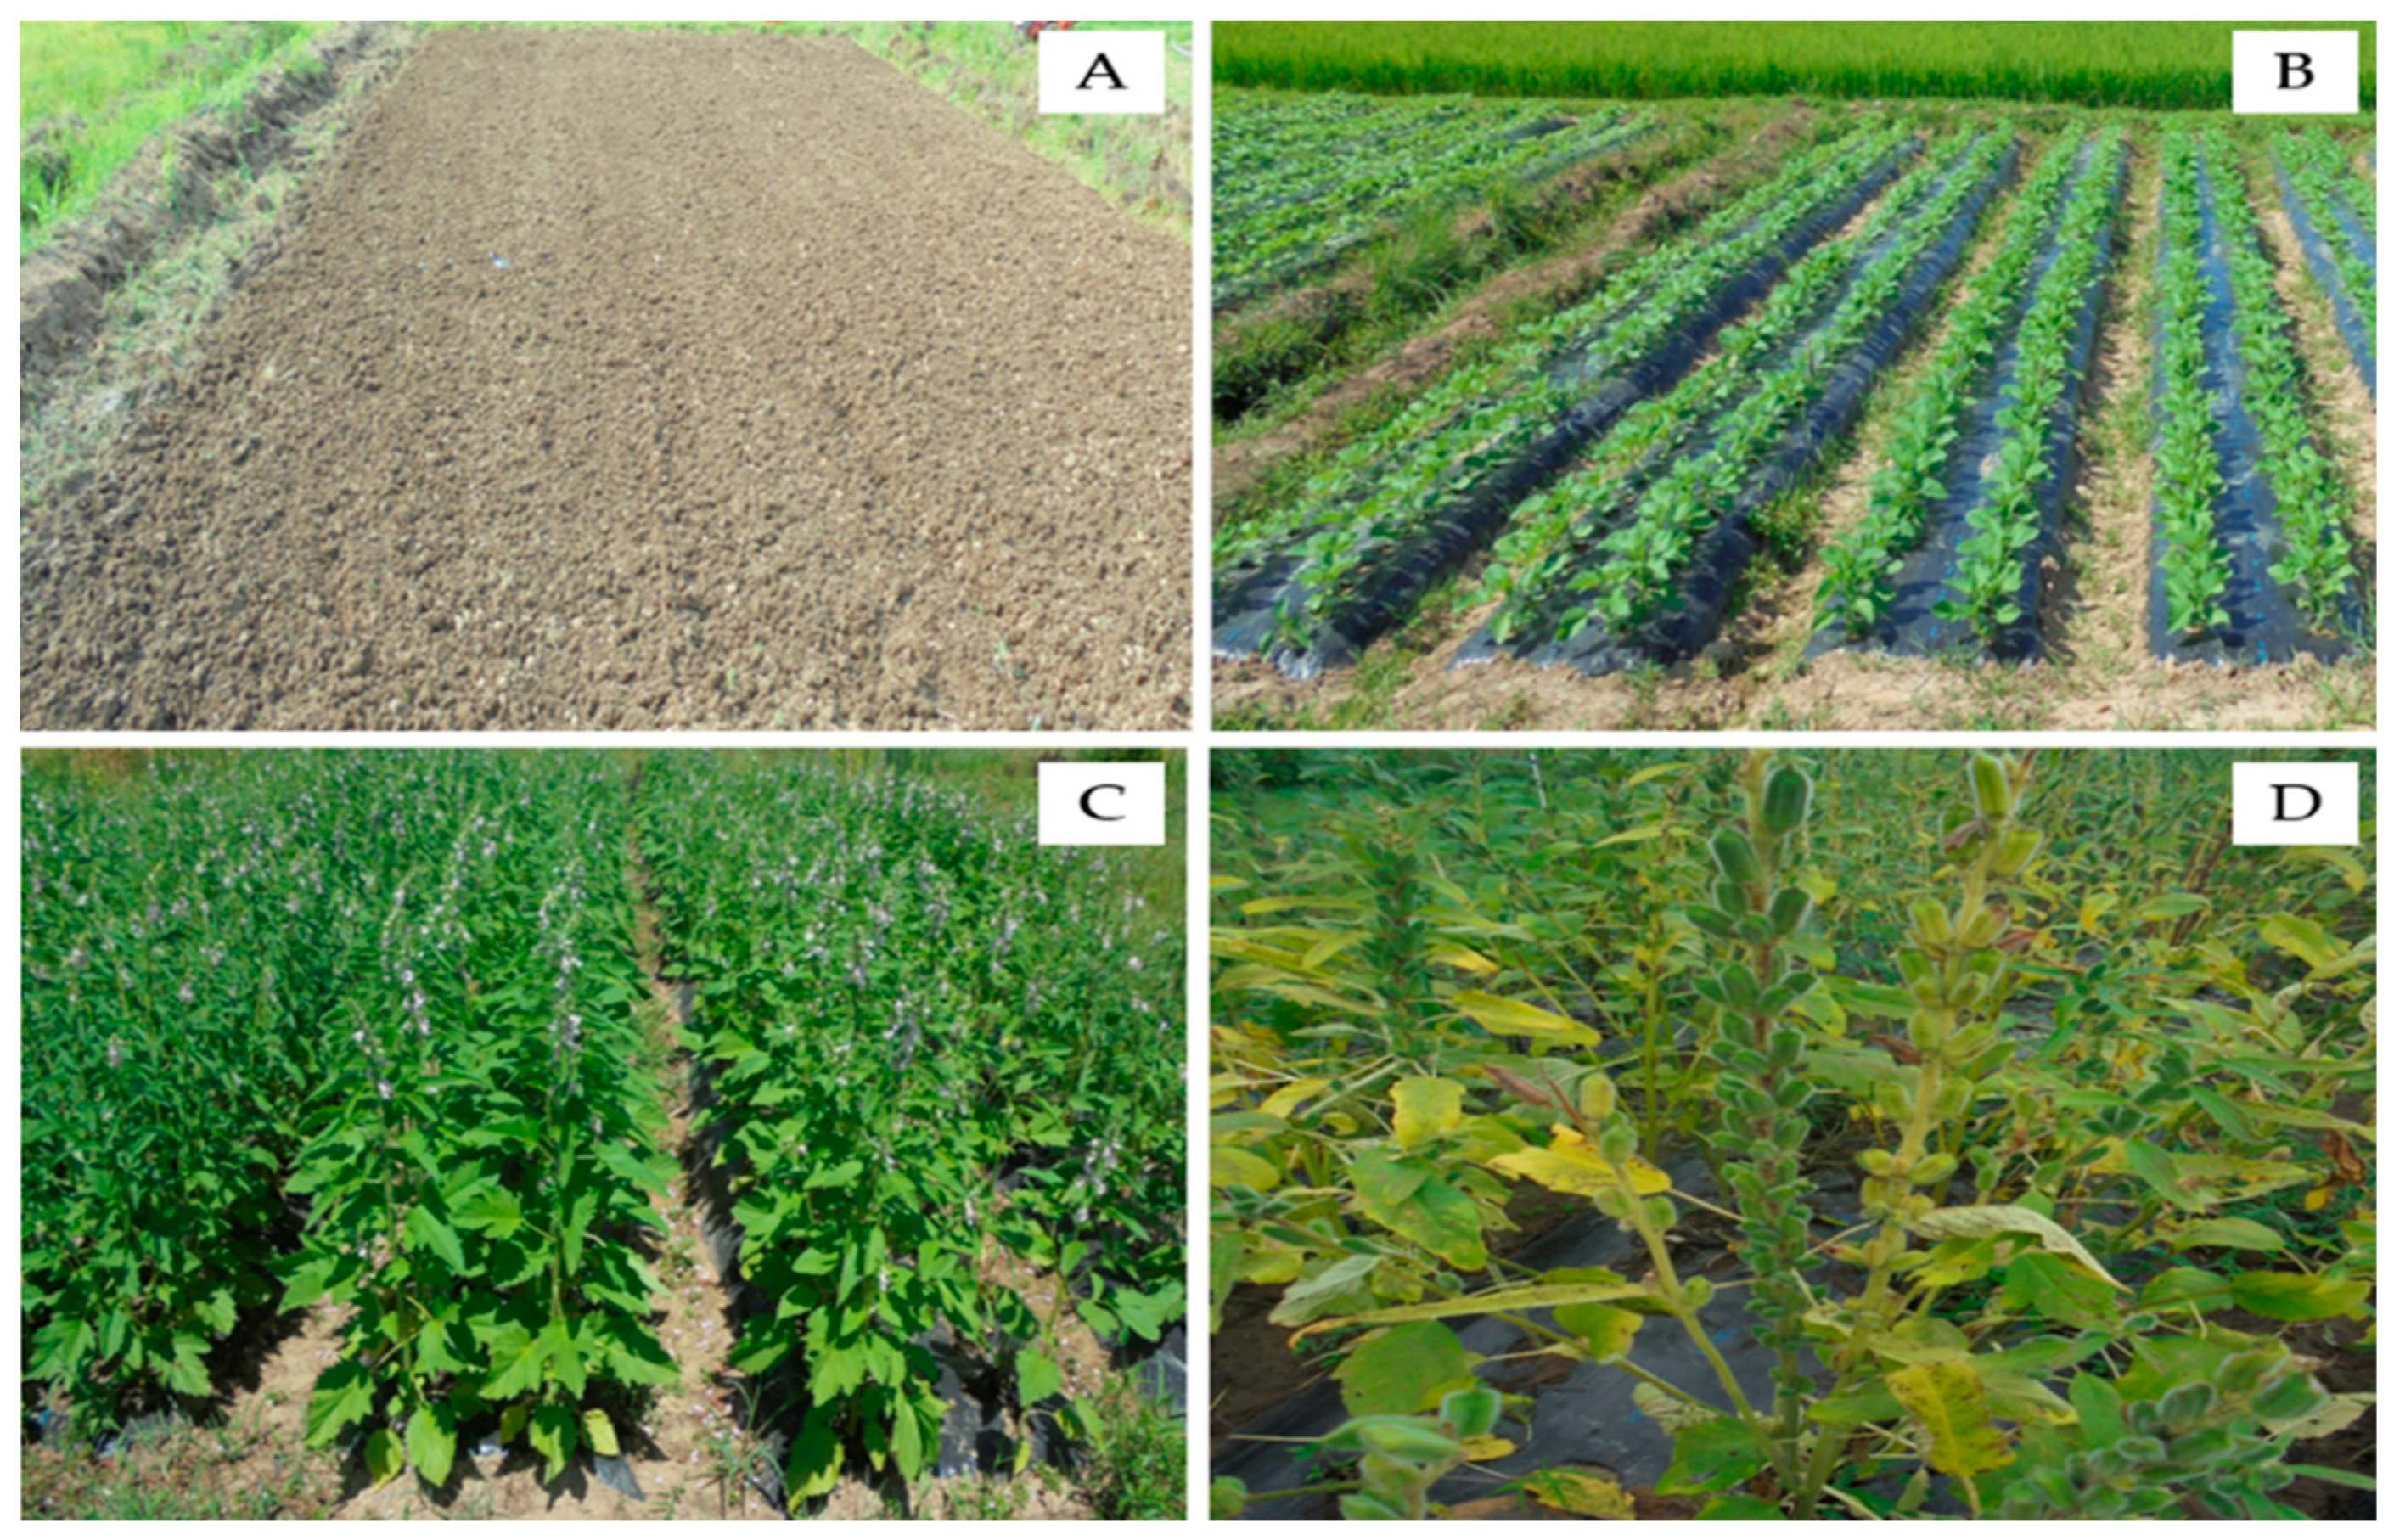
2.2. Field Experimental Design

We compared five different fields with durations of continuous cropping: where sesame had not previously been cropped (non-continuous cropping; Year 0) and where sesame had been cropped for two years (Year 2), four years (Year 4), five years (Year 5), and six years (Year 6). To avoid variation due to different cropping years in terms of environmental conditions, we conducted this experiment in 2018 on these five fields with continuous cropping history. All fields were adjacent to each other and with relatively similar initial soil chemical properties before sesame cultivation.
Briefly, each field measuring 14 m × 6.5 m had previously been divided into micro plots of 3 m × 2.3 m (6.9 m2) to cultivate four sesame cultivars. However, we selected one cultivar for this study. The same agronomic practices of sesame as recommended by the National Agriculture and Food Research Organization (NARO, Japan) was followed from planting methods to inorganic fertilizer application. Inorganic fertilizer N–P2O5–K2O was used at a rate of 70–105–70 kg ha−1 in the form of cyclo-diurea (CDU) compound fertilizer (15%–15%–15%) and triple superphosphate (34%). In addition, CaO and MgO in the form of dolomite (Total alkali, 53%; CaO, 39.1%; and MgO, 10%) were applied at 1000 kg ha−1 before sowing every year to raise soil pH of initially acidic paddy field while supplying Mg and Ca for sesame growth. However, in 2017, the Year 2, Year 4 and Year 6 fields received additional K fertilizer after noticing decreasing levels of soil K content. During each harvest, plants were cut down from the base, and all aboveground crop residues were removed from the fields to minimize fungal and bacterial disease, and release of allelopathic compounds exuded from the residues.
Cultivar “Gomazou” was cultivated on raised ridges (75 cm in width; 40 cm between ridges), onto which double rows of plants were sown at spacing of 45 cm × 15 cm. All ridges were covered with black plastic mulch to maintain soil moisture and temperature and to reduce weed growth (Figure 1). Sowing was done on 9 July 2018 and seedlings thinned to two plants per hole on 16 July 2018 (one week after sowing), and then finally to one plant per hole on 24 July 2018 (two weeks after sowing).

2.3. Growth and Yield Determination

Sesame growth was determined at full maturity stage from the field. Growth was determined by measuring plant height, height of the first capsule and counting the number of branches per plant of ten representative plants per replication on 24 September 2018. Harvesting from Year 2, Year 4, Year 5 and Year 6 fields was done on 28 September 2018 due to early drying of sesame plants while Year 0 field was harvested a week later (5 October 2018). All plants per micro-plot per replication were cut down and taken to dry in a greenhouse at Tottori University. After drying, the samples were threshed to release seeds. Total seed weight harvested per micro plot was then obtained to calculate yield in kg ha−1, whereas 1000-seed weight was determined by weighing 100 mature seeds in triplicate for each replication to extrapolate the weight of 1000 seeds.

2.4. Plant Sampling and Leaf Tissue Nutrient Concentration Analysis

Sesame leaves from ten representative plants per replication were collected at reproductive stage (full bloom) on 23 August 2018 (45 days after sowing). One mature leaf per plant was collected and samples were then oven dried at 72 °C for one week. Prior to analysis, all leaf samples were ground to fine powder and digested with concentrated sulfuric acid (H2SO4, 98%) and hydrogen peroxide (H2O2, 30%) for analysis of leaf tissue P, K, Ca and Mg concentrations. The leaf tissue P concentration was determined by the vanadomolybdate method [29] and the yellow vanadomolybdo-phosphoric acid measured colorimetrically by a spectrophotometer at 420 nm (Model U-5100, Hitachi Co., Tokyo, Japan). Leaf tissue K, Ca, and Mg concentrations were determined using an atomic absorption spectrophotometer (Model Z-2300, Hitachi Co., Tokyo, Japan). The leaf tissue N concentration was determined from the ground sample using the dry combustion method on a CN Corder machine (Macro corder JM 1000CN, J-Science Co., Ltd., Kyoto, Japan).

2.5. Soil Sampling and Analysis

2.5.1. Soil Available Nutrients, pH and EC Values

At harvest, soil samples were collected with a trowel to a depth of 15 cm, air dried, and passed through a 2-mm sieve. Soil suspension (1:5 w/v, soil: water) was used to measure pH with a pH meter and electrical conductivity with an EC meter (AQUA COND METER F-74, Horiba, Ltd., Fukuoka, Japan). Total C and N were analyzed by dry combustion on the CN analyzer (Macro corder JM 1000CN, J-Science Co., Ltd., Kyoto, Japan). For determination of exchangeable ammonium N (NH4+-N) and nitrate N (NO3-N), fresh soil samples were collected after harvest and stored at −80 °C prior analysis. The exchangeable ammonium N (NH4+-N) was extracted with 10% potassium chloride, KCl (1:10, w/v), and extracts determined by indophenol blue method [30], at 693 nm on a spectrophotometer (Model U-5100, Hitachi Co., Japan). The soil NO3-N was extracted with 0.01% aluminum chloride, AlCl3.6H2O (1:100, w/v), and determined by rapid ultraviolet (UV) absorption method [31], at 210 nm on a spectrophotometer. Soil exchangeable K, Ca, and Mg were extracted in 1 N ammonium acetate (pH 7.1), and analyzed by using an atomic absorption spectrophotometer (Z-2300, Hitachi Co., Tokyo, Japan). Cation exchange capacity (CEC) was measured by the 1 N (pH 7.1) ammonium acetate (NH4OAc) extraction method, in which the NH4+ saturated soil was equilibrated with 10% KCl [32], and analyzed colorimetrically using Indophenol blue method [30]. The CEC was calculated and expressed in cmolc kg−1 soil, as shown in Equation (1) [33].
CEC (cmolc kg−1) = (NH4+-N in mg kg−1)/14
Individual cation base saturation (BS%) was calculated from the CEC and the exchangeable cation values. However, Na+ measurement was not considered in the calculation of the base saturation because of very low concentrations (<1% of the CEC in the soil). Soil available P was determined using 0.002 N H2SO4 (pH 3.0) in ammonium sulfate solution according to Truog method [34]. The P concentration in soil samples was measured by the phosphomolybdate blue method [35], at 710 nm on a spectrophotometer (Model U-5100, Hitachi Co., Tokyo, Japan).

2.5.2. Soil Enzyme Activities

Immediately after harvest, soil samples were collected with a trowel to a depth of 15 cm, passed through a 2-mm sieve and stored at −20 °C prior to enzyme analysis. Soil urease activity was determined by the method of Kandeler and Gerber [36]. Briefly, 5 g of fresh soil were mixed with 2.5 mL of 0.72 M aqueous urea and 20 mL of borate buffer at pH 10.0. The samples were incubated at 37 °C for 2 h and then 30 mL of 1 N KCl to 0.01 N HCl solution were added and shaken for 30 min before filtering. The concentration of ammonium released as a result of urease activity was determined by the indophenol blue method [30], at 693 nm on a spectrophotometer (Model U-5100, Hitachi Co., Tokyo, Japan). The urease activity was expressed as μg (g NH4+-N)−1 (g dry soil)−1 2 h−1.
Soil dehydrogenase activity was determined by the iodonitrotetrazolium chloride (INT) method of von Mersi and Schinner [37]. Briefly, 1 g of moist soil was mixed with 1.5 mL of TRIS buffer (1 M, pH 7.0), 2 mL of 0.5% (w/v) aqueous solution of INT (10 mg mL−1), and incubated at 40 °C in dark for 2 h. Then, 10 mL of N, N-Dimethylformamide/ethanol in a 1:1 ratio were added to extract the developed iodonitrotetrazolium formazan (INTF), and samples were kept in the dark for 2 h, and shaken vigorously every 20 min. The absorption of the filtrated was measured at 464 nm on a spectrophotometer (Model U-5100, Hitachi Co., Tokyo, Japan) using INTF (iodonitrotetrazolium formazan) as standard. Soil dehydrogenase activity was expressed as nmol INTF (g dry weight soil)−1 2 h−1.
Soil catalase activity was determined by titrating residual hydrogen peroxide (H2O2) with potassium permanganate (KMnO4) [38]. Briefly, 2 g of fresh moist soil samples were mixed with 5 mL of 0.3% hydrogen peroxides solution (H2O2), shaken on a mechanical shaker at 25 °C for 20 min. Then, 5 mL of 1.5 M H2SO4 solution were added and hand shaken for 30 s. Thirty milliliters of the filtrate were then titrated with 0.02 M KMnO4 until the permanganate solution turned pink, persisting for 30 s, and then the titration was stopped. Catalase activity was expressed as mL of 0.02 M KMnO4 g−1 soil h−1.

2.6. Statistical Analysis

In each duration of continuous cropping, micro-plots were replicated three times. All data were subjected to one-way ANOVA using SPSS version 22.0 (SPSS for windows Inc., Chicago, IL, USA), and means were compared using Tukey’s honestly significant difference (HSD) test at p < 0.05. In addition, principal component analysis (PCA) was performed with SPSS version 22.0 to clarify total data variability with respect to correlations among growth, yield, soil chemical properties parameters and mineral nutrient concentrations in sesame leaf tissue under the different continuous cropping years.

3. Results

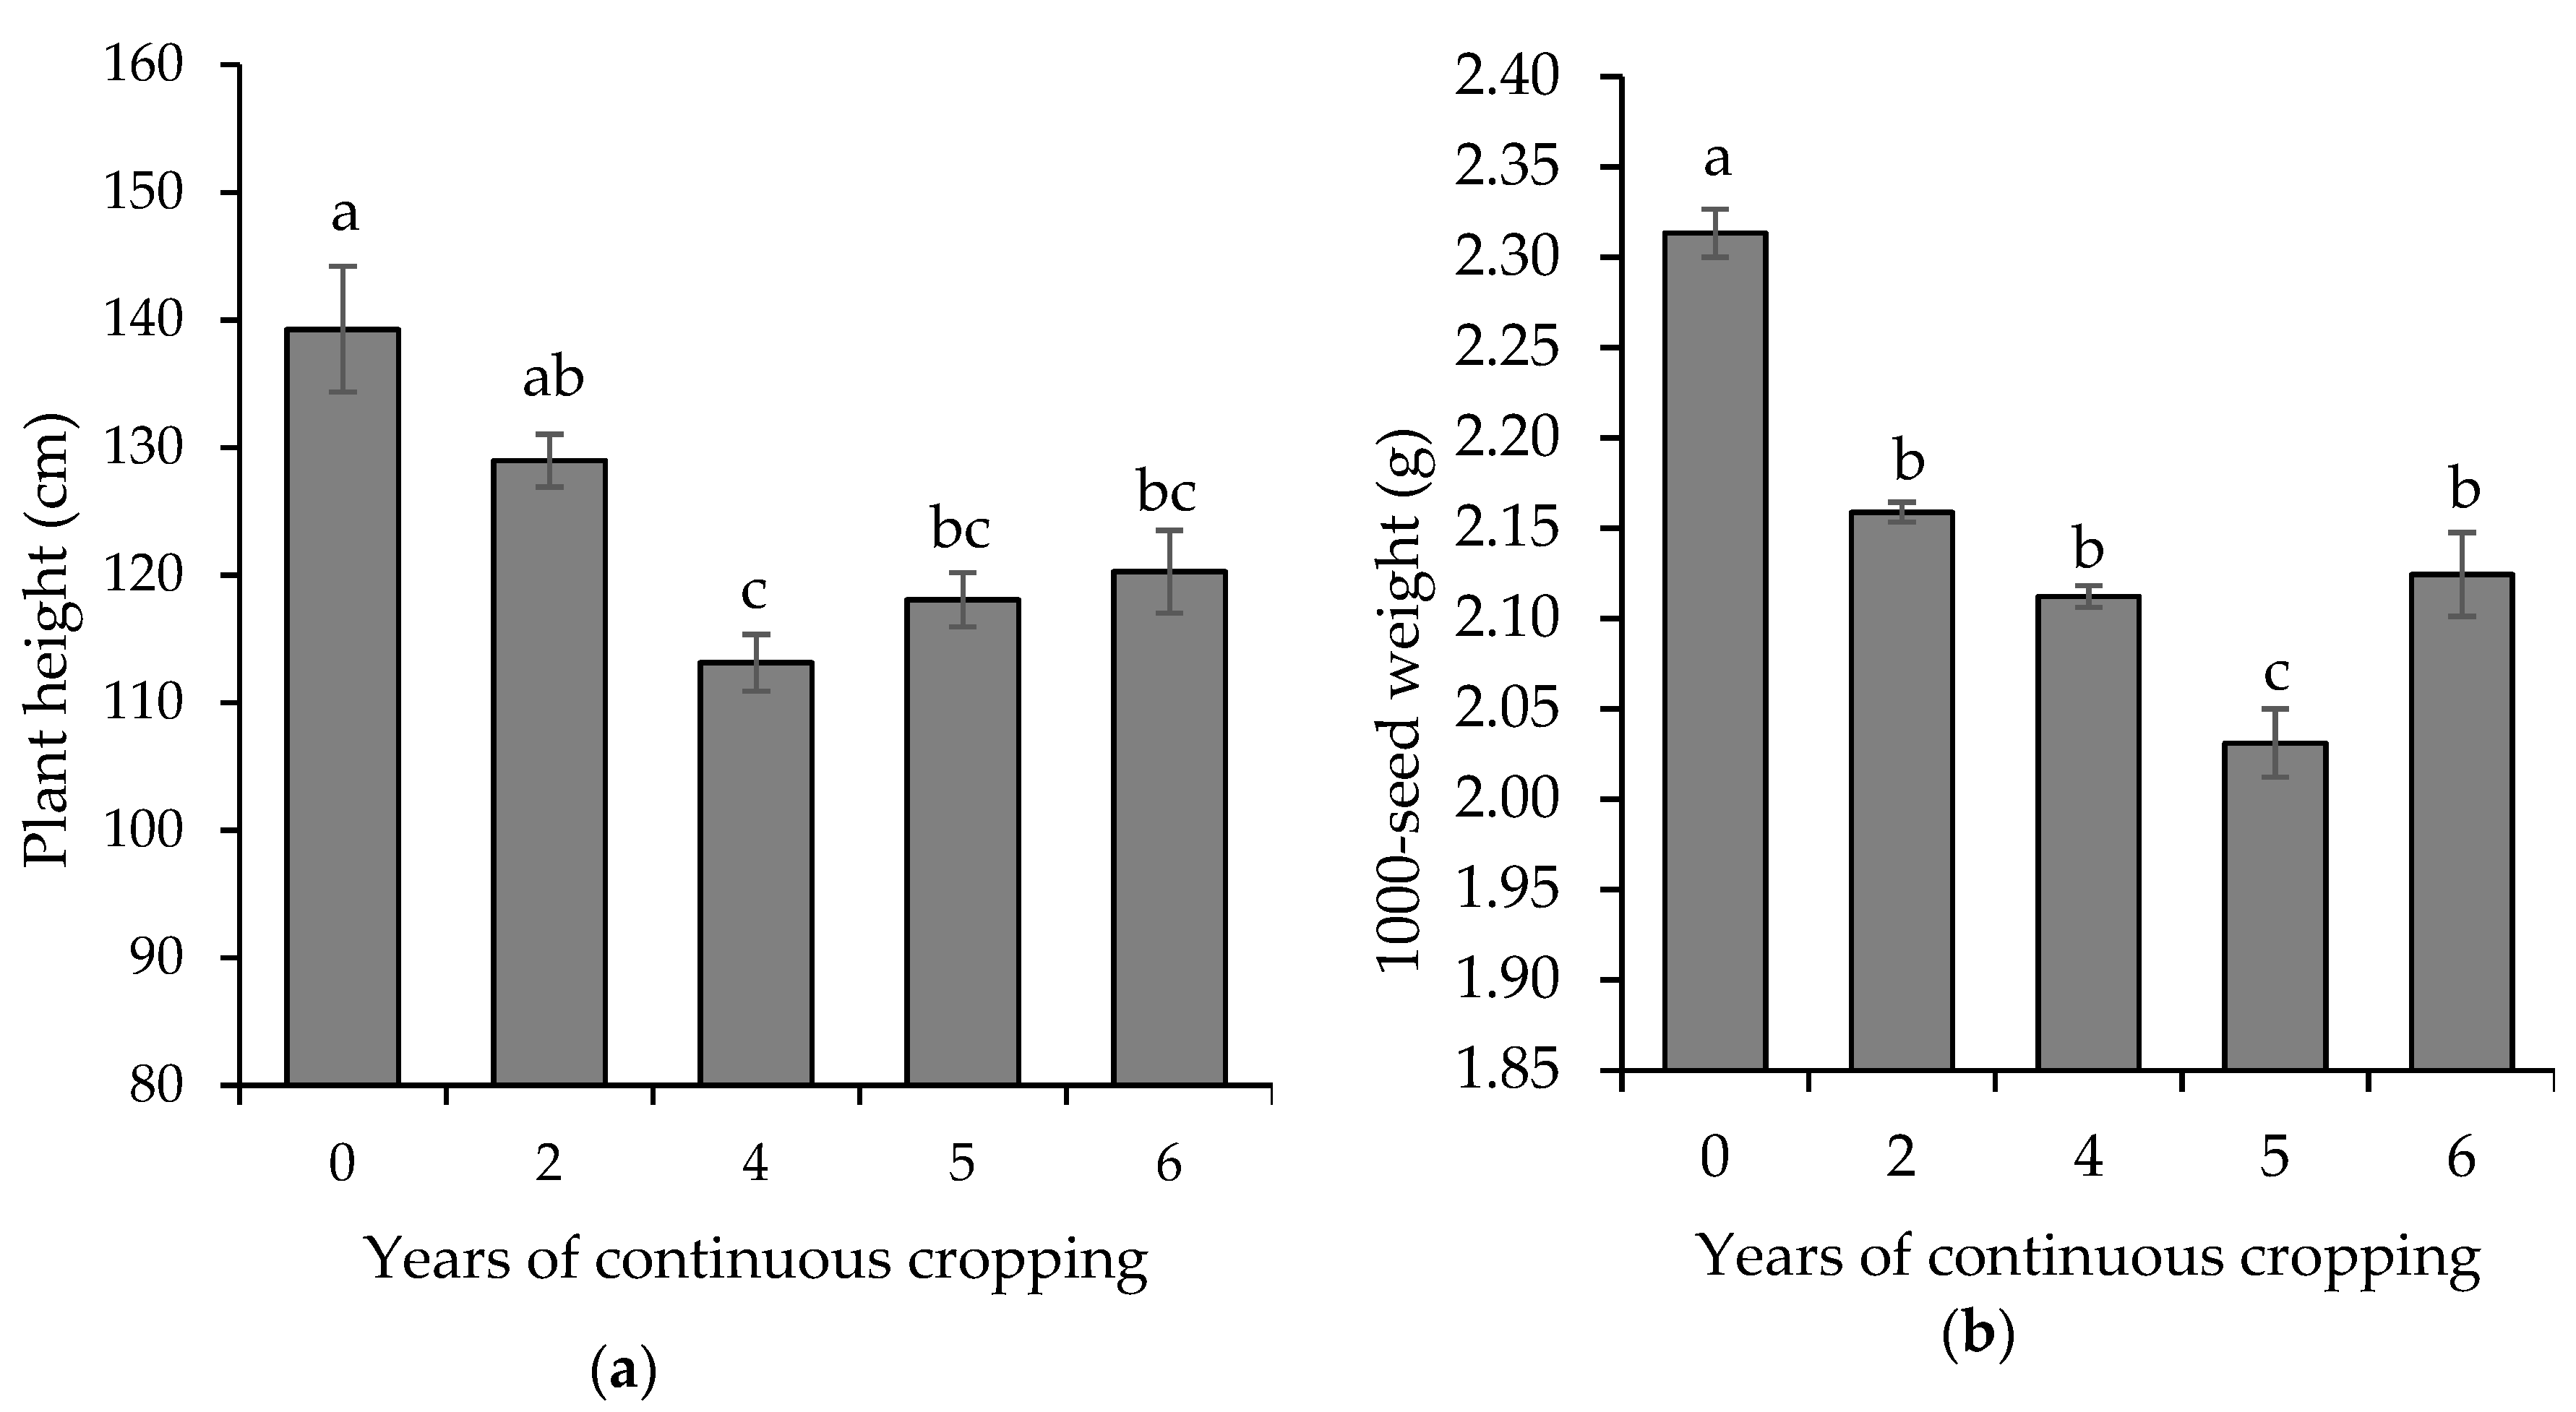
3.1. Effect of Continuous Cropping on Sesame Growth and Yield under the Different Duration of Cropping Years

Continuous cropping significantly decreased sesame plant height, height of the first capsule and the number of branches per plant (Figure 2 and Table 1). Compared to Year 0 (control), plant height significantly (p < 0.001) decreased by 18.76%, 15.22%, and 13.64% in the Year 4, Year 5 and Year 6 fields, respectively. The height of first capsule significantly increased by 5.11% and 1.52% in the Year 2 and Year 6 fields, respectively, whereas a decrease of 16.81% and 7.89% occurred in the Year 4 and Year 5 fields, respectively, compared to Year 0. The number of branches per plant was significantly higher in the Year 2 field, whereas it decreased in Year 4 and Year 5, indicating fewer branches in the long duration of continuous cropping than the short duration.
Continuous cropping significantly decreased sesame seed yield (Table 1) and the 1000-seed weight (Figure 2a). Seed yield (1952 kg ha−1) was highest in Year 0 (non-continuous cropping) and significantly (p < 0.001) decreased in the continuously cropped fields (Table 1). Compared to the Year 0 field, seed yield decreased by 52.86% in Year 2, and no significant differences in the seed yield among the Year 2, Year 4, Year 5 and Year 6 fields was observed. The 1000-seed weight significantly (p < 0.001) decreased with increase in continuous cropping years (Figure 2b). The 1000-seed weight was significantly higher in Year 0 (2.31 g). Compared to the Year 0 field, 1000-seed weight decreased by 6.68% and 12.20% in the Year 2 and Year 5 fields, respectively. However, there were no significant differences among Year 2, Year 4 and Year 6 fields. In addition, the 1000-seed weight tended to recover in the Year 6 field after decreasing in the Year 5 field.

3.2. Effect of Continuous Cropping on Sesame Leaf Tissue Nutrient Concentrations under the Different Duration of Cropping Years

Continuous cropping did not significantly affect leaf tissue P and Mg concentration, whereas leaf tissue N, K and Ca concentrations were significantly affected (Table 2). The leaf tissue N and K concentrations significantly decreased with increase in the duration of continuous cropping. Compared to the Year 0 field (non-continuous cropping), the leaf tissue N concentration significantly (p < 0.01) decreased by 22.10% and 16.27% in the Year 5 and Year 6 fields. However, the Year 0 and Year 2 fields significantly differed from the Year 5 and Year 6 fields in leaf tissue N concentrations, indicating decrease in N concentrations in long duration of continuous cropping.
Similarly, continuous cropping significantly (p < 0.01) decreased leaf tissue K concentration. The leaf tissue K concentrations decreased in the Year 6 field by 46.44% compared to Year 0 (non-continuous cropping). Furthermore, the leaf tissue K concentration in Year 2 was significantly higher than in both Year 5 and Year 6 fields, indicating decrease in K nutrition in the long duration of continuous cropping. Although there were no significant differences in the leaf tissue K concentrations among Year 0, Year 2, Year 4 and Year 5 fields, leaf tissue K concentration tended to decrease gradually with increase in the duration of continuous cropping.
The leaf tissue Ca concentration tended to significantly (p < 0.05) increase in the Year 6 field compared to the Year 5 field. In addition, the leaf tissue Ca concentration of Year 5 field was significantly lower than in the Year 2 field. However, there were no significant differences in the leaf tissue Ca concentration among Year 0, Year 2, Year 4 and Year 5 fields.

3.3. Effect of Continuous Cropping on Soil Chemical Properties under the Different Duration of Cropping Years

The effect of continuous sesame cropping on the soil chemical properties are shown in Table 3 and Table 4. With the exception of soil EC, C/N ratio and NO3-N, all soil macronutrients including base saturations were significantly affected by continuous cropping. Continuous cropping significantly (p < 0.001) increased soil pH from 5.29 in the Year 0 field to 6.30 in the Year 6 field (Table 3). Soil pH gradually increased from Year 2 to Year 5, indicating increase in pH with increase in continuous cropping years. Conversely, soil total C (p < 0.05) and N contents (p < 0.001) contents significantly decreased in the long duration of continuous sesame cropping. Although there were no significant differences among the Year 0, Year 2, Year 4 and Year 5 fields in the soil total C and N contents, Year 6 had significantly lower soil total C and N contents.
Continuous cropping also significantly (p < 0.01) decreased soil exchangeable NH4+-N content. Soil exchangeable NH4+-N was significantly lower in Year 5 (5.84 mg kg−1), followed by Year 6 (5.94 mg kg−1) field compared to the Year 2 field. However, no significant differences between Year 0 and Year 2 or Year 0 and Year 4 in the soil exchangeable NH4+-N content were observed. Although the effect of continuous cropping was not significant on the NO3-N content, there was an overall decrease in the available N content indicated by the decreasing exchangeable NH4+-N content in the Year 6 field compared with Year 0 field. Furthermore, the soil available P content was also significantly (p < 0.001) higher in Year 0 and lower in the continuously cropped fields, indicating tendency of continuous sesame cropping to decrease available P content, although no significant differences among the Year 2, Year 4, Year 5 and Year 6 fields were observed.
Continuous sesame cropping significantly altered the soil exchangeable cations K, Ca and Mg and their base saturations including soil cation exchange capacity and CEC values (Table 4). Although soil exchangeable K content was significantly (p < 0.01) affected, there were no significant differences among the Year 0, Year 5 and Year 6 fields. However, soil exchangeable K content was higher in the Year 2 (250.47 mg kg−1) and Year 4 (229.9 mg kg−1) fields compared to the Year 0 (157.4 mg kg−1) field with no decreasing trend in continuous cropping observed. Both the soil exchangeable Ca and Mg contents significantly (p < 0.001) increased in the Year 5 and Year 6 fields compared to the Year 0 field. Soil exchangeable Ca content increased from 799.12 mg kg−1 in Year 0 to 1478.36 mg kg−1 in Year 2 and 1252.35 mg kg−1 in Year 4. No significant differences in soil exchange Ca content were observed among Year 2, Year 5 and Year 6. Similarly, exchangeable Mg content tended to gradually increase from Year 0 to Year 6 without significant difference among Year 4, Year 5 and Year 6.
Continuous sesame cropping also significantly (p < 0.001) increased the soil CEC values. Soil CEC significantly increased from 10.62 cmolc kg−1 in Year 0 to 11.67 and 11.90 cmolc kg−1 in Year 5 and Year 6 respectively. Continuous sesame cropping also significantly affected the soil cation base saturations. The soil K saturation in the Year 0 field did not significantly differ from Year 4, Year 5 and Year 6. The Year 2 (5.73%) field had significantly higher K saturation compared with the Year 0 (3.80%) field, although no significant difference between Year 2 and Year 4 was observed. The soil Ca and Mg saturations significantly increased in continuous cropping compared to the Year 0 field. The Ca saturation increased from 37.6% in Year 0 to 66.0% and 56.0% in Year 2 and Year 4, respectively, with no significant differences among Year 2, Year 5 and Year 6. Similarly, Mg saturation increased from 15.2% in Year 0 to 20.9% and 26.1% in Year 2 and Year 4, respectively, with no significant differences among Year 4, Year 5 and Year 6.

3.4. Effect of Continuous Sesame Cropping on Soil Enzyme Activities under the Different Duration of Cropping Years

Continuous sesame cropping significantly altered soil enzyme activities (Table 5). Soil urease activity was significantly (p < 0.05) higher in the Year 0 (97.17 μg of NH4+-N g−1 soil 2 h−1) and Year 2 (106.18 μg of NH4+-N g−1 soil 2 h−1) fields than the Year 5 (80.38 μg of NH4+-N g−1 soil 2 h−1) field, indicating a decrease in urease activity due to continuous cropping. However, there were no significant differences in the urease activities among the Year 0, Year 2, Year 4 and Year 6 fields, suggesting a slight recovery in the urease activity. The soil catalase activity was significantly (p < 0.05) decreased in the long duration continuous cropping than in the short duration.
The catalase activity was significantly higher in the Year 4 (6.89 mL of 0.02M KMnO4 g−1 soil h−1) field compared to the Year 6 (4.13 mL of 0.02M KMnO4 g−1 soil h−1) field, indicating a gradual decrease from Year 5 in continuous sesame cropping.
Continuous sesame cropping significantly (p < 0.001) decreased the soil dehydrogenase activity. Soil dehydrogenase activity was significantly higher in the Year 0 field (0.70 INTF μ moles g−1 soil 2 h−1), decreasing with increase in duration of continuous cropping to the lowest value in the Year 5 field (0.39 INTF μ moles g−1 soil 2 h−1). However, the soil dehydrates activity slightly increased in the Year 6 field, although still significantly lower than the Year 0 field.

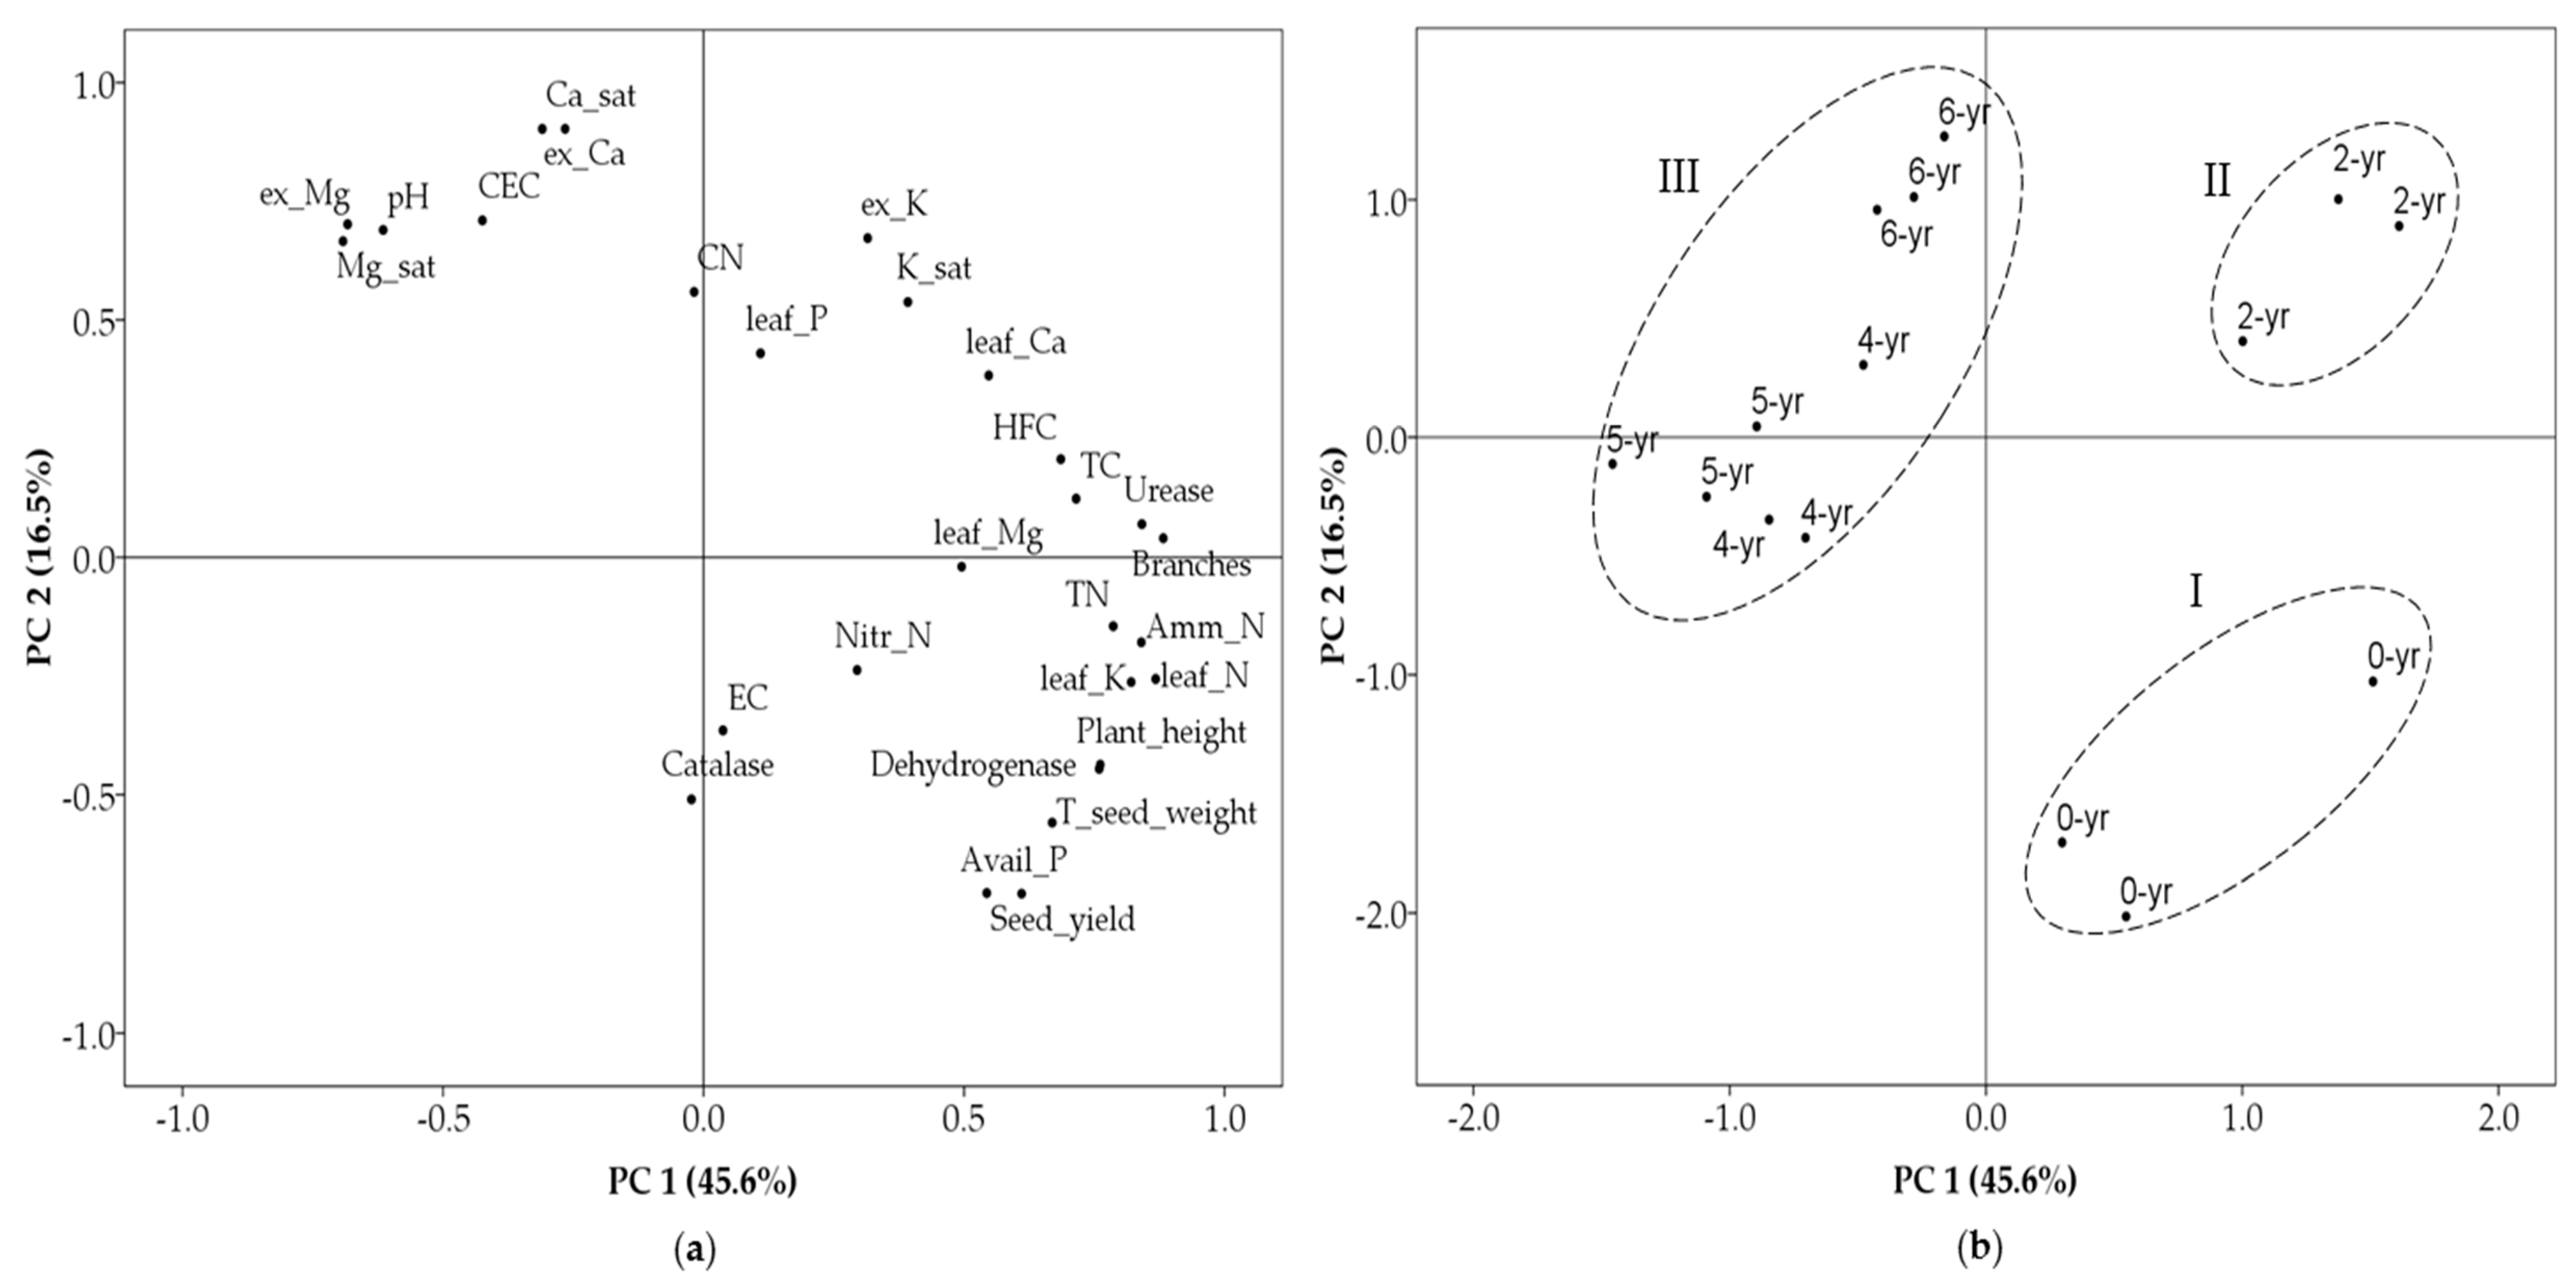
3.5. Relationship among Soil Chemical Properties, Leaf Tissue Nutrient Concentrations, Growth and Yield Decline Parameters under the Different Duration of Cropping Years

Principal component analysis (PCA) was performed to visualize the relationships between the variables and duration of continuous cropping years. The PCA explained 62.1% of the total variance and clustered continuous cropping fields into three distinct groups (I, II and III) (Figure 3a,b). PC 1 accounted for 45.6% of total variance and showed a high positive correlation with soil TN content, total C content, exchangeable NH4+-N content, leaf tissue K concentrations, plant height, number of branches per plant, and soil urease activity that were high in Year 0 (non-continuous cropping field) represented by Group I. Groups I and II, representing variables from Year 0 and Year 2, respectively, were correlated and accounted for the highest variability explained by the PCA in the continuous cropping. PC 2 accounted for 16.5% of total variance among the parameters, and was positively correlated with the soil exchangeable Ca content, CEC and Ca saturation, while negatively correlated with the soil catalase activity and EC. PC 2 was a measure of variability in Group III (mainly Year 6 field) due to the high exchangeable cations including soil pH. Group I (Year 0) differed from continuous cropping Groups II (Year 2) and III (Year 4, Year 5 and Year 6) but Groups I and II, and Groups II and III were strongly correlated. Group III was clustered based on high soil exchangeable Ca, pH, Mg, base saturation, and CEC, whereas Group I due to the high seed yield, 1000-seed weight, number of branches per plant, soil total N and C contents, exchangeable NH4+-N content, leaf tissue K concentration, soil dehydrogenase and urease activity, and Group II due to high height of the first capsule, leaf tissue Ca concentration, and exchangeable K and K saturation.

4. Discussion

4.1. Effect of Continuous Sesame Cropping on Soil Chemical Properties under the Different Duration of Cropping Years

Soil chemical properties, especially pH, total N, and C contents, exchangeable NH4+-N content, available P, exchangeable Ca and Mg contents, CEC values, Ca and Mg saturations, and soil enzyme activities, were significantly altered by continuous sesame cropping, indicating the negative influence of long-term continuous sesame cropping. Similar studies show that continuous cropping can alter soil nutrients and other chemical properties, negatively affecting crop growth and yield [39,40]. Our results show that soil pH gradually increased with the increase in the duration of continuous cropping, suggesting the acidic nature of the upland field converted paddy could be alleviated with sesame cultivation. Kusumawardani et al. [41] reported that conversion of rice paddy fields to upland crop cultivation could increase soil pH attributed to the change in land use and cropping system. However, in our study, the rise in the soil pH was mainly attributed to the continuous addition of dolomite lime containing Ca that greatly increased soil pH. It is reported that dolomite addition to acidic soils results in an increase in soil pH [42]. Our results is contrary to several studies that show continuous cropping of other crops significantly decreases soil pH, attributed to the annual fertilizer application and increase in allelochemicals exuded from roots and decomposing residues that have acidic nature [43,44]. In our study, sesame residues were removed from the fields to prevent occurrence of allelopathy from decomposing residues limiting decrease in pH. Hence, soil pH in different continuous cropping systems depends on the residue management practice and fertilizer use.
Our results also show that continuous sesame cropping significantly decreased the soil total N and C contents in Year 6 compared with Year 2, suggesting long-term continuous sesame cropping could reduce the organic C and N stocks, resulting from nutrient depletion due to the annual crop harvest. In our study, sesame residues after each harvest were removed from each field, thereby decreasing the quantity of organic materials from the continuously cropped fields. Liu et al. [45] reported that decreases in soil organic carbon under continuous cropping could be accelerated by little crop residue return to the soil. Reducing quantities of crop residues decreases organic matter content from soil leading to low total N and C contents decreasing soil quality. Similar decrease in the soil total N and C in continuous cropping have been reported, indicating loss of soil quality [13,15,46]. Hence, with continuous sesame cropping, decreasing levels of total N and C could indicate loss in the soil nutrient status since organic matter is responsible for increasing soil fertility. Moreover, Nishimura et al. [47] reported increase in soil organic matter content in paddy fields under rice cultivation but significantly decreases when a paddy is converted into upland crop cultivation. Furthermore, the decrease in the total N could have caused the decrease in the soil exchangeable NH4+-N content, indicating decrease in available N under long-term continuous sesame cropping. Our findings agree with several studies that show decrease in available N with continuous cropping [10,48,49]. In our study, the decrease in the available N could also be enhanced by leaching of soil nutrients in the upland field converted paddy. Usually, paddy-rice fields are characterized by hard plow pans that prevent leaching and increase the water for plants in the puddled layer when under continuous rice cropping [50]. However, the hard plow pans are easily disintegrated as a result of desiccation of cracks during the dry periods, which leads to increasing percolation of water when converted to upland crop cultivation [25]. Therefore, as the water leaching occurs under percolation, soil nutrients could easily be lost to the subsoil layers [51]. This could be aggravated by increasing duration of continuous sesame cropping whereby the hard pans initially created under rice cultivation are broken by repeated tillage as in continuous cropping.
Although continuous sesame cropping significantly had lower soil available P content than the Year 0 field, the differences could be attributed to the initial soil P status of the freshly opened field rather than continuous cropping. On the other hand, the significantly higher soil exchangeable K content in the Year 2 and Year 4 fields compared to the Year 0 field could be due to the additional K applied into the soil in the previous cropping year. Therefore, both available P and exchangeable K were adequate for sesame growth. Our results also show that soil exchangeable Ca and Mg contents significantly increased in the Year 5 and Year 6 fields compared to the Year 0 field, suggesting long-term duration of continuous sesame cropping under this management practice could lead to build up of base cations on upland fields converted paddy. The increase in Ca and Mg cations including their base saturations could be due to the high quantity of dolomite added annually [42]. In addition, the observed increase in the soil CEC content in the Year 5 and Year 6 fields compared to the Year 0 field could be explained by the increase in Ca and Mg tightly attached on soil colloidal particles. Although soil CEC is a measure of nutrient retention and supply to crops [52], the increase in the soil CEC in our study may not indicate an increase in nutrient availability since soil total N and C contents tended to decrease in continuous sesame cropping. Instead, the increase in the soil CEC values could be attributed to increase in the Ca and Mg ions from dolomitic lime on the soil colloidal particles. It is reported that liming soils can increase CEC since at high soil pH, Ca, Mg and other base cations can be tightly held to the soil [52,53].
Our study also showed that the impact of continuous sesame cropping was significant on enzyme activity, indicating the negative influence of continuous cropping on both the chemical and biological properties of soil. Soil enzymes activities are useful indicators of soil fertility status [54]. In our study, urease activity was significantly lower in Year 5 compared to Year 0, indicating a decrease in N nutrient cycling and release. The decrease in the soil total N could have enhanced the decrease in urease activity that consequently led to the decrease in the available N in the long duration of continuous cropping. Furthermore, soil catalase activity was significantly decreased in Year 6 compared to Year 4, suggesting low levels of substrates such as organic matter in the long duration of continuous cropping. Our results are consistent with previous studies that show continuous cropping of other crops led to decrease in soil enzymes activities [39,43]. Xiong et al. [43] also reported decrease in the urease and catalase activities in continuous black pepper cropping that corresponded with the low organic matter content, limiting the growth. In general, urease and catalase enzymes have a strong co-relationship with soil carbon content and are good indicators of soil quality [21]. Therefore, the decreasing soil total N and C contents in the long duration continuous cropping suggests low organic matter could explain the decrease in the enzyme activities. Moreover, soil dehydrogenase activity was decreased in continuous cropping due to decreasing soil carbon content [45]. In our study, dehydrogenase was significantly higher in the Year 0 field compared to the Year 5 and Year 6 fields, indicating tendency to decrease soil fertility. Our results are consistent with the findings reported that continuous cotton cropping led to decrease in soil enzyme activities indicating a negative impact of continuous cropping on soil function and sustainability [55]. Since increase in the soil enzyme activities is directly related to soil nutrient cycling and availability [10], the low enzyme activities in the long duration of continuous sesame cropping suggests low nutrient availability, especially N that could influence sesame growth and yield.

4.2. Effect of Continuous Sesame Cropping on Leaf Tissue Nutrient Concentrations under the Different Duration of Cropping Years

Continuous sesame cropping significantly affected N and K nutrition in sesame plant that could be directly linked to the growth and yield decline. The leaf tissue N concentration significantly decreased in the Year 2, Year 4 and Year 6 fields compared to the Year 0 field, indicating low uptake of N. Several studies also reported a decrease in N uptake as a result of either limited absorption or depletion in soil N due to continuous monocropping [48,56]. The decrease in the leaf tissue N concentration could be attributed to the decrease in the soil available N that could arise from its depletion in continuous cropping.
Furthermore, there was a decrease in the leaf tissue K concentration in Year 6 compared to Year 0, indicating a gradual decrease in K uptake in long duration of continuous sesame cropping that could negatively influence sesame growth and yield. In our study, the decrease in the leaf tissue K concentration could be caused by competitive ion effect in which absorption of K by sesame plants was hindered by high levels of soil exchangeable Ca and Mg in the long duration of continuous cropping. It is known that high levels of Ca and Mg could affect the uptake of K [57].
The leaf tissue Ca concentration tended to increase in Year 6 compared to Year 5, possibly due to the increase in soil exchangeable Ca indicating its adequate absorption. The leaf tissue P and Mg was unaffected by continuous sesame cropping, signifying these nutrients were adequate in the soil for sesame growth. The significantly lower soil available P in the continuously cropped fields, however, did not affect P nutrition.

4.3. Relationship between Soil Chemical Properties, Leaf Tissue Nutrient Concentrations, Growth and Yield Decline Parameters under the Different Duration of Cropping Years

Increasing duration of continuous cropping years significantly decreased sesame plant height and number of branches per plant, indicating growth decline under continuous cropping. The non-significant difference in the seed yield between the continuously cropped fields but significant differences in the 1000-seed weight could suggest continuous sesame cropping is more pronounced on 1000-seed weight than overall seed yield. Hence, the decreasing 1000-seed weight confirmed that continuous sesame cropping could lead to yield decline in terms of low seed weight. A similar decrease in seed weights is reported for continuous soybean cropping that led to the yield decline [58]. Usually, the overall sesame yield is composed of number of capsules per plant, number of seeds per capsule and the seed weight [59]. Furthermore, plant height and height of the first capsule are all associated with sesame seed yield [60]. With the decrease in 1000-seed weight and plant height under continuous sesame cropping, these two parameters could be the most influenced in continuous cropping other than total seed weight that may be affected by factors such as shattering and loss of seeds during harvesting.
The overall growth and yield decline could be attributed to low uptake of N and K, indicated by the decreasing leaf tissue nutrient concentrations in long duration of continuous sesame cropping. Our findings agree with other studies that show decrease in nutrient absorption can lead to growth and yield decline in continuous cropping [10,11]. Moreover, sesame requires adequate N and K for both dry matter and yield [61,62,63]. These macronutrients are important for growth and any imbalance or inadequate absorption could result in poor growth and consequently yield decline. In our study, sesame growth and yield could have been limited by decrease in N and K nutrition caused by decreasing available N and either decreasing K or poor absorption of K due to competitive ionic effect. Thus, the high growth indicated by increase in plant height and number of branches per plant and yield indicated by increase in 1000-seed weight in Year 0 could indicate sufficient uptake of N and K. It is reported that K deficiency in sesame occurs at levels of K leaf tissue concentration of ≤1.5% and values of 1.5–2.4% show moderate deficiency levels of K. Under low K, sesame plants are smaller primarily because of short internodes [64]. The increase in the leaf tissue K in Year 0 could indicate long internodes in sesame leading to high plant heights. Conversely, the short plants observed in the long duration continuous cropping could have had shorter internodes and fewer branches per plant leading to low growth. The decrease in the 1000-seed weight possibly due to low K uptake could result from low accumulation of photosynthate in sesame plants. K plays a role in photosynthesis because it stimulates activity of ribulose bisphosphate carboxylase [65].
The cause of competitive ion effect could be attributed to large quantities of dolomite added annually. The increase in soil exchangeable Ca and Mg added from dolomite lime and the decrease in the K led to higher Ca. K and Mg/K and Ca/Mg ratios consequently affect availability and uptake of K by sesame plants. Loide [66], reported that incorrect use of lime fertilizers alters the Ca/Mg and Mg/K ratios, which is detrimental to plants and decreases yields. In addition, K deficiency in sesame occurs in soils with high Ca and Mg, which have wide Mg/K and Ca/K ratios, and often results in yield decline [67]. In our study, the cation ratios Ca/K and Mg/K increased with the long duration continuous cropping. For instance, the Ca/K ratio increased from 5.1 in Year 0 to 9.3 in Year 5 and Mg/K from 1.2 in Year 0 to 2.3 in Year 5, suggesting imbalances in soil exchangeable cations. This could be sufficient to hinder absorption of K leading to K deficiency in plants including sesame [68]. A study reported that continuous eggplant leads to yield decline due to imbalance in cation ratios [69]. Yoshimura et al. [69] observed slight chlorosis between the veins of leaves in the middle parts of the plants with chlorotic eggplant leaves containing 2–4% of K and above 2.2% of Mg (K/Mg ratios of 1.3–2.7) being attributed to Mg excess and K deficiency. In our study, the leaf tissue Ca/K increased in Year 6 (0.37) compared to Year 0 (0.15), whereas Mg/K significantly increased from 0.15 in Year 0 to 0.20 in Year 6, indicating excess of Ca and Mg in sesame plant tissue and decrease in K could occur in a long-term continuous sesame under this management practice. Hence, the increase in Mg and Ca in soil led to the excess Mg in sesame plant tissues and near deficiency in K negatively affected sesame yield and growth in the long duration of continuous cropping.
The growth and yield decline in continuous sesame cropping due to low available N and decreased absorption of K as a result of competitive ion effect was further confirmed by the principal component analysis (PCA) that accounted for 62.1% of variability in the data. The short duration of continuous cropping (Year 0) was clearly distinguished from the long durations based on high soil available N, total N, soil enzyme activities, and leaf tissue N and K concentrations that significantly increased sesame growth and 1000-seed weight. The decrease in soil enzyme activities was confirmed by the PCA that showed correlation among soil urease, dehydrogenase, soil total N and C contents, and exchangeable NH4+-N content, suggesting decrease in the soil enzyme activities resulted from decrease in the total N and C contents. Urease enzyme plays a role in hydrolyzing urea to CO2 and NH3, thereby releasing ammoniacal N for plants after urea fertilization [70]. In our study, urease activity was significantly lower in the long duration continuous cropping, suggesting decrease in the available N as a result of decrease in hydrolysis of urea fertilizer. Furthermore, the high dehydrogenase activity in Year 0 and significantly lower activity in Year 5 indicated loss in soil organic matter that directly influenced soil fertility. Moreover, significant positive correlation existed among soil total organic carbon, organic matter and dehydrogenase activity [71]. Hence, under continuous cropping of sesame, the loss in the total C and N reflecting low organic matter content could suggest low mineralization of nutrients leading to decreasing growth and yield.
In addition, the PCA confirmed that, with increase in continuous sesame cropping under this management, a gradual build-up of soil exchangeable Ca and Mg from dolomite could occur, leading to competitive ion effect. This was evidenced by the negative correlation between exchangeable Ca and Mg, and 1000-seed weight and plant height in the long duration of cropping, as indicated by the PCA. Although dolomite lime was intended to increase soil pH to alleviate acidity, the plant height and 1000-seed of sesame were significantly higher in the Year 0 with low pH compared to Year 5 or Year 6 with high pH, indicating that growth and yield of sesame was not influenced by the change in the soil pH. It is reported that sesame growth can be favorable at pH range of 5.0–8.0 [72]. This further suggests that a one-time application of dolomite in the first cropping season could be sufficient for sesame growth. Hence, it may not be necessary to increase soil pH with dolomite in subsequent cropping since the soil pH of the non-continuous cropping field was in the range preferred by sesame. However, it is important to identify alternative sources of Mg and Ca fertilizer for sesame cropping on upland field converted paddy to avoid competitive ionic effect in continuous cropping. The increase in the soil Ca and Mg limiting absorption of K by sesame plants could suggest that erroneous fertilization practice is one of the possible causes of growth and yield in continuous cropping of several crops including sesame. This could also suggest that fertilization programs in continuous cropping should consider balancing nutrients to overcome imbalances while managing N availability. Therefore, adequate N and increasing K availability could be the most important factors in maintaining high sesame growth and yield on upland field converted paddy under continuous cropping.

5. Conclusions

Our study showed that continuous sesame cropping could lead to decreasing N availability and decreased absorption of K. Results show a decrease in soil total N and C contents, soil enzyme activities, and leaf tissue N and K concentrations that led to the decrease in plant height and 1000-seed weight of sesame in the long duration of continuous cropping. The gradual decrease in soil urease and dehydrogenase including catalase activities showed a decrease in the available nutrients in the long duration continuous sesame cropping. For instance, urease activity was significantly lower in the Year 5 field compared to the Year 0 field, suggesting decrease in N cycling and its release for sesame growth. Our results also show that the large quantities of soil exchangeable Ca and Mg from dolomite application led to competitive ion effect causing decrease in absorption of K, as indicated by the low leaf tissue K concentration in Year 6 compared to Year 0. The decrease in the leaf tissue N was caused by decreasing soil available N that could rapidly be depleted through annual cropping of sesame without returning residue back to the soil. The low leaf tissue K concentration was attributed to increased levels of Ca and Mg as a result of large dolomite addition. Our results also suggest that possible N and K deficiency leading to decrease sesame productivity could occur if continuous sesame cropping is prolonged on upland fields converted paddy. Therefore, further research should focus on increasing N availability and establishing appropriate use of dolomite lime in continuous sesame cropping on upland field converted paddy for sustainable sesame production.

Author Contributions

C.W., N.O., M.K. and E.N. conceived and designed the experiment; C.W., D.B., T.I., D.S., and T.H. performed the experiments; C.W. and D.B. analyzed the data; T.M., S.Y. and E.N. supervised the research and contributed in the discussion of the results; M.M.T. contributed in the discussion of the results; C.W. wrote the paper; and C.W. and E.N. revised the final draft manuscript.

Funding

This research received no external funding.

Acknowledgments

We are grateful for the support from the Ministry of Education, Culture, Sports, Science and Technology (MEXT) of Japan under the Japanese Government MEXT scholarship of the first author.

Conflicts of Interest

The authors declare no conflict of interest.

References

  1. Ashri, A. Sesame. In Oil Crops of the World; Robbelen, G., Downey, R.K., Ashri, A., Eds.; McGraw–Hill: New York, NY, USA, 1989; pp. 375–387. [Google Scholar]
  2. Yasumoto, S.; Katsuta, M. Breeding a high-lignan-content sesame cultivar in the prospect of promoting metabolic functionality. Jpn. Agric. Res. Q. 2006, 40, 123–129. [Google Scholar] [CrossRef]
  3. FAOSTAT. Food and Agriculture Statistical Database. 2016. Available online: http://www.fao.org/faostat/en/#data/TP (accessed on 1 March 2019).
  4. MAFF. FY2013 Annual Report on Food, Agriculture and Rural Areas in Japan Summary Ministry of Agriculture, Forestry and Fisheries; MAFF: Tokyo, Japan, 2014.
  5. Alexandratos, N.; Bruinsma, J. World agriculture towards 2030/2050: The 2012 Revision; ESA Working paper No. 12-03; FAO: Rome, Italy, 2012. [Google Scholar]
  6. Tilman, D.; Balzer, C.; Hill, J.; Befort, B.L. Global food demand and the sustainable intensi fi cation of agriculture. Proc. Natl. Acad. Sci. USA 2011, 108, 20260–20264. [Google Scholar] [CrossRef] [PubMed]
  7. Huang, L.; Song, L.; Xia, X. Plant-Soil Feedbacks and Soil Sickness: From Mechanisms to Application in Agriculture. J. Chem. Ecol. 2013, 232–242. [Google Scholar] [CrossRef] [PubMed]
  8. Ventura, W.; Watanabe, I. Growth inhibition due to continuous cropping of dryland rice and other crops. Soil Sci. Plant Nutr. 2012, 37–41. [Google Scholar] [CrossRef]
  9. Gentry, L.F.; Ruffo, M.L.; Below, F.E. Identifying Factors Controlling the Continuous Corn Yield Penalty. Agron. J. 2013, 295–303. [Google Scholar] [CrossRef]
  10. Wang, M.; Wu, C.; Cheng, Z.; Meng, H.; Zhang, M.; Zhang, H. Soil Chemical Property Changes in Eggplant/Garlic Relay Intercropping Systems under Continuous Cropping. PLoS ONE 2014, 9, e111040. [Google Scholar] [CrossRef]
  11. Ye, X.H.; Zhao, Z.L.; Zhou, Q.; Zhao, H.B.; Guo, C.M.; Shi, L.L.; Guo, J.W. Malabsorption of mineral nutrients and effects of foliar fertilization on continuously cropped capsicum annum L. var. annuum. Pak. J. Bot. 2014, 46, 1781–1788. [Google Scholar]
  12. Zhou, X.; Wu, F. Changes in soil chemical characters and enzyme activities during continuous monocropping of cucumber (Cucumis sativus). Pakistan J. Bot. 2015, 47, 691–697. [Google Scholar]
  13. Zhong, S.; Mo, Y.; Guo, G.; Zeng, H.; Jin, Z. Effect of Continuous Cropping on Soil Chemical Properties and Crop Yield in Banana Plantation. J. Agric. Sci. Technol. 2014, 16, 239–250. [Google Scholar]
  14. Panda, R.; Patra, S.K. Depletion and Contribution Pattern of Available Potassium in Indian Coastal Soils under Intensive Cropping and Fertilization. Int. J. Pure Appl. Biosci. 2017, 5, 1144–1152. [Google Scholar] [CrossRef]
  15. Wyngaard, N.; Echeverria, H.E.; Sainz Rozas, H.R.; Divito, G.A. Fertilization and tillage effects on soil properties and maize yield in a Southern Pampas Argiudoll. Soil Tillage Res. 2012, 119, 22–30. [Google Scholar] [CrossRef]
  16. Kim, H.; Yun, B.; Choi, H.; Park, I.; Kim, S. Soil Chemical and Biological Characteristic of the Continuous Cropping Area of Garlic or Onions. Agric. Chem. Biotechnol. 2003, 46, 114–117. [Google Scholar]
  17. Gong, L.; He, G.; Liu, W. Long-Term Cropping Effects on Agricultural Sustainability in Alar Oasis of Xinjiang, China. Sustainability 2016, 8, 61. [Google Scholar] [CrossRef]
  18. Bowles, T.M.; Acosta-martínez, V.; Calderón, F.; Jackson, L.E. Soil enzyme activities, microbial communities, and carbon and nitrogen availability in organic agroecosystems across an intensively-managed agricultural landscape. Soil Biol. Biochem. 2014, 68, 252–262. [Google Scholar] [CrossRef]
  19. Sherene, T. Role of soil enzymes in nutrient transformation: A review. Bio Bull. 2017, 3, 109–131. [Google Scholar]
  20. Salazar, S.; Sánchez, L.E.; Alvarez, J.; Valverde, A.; Galindo, P.; Igual, J.M.; Peix, A.; Santa-regina, I. Correlation among soil enzyme activities under different forest system management practices. Ecol. Eng. 2011, 37, 1123–1131. [Google Scholar] [CrossRef]
  21. Wang, Q.; Xiao, F.; He, T.; Wang, S. Responses of labile soil organic carbon and enzyme activity in mineral soils to forest conversion in the subtropics. Ann. For. Sci. 2013, 70, 579–587. [Google Scholar] [CrossRef]
  22. Hua, J.L.; Liu, G.R.; Huang, J.S. Effect of continuous cropping of sesame on rhizospheric microbial communities. Acta Ecol. Sin. 2012, 32, 2936–2942. [Google Scholar]
  23. Nam, S.Y.; Kim, I.J.; Kim, M.J.; Kang, H.J.; Yun, T.; Rho, C.W.; Min, K.B.; Lee, C.H. Effects of green manure crops and rotational cropping system on growth and yield of sesame (Sesamum indicum L.). Korean J. Plant Res. 2007, 20, 404–408, (In Korean with English abstract). [Google Scholar]
  24. Linh, T.B.; Sleutel, S.; Elsacker, S.V.; Guong, V.T.; Khoa, L.V.; Cornelis, W.M. Inclusion of upland crops in rice-based rotations affects chemical properties of clay soil. Soil Use Manag. 2015, 31, 313–320. [Google Scholar] [CrossRef]
  25. Zhou, W.; Lv, T.; Chen, Y.; Westby, A.P.; Ren, W. Soil Physicochemical and Biological Properties of Paddy-Upland Rotation: A Review. Sci. World J. 2014, 2014, 856352. [Google Scholar] [CrossRef]
  26. Nishida, M. Decline in Fertility of Paddy Soils Induced by Paddy Rice and Upland Soybean Rotation, and Measures against the Decline. Jpn. Agric. Res. Q. 2016, 50, 87–94. [Google Scholar] [CrossRef]
  27. Hattori, M.; Nagumo, Y.; Sato, T.; Fujita, Y.; Higuchi, Y.; Ohyama, T. Effect of continuous and long-term paddy-upland rotation on yield reduction of soybean in Niigata Prefecture, Japan. Jpn. J. Crop Sci. 2013, 82, 11–17, (In Japanese with English abstract). [Google Scholar] [CrossRef]
  28. Matsumoto, S.; Yoshikawa, M. Influence of continuous cropping on yield o black soybean (Glycine max Merr. Cv. Shintanbaguro) and soil chemical properties of soils in the field converted from paddy. Jpn. J. Crop Sci. 2010, 79, 268–274, (In Japanese with English abstract). [Google Scholar]
  29. Cavell, A.J. The colorimetric determination of phosphorus in plant materials. J. Sci. Food Agric. 1955, 6, 479–480. [Google Scholar] [CrossRef]
  30. Maynard, D.G.; Kalra, Y.P. Nitrate and Exchangeable Ammonium Nitrogen. In Soil Sampling and Methods of Analysis; Canadian Soceity of Soil Science: Boca Raton, FL, USA, 1993; pp. 25–33. [Google Scholar]
  31. Yamaki, A. A rapid UV absorption method for determination of nitrate in soil extracts. Jpn. J. Soil Sci. Plant Nutr. 2003, 74, 195–197. (In Japanese) [Google Scholar]
  32. Chapman, H.D. Cation–exchange capacity. In Methods of Soil Analysis–Chemical and Microbiological Properties; Black, C.A., Ed.; American Society of Agronomy: Madison, CT, USA, 1965; pp. 891–901. [Google Scholar]
  33. Ross, D.S.; Ketterings, Q. Recommended Methods for Determining Soil Cation Exchange Capacity. In Recommended Soil Testing Procedures for the Northeastern United States, Northeast Regional Bulletin No. 493, 3rd ed.; Wolf, A., McGrath, J., Eds.; Agricultural Experiment Stations of Connecticut: New Haven, CT, USA, 2011; pp. 75–86. [Google Scholar]
  34. Truog, E. The determination of the readily available phosphorous of soils. Agron. J. 1930, 22, 874–882. [Google Scholar] [CrossRef]
  35. Murphy, J.; Riley, J.P. A modified single solution method for determination of phosphate in natural waters. Anal. Chim. Acta 1962, 27, 31–36. [Google Scholar] [CrossRef]
  36. Kandeler, E.; Gerber, H. Short-term assay of soil urease activity using colorimetric determination of ammonium. Biol. Fertil. Soils 1988, 6, 68–72. [Google Scholar] [CrossRef]
  37. Von Mersi, W.; Schinner, F. An improved and accurate method for determining the dehydrogenase activity of soils with iodonitrotetrazolium chloride. Biol. Fertil. Soils 1991, 11, 216–220. [Google Scholar] [CrossRef]
  38. Goldblith, S.A.; Proctor, B.E. Photometric determination of catalase activity. J. Biol. Chem. 1950, 187, 705–709. [Google Scholar]
  39. Sun, J.; Zou, L.; Li, W.; Wang, Y.; Xia, Q.; Peng, M. Soil microbial and chemical properties influenced by continuous cropping of banana. Sci. Agric. 2018, 75, 420–425. [Google Scholar] [CrossRef]
  40. Zhao, Q.; Xiong, W.; Xing, Y.; Sun, Y.; Lin, X.; Dong, Y. Long-Term Coffee Monoculture Alters Soil Chemical Properties and Microbial Communities. Sci. Rep. 2018, 8, 6116. [Google Scholar] [CrossRef]
  41. Kusumawardani, P.N.; Cheng, W.; Purwanto, B.H.; Utami, S.N.H. Changes in the soil pH, EC, available P, DOC and inorganic N after land use change from rice paddy in NorthEast Japan. J. Wetl. Environ. Manag. 2017, 5, 53–61. [Google Scholar] [CrossRef]
  42. Anderson, N.P.; Hart, J.M.; Sullivan, D.M.; Christensen, N.W.; Horneck, D.A.; Pirelli, G.J. Applying Lime to Raise Soil pH for Crop Production (Western Oregon); Oregon State University Extension Publication EM: Corvallis, OR, USA, 2013; p. 9057. [Google Scholar]
  43. Xiong, W.; Li, Z.; Liu, H.; Xue, C.; Zhang, R.; Wu, H. The Effect of Long-Term Continuous Cropping of Black Pepper on Soil Bacterial Communities as Determined by 454 Pyrosequencing. PLoS ONE 2015, 1–13. [Google Scholar] [CrossRef]
  44. Li, X.; Lewis, E.E.; Liu, Q.; Li, H.; Bai, C.; Wang, Y. Effects of long-term continuous cropping on soil nematode community and soil condition associated with replant problem in strawberry habitat. Sci. Rep. 2016, 6, 30466. [Google Scholar] [CrossRef]
  45. Liu, X.; Herbert, S.J.; Hashemi, A.M.; Zhang, X.; Ding, G. Effects of agricultural management on soil organic matter and carbon transformation—A review. Plant Soil Environ. 1994, 52, 531–543. [Google Scholar] [CrossRef]
  46. Reeves, D.W. The role of soil organic matter in maintaining soil quality in continuous cropping systems. Soil Tillage Res. 1997, 43, 131–167. [Google Scholar] [CrossRef]
  47. Nishimura, S.; Yonemura, S.; Sawamoto, T.; Shirato, Y.; Akiyama, H.; Sudo, S.; Yagi, K. Effect of land use change from paddy rice cultivation to upland crop cultivation on soil carbon budget of a cropland in Japan. Agric. Ecosyst. Environ. 2008, 125, 9–20. [Google Scholar] [CrossRef]
  48. Nie, L.; Peng, S.; Bouman, B.A.M.; Huang, J. Alleviating soil sickness caused by aerobic monocropping: Responses of aerobic rice to nutrient supply. Field Crops Res. 2008, 107, 129–136. [Google Scholar] [CrossRef]
  49. Horst, W.J.; Hardter, R.P. Rotation of maize with cowpea improves yield and nutrient use of maize compared to maize monocropping in an alfisol in the northern Guinea Savanna of Ghana. Plant Soil 1994, 160, 171–183. [Google Scholar] [CrossRef]
  50. Janssen, M.; Lennartz, B. Horizontal and vertical water and solute fluxes in paddy rice fields. Soil Tillage Res. 2007, 94, 133–141. [Google Scholar] [CrossRef]
  51. Katoh, M.; Murase, J.; Hayashi, M.; Matsuya, K. Nutrient leaching from the plow layer by water percolation and accumulation in the subsoil in an irrigated paddy field. Soil Sci. Plant Nutr. 2011, 50, 721–729. [Google Scholar] [CrossRef]
  52. Jones, C.; Jacobsen, J. Plant Nutrition and Soil Fertility; Nutrient Management Module No. 2; Montana State University, Extension Service: Bozeman, MT, USA, 2001. [Google Scholar]
  53. Bolan, N.S.; Adriano, D.C.; Curtin, D. Soil acidification and liming interactions with nutrient and heavy metal transformation and bioavailability. Adv. Agron. 2003, 78, 215–272. [Google Scholar]
  54. Schloter, M.; Dilly, O.; Munch, J.C. Indicators for evaluating soil quality. Agric. Ecosyst. Environ. 2003, 98, 255–262. [Google Scholar] [CrossRef]
  55. Acosta-Martinez, V.; Zobeck, T.M.; Allen, V. Soil Microbial, Chemical and Physical Properties in Continuous Cotton and Integrated Crop–Livestock Systems. Soil Sci. Soc. Am. J. 2002, 68, 1875–1884. [Google Scholar] [CrossRef]
  56. Riedell, W.E.; Pikul, J.L.; Jaradat, A.A.; Schumacher, T.E. Crop Rotation and Nitrogen Input Effects on Soil Fertility, Maize Mineral Nutrition, Yield, and Seed Composition. Agron. J. 2009, 10, 870–879. [Google Scholar] [CrossRef]
  57. Weil, R.R.; Brady, N.C. The Nature and Properties of Soils, 15th ed.; Pearson Education Ltd.: London, UK, 2016; p. 381. [Google Scholar]
  58. Kelley, K.W.; Long, J.H., Jr.; Todd, T.C. Long-term crop rotations affect soybean yield, seed weight, and soil chemical properties. Field Crops Res. 2003, 83, 41–50. [Google Scholar] [CrossRef]
  59. Dossa, K.; Diouf, D.; Wang, L.; Wei, X.; Zhang, Y.; Niang, M.; Fonceka, D.; Yu, J.; Mmadi, M.A.; Yehouessi, L.W.; et al. The Emerging Oilseed Crop Sesamum indicum Enters the “Omics” Era. Front. Plant Sci. 2017, 8. [Google Scholar] [CrossRef]
  60. Biabani, A.R.; Pakniyat, H. Evaluation of seed yield-related characters in sesame (Sesamum indicum L.) using factor and path analysis. Pak. J. Biol. Sci. 2008, 11, 1157–1160. [Google Scholar] [CrossRef]
  61. Shehu, H.E. Uptake and agronomic efficiencies of nitrogen, phosphorous and potassium in sesame (Sesamum indicum L.). Am. J. Plant Nutr. Fertil. Technol. 2014, 4, 41–56. [Google Scholar]
  62. Shehu, H.E.; Kwari, J.D.; Sandabe, M.K. Nitrogen, phosphorous and potassium nutrition of sesame (Sesamum indicum) in Mubi, Nigeria. Res. J. Agron. 2009, 3, 32–36. [Google Scholar]
  63. Jadav, D.P.; Padamani, D.R.; Polara, K.B.; Parmar, K.B.; Babaria, N.B. Effect of different level of sulphur and potassium on growth, yield and yield attributes of sesame (Sesamum Indicum L.). Asian J. Soil Sci. 2010, 5, 106–108. [Google Scholar]
  64. Mitchell, G.A.; Bingham, F.T.; Yermanos, D.M. Growth, mineral composition and seed characteristics of sesame as affected by nitrogen, phosphorus and potassium nutrition. Soil Sci. Am. Proc. 1974, 38, 925–931. [Google Scholar] [CrossRef]
  65. Demmig, B.; Gimmler, H. Properties of the Isolated Intact Chloroplast at Cytoplasmic K Concentrations: I. Light-Induced Cation Uptake into Intact Chloroplasts is Driven by an Electrical Potential Difference. Plant Physiol. 1983, 73, 169–174. [Google Scholar] [CrossRef]
  66. Loide, V. About the effect of the contents and ratios of soil’ s available calcium, potassium and magnesium in liming of acid soils. Agron. Res. 2004, 2, 71–82. [Google Scholar]
  67. Kumar, P.; Sharma, M.K. Nutrient Deficiencies of Field Crops: Guide to Diagnosis and Management; CAB International: Wallingford, UK, 2013; p. 243. [Google Scholar]
  68. Hodges, S.C. Soil Fertility Basics; Soil Science Extension, North Carolina State University: Raleigh, NC, USA, 2010; pp. 1–75. [Google Scholar]
  69. Yoshimura, S.; Yoshida, R.; Maeda, M.; Nishio, W.; Akaji, K. Studies on the plastic greenhouse soil of eggplant (Solanum melongena L.) by continuous cropping (4). Potassium deficiency and magnesium excess. Bull. Osaka Agric. Res. Cent. 1976, 13, 17–24, (In Japanese with English abstract). [Google Scholar]
  70. Bolata, E.L.; Chaves, J.C.D.; Coffee, W. Enzymatic activity and mineralization of carbon and nitrogen in soil cultivated with coffee and green manures. Rev. Bras. Cienc. Solo 2010, 34, 1573–1583. [Google Scholar] [CrossRef]
  71. Wolinska, A.; Stepniewska, Z. Dehydrogenase Activity in the Soil Environment Dehydrogenase Activity in the Soil Environment. In Dehydrogenases; Canuto, R.A., Ed.; Intech: Rijeka, Croatia, 2012. [Google Scholar] [CrossRef]
  72. Langham, D.R. Gowth and Development of Sesame; SESACO Corporation: Austin, TX, USA, 2008. [Google Scholar]
Figure 1. Land preparation (A); seedling stage (B); flowering stage (C); and physiological maturity stage (D).
Agronomy 09 00184 g001
Figure 2. (a) The seed yield and (b) 1000-seed weight of sesame. Bars show mean values with standard deviation (n = 3). Different letters above the bars indicate significant differences by Tukey HSD test (p < 0.05).
Agronomy 09 00184 g002
Figure 3. Principal component analysis (PCA) showing variation in growth, seed yield, nutrient concentration, and soil chemical properties. (a) Loading plot of the first two components showing the relationship between measured variables. HFC, height of first capsule; T_seed_weight, thousand seed weight (1000-seed weight); TN, total soil N; TC, total soil C; Avail P, available P; Amm_N, NH4+-N; Nitr_N, NO3-N; Ca_sat, Ca saturation (%); Mg_sat, Mg saturation (%); and K_sat, K saturation (%). (b) The score plot of the PCA with clusters corresponding to continuous cropping years (Year 0, non-continuous cropping; 0-yr, 2-yr, 4-yr, 5-yr and 6-yr indicate Year 0, Year 2, Year 4, Year 5 and Year 6 fields, respectively).
Agronomy 09 00184 g003
Table 1. The effect of continuous cropping on the sesame growth and yield parameters under the different duration of cropping years.
Year zHeight of First Capsule (cm)Number of Branches/PlantSeed Yield (kg ha−1)
061.27 a2.37 ab1952.16 a
264.40 a2.80 a920.29 b
451.00 c1.77 c723.17 b
556.43 b1.70 c617.32 b
662.20 a1.90b c641.45 b
ANOVA (p-values)*********
z Years of continuous cropping. Different letters indicate significant differences among years by Tukey HSD test (p < 0.05). Significance levels are indicated as *** (p < 0.001).
Table 2. The effect of continuous cropping on the sesame leaf tissue nutrient concentrations under the different duration of cropping years.
Year zN%P (%)K (%)Ca (%)Mg (%)
02.69 a0.80 a2.91 ab0.44 ab0.47 a
22.68 a0.79 a3.13 a0.48 a0.48 a
42.38 ab0.55 a2.21 abc0.40 ab0.43 a
52.09 b0.83 a1.86 bc0.27 b0.37 a
62.25 b1.21 a1.56 c0.56 a0.45 a
ANOVA (p-values)**NS***NS
z Years of continuous cropping. Different letters indicate significant differences among years by Tukey HSD test (p < 0.05). Significance levels are indicated as * (p < 0.05), ** (p < 0.01) and NS (Non-significant).
Table 3. The effect of continuous cropping on the soil chemical properties under the different duration of cropping years.
1:5 (H2O) Available N
YearzpHEC (dS m−1)Total C (g kg−1)Total N (g kg−1)C/N ratioNH4+-N (mg kg−1)NO3-N (mg kg−1)Available P (mg kg−1)
05.29 c0.053 a26.36 ab2.57 ab10.23 a9.71 ab13.10 a71.35 a
25.64 bc0.052 a28.56 a2.71 a10.54 a10.91 a9.79 a49.88 b
45.91 ab0.052 a24.83 ab2.40 bc10.36 a6.53 bc8.06 a45.17 b
56.02 ab0.052 a25.86 ab2.41 bc10.71 a5.84 c9.58 a43.31 b
66.30 a0.046 a24.50 b2.30 c10.67 a5.94 c11.28 a40.84 b
ANOVA (p-values)***NS****NS**NS***
z Years of continuous cropping. Different letters indicate significant differences among years by Tukey HSD test (p < 0.05). Significance levels are indicated as * (p < 0.05), ** (p < 0.01), *** (p < 0.001) and NS (Non-significant).
Table 4. The effect of continuous cropping on soil exchangeable cation, CEC and base saturations under the different duration of cropping years.
Exchangeable Cations Base Saturation (%)
Year zK (mg kg−1)Ca (mg kg−1)Mg (mg kg−1)CEC (cmolc kg−1)KCaMg
0157.42 b799.12 c193.47 c10.62 b3.80 bc37.63 c15.18 c
2250.47 a1478.36 a281.15 b11.20 ab5.73 a65.97 a20.91 b
4229.90 a1252.35 b349.60 a11.18 ab5.28 ab56.00 b26.06 a
5161.98 b1478.44 a356.68 a11.67 a3.56 c63.37 ab25.48 a
6217.69 ab1658.71 a381.09 a11.90 a4.70 abc69.74 a26.72 a
ANOVA (p-values)******************
z Years of continuous cropping. Different letters indicate significant differences among years by Tukey HSD test (p < 0.05). Significance levels are indicated as ** (p < 0.01), *** (p < 0.001) and NS (Non-significant).
Table 5. The effect of continuous cropping on the soil enzyme activities under the different duration of cropping years.
Year zUrease
(μg NH4+-N g−1 soil 2h−1)
Catalase
(mL of 0.02M KMnO4 g−1 soil h−1)
Dehydrogenase
(INTF μ moles g−1 soil 2 h−1)
097.17 ab6.311 ab0.70 a
2106.18 a6.29 ab0.55 b
488.13 ab6.89 a0.47 bc
580.38 b6.30 ab0.39 c
687.63 ab4.13 b0.50 bc
ANOVA (p-values)*****
z Years of continuous cropping. Different letters indicate significant differences among years by Tukey HSD test (p < 0.05). Significance levels are indicated as * (p < 0.05), *** (p < 0.001) and NS (Non-significant).

