Article

Effect of Tillage Systems on Spatial Variation in Soil Chemical Properties and Winter Wheat (Triticum aestivum L.) Performance in Small Fields

1
Department of Environmental Systems Science (D-USYS), Institute of Agricultural Sciences, Swiss Federal Institute of Technology (ETH), Universitätstrasse 2, 8092 Zürich, Switzerland
2
Hermiston Agricultural Research & Extension Center, Oregon State University, 2121 South 1st Street Hermiston, OR 97838, USA
3
Agroscope Reckenholz—Tänikon Research Station ART, Reckenholzstrasse 191, CH-8046 Zurich, Switzerland
4
School of Agricultural, Forest and Food Sciences HAFL, Bern University of Applied Sciences, Länggasse 85, 3052 Zollikofen, Switzerland
5
Department of Soil and Water Resources, Institute of Industrial and Forage Crops, Hellenic Agricultural Organization—“Demeter”, 41335 Larissa, Greece
*
Author to whom correspondence should be addressed.
Agronomy 2019, 9(4), 182; https://doi.org/10.3390/agronomy9040182
Submission received: 6 March 2019 / Revised: 1 April 2019 / Accepted: 9 April 2019 / Published: 10 April 2019
(This article belongs to the Special Issue Precision Agriculture)

Abstract

:
To investigate how tillage intensity modifies the small-scale spatial variability of soil and winter wheat parameters, field trials were conducted on small plots (12 m × 35 m) in three temperate environments in the Swiss midlands: Zollikofen in 1999 (loamy silt soil; Gleyic Cambisol) and Schafisheim in 1999 and in 2000 (sandy loam soil; Orthic Luvisol). Total soil nitrogen (Ntot), total carbon (Ctot) and pH were assessed after harvest. A regular nested grid pattern was applied with sampling intervals of 3 m and 1 m at 0–30 cm on a total of nine no-tillage (NT) and nine conventional tillage (CT) plots. At each grid point, wheat biomass, grain yield, N uptake and grain protein concentration were recorded. Small-scale structural variance of soil Ntot, Ctot and pH was slightly larger in NT than in CT in the topsoil in the tillage direction of the field. Wheat traits had a slightly greater small-scale variability in NT than in CT. Spatial relationships between soil and crop parameters were rather weak but more pronounced in NT. Our results suggest limited potential for variable-rate application of N fertilizer and lime for NT soils. Moderate nugget variances in soil parameters were usually higher in CT than in NT, suggesting that differences in spatial patterns between the tillage systems might occur at even smaller scales.

1. Introduction

Tillage is the mechanical manipulation of soil for changing its conditions in order to enhance crop production. Conventional tillage (CT) is based on the plowing tillage system, and combines primary and secondary operations usually performed to prepare a seedbed for a given crop and area [1]. Primary tillage constitutes the first major soil-working operation, and is normally designed to reduce soil strength, cover plant and insect materials, and rearrange soil aggregates (e.g., by moldboard plow, chisel plow, and/or disk plow) whereas, secondary tillage is a group of different operations, which follows primary tillage and is designed to create refined soil conditions before seed planting. Examples include the disk harrow, cultivator chisels or sweeps, and roller harrow [1]. In contrary, no-tillage (NT) is conducted without any tillage implements, although minimum tillage (the least soil manipulation necessary for crop production under existing soil conditions) may be required to control weeds that are tolerant to herbicides. NT (also zero tillage) is a minimum tillage practice in which the crop seeds are planted directly into the stubble and residue of the previous year’s crop. NT has gained favor on many farms to restore soil organic carbon stocks and to improve soil properties [2]. NT systems produce less compression and breaking down of soil aggregates, and greater amounts of organic residue on and near the soil surface [3] resulting in less surface-sealing by rainfall, reduced soil erosion, [4,5] enhanced moisture retention, and more organic matter accumulation [6,7]. In the medium- to long-term, crop yields in NT can be close to those in CT with even higher yields in relatively dry regions. In cool and humid climates of Europe, NT practices have produced high yields in small grain crops, especially in the United Kingdom [8] and in Germany [9]. Other studies indicate that similar crop yields can usually be achieved in conventional plowed and reduced tillage systems, although an impermanent decrease is often observed in NT systems. For example, Pittelkow et al. [10,11] have shown that the yield of most crops is reduced in NT systems with less than 5 years of practice compared to CT systems, but then it is equal.
Small-scale variability exists in many farm fields all over the world. In the past micro-variability in yield was often overlooked with farmers opting to manage fields with uniform practices as fine-tuned tools were lacking. In order to realize the goal of site-specific nutrient management, field soils should be treated based on their smallest scale of significant variability [12]. In this respect farmers adopt precision farming techniques, such as site-specific nutrient management, in order to increase productivity and economic returns with a reduced impact on the environment, by taking into account the variability within and between fields [13]. The objective of precision farming is to improve the control of input variables such as fertilizers, seeds, chemicals or water with respect to the desired outcomes of increased profitability, reduced environmental risk or better product quality. The implementation of precision farming has become possible thanks to the combination of new technologies to link mapped variables to appropriate farming practices such as tillage, seeding, fertilization, herbicide and pesticide application, harvesting and animal husbandry [14]. Site-specific soil and crop management is a precision farming technique that implies that specific sites within a field are managed with best practices using information about the spatial variability of soil physical and chemical properties. The goal is the variable management of inputs to soils and crops to identifiable locations within fields, thus, optimizing profitability by doing the right thing, in the right place, at the right time, in the right way [15,16].
Tillage and the management of crop residues have a major impact on the small-scale variability of plant growth, crop yield, soil, weeds, pests and diseases [17,18,19]. Biological, physical and chemical processes in the soil occur simultaneously, and these processes are usually interrelated. In CT, the preparation of the seedbed by annual moldboard plowing (i.e., to a depth of 0.25m and rototilled to a depth of 0.10 m before sowing) affects these processes by mechanical loosening, mixing and inverting of the soil as well as by incorporating and burying crop residues, and thereby, killing annual and perennial weeds [20]. In NT, the reduction of tillage intensity can, among others, improve soil quality and reduce labor and fuel costs [21,22]. However, high levels of crop residues on the soil surface hinder the implementation of NT because of the following problems: mechanical interference with seeding operations, slower drying and warming of the soil after wet and cold winters, decreased plant productivity due to allelopathic effects of crop residue, greater incidence of pests (especially mice and slugs) and reduction in the efficacy of fertilizers and herbicides [20]. Soil type is also an important consideration for NT and especially in humid temperate climates, those with a cool season, subject to excessive precipitation and high levels of crop residue. Generally, soils with an imbalance in particle size distribution (i.e. high clay and sand content) are susceptible to compaction and thus tend to require tillage [20].
Nutrients in residues are mixed mechanically into the soil under CT, whereas in NT mixing depends largely on natural forces such as freezing and thawing, earthworms and other natural types of disturbance [23]. Various changes in soil properties are expected with the abandonment of the plow [22]. Hence, small-scale variability in chemical and physical properties of the soil may be very different between CT and NT.
The tillage intensity under CT may result in more uniform distribution of soil physical properties and soil organic matter in the top soils [23,24]. However, as the plow incorporates crop residues heterogeneously, the spatial variance in the nutrient contents in the field may be large. Under NT, soil nutrients generally accumulate in the topmost soil layer resulting in decreased available nutrients in lower soil depths [23,25].
Due to large soil variability existing even at a small scale within a field, a uniform crop management program over space and time will not allow for the formulation of the most efficient agronomic practices [26]. However, the extent of spatial variability of soil properties is still poorly understood, despite its importance in designing appropriate experimental sampling strategies [27,28] or at a small field scale [19]. The generally strong influence of the environment on the expression of differences between tillage systems partly explains the often drastically different results among published experiments. Thus, at the field level, predicting the performance of tillage systems remains a difficult task. Moreover, optimal nutrient management practices for wheat production systems under different tillage systems have not yet been fully implemented. Depending on the growing conditions, the tillage system along with site-specific approaches for nutrient management can increase wheat yield, nutrient use efficiency and profitability while decreasing greenhouse gases (GHGs) [29]. Through site specific nutrient management, an opportunity exists to enhance the yield, profitability, and nutrient use efficiency of these systems. Site specific nutrient management captures the spatial and temporal variability in soil fertility in small farms and provides an approach to supply crops with essential nutrients based on a crop’s needs, and thus improves the crop yield [30,31] and nutrient use efficiency [32].
To fill the knowledge gap on how tillage systems influence the small-scale variability of soil properties and crop yield, field trials were conducted with the objectives of (1) evaluating such spatial variability in small fields under NT and CT, and (2) determining whether there are spatial relationships between soil chemical and crop parameters at small scales.

2. Materials and Methods

2.1. Experimental Site and Weather Conditions

The study was conducted within a tillage experiment in the Swiss midlands, from 1995 to 1999 in Zollikofen (47°00′ N, 7°28′ E; 555 m above sea level) and from 1996 to 2000 in Schafisheim (47°23′ N, 8°09′ E; 429 m above sea level). The small-scale spatial variability was evaluated in small plots in three environments including Zollikofen in 1999 and Schafisheim in 1999 and in 2000.
The soil (0–30 cm) at Zollikofen was loamy silt (LSi; 14 % clay, 51 % silt, 35 % sand) classified as Gleyic Cambisol and at the Schafisheim site it was sandy loam (SL; 15 % clay, 35 % silt, 50 % sand) classified as an Orthic Luvisol [33]. At the same depth (0–30 cm), soils at both sites were rich in soil organic matter (SOM) (SOM = 2.7 % in Zollikofen and 3.3 % in Schafisheim) and moderately to slightly acidic (pH (H2O) = 5.6 in Zollikofen and 6.3 in Schafisheim).
Long-term climatic data from meteorological stations at Berne-Liebefeld (near Zollikofen) and Buchs-Suhr (near Schafisheim) were obtained from the Swiss Meteorological Institute (SMI, Zurich). The climate is temperate (Cfb according to the Köppen climate classification). During the 20 years prior to the experiments (1980–2000), the average annual mean temperature was 8.7 and 9.2 °C, and the average annual precipitation was 1075 and 1047 mm in Zollikofen and Schafisheim, respectively. During the experimental years, the weather conditions were close to the long-term average, although some deviations occurred. In Schafisheim, the winter in the 1999 growing season was very severe compared to the 20 years prior to the experiments (the annual mean temperature was 7.3 °C, and the average annual precipitation was 1219 mm).

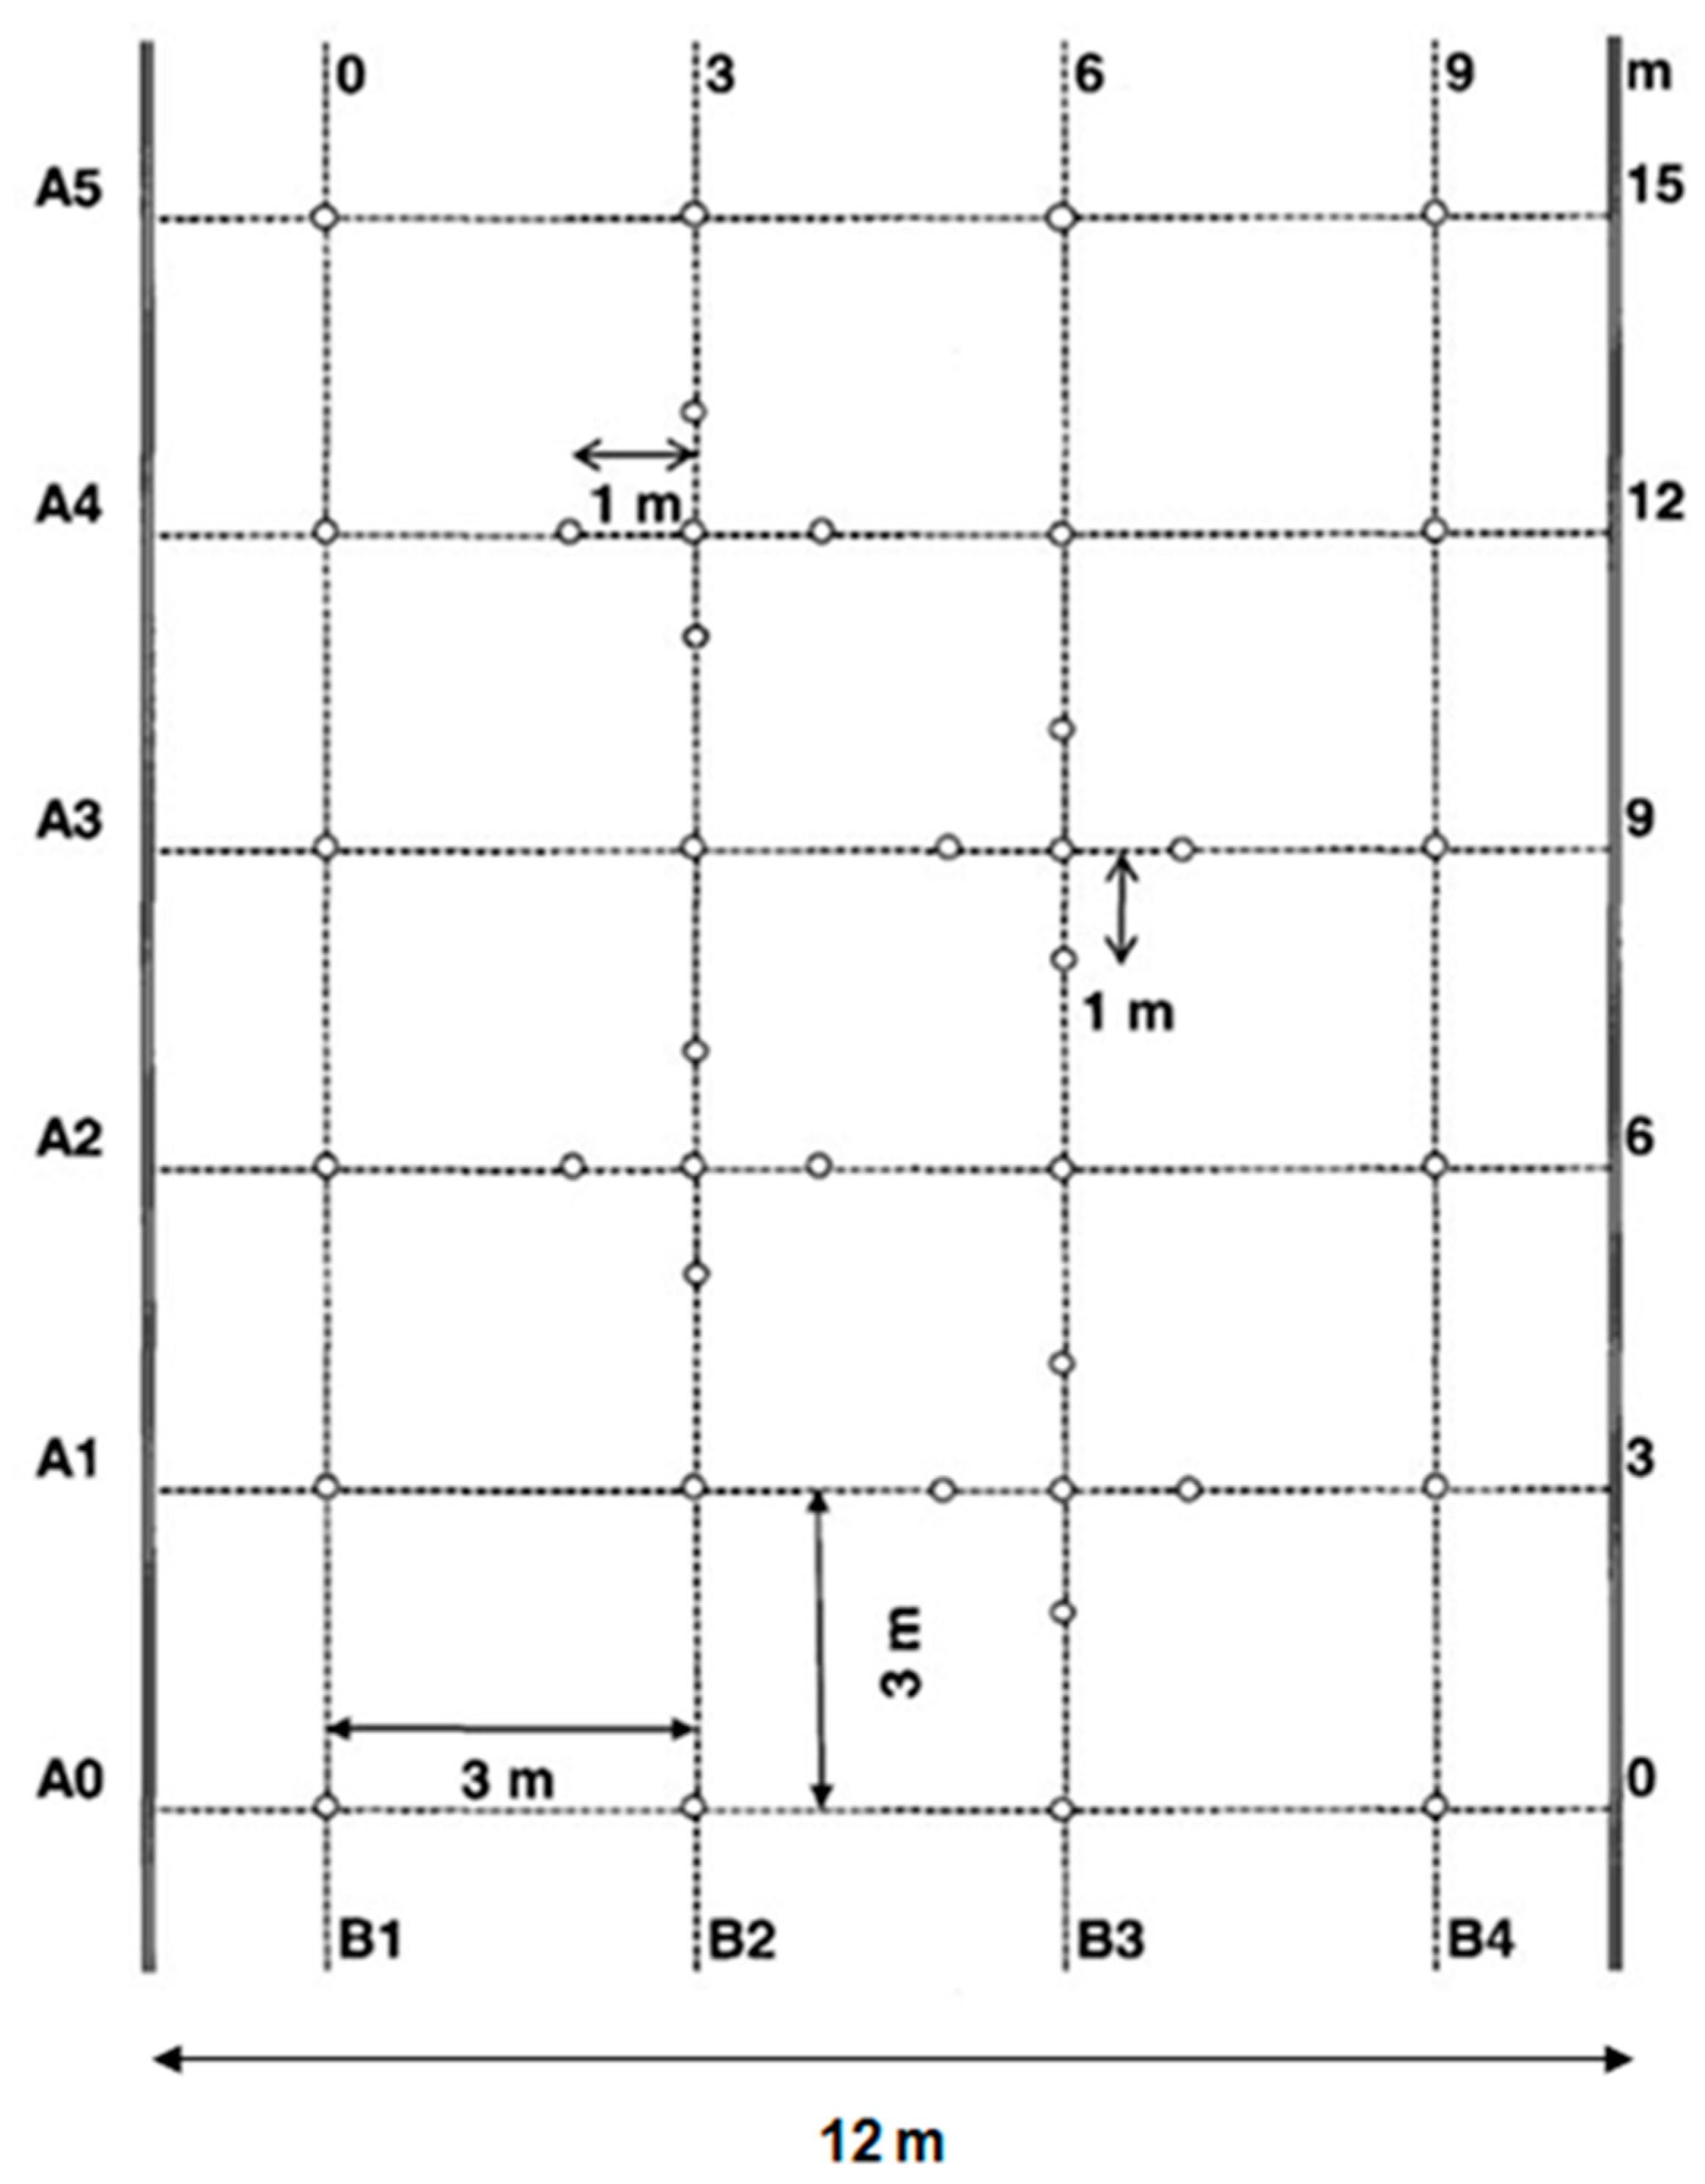
2.2. Experimental Design and Field Management Practices

The study was based on a four-field rotation, repeated four-fold in such a way that each member was present annually. The rotation included winter wheat (Triticum aestivum L.), oilseed rape (Brassica napus L.), winter wheat, and maize (Zea mays L.). White mustard (Brassica alba L.) was the cover crop between winter wheat and maize. The experimental design was a randomized complete block with three replications.
The plots (12 m × 35 m) were arranged in 2 ha fields and the four crops of the crop rotation were grown in parallel each year. The tillage treatments were conventional tillage (CT) and no tillage (NT). Throughout the crop rotation, all the crop residues were left in the fields. In the field trial, the small-scale spatial variability was evaluated on the wheat plots, which had a previous crop of maize. In CT, the soil was moldboard-plowed to a depth of 0.25 m and rototilled to a depth of 0.10 m just before sowing with a ‘Rototiller’ rotary harrow (Rau, Weilheim, Germany) drill combination (‘BS V6’ drill with disc openers, Nodet, Montereau, France). In NT, wheat was sown using a no-till planter with single-disc openers (John Deere ‘NT 750 A’, Deere and Co., Moline, IL, USA), directly into the dead mulch.
Before sowing, 1.08 kg a.i. ha−1 of glyphosate (Roundup®, Monsanto) and 10 kg ha−1 of ammonium sulphate [(NH4)2SO4] were sprayed on the NT plots to eliminate weeds. Winter wheat (cv. Runal) (Breeder: Swiss Federal Research Station for Agroecology and Agriculture, FAL, Zurich, Switzerland), a high-quality variety with an intermediate yield potential was sown after oilseed rape at identical seeding rates in CT and NT plots. The rates were 425 seeds m−2 (200 kg ha−1) on 9 Nov 1998 and 400 seeds m−2 (188 kg ha−1) on 19 Oct 1999 in Schafisheim. The respective seeding rates in CT and NT plots were 450 seeds m−2 (212 kg ha−1) on 19 Nov 1998 in Zollikofen. The sowing depth was from 3 to 4 cm. The distance between rows was 14.3 cm at Zollikofen and 12.5 cm at Schafisheim in the CT plots and 16.6 cm in the NT plots.
Because soil testing indicated large soil reserves, P and K fertilization was unnecessary during both growing seasons [34]. N was broadcast as ammonium nitrate (NH4NO3) at a rate of 150 kg N ha−1 in both tillage systems. The total amount of fertilizer N was split into four applications: 60 kg N ha−1 at the 2–3 leaf stage (BBCH stage 12–13; BBCH coding system; Biologische Bundesanstalt Bundessortenamt und CHemische Industrie) and 30 kg N ha−1 at tillering (BBCH stage 21), at stem elongation (BBCH stage 31), and at heading (BBCH stage 51) [35]. Pest control was carried out according to the principles of the integrated pest management. Due to a low soil pH at Zollikofen, soil in these plots was limed with ’Granukal’ (1.5 Mg CaCO3 ha−1) in 1998, a year before this study began.

2.3. Field Measurements and Data Analysis

Within the CT and NT plots a nested-grid sampling design was established. During the vegetation period, leaf greenness was measured on the flag leaf of five randomly selected plants at every grid sampling point (regular nested grid with sampling intervals of 3 m and 1 m) by means of a Minolta SPAD-502 (leaf greenness-chlorophyll meter; Minolta, Plainfield, IL, USA) at different plant growth stages: flag leaf fully unrolled (BBCH stage 39), beginning of heading (BBCH stage 51), end of flowering (BBCH stage 69) and midway through fruit development (BBCH stage 75). The biomass and grain yield of winter wheat were determined at maturity (on 2 August 1999 and on 26 July 2000) on 1 m2 around every grid sampling point. Grains and subsamples of straw were dried at 65° C for 48 h. The dry grain and straw samples were ground and analyzed for total N content with a LECO CHN-1000 autoanalyzer (LECO Corporation, St. Joseph, MI, USA). Grain protein concentration was calculated by multiplying the grain N content by 5.7.
The spatial variability of total N (Ntot), total C (Ctot) and pH (H2O) was assessed by soil sampling two weeks after the harvest of winter wheat in a regular nested grid with sampling intervals of 3 and 1 m at 0–30 cm depth (15 cm increments) on a total of nine NT and nine CT plots. Each sample consisted of three soil cores, randomly collected by hand within a 10 cm radius of the sampling point using a Piirckhauer auger (Eijkelkamp, Giesbeek, The Netherlands). At every grid point, 1 m2 of winter wheat was cut to record the spatial variability of biomass, grain yield, N uptake and grain protein concentration (Figure 1). Forty (in 1999) and forty-eight (in 2000) sampling points were determined within each plot on sections of 9 × 15 m (1999) and 9 × 18 m (2000), respectively.
All the soil samples collected from the plots were immediately dried at 65 °C for 48 h and ground and analyzed for soil pH (H2O), total nitrogen (Ntot), and total carbon content (Ctot). Ntot and Ctot contents were determined with a LECO CHN-1000 auto-analyzer (LECO Corporation, St. Joseph, MI, USA). Soil pH was measured in a 1:2.5 suspension of soil and distilled water with a pH meter (Hanna HI 1295 Piccolo plus, Mettler Toledo 320-S pH meter; Mettler Toledo AG, Schwerzenbach, Switzerland) equipped with glass and reference electrodes.
Descriptive statistics were computed using the SYSTAT software [36] to obtain means, standard deviations (SD), coefficients of variation (CV), and minimum (Min) and maximum (Max.) values for selected soil chemical properties, and for grain yield and grain protein concentration of the wheat crop.
The theory of regionalized variables was used to investigate spatial variability of selected soil and plant properties [37]. A geostatistical and surface mapping software package was used [38] to analyze the spatial structure of the data, to define the semi-variograms, to estimate values of points on a grid spacing by point kriging and to create contour maps of the kriged estimates. The techniques for kriging and creating variograms are described by several authors [39,40].
Analyses of variance (ANOVA) were calculated with the factors “Environment” and “Tillage system”, including three environments (Zollikofen 1999, Schafisheim 1999, and Schafisheim 2000) and two tillage systems (CT and NT). ANOVAs were performed for soil and crop properties and also for the coefficients of variation and the geostatistical parameters of these properties. ANOVA and multiple comparisons using the Fisher’s least-significant-difference test were performed with the general linear model (GLM) procedure of SYSTAT [36].

3. Results

3.1. Spatial Variability of the Examined Soil Chemical Properties

3.1.1. Vertical Variability

The results are based on observations of all the plots in each tillage system. In the no-till system (NT) there was a clear decline of mean Ntot and Ctot content from the surface to the subsurface layer (Table 1). A similar trend was also observed for Ctot under conventional tillage (CT) but it was not as accentuated. The differences in the Ctot and Ntot contents between tillage systems were statistically significant at p < 0.05 (0–15 cm) and p < 0.01 (15–30 cm) (Table 2). The absolute values of these parameters (Table 1) were lower in the 0–15 cm soil layer in CT than in NT, whereas the CT values of the same parameters exceeded those of NT in the 15–30 cm layer. With the exception of Ntot in 1999 at Schafisheim under CT, the CV (%) and the analysis of Cv revealed that the spatial variability of the Ntot and Ctot increased from the surface (0–15 cm) to the subsurface (15–30 cm) layer, in both tillage systems (Table 1 and Table 3).

3.1.2. Horizontal Variability

CVs between 7.1% and 22.9% indicate that the magnitude of overall variability in Ntot and Ctot was relatively small at both sites, Zollikofen and Schafisheim (Table 1); CVs for given traits were similar for both tillage systems.
On the other hand, an ANOVA of geostatistical parameters revealed differences in the structure of variance of these soil traits between CT and NT (Table 3). In the along-row direction (Y-direction) the ranges of influence of Ntot were slightly but significantly (p < 0.05) larger in NT at both soil depths (Table 3). The same tendency, which was not significant, was detected for Ctot. In the across-row direction (X-direction), the ranges of small-scale variability, which were always shorter than in the along-row direction (Y-direction), revealed no differences between the tillage systems.
All examined soil chemical properties showed lower (significantly for pH) C0, particularly in the 0–15 cm layer in NT (Table 3). In the along-row direction (Y- management direction) Cv of Ntot, Ctot and pH was larger (significantly only for pH) in the 0–15 cm layer in NT (Table 3).
C/(C0 + C) (%) for soil properties was mostly higher in NT at both directions of the fields (Table 3). However, this trend was only significant in the management direction of the field (Y-direction) for Ntot at 0–15 cm.
The minimum and maximum pH values varied from 4.8 to 6.8, which corresponds to CV values of 1.5 to 7.1 %, in the surface layer (0–15 cm) (Table 1). As indicated by the higher CV values in NT system, the soil pH was more variable in NT than in CT (p < 0.05).

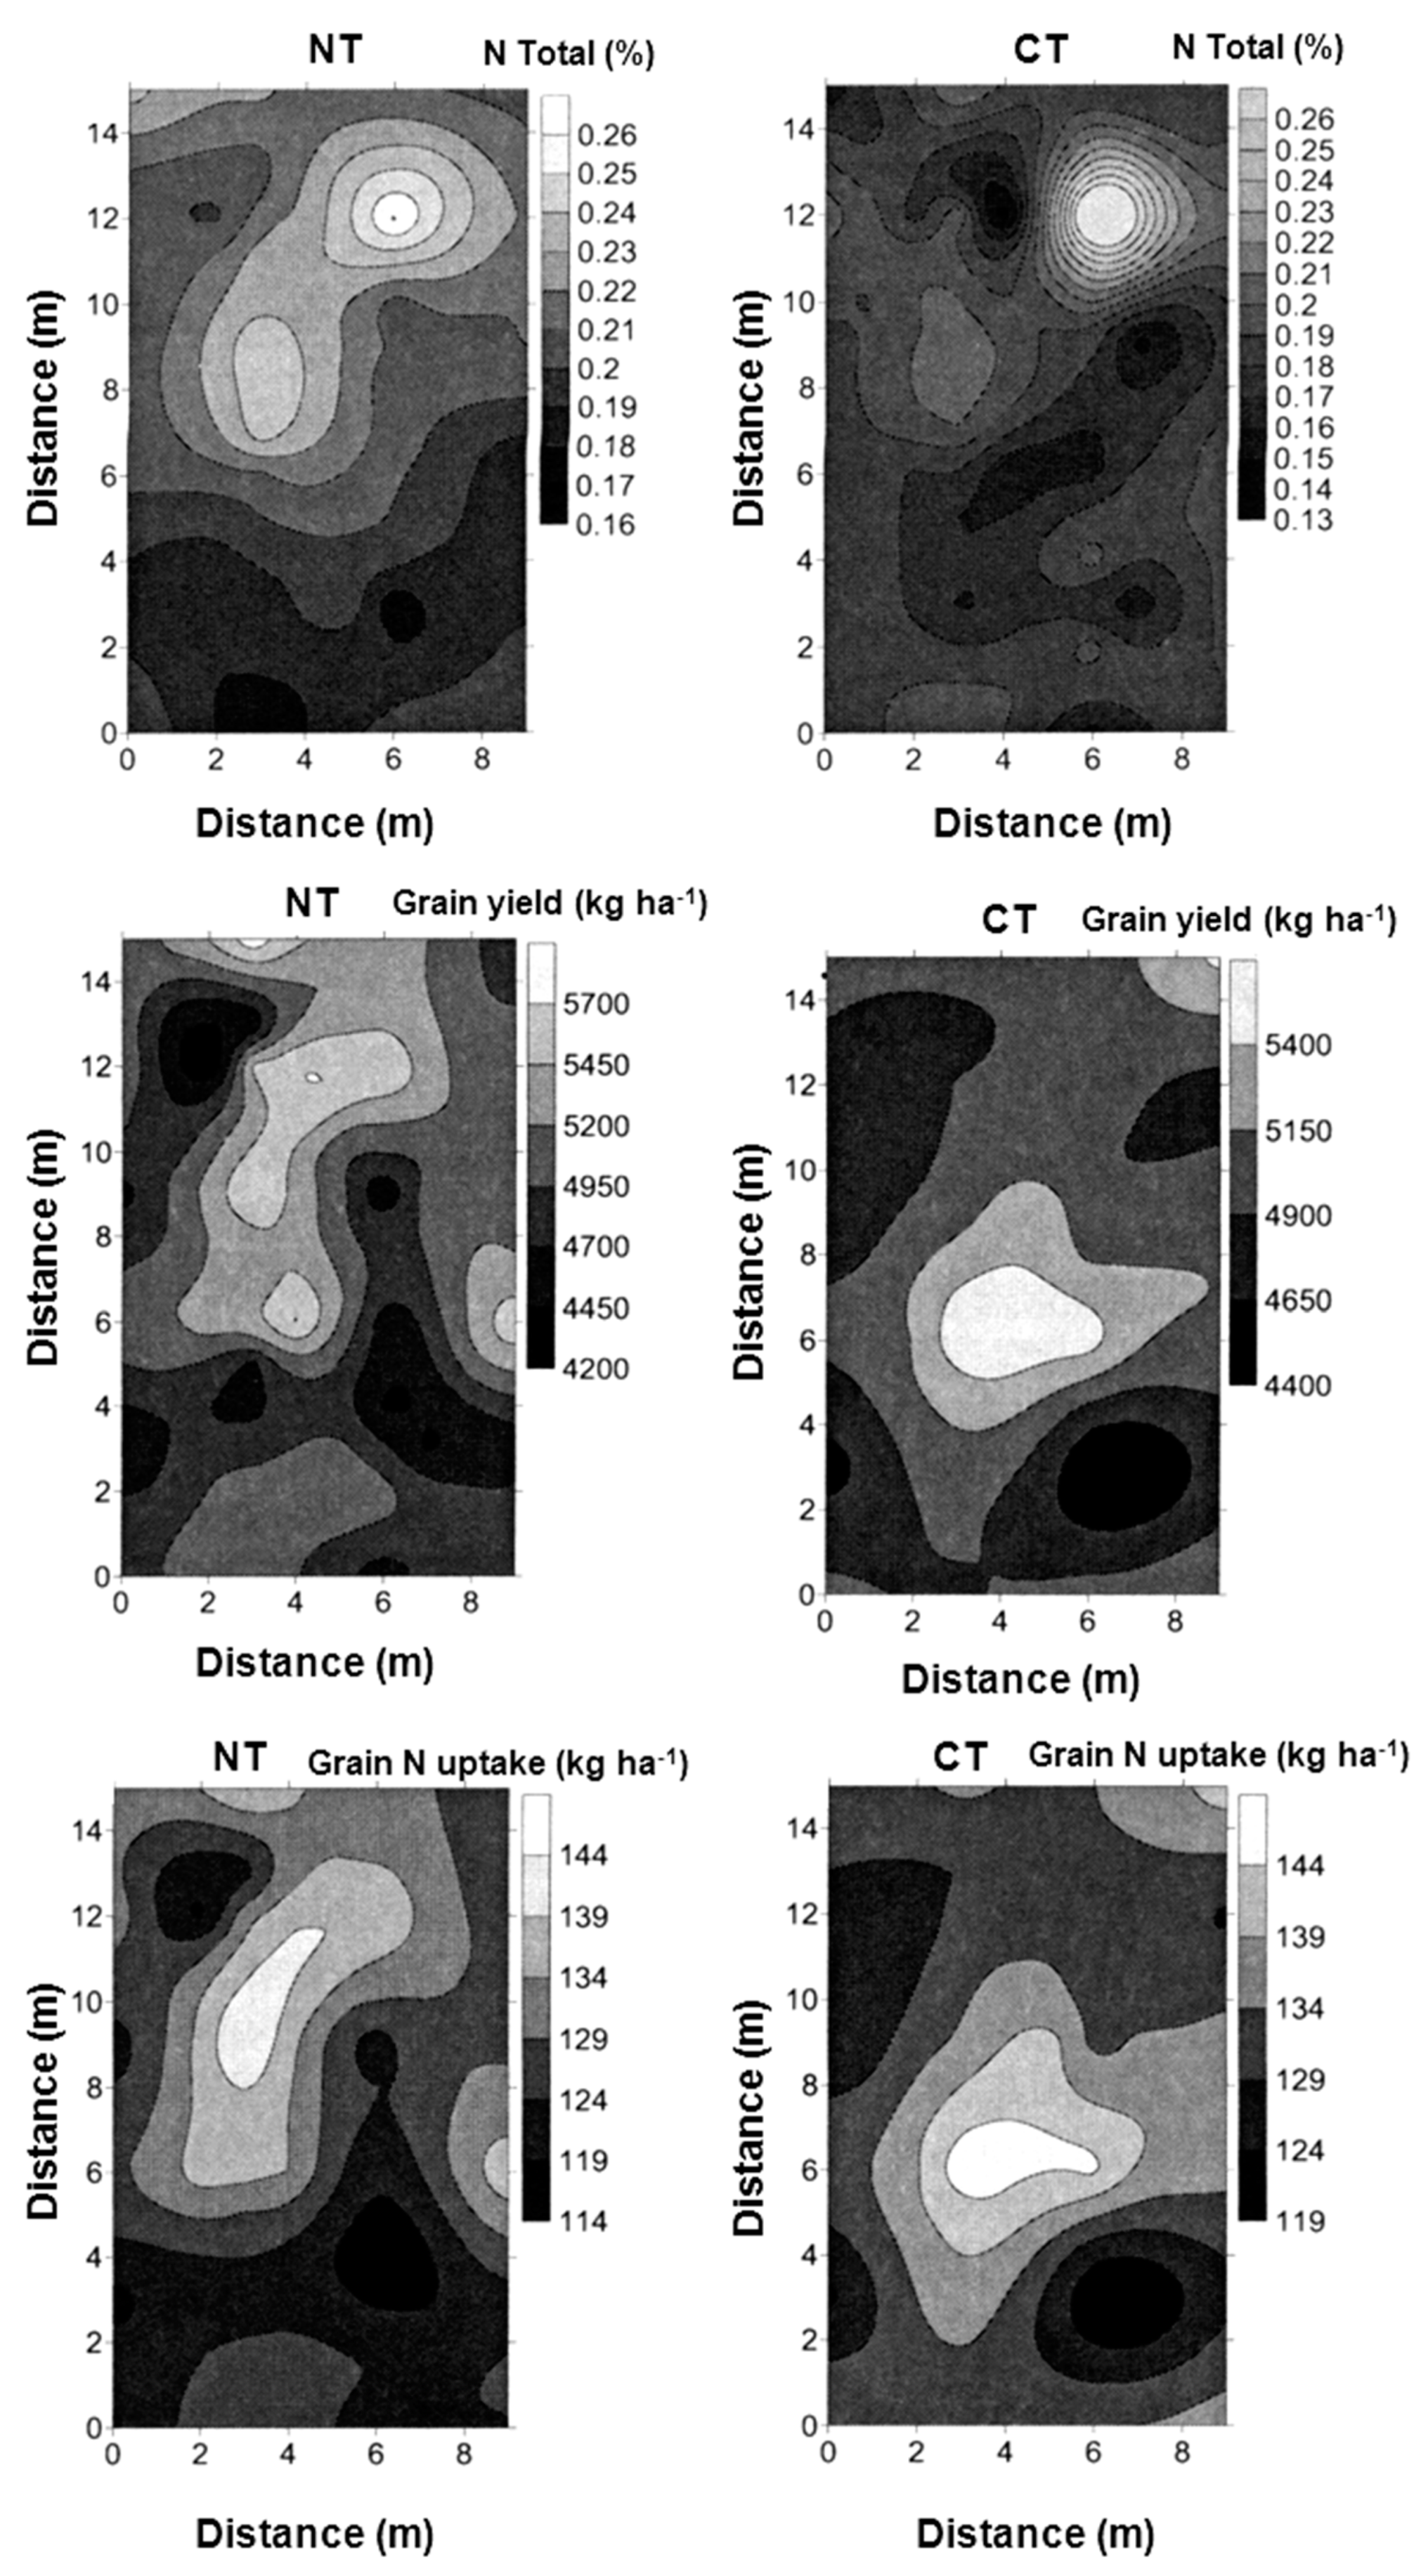
3.2. Spatial Variability in Wheat Grain Yield, N Uptake and Leaf Greeness

Descriptive statistics including SD, CV (%), as well as minimum and maximum values for grain and biomass yields, ears m−2, grain protein concentration, grain N uptake and above-ground plant N for the three environments are summarized in Table 4.
Grain yields were almost similar n NT and CT plots in each environment, but slightly greater in CT than in NT, while grain protein concentration, grain N uptake and above-ground plant N were significantly lower in NT than in CT (p ≤ 0.05, p ≤ 0.01 and p ≤ 0.001, respectively, data not shown). Small-scale variability in grain and biomass yields, grain protein concentration, grain N uptake and above-ground plant N was always slightly greater in NT than in CT. However, there were no significant differences in the variability between the tillage systems, as revealed by an ANOVA of the coefficients of variation, apart from the variability in above-ground plant N uptake (p ≤ 0.05) (data not shown). The C0 of grain yield was larger (not significantly) in NT (Table 3). The geostatistical parameters, Cv and % C/(C0 + C) for grain yield were similar between tillage systems (Table 3). As the plant density was lower (p ≤ 0.01) in NT than in CT the magnitude of variation in ears m−2, one of the yield components of wheat was slightly smaller in NT compared to CT (Table 4). The other yield components, such as thousand kernel weight and number of grains per ear, were similar in NT and CT (data not shown).
The CVs of leaf greenness for NT and CT ranked from 4.7% at BBCH stage 39 (flag-leaf fully unrolled) and BBCH stage 69 (end of flowering) to 10.9 % at BBCH stage 75 (mid-way through fruit development) and were slightly higher in NT than in CT (Table 5). The differences in the leaf greenness between NT and CT declined as growth proceeded to maturity. Across all plots, correlations between leaf greenness and grain yield or grain protein content were weak and their corresponding coefficients (r) were in a range of 0–0.14 or 0–0.36, respectively (data not shown). The highest correlations were found at BBCH stage 69 in NT plots.

3.3. Spatial Relationships between Soil and Crop Parameters

Spatial relationships between soil properties and winter wheat parameters were weak. Among the nine replications with a total of 384 soil and plant samples from each tillage system, the Pearson correlation coefficient (r) between soil Ntot and wheat grain yield varied from 0.00 to 0.46 in the 0–15 cm soil depth and from 0.00 to 0.32 in the 15–30 cm soil depth, respectively (data not shown). Grain N uptake was sometimes weakly correlated to soil Ntot with r values from 0.00 to 0.52 in the 0–15 cm soil layer and from 0.00 to 0.40 in the 15–30 cm layer (data not shown).
Correlations between soil Ntot in the 0–15 cm soil layer and wheat grain yield or grain N uptake were more pronounced in the NT than in the CT, as shown in Figure 2, illustrating this spatial relationship. The correlation coefficient between soil Ntot (0–15 cm) and wheat grain yield in the presented example was 0.46 for NT and 0.04 for CT. The relationship (r) between soil Ntot and grain N uptake was 0.52 for NT and 0.03 for CT. Comparing to Ntot, much weaker correlations were showed between Ctot or soil pH and grain yield and grain N uptake (data not shown).

4. Discussion

4.1. Small-Scale Spatial Variability of Soil Chemical Properties as Affected by Tillage Systems

In our trials, the effects of tillage system on soil chemical properties were more distinct in the vertical (along-row, Y-management direction) than in the horizontal dimension (across the rows, X-direction). In CT, crop residues and fertilizers were incorporated into the soil, resulting in a mechanically mixed surface layer that differs from the relatively undisturbed surface soil in NT. After three to four years of CT and NT, Ntot and Ctot concentrations were higher in the top 15 cm of the soil in NT, suggesting that three years of transition to NT were clearly enough to develop a clear stratification of Ntot and Ctot in the soil profile compared with CT; similar findings were reported by McCarty et al. [41]. Accordingly, soil mixing and incorporation of surface residue in CT would reduce stratification, destroying soil macroaggregates and reducing SOM content [2,42].
Our results showed that the increase in the Ntot and Ctot concentrations in NT compared with CT in the soil layer from 0 to 15 cm was very site-dependent and varied from about 2 to 20 % for Ntot and from 4 to 12 % for Ctot. Corresponding increases in other studies are mostly apparent on average values in NT and CT, varying between 7 to 40% after mostly longer terms [41,43,44]. Because the average annual input of above-ground crop residues in NT and CT soil were similar, the differences in the SOM content can be attributed to differences in the accumulation and decomposition of SOM under both tillage regimes [42]. The content of SOM is especially increased by NT in the surface zone (0–5 cm) [45], as this thin soil layer contains a greater amount of plant residues and roots [46,47,48]. Kaiser et al [49] concluded that the potential benefits of decreasing tillage intensity with respect to soil functions are closely related to organic matter dynamics that have to be evaluated separately for surface and sub-surface soils. The choice of tillage system can clearly have a large influence on the cycling of C and N, as decomposition of residues and SOM are accelerated by tillage [50].
In our study, the spatial variability in the Ctot and the Ntot concentrations at small scales (3 × 3 m and 1 × 1 m) was similar in the top 15 cm of soil and from 15 to 30 cm in both NT and CT. Since the CT plots had been tilled for the last time 11 months before soil sampling, settling occurred in the soil profile and reduced the spatial variation. Mackie-Dawson et al. [51] found that, after a tillage operation, structural changes due to settling occur between planting and harvesting, especially near the soil surface, whereas, Kader et al. [52] found that tillage management (reduced tillage vs. CT) had limited influence on organic matter fractions in the surface layer of silt soils under cereal–root crop rotations in the Belgian loess belt. However, Perfect and Caron [53] identified a statistically significantly higher soil spatial variability (p < 0.05) in the contents of water and Ctot in the upper 10 cm of soil in long-term NT compared to CT; possibly, their sampling time, which took place immediately after tillage operations in the CT plots contributed to the large difference between NT and CT. The differences in these studies suggest that it is important to consider the sampling time when comparing the tillage effects. In the experiments of Souza et al. [54], there were higher CV values for NT than for CT and smaller ranges of spatial dependence for SOM in the top 20 cm of soil. These statistical parameters showed greater variability in SOM in NT than in CT. In contrast to the later studies [54], the CV values of Ntot and Ctot (0–30 cm) were rather similar in NT and CT in our study. The range for these soil properties (Ntot and Ctot) was similar or higher in NT than in CT. This is in agreement with Sainato et al. [55], who found a slightly greater range in the soil chemical properties (oxidable carbon, Ntot, and available phosphorus) of the NT plots compared with the CT plots.
In our study, the ranges of Ntot and Ctot were greater along the length of the rows, i.e., in the direction of traffic and mechanical operations, than across the rows. This is in agreement with Nakamoto et al. [17] who reported a larger range of soil pH and P along the length of the row than across the rows, and concluded that the soil properties varied more between the rows than within the rows due to the fact that farming operations are always done in the same direction of the field. The analyses of spatial patterns of Ntot, Ctot and pH in our study, revealed that the C0 was usually lower in NT than in CT in both directions of the fields. In contrast, the Cv of these soil parameters was stronger in the top soil layer of NT than CT but only in the management direction. The NT plots showed higher Cv of Ntot, Ctot and pH in the management direction (Y-direction) than across the rows (X-direction), possibly due to the higher intrinsic spatial variability in the management direction. The CT plots showed greater Cv of Ntot and Ctot across the rows (X-direction) than along the length of the rows (Y-direction), probably due to the overlapping of management operations and a stronger homogenization effect along the length of the rows. The same traffic direction of farming machinery for years may make soil properties more uniform in the direction along rows but may increase variability between rows [17]. Farming operations influenced the range and the structure of soil pH [56]. The greater spatial variability in the soil pH of our NT plots compared with the CT plots may be due to the liming of the plots in 1998 (a year before this study began) and subsequent mixing of the lime with the soil by plowing and disking in CT. In CT crop residues, lime and fertilizers are incorporated into the soil, resulting in a mechanically mixed surface soil layer, which differs from the relatively undisturbed surface soil in the NT system [45]. Using tillage to incorporate lime improves the rates of reaction and increases subsurface pH sooner than spreading lime on the surface alone [57]. Lime was essential for highest yields with both tillage systems but the yield increase due to surface applied lime in NT averaged 31.3%, compared to a 13.5% yield increase due to incorporated lime in the CT system [58]. However, this observation was not confirmed in our study since the spatial dependence of the plant parameters (including yield) was weak to moderate, suggesting only a small potential for the variable-rate application of N fertilizer and lime. For arable crops, actual yield responses to applications of lime, and mineral fertilizers (P, K, Mg) are rare and usually small. In most cases, these materials are applied in order to maintain long-term soil pH and nutrient status and subsequently, to prevent a gradual decline into a deficiency state [59].
When there is a large heterogeneity of soil pH within a field, variation in the soil pH can be mapped and used as a basis for variable-rate lime application [59]. However, a number of researchers have inferred that soil pH and lime requirements are poorly correlated [60,61,62]. Although pH is used as an indicator of whether or not a soil should be limed, measurements of soil pH and the requirement for lime depend on different soil properties. Soil pH measures the activity of hydrogen ions in the soil, while the requirement for lime depends on the buffering capacity of the soil, its pH and the amount of exchangeable aluminium. Nevertheless, variable rate application of lime is often considered a correct point to start soil site-specific management, since pH is one of the most variable soil characteristics to manage and it affects the availability of plant nutrients [59].

4.2. Small-Scale Spatial Variability in Wheat Yield and in Leaf Greenness as Affected by Tillage System

In our two-year study NT showed greater spatial variability in biomass and grain yield than CT whereas other studies [17] observed greater variability in wheat biomass in a conventionally tilled than in a minimum-tilled plot partly attributed to high variability across rows, possibly caused by the same traffic direction of farming operations for several years. In the 1999 growing season the plant populations in NT were less dense than in CT after winter due to severe hibernal climate conditions. This may explain the larger C0 of grain yield in NT than in CT, probably due to greater micro-variance in NT at small scales less than 1 m. Poor seedbed conditions can lead to small plant populations in NT [63]. The main reason for the greater small-scale variability in grain yield in NT than in CT was the patchier plant distribution and reduced tiller density in NT compared with CT due to a severe and wet winter in the 1999 growing season. Reduced plant density of wheat (or other cereal crops) in NT compared with CT has often been reported in other studies too [64], and the critical tiller density is much lower in NT than in CT [65]. The interaction of tillage system and soil type on crop yield varied depending on whether the growing season was wet or dry [66]. Simulated CVs for NT were smaller than for CT (0.82 vs. 0.94) under different weather scenarios, suggesting that there is a potential for reducing the variability in yield [63].
There were no or weak correlations between leaf greenness and yield or grain protein concentration at harvest in both tillage systems at all the investigated growth stages. This might be because the small-scale variability in grain yield and grain protein concentration was too small to give higher correlations. However, with regard to grain yield and grain protein content, leaf greenness seemed to have a lower correlation with grain yield, which is consistent with the findings of Leake and Paulson [67].

4.3. Spatial Relationships between Soil Properties and the Yield of Winter Wheat as Affected by Tillage Systems

Weak relationships between soil Ntot, Ctot or pH on the one hand and the grain yield of winter wheat on the other in both NT and in CT are probably due to the relatively high rate of N fertilization (150 kg N ha−1) and the small variability in soil pH after uniform applications of lime one year before the beginning of the study. Weak relationships are also due to similar experimental conditions and to the short-term nature of the experimentation. As a large supply of soil nutrients reduces the impact of other soil properties, and thus, lowers the spatial variability in crop yield [68], our results are representative for fields with well -managed soils. Correlations between soil chemical properties and wheat yield were stronger in NT than in CT in our trials. Similarly, Souza et al. [54] reported a positive correlation between wheat yield and the contents of P, K and SOM under NT, but no spatial relationship with wheat yield under CT. Because of the crop rotation on the experimental plots in our study, small-scale variability of the soil chemical properties and the yield traits of winter wheat in 1999 and 2000 have been studied on different plots. Therefore, we cannot quantify the temporal stability of these spatial relationships in our study, i.e., the consistence of spatial patterns from year to year in the same plots. However, the temporal component of spatial variability should be taken into account in order to enable effective site-specific management decisions regarding fertilization, lime requirement, seeding rate and tillage [69].
In further studies, with the goal of delineating management units within a field, the spatial variability of soil chemical properties and yield should be analyzed in the same area for several years. Translating information about the characteristics and properties of the soil across different spatial and temporal scales has become a major topic in soil science. To improve our knowledge about the temporal and spatial variability of soil and yield traits, future sampling studies must be done by means of nested grids at different spatial scales and at different times on the same plots or fields. The development of non-destructive real-time sensor systems is essential because the traditional, destructive collection of soil and plant samples in the field and subsequent laboratory analyses are time-consuming and labor-intensive.

5. Conclusions

Based on our results, the spatial variability of the crop parameters was consistently larger in NT than in CT on a loamy silt and a sandy loam soil. However, under the humid-temperate climatic conditions of our study and with a relatively high level of N fertilization, there was no statistically significant effect of the tillage system on the magnitude of variability of grain yield, grain N and protein concentration, and leaf greenness of winter wheat. Three years of transition to NT were enough to develop a clear stratification of Ntot and Ctot in the soil profile under NT compared with CT. The small-scale Cv of Ntot, Ctot and pH in the top soil layer (0–15 cm) was slightly larger in NT than in CT but only in the management direction (Y-direction) of the field, possibly due to the management-induced variability in the previous decade. In the 15–30 cm soil layer, the small-scale distribution of Ntot and Ctot was as variable in NT as in CT, suggesting that the effects of short-term NT on spatial variability were not yet visible in this deeper soil layer. Although tillage modified the spatial relationship between the soil chemical properties (Ctot, Ntot, and pH) and the grain yield of winter wheat at small scales of 9 and 1 m2, there were almost no significant differences in the structure or the extent of spatial variability of soil chemical and yield traits between tillage systems at these scales. However, moderate nugget variances (Table 3) in soil chemical properties were usually higher in CT than in NT, suggesting that differences in spatial patterns between the tillage systems might occur at even smaller scales than those tested here.

Author Contributions

All authors contributed substantially to the work reported in this paper. R.-M.H.-L., P.S. and W.R. conceived and designed the experiments; P.S. and W.R. supervision; R.-M.H.-L., R.Q. and B.S. conducted the experiments, performed the analyses, and collected the data; W.R., did the statistical evaluations; R.Q., B.S. and C.N. data curation; R.-M.H.-L. and W.R., wrote the original draft of the manuscript; C.N. and P.S., thoroughly reviewed, edited and corrected the manuscript; All authors discussed the results and implications and approved the final manuscript.

Funding

This research received no external funding.

Acknowledgments

The authors acknowledge administrative and technical support from the Alliance for Global Sustainability (AGS) as a partner of the project (http://globalsustainability.org/).

Conflicts of Interest

The authors declare no conflict of interest.

References

  1. ASAE. Terminology and Definitions for Soil Tillage and Soil-Tool Relationships; American Society of Agricultural and Biological Engineers: St. Joseph, MI, USA, 2016. [Google Scholar]
  2. Blanco-Canqui, H.; Mikha, M.M.; Benjamin, J.G.; Stone, L.R.; Schlegel, A.J.; Lyon, D.J.; Vigil, M.F.; Stahlman, P.W. Regional study of no-till impacts on near-surface aggregate properties that influence soil erodibility. Soil Sci. Soc. Am. J. 2009, 73, 1361–1368. [Google Scholar] [CrossRef]
  3. Piccoli, I.; Chiarini, F.; Carletti, P.; Furlan, L.; Lazzaro, B.; Nardi, S.; Berti, A.; Sartori, L.; Dalconi, M.C.; Morari, F. Disentangling the effects of conservation agriculture practices on the vertical distribution of soil organic carbon. Evidence of poor carbon sequestration in North- Eastern Italy. Agric. Ecosyst. Environ. 2016, 230, 68–78. [Google Scholar] [CrossRef]
  4. Choudhary, M.A.; Lal, R.; Dick, W.A. Long-term tillage effects on runoff and soil erosion under simulated rainfall for a central Ohio soil. Soil Tillage Res. 1997, 42, 175–184. [Google Scholar] [CrossRef]
  5. Uri, N.D. Trends in the use of conservation tillage in US agriculture. Soil Use Manag. 1998, 14, 111–116. [Google Scholar] [CrossRef]
  6. Singh, V.K.; Singh, Y.; Dwivedi, B.S.; Singh, S.K.; Majumdar, K.; Jat, M.L.; Mishra, R.P.; Rani, M. Soil physical properties, yield trends and economics after five years of conservation agriculture based rice-maize system in north-western India. Soil Tillage Res. 2016, 155, 133–148. [Google Scholar] [CrossRef]
  7. Ali, A.B.; Elshaikh, N.A.; Hong, L.; Adam, A.B.; Haofang, Y. Conservation tillage as an approach to enhance crops water use efficiency. Acta Agric. Scand. Sect. B Soil Plant Sci. 2017, 67, 252–262. [Google Scholar] [CrossRef]
  8. Christian, D.G.; Bacon, E.T.G. A long-term comparison of ploughing, tine cultivation and direct drilling on the growth and yield of winter cereals and oilseed rape on clayey and silty soils. Soil Tillage Res. 1990, 18, 311–331. [Google Scholar] [CrossRef]
  9. Ehlers, W.; Claupein, W. Approaches toward conservation tillage in Germany. In Conservation Tillage in Temperate Agroecosystems; Carter, M.R., Ed.; Lewis Publishers: Boca Raton, FL, USA, 1994; pp. 141–165. [Google Scholar]
  10. Pittelkow, C.M.; Liang, X.; Linquist, B.A.; van Groenigen, K.J.; Lee, J.; Lundy, M.E.; van Gestel, N.; Six, J.; Venterea, R.T.; van Kessel, C. Productivity limits and potentials of the principles of conservation agriculture. Nature 2015, 517, 365–368. [Google Scholar] [CrossRef]
  11. Pittelkow, C.M.; Linquist, B.A.; Lundy, M.E.; Liang, X.; van Groenigen, K.J.; Lee, J.; van Gestel, N.; Six, J.; Venterea, R.T.; van Kessel, C. When does no-till yield more? global meta-analysis. Field Crop Res. 2015, 183, 156–168. [Google Scholar] [CrossRef]
  12. Shibusawa, S.; Sasao, A.; Sakai, K. Local variability of nitrate nitrogen in a small field. Precision Agriculture 1999. In Proceedings of the 2nd European Conference on Precision Agriculture, Odense, Denmark, 11–15 July 1999; Stafford, J.V., Ed.; Sheffield Academic Press: Sheffield, UK, 1999; pp. 377–386. [Google Scholar]
  13. Shibusawa, S. Precision farming: Approaches for small-scale farms. New Role of Agricultural Engineering. In Proceedings of the 2nd IFAC-CIGR Workshop on Intelligent Control for Agricultural Applications, Bali, Indonesia, 22–24 August 2001; University of Udayana: Bali, Indonesia, 2001; pp. 22–27. [Google Scholar]
  14. CEMA. Smart Agriculture for All Farms. What Needs to be Done to Help Small Farms Access Precision Agriculture? How can the Next CAP Help? European Agricultural Machinery Industry Association, CEMA: Brussels, Belgium, 2017. [Google Scholar]
  15. Haneklaus, S.; Schnug, E. Site specific nutrient management – objectives, current status and future research needs. In Handbook of Precision Agriculture – Principles and Applications; Srinivasan, A., Ed.; CRC Press: Boca Raton, FL, USA, 2006; pp. 91–151. [Google Scholar]
  16. Haneklaus, S.; Schick, J.; Kratz, S.; Rückamp, D.; Schnug, E. Variable rate application of manure—Gain or pain? Landbauforsch. Appl. Agric. For. Res. 2016, 66, 1–9. [Google Scholar] [CrossRef]
  17. Nakamoto, T.; Yamagishi, J.; Oyaizu, H.; Funahashi, T.; Richner, W. Spatial variability patterns of wheat growth and soil properties in a small field as affected by tillage intensity. Plant Prod. Sci. 2002, 5, 175–183. [Google Scholar] [CrossRef]
  18. Aziz, I.; Mahmood, T.; Islam, K.R. Effect of long term no-till and conventional tillage practices on soil quality. Soil Tillage Res. 2013, 131, 28–35. [Google Scholar] [CrossRef]
  19. Qiu, W.; Curtin, D.; Johnstone, P.; Beare, M.; Hernandez-Ramirez, G. Small-scale spatial variability of plant nutrients and soil organic matter: An arable cropping case study. Commun. Soil Sci. Plant Anal. 2016, 47, 2189–2199. [Google Scholar] [CrossRef]
  20. Carter, M.R. A review of conservation tillage strategies for humid temperate regions. Soil Tillage Res. 1994, 31, 289–301. [Google Scholar] [CrossRef]
  21. Holland, J.M. The environmental consequences of adopting conservation tillage in Europe: reviewing the evidence. Agric. Ecosyst. Environ. 2004, 103, 1–25. [Google Scholar] [CrossRef]
  22. Soane, B.D.; Ball, B.C.; Arvidsson, J.; Basch, G.; Moreno, F.; Roger-Estrade, J. No-till in northern, western and south-western Europe: a review of problems and opportunities for crop production and the environment. Soil Tillage Res. 2012, 118, 66–87. [Google Scholar] [CrossRef]
  23. Blevins, R.L.; Frye, W.W. Conservation tillage: An ecological approach to soil management. Adv. Agron. 1993, 51, 33–78. [Google Scholar]
  24. Tsegaye, T.; Hill, R.L. Intensive tillage effects on spatial variability of soil physical properties. Soil Sci. 1998, 163, 143–154. [Google Scholar] [CrossRef]
  25. Cook, R.L.; Trlica, A. Tillage and Fertilizer Effects on Crop Yield and Soil Properties over 45 Years in Southern Illinois. Agron. J. 2016, 108, 415–426. [Google Scholar] [CrossRef]
  26. Casa, R.; Castrignanò, A. Analysis of spatial relationships between soil and crop variables in a durum wheat field using a multivariate geostatistical approach. Eur. J. Agron. 2008, 28, 331–342. [Google Scholar] [CrossRef] [Green Version]
  27. Peukert, S.; Bol, R.; Roberts, W.; Macleod, C.J.; Murray, P.J.; Dixon, E.R.; Brazier, R.E. Understanding spatial variability of soil properties: a key step in establishing field- to farm-scale agro-ecosystem experiments. Rap. Commun. Mass Spectr. 2012, 26, 2413–2421. [Google Scholar] [CrossRef]
  28. Usowicz, B.; Lipiec, J. Spatial variability of soil properties and cereal yield in a cultivated field on sandy soil. Soil Tillage Res. 2017, 174, 241–250. [Google Scholar] [CrossRef]
  29. Sapkota, T.B.; Majumdar, K.; Jat, M.L.; Kumar, A.; Bishnoi, D.K.; McDonald, A.J.; Pampolino, M. Precision nutrient management in conservation agriculture based wheat production of Northwest India: Profitability, nutrient use efficiency and environmental footprint. Field Crops Res. 2014, 155, 233–244. [Google Scholar] [CrossRef]
  30. Das, D.K.; Maiti, D.; Pathak, H. Site-specific nutrient management in rice in Eastern India using a modeling approach. Nutr. Cycl. Agroecosyst. 2009, 83, 85–94. [Google Scholar] [CrossRef]
  31. Tiwari, K.N.; Sharma, S.K.; Singh, V.K.; Dwivedi, B.S.; Shukla, A.K. Site-Specific Nutrient Management for Increasing Crop Productivity in India. Results with Rice-Wheat and Rice-Rice Systems; PDCSR, Modipuram and PPIC-India Programme: Gurgaon, India, 2006; p. 112. [Google Scholar]
  32. International Plant Nutrition Institute’s 4R Nutrient Stewardship Portal. Available online: http://www.ipni.net/4R (accessed on 26 March 2019).
  33. WRB. World Reference Base for Soil Resources—A Framework for International Classification, Correlation and Communication; World Soil Resources Report 103; International Union of Soil Sciences, FAO: Rome, Italy, 2006. [Google Scholar]
  34. Walther, U.; Ryser, J.P.; Flisch, R. Grundlagen für die Dũngung im Acker-und Futterbau (GRUDAF). (Basics for fertilization in arable and fodder production). Agrarforschung 2001, 8, 1–80. (In German) [Google Scholar]
  35. Lancashire, P.D.; Bleiholder, H.; Van den Boom, T.; Langelüddeke, P.; Strauss, R.; Weber, E.; Witzenberger, A. A uniform decimal code for growth stages of crops and weeds. Ann. App. Biol. 1991, 119, 561–601. [Google Scholar] [CrossRef]
  36. SYSTAT for Windows (Version 10); Systat Software, Inc.: San Jose, CA, USA, 2000.
  37. Matheron, G. The Theory of Regionalized Variables and Its Applications; Les Cahiers du Centre de Morphologie Mathématique, No. 5; Ecole des Mines de Paris, Centre de, Géostatistique Fontainebleau: Paris, France, 1971; p. 211. [Google Scholar]
  38. Surfer for Windows (Version 7). 2D and 3D Mapping, Modeling, and Analysis Software; Golden Software, LLC Inc.: Golden, CO, USA, 1999.
  39. Isaaks, E.H.; Srivastava, R.M. An Introduction to Applied Geostatistics; Oxford University Press: New York, NY, USA, 1989. [Google Scholar]
  40. Oliver, M.A.; Webster, R. How geostatistics can help you. Soil Use Manag. 1991, 7, 206–217. [Google Scholar] [CrossRef]
  41. McCarty, G.W.; Lyssenko, N.N.; Starr, J.L. Short-term changes in soil carbon and nitrogen pools during tillage management transition. Soil Sci. Soc. Am. J. 1998, 62, 1564–1571. [Google Scholar] [CrossRef]
  42. Beare, M.H.; Hendrix, P.F.; Cabrera, M.L.; Coleman, D.C. Aggregate-protected and unprotected organic matter pools in conventional- and no-tillage soils. Soil Sci. Soc. Am. J. 1994, 58, 787–795. [Google Scholar] [CrossRef]
  43. Beare, M.H.; Hendrix, P.F.; Coleman, D.C. Water-stable aggregates and organic matter fractions in conventional- and no-tillage soils. Soil Sci. Soc. Am. J. 1994, 58, 777–786. [Google Scholar] [CrossRef]
  44. Zuber, S.M.; Behnke, G.D.; Nafziger, E.D.; Villamil, M.B. Carbon and nitrogen content of soil organic matter and microbial biomass under long-term crop rotation and tillage in Illinois, USA. Agriculture (Switzerland) 2018, 8, 37. [Google Scholar] [CrossRef]
  45. Drees, L.R.; Wilding, L.P.; Karathanasis, A.D.; Blevins, R.L. Micromorphological characteristics of long-term no-till and conventionally tilled soils. Soil Sci. Soc. Am. J. 1994, 58, 508–517. [Google Scholar] [CrossRef]
  46. Blevins, R.L.; Smith, M.S.; Thomas, G.W. Changes in soil properties under no-tillage. In No-Tillage Agriculture: Principles and Practices; Phillips, R.E., Phillips, S.H., Eds.; Van Nostrand Reinhold Company: New York, NY, USA, 1984; pp. 190–230. [Google Scholar]
  47. Qin, R.; Stamp, P.; Richner, W. Impact of tillage on root systems of winter wheat. Agron. J. 2004, 96, 1523–1530. [Google Scholar] [CrossRef]
  48. Qin, R.; Noulas, C.; Herrera, J.M. Morphology and distribution of wheat and maize roots as affected by tillage systems and soil physical parameters in temperate climates: an overview. Arch. Agron. Soil Sci. 2018, 64, 747–762. [Google Scholar] [CrossRef]
  49. Kaiser, M.; Piegholdt, C.; Andruschkewitsch, R.; Linsler, D.; Koch, H.J.; Ludwig, B. Impact of tillage intensity on carbon and nitrogen pools in surface and sub-surface soils of three long-term field experiments. Eur. J. Soil Sci. 2014, 65, 499–509. [Google Scholar] [CrossRef]
  50. Martínez, I.; Chervet, A.; Weisskopf, P.; Sturny, W.G.; Etana, A.; Stettler, M.; Forkman, J.; Keller, T. Two decades of no-till in the Oberacker long-term field experiment: Part I. Crop yield, soil organic carbon and nutrient distribution in the soil profile. Soil Tillage Res. 2016, 163, 141–151. [Google Scholar] [CrossRef]
  51. Mackie-Dawson, L.A.; Mullins, C.E.; Goss, M.J.; Court, M.N.; Fitzpatrick, E.A. Seasonal changes in the structure of clay soils in relation to soil management and crop type. II. Effects of cultivation and cropping at Compton Beauchamp. J. Soil Sci. 1989, 40, 283–292. [Google Scholar] [CrossRef]
  52. Kader, M.A.; Sleutel, S.; D’ Haene, K.; De Neve, S. Limited influence of tillage management on organic matter fractions in the surface layer of silt soils under cereal–root crop rotations. Aust. J. Soil Res. 2010, 48, 16–26. [Google Scholar] [CrossRef]
  53. Perfect, E.; Caron, J. Spectral analysis of tillage-induced differences in soil spatial variability. Soil Sci. Soc. Am. J. 2002, 66, 1587–1595. [Google Scholar] [CrossRef]
  54. Souza, L.S.; Cogo, N.P.; Vieira, S.R. Variabilidade de fósforo, potássio e matéria orgânica no solo em relação a sistemas de manejo. Rev. Bras. Ciên. Sol. 1998, 22, 77–86. [Google Scholar] [CrossRef]
  55. Sainato, C.; Arrigo, N.; Giuffre, L.; Svidovsky, B.; Orden, S.; Palma, M. Sistemas de labranza: análisis geoestadístico de las propiedades de un suelo. Agric. Técn. Chil. 1996, 56, 19–56. [Google Scholar]
  56. Heiniger, R.W. The North Carolina precision farming project: Managing crop production with precision technologies using on-farm tests. In Precision Agriculture: Proceedings of the Third International Conference on Precision Agriculture, Minneapolis, MN, USA, 23–26 June 1996; Robert, P.C., Rust, R.H., Larson, W.E., Eds.; ASA, CSSA, SSSA: Madison, WI, USA, 1998; pp. 1177–1186. [Google Scholar]
  57. Parker, W.; Reynolds, C. Comparison of Tillage Methods for Lime Incorporation, West Binnu 2016 Trial Report. Available online: https://www.agric.wa.gov.au/soil-acidity/comparison-tillage-methods-lime-incorporation-west-binnu-2016-trial-report?nopaging=1 (accessed on 29 March 2019).
  58. Moschler, W.W.; Martens, D.C.; Rich, C.I.; Shear, G.M. Comparative Lime Effects on Continous No-Tillage and Conventionally Tilled Corn. Agron. J. 1973, 65, 781–783. [Google Scholar] [CrossRef]
  59. Sylvester-Bradley, R.; Lord, E.; Sparkes, D.L.; Scott, R.K.; Wiltshire, J.J.J.; Orson, J. An analysis of the potential of precision farming in Northern Europe. Soil Use Manag. 1999, 15, 1–8. [Google Scholar] [CrossRef]
  60. Pionke, H.B.; Corey, R.B.; Schulte, E.E. Contributions of soil factors to lime requirement and lime requirement tests. Soil Sci. Soc. Am. Proc. 1968, 32, 113–117. [Google Scholar] [CrossRef]
  61. Aitken, R.L.; Moody, P.W.; McKinley, P.G. Lime requirement of acidic Queensland soils.II. Comparison of laboratory methods for predicting lime requirement. Aust. J. Soil Res. 1990, 28, 703–715. [Google Scholar] [CrossRef]
  62. Viscarra Rossel, R.A.; McBratney, A.B. Calibration of a Lime Requirement Buffer for Site-Specific Lime Applications in South-Eastern Australia. In Proceedings of the Precision Agriculture ’99. 2nd European Conference on Precision Agriculture, Odense, Denmark, 11–15 July 1999; Sheffield Academic Press: Sheffield, UK, 1999; pp. 429–440. [Google Scholar]
  63. Gray, A.W.; Harman, W.L.; Richardson, J.W.; Wiese, A.F.; Regier, G.C.; Zimmel, P.T.; Lansford, V.D. Economic and financial viability of residue management: An application to the Texas High Plains. J. Prod. Agric. 1997, 10, 175–183. [Google Scholar] [CrossRef]
  64. Weisz, R.; Bowman, D.T. Influence of tillage system on soft red winter wheat cultivar selection. J. Prod. Agric. 1999, 12, 415–418. [Google Scholar] [CrossRef]
  65. Weisz, R.; Crozier, C.R.; Heiniger, R.W. Optimizing nitrogen application timing in no-till soft red winter wheat. Agron. J. 2001, 93, 435–442. [Google Scholar] [CrossRef]
  66. Ginting, D.; Moncrief, J.F.; Gupta, S.C. Performance of a variable tillage system based on interactions with landscape and soil. Precis. Agric. 2003, 4, 19–34. [Google Scholar] [CrossRef]
  67. Leake, A.R.; Paulson, G.A. An evaluation of soil mineral N, leaf chlorophyll status and crop canopy density on the yield of winter wheat. In Precision Agriculture 1997; BIOS Scientific Publishers Ltd.: Oxford, UK, 1997; Volume I, pp. 137–143. [Google Scholar]
  68. Ma, B.L.; Dwyer, L.M. Within plot variability in available soil mineral nitrogen in relation to leaf greenness and yield. Commun. Soil Sci. Plant Anal. 1999, 30, 1919–1928. [Google Scholar] [CrossRef]
  69. Roel, A.; Plant, R.; Robert, P.C. Spatiotemporal analysis of rice yield variability in California. In Proceedings of the Sixth International Conference on Precision Agriculture and Other Precision Resource Management, Minneapolis, MN, USA, 14–17 July 2002; University of Minnesota; Precision Agriculture Center; ASA, CSSA, and SSSA: Madison, WI, USA, 2003; pp. 125–140. [Google Scholar]
Figure 1. Nested-grid sampling design with 3 m and 1 m intervals between adjacent sampling points within a conventionally and non-tilled winter wheat plot.
Agronomy 09 00182 g001
Figure 2. Spatial patterns of kriged estimates for total N concentration (%) in the 0–15 cm soil layer, grain yield (kg ha−1) and grain N uptake (kg ha−1) in tillage plots (9 × 15 m) in Schafisheim (1999, second replication). Left: no-tillage (NT); right: conventional tillage (CT).
Agronomy 09 00182 g002
Table 1. Descriptive statistics of total N content (Ntot) (g kg−1), total C content (Ctot) (g kg−1) and pH (H2O) at two soil depths in no-tillage (NT) and conventional-tillage (CT) plots in three environments. 1999, n = 120; 2000, n = 144.
1999 2000
ZollikofenSchafisheimSchafisheim
CTNTCTNTCTNT
Ntot (0–15 cm)Mean1.361.391.661.992.022.10
SD 10.160.200.290.220.250.26
CV (%) 211.914.217.411.112.412.4
Min.0.90.90.81.51.51.5
Max.1.72.13.02.82.62.8
Ntot (15–30 cm)Mean1.571.391.701.501.631.28
SD 10.340.270.270.210.320.27
CV (%) 221.419.515.613.819.520.8
Min.0.70.71.20.90.90.6
Max.2.22.02.42.02.32.1
Ctot (0–15 cm)Mean20.020.722.425.115.116.0
SD 11.561.621.731.791.771.64
CV (%) 27.87.87.77.111.710.2
Min.131715191110
Max.232826291922
Ctot (15–30 cm)Mean17.916.119.817.312.08.9
SD 12.032.172.621.682.522.03
CV (%) 211.313.513.29.721.022.9
Min.1291314610
Max.222127231815
pH (0–15 cm)Mean5.85.86.26.26.26.1
SD 10.230.410.090.150.130.19
CV (%) 24.17.11.52.42.13.2
Min.5.34.86.05.95.95.6
Max.6.66.86.56.66.66.5
1 SD, Standard deviation; 2 CV, Coefficient of variation (%).
Table 2. Analysis of variance (ANOVA) of soil chemical properties (Ntot, Ctot, pH) at different soil depths with the experimental factors “Environment” (Zollikofen 1999, Schafisheim 1999 and Schafisheim 2000) and “Tillage system” (Conventional tillage, CT, and no-tillage, NT).
Source of variationdfNtot
(0–15cm)
Ntot
(15–30 cm)
Ctot
(0–15 cm)
Ctot
(15–30 cm)
pH (H2O)
(0–15 cm)
Environment (E)2**NS******
Error a6
Tillage system (T)1******NS
T × E2NSNSNSNSNS
Error b6
R2 0.960.920.990.990.81
*, **, ***, Significant at the 0.05, 0.01 and 0.001 probability levels, respectively; NS, is no significant.
Table 3. Geostatistical parameters (ranges of influence (a) in (m), nugget variance (C0), structural variance (Cv), index of spatial dependence (C/(C0 + C)) in (%)) of grain yield and soil properties in no-till (NT) and conventionally tilled (CT) plots in two directions of the fields. X, in the across-row direction; Y, in the management direction (along-row); Means of 9 plots and 384 sampling points.
Parameter X-DirectionY-Direction
CTNTpCTNTp
Ranges of influence (a)Grain yield3.03.2NS5.14.2NS
(m)Ntot (0–15cm)3.32.6NS1.05.6*
Ntot (15–30 cm)3.05.13.56.7*
Ctot (0–15 cm)3.34.7NS3.75.2NS
Ctot (15–30 cm)2.82.7NS5.44.9NS
pH (H2O) (0–15 cm)3.63.9NS5.45.7NS
Nugget variance (C0)Grain yield1.54 × 1051.59 × 105NS8.67 × 1041.88 × 105NS
Ntot (0–15cm)2.01 × 10−41.78 × 10−4NS2.34 × 10−41.73 × 10⁻⁴NS
Ntot (15–30 cm)1.51 × 10−41.52 × 10−4NS2.63 × 10−41.49 × 10⁻⁴
Ctot (0–15 cm)7.8 × 10−36.8 × 10−3NS1.17 × 10−21.22 × 10⁻²NS
Ctot (15–30 cm)11 × 10−39.0 × 10−3NS1.40 × 10−21.50 × 10⁻²NS
pH (H2O) (0–15 cm)12 × 10−36.2 × 10−3**8.1 × 10−35.1 × 10−3NS
Structural variance (Cv)Grain yield2.56 × 1053.83 × 105NS3.23 × 1053.25 × 105NS
Ntot (0–15cm)2.42 × 10−41.34 × 10−4NS1.55 × 10−42.84 × 10⁻⁴NS
Ntot (15–30 cm)3.99 × 10−43.56 × 10−4NS6.7 × 10−45.8 × 10⁻⁴NS
Ctot (0–15 cm)1.27 × 10−21.41 × 10−2NS8.6 × 10−315.6 × 10⁻³NS
Ctot (15–30 cm)2.76 × 10−21.41 × 10−22.27 × 10−21.69 × 10−2NS
pH (H2O) (0–15 cm)1.46 × 10−21.27 × 10−2NS1.88 × 10−24.02 × 10⁻²*
Index of spatial depen.Grain yield4455NS7354NS
C/(C0 + C), (%)Ntot (0–15cm)4143NS1658*
Ntot (15–30 cm)6367NS4569NS
Ctot (0–15 cm) 4768NS4851NS
Ctot (15–30 cm)5945NS6451NS
pH (H2O) (0–15 cm)3858NS6781NS
†, *, ** Significant at the 0.1, 0.05 and 0.01 probability levels, respectively; NS, is no significant.
Table 4. Descriptive statistics of winter wheat traits in no tillage (NT) and conventional-tillage (CT) plots in three environments. 1999, n = 120; 2000, n = 144.
1999 2000
ZollikofenSchafisheimSchafisheim
CTNTCTNTCTNT
Grain yield 1Mean4.34.05.04.95.85.7
(Mg ha1)SD 20.600.630.690.830.540.59
CV (%) 313.915.813.617.19.210.3
Min.2.92.62.81.44.44.4
Max.5.96.16.98.17.07.0
Biomass yield 1Mean12.311.012.312.114.513.8
(Mg ha1)SD 21.651.821.801.801.431.61
CV (%) 313.416.614.615.39.911.6
Min.9.17.17.14.710.99.6
Max.16.817.416.617.618.317.8
Ears m2Mean505444494400519523
SD 27867106797952
CV (%) 315.515.021.519.715.39.9
Min.336307256187356392
Max.713639752633684654
Grain protein concentr.Mean150133148148166161
(g kg1)SD 210.011.06.57.68.38.8
CV (%) 36.38.34.05.15.05.4
Min.125105129125151139
Max.172154161187190186
Grain N uptakeMean113.493.3130.8126.0168.5159.3
(kg ha1)SD 215.318.117.621.516.915.6
CV (%) 313.519.413.517.110.09.8
Min.79.047.971.040.2121.8124.5
Max.157.7152.4173.6210.0213.0197.4
Above-ground plant NMean182.3144.4201.2185.8244.0224.8
(kg ha1)SD 227.829.329.831.526.327.1
CV (%) 315.320.314.817.010.812.1
Min.123.474.7116.786.2188.2162.0
Max.267.6227.6270.3322.2306.6297.1
1 Yields are on a dry matter basis; 2 SD, Standard deviation; 3 CV, Coefficient of variation (%).
Table 5. Descriptive statistics of leaf greenness (SPAD readings) of the flag leaf of winter wheat at four different growth stages: (BBCH 39: flag leaf fully unrolled; BBCH 51: beginning of heading; BBCH 69: end of flowering; BBCH 75: midway through fruit development) in no tillage (NT) and conventional-tillage (CT) plots in three environments. 1999, n = 120; 2000, n = 144.
1999 2000
ZollikofenSchafisheimSchafisheim
CTNTCTNTCTNT
BBCH stage 39Mean37.935.739.638.741.742.1
(Flag leaf unrolled)SD 12.53.23.03.32.02.3
CV (%) 26.59.07.58.54.75.4
Min.32.925.631.728.536.435.2
Max.43.543.746.245.148.046.9
BBCH stage 51Mean36.435.438.037.643.842.8
(Beginning of heading)SD 12.52.92.93.12.93.3
CV (%) 26.88.47.78.16.67.7
Min.30.326.630.230.634.919.7
Max.42.343.942.546.449.149.7
BBCH stage 69Mean37.135.640.340.041.741.1
(End of flowering)SD 13.13.21.92.63.23.3
CV (%) 28.49.04.76.47.78.1
Min.29.028.135.432.034.733.9
Max.45.443.244.549.848.049.4
BBCH stage 75Mean28.426.530.731.338.238.0
(Milk development)SD 13.12.93.23.14.04.0
CV (%) 210.810.910.49.810.510.6
Min.21.820.523.524.230.523.3
Max.36.032.637.837.847.146.9
1 SD, Standard deviation; 2 CV, Coefficient of variation (%).

