Article

Effects of Maize Residue Biochar Amendments on Soil Properties and Soil Loss on Acidic Hutton Soil

Department of Agronomy, University of Fort Hare, Private Bag X1314 Alice 5700, South Africa
*
Author to whom correspondence should be addressed.
Agronomy 2018, 8(11), 256; https://doi.org/10.3390/agronomy8110256
Submission received: 22 September 2018 / Revised: 6 November 2018 / Accepted: 6 November 2018 / Published: 10 November 2018

Abstract

:
Soil acidification is a serious challenge and a major cause of declining soil and crop productivity in the Eastern parts of South Africa (SA). An incubation experiment investigated effects of different maize residue biochar rates on selected soil properties and soil loss in acidic Hutton soils. Biochar amendment rates were 0%, 2.5%, 5%, 7.5%, and 10% (soil weight) laid as a completely randomized design. Soil sampling was done on a 20-day interval for 140 days to give a 5 × 7 factorial experiment. Rainfall simulation was conducted at 60, 100 and 140 days after incubation to quantify soil loss. Relative to the control biochar amendments significantly improved soil physicochemical properties. After 140 days, biochar increased soil pH by between 0.34 to 1.51 points, soil organic carbon (SOC) by 2.2% to 2.34%, and microbial activity (MBC) by 496 to 1615 mg kg−1 compared to control. Soil aggregation (MWD) changes varied from 0.58 mm to 0.70 mm for the duration of the trial. Soil loss significantly decreased by 27% to 70% under biochar amendment compared to control. This indicates that maize residue biochar application has the potential to improve the soil properties and reduce soil loss in the degraded acidic Hutton soil.

1. Introduction

Agricultural soils of SA are highly susceptible various forms of degradation [1,2]. Crop fields and communal grazing lands are the most affected especially in the Eastern Cape Province [3]. Soil acidification is a serious challenge and the most important cause of decreasing soil fertility and crop yields in SA [4]. Despite some SA soils being naturally acidic especially in the higher rainfall areas; anthropogenic activities which result in declining levels of organic matter exacerbate soil degradation [4,5]. Inappropriate cultivation practices of the highly weathered soils often result in increased soil organic matter (SOM) exhaustion, soil acidification, and severe soil erosion [6]. Accelerated acidification of soils under cultivation is most often the result of increased mineralisation of organic matter (OM), oxidation of ammoniacal fertilisers to nitric acid and removal of the basic cations during harvesting [7]. Soil acidification results in loss of base cations by leaching below the plant root zone and limiting crop and forage production. Severe acidification can cause non-reversible clay mineral dissolution and a reduction in cation exchange capacity (CEC), accompanied by soil structure deterioration [8]. Effective soil amendments to correct acidification are critical in improving and preservation of soil fertility and structural build-up which are vital for sustainable agricultural development and food security [9,10,11,12].
Recently much focus has been made on biochar use in soils because of its ability to boost SOC and enhancing soil quality [13]. Biochar is a “carbon-rich by-product of the thermal degradation of organic materials in the absence of air, a process called pyrolysis, and distinguished from charcoal by its use as a soil amendment” [14]. Biochar is produced from a wide variety of biomass materials and pyrolysis conditions. However, the responses of biochar are specific to the site (soil and climate), feedstock, preparation method and conditions [15,16]. Laird et al. [17], reported that the carbon (C) content of biochar varies from <1% to >80%, subject to the feedstock and the pyrolysis conditions. Biochar, therefore, provides a unique opportunity to improve physicochemical properties and protect soils from erosion using locally available materials [18]. Researchers have been advocating for infield crop residue retention as a means of boosting SOM subsequently improving soil quality [19]. However, retaining and/or incorporation of crop residues is a major challenge under smallholder agriculture, where the residues are assigned various uses, a phenomenon known as crop residue trade-offs [19,20]. Additionally, maintaining the long-term aggregate stability of soil by applying fresh organic residues is difficult because of the rapid degradation of the fresh organic materials, especially under tropical conditions. Hence, biochar may be a potential amendment that could protect hard setting soil from rapid degradation in the long term, thus increasing soil quality.
Biochar characteristics e.g., chemical composition, surface chemistry, particle and pore size distribution, physical and chemical stabilisation mechanisms in soils, determine its effects on soil functions [21]. Application of biochar to enhance soil quality, adaptation and mitigation of climate variability has been reported by many researchers [12,22,23,24,25,26,27,28]. Biochar incorporation increases aggregate stability by acting as a binding agent the formation of macroaggregates [29,30]. A study [11] observed that bulk density (BD) significantly decreased from 1.42 Mg m−3 to <1.15 Mg m−3, after 105 days of incubation, while similar results were reported by [16]. In hard setting soil, tensile strength was reduced from 64.4 kPa to 31 kPa [31]. Porosity and hydraulic conductivity were reported to increase in soils amended with biochar [11,32]. A correlation between increase in porosity and water retention was observed which consequently resulted in increased root growth by approximately 47% [33]. Other indirect effects of biochar are an increase of CEC, decrease in nutrient leaching and water retention, due to its high surface area and porous nature [34].
Amending soils with biochar from crop residues has been suggested as one effective counter measure to mitigate climate change [35]. According to [16], approximately 2.2 Mton year−1 of SOC can potentially be sequestered through biochar use. Researchers generally agree that C derived from biochar can be retained in soils for approximately 1300–4000 years, which is longer than that of uncharred organic material [21,36,37,38]. Furthermore, about 50% of the initial C can potentially be sequestered when biomass is converted to biochar as opposed to the low amounts retained after burning (3%) and biological decomposition (less than 10–20% after 5–10 years) [39]. Biochar induced changes can raise the content of available nutrient and SOC, while its effects on pH lasts longer and results in significant changes in N cycle [40] compared to lime application
Even though various studies show the potential of biochar in improving soil quality, little is known about the technology and the underlying mechanisms behind these changes in South Africa [41]. Furthermore, there are very few studies on the influences of biochar on the physical properties of soil and soil loss in an acidic soil. Biochar used in most studies was made using advanced pyrolysis methods (muffle furnaces or gasifiers) [10,36,37] while the biochar used in this study was made from locally-made oil drum kilns, a process that can be done by smallholder farmers. Moreover, given the high variability in biochar’s physicochemical properties and its response to different types of soils and climates; estimates from other studies are, therefore, not universal to all locations and types of biochar [15,16,42,43]. While researchers in South Africa have advocated for use of crop residues and manure as sources of OM [44,45], maintaining and accumulating SOC is difficult because of the high rate of decomposition. Biochar, on the other hand resists, degradation. Therefore, further research is necessary to fully understand location-specific findings to account for effects of geographic variations in soil type, climate, cropping, and pyrolysis feedstock [46]. The objective of this study was to examine the effects of maize biochar and its application rates on selected soils properties and soil loss in acidic Hutton soils in South Africa.

2. Materials and Methods

2.1. Soil and Biochar Preparation

Acidic soil from 0–20 cm depth was collected from Hogsback (32°33′ S, 26°54′ E) located in the EC Province, SA. The soil is classified as a Hutton Soil [47] and Humic Ferrasols [48]. Biochar was produced from maize crop residues. Dry crop residues were chopped into small pieces before being put into a 25 L container sealed with a lid to limit the amount of oxygen entering. Pyrolysis was done using a locally made 200 L oil drum retort, at temperatures of up to 500 °C for up to four hours following [49]. Oil drums are relatively cheap and easily available to small holder farmers in South Africa. After cooling the biochar was crushed and passed through a 2 mm sieve and stored in a cold room before use for characterization and the incubation study.

2.2. Experimental Design, Treatments, and Incubation Procedure

Incubation Experiment

Five-kilogram soil samples from Hogsback were thoroughly mixed, using a garden spade, with the biochar at application rates of 0%, 2.5%, 5%, 7.5%, and 10% on a weight per weight basis of soil (w/w) (Table 1). From each soil-biochar mixture, a 1.5 kg sample was kept in glass jars for incubation at field capacity using de-ionised water. A single factor experiment that evaluated five rates of biochar was laid as a completely randomized design three replicates. A pressure plate apparatus was used to determine the field capacity of the soil [50]. The biochar-soil mixtures were incubated at 28 °C at constant temperature and were weighed regularly to maintain constant moisture. Soil sampling to determine the physical and chemical properties was done at 20 days interval for a total incubation time of 140 days. At each sampling time interval, the samples were oven dried at 65 °C (except for MBC determination) and sieved through a 2 mm sieve for subsequent analysis.

2.3. Soil and Biochar Analysis

Both the soil pH and electrical conductivity (EC) were determined using distilled water at a ratio 1:2.5 (weight/volume basis) (Crison Instruments, Barcelona, Spain) [51,52]. The pH of biochar was determined in water at a ratio 1:5 (weight/volume basis) following [53]. Ash content was determined by heating biochar samples in a muffle furnace at 750 °C for 6 h and volatile matter was determined by heating the biochar at 950 °C for 11 min in a covered crucible furnace as described by [41,54]. Scanning electron microscopy (SEM) (JEOL JSM-6390LV, Jeol, Tokyo, Japan) and energy dispersive spectroscopy (EDX) (Thermo Scientific Noran System Six, Beverly, MA, USA) were used to observe structural characteristics and mineral phases of the composition of maize biochars samples. Total soil carbon (TOC) and nitrogen (TN) was measured by dry combustion method using a LECO TruSpec C/N auto analyser (LECO Corporation, St Joseph, MI, USA) [55] using air-dry and ground soil and biochar. The extractable cations Na, K, Ca, and Mg were extracted using ammonium acetate buffered at pH 7 [51]. The modified Walkey-Black method as outlined in [51] was used to determine SOC.
Soil microbial biomass carbon (MBC) was determined by the modified chloroform fumigation-extraction followed by the dichromate oxidation of C [56]. For each treatment, two 15 g of fresh soil with known moisture content were weighed into a crucible and placed into a separate desiccator. Both fumigated and unfumigated samples were kept in dark for 72 h at room temperature. Organic C in both the fumigated and unfumigated samples was extracted using 50 mL of 0.5 M potassium sulphate. Organic C in the extracts was then determined using the dichromate oxidation method [57].
Soil BD was determined using the core method [52]; thereafter it was used to determine porosity, assuming of a particle density of 2.65 g cm−3 [58]. Soil particle size distribution was determined by the hydrometer method [52]. Soil aggregate stability of the 2 mm air dried samples was determined as described in [59].

2.4. Soil Loss

Soils from the incubation experiment were used in determining soil loss using a rainfall simulator for erosion tests (LUW, Eijelkamp Equipment, Giesbeck, The Netherlands). The splash cups containing 50 g of soil were slowly pre-wetted from the bottom with tap water until saturated and then placed under the rainfall simulator. The samples were subjected to simulated 8-min single rainstorm at 360 mm h−1. According to Martin et al. [60], the high-intensity rainfall was used to offset for the short falling distance of 0.4 m of each simulated raindrop and the resulting low volume specific kinetic energy of the applied shower. Similar rainfall events were used by [61,62] The same authors [60], further state that natural rainfall events with this time specific kinetic energy approximate natural rainfall intensities of about 60 mm h−1. All simulations were replicated three times. The prewetted soil in splash cups was placed under the simulator which applied raindrops of 5.9 mm in diameter from the 49 capillary tubes spread over its surface. The time-specific energy of the simulated rain was 1440 J m−2 hr−1. Splashed sediments were oven dried at 105 °C for 24 h and weighed. The weight was converted from soil loss in grams per splash cup area (0.07 m2) to t ha−1.

2.5. Statistical Analysis

JMP version 14.0 statistical software (SAS Institute, Inc., Cary, NC, USA), was used for analysis of variance (ANOVA) for all parameters. Mean separations were conducted using Duncan’s new multiple range test (MRT) at p < 0.05 test when ANOVA indicated a significant p-value.

3. Results and Discussion

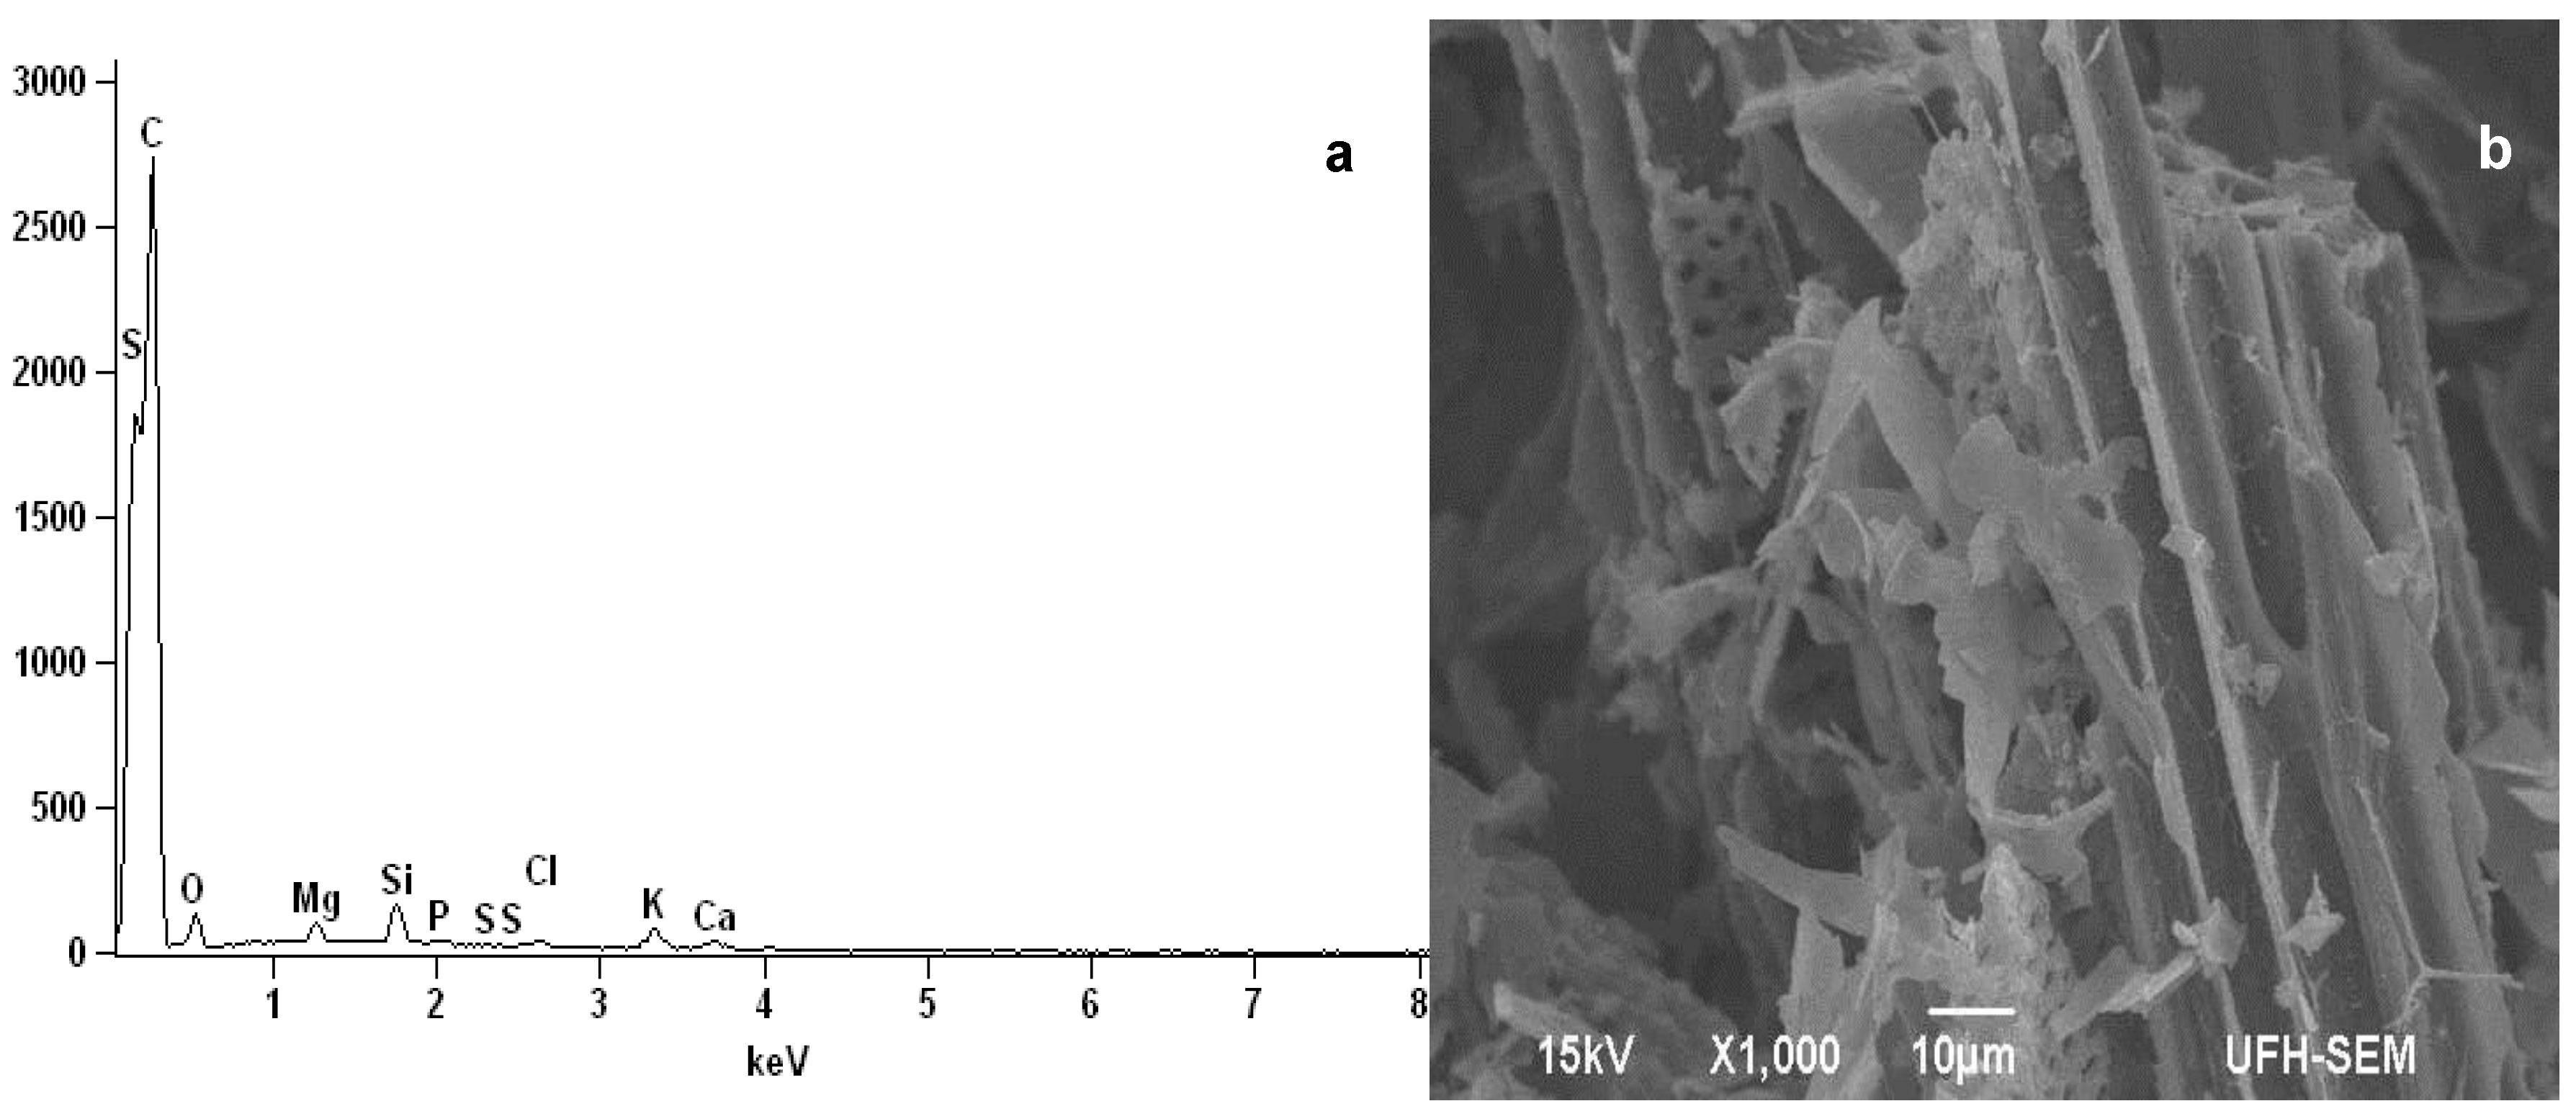
3.1. Biochar and Soil Properties

Table 2 presents selected physicochemical properties of the soil and biochar used in the study. The soil had TOC of 2.6%, soil organic carbon of 2.2% and very low pH (4.1). Maize residue biochar had a high pH (9.42) and a high ash content of 43.34% and volatile matter of 8.57% which potentially contributed to its liming potential in the study (Table 2). The biochar had a total carbon of 46.89% and total nitrogen of 1.92%. Exchangeable bases were lower in the biochar than the soil. This is also shown in the EDS analysis (Figure 1).

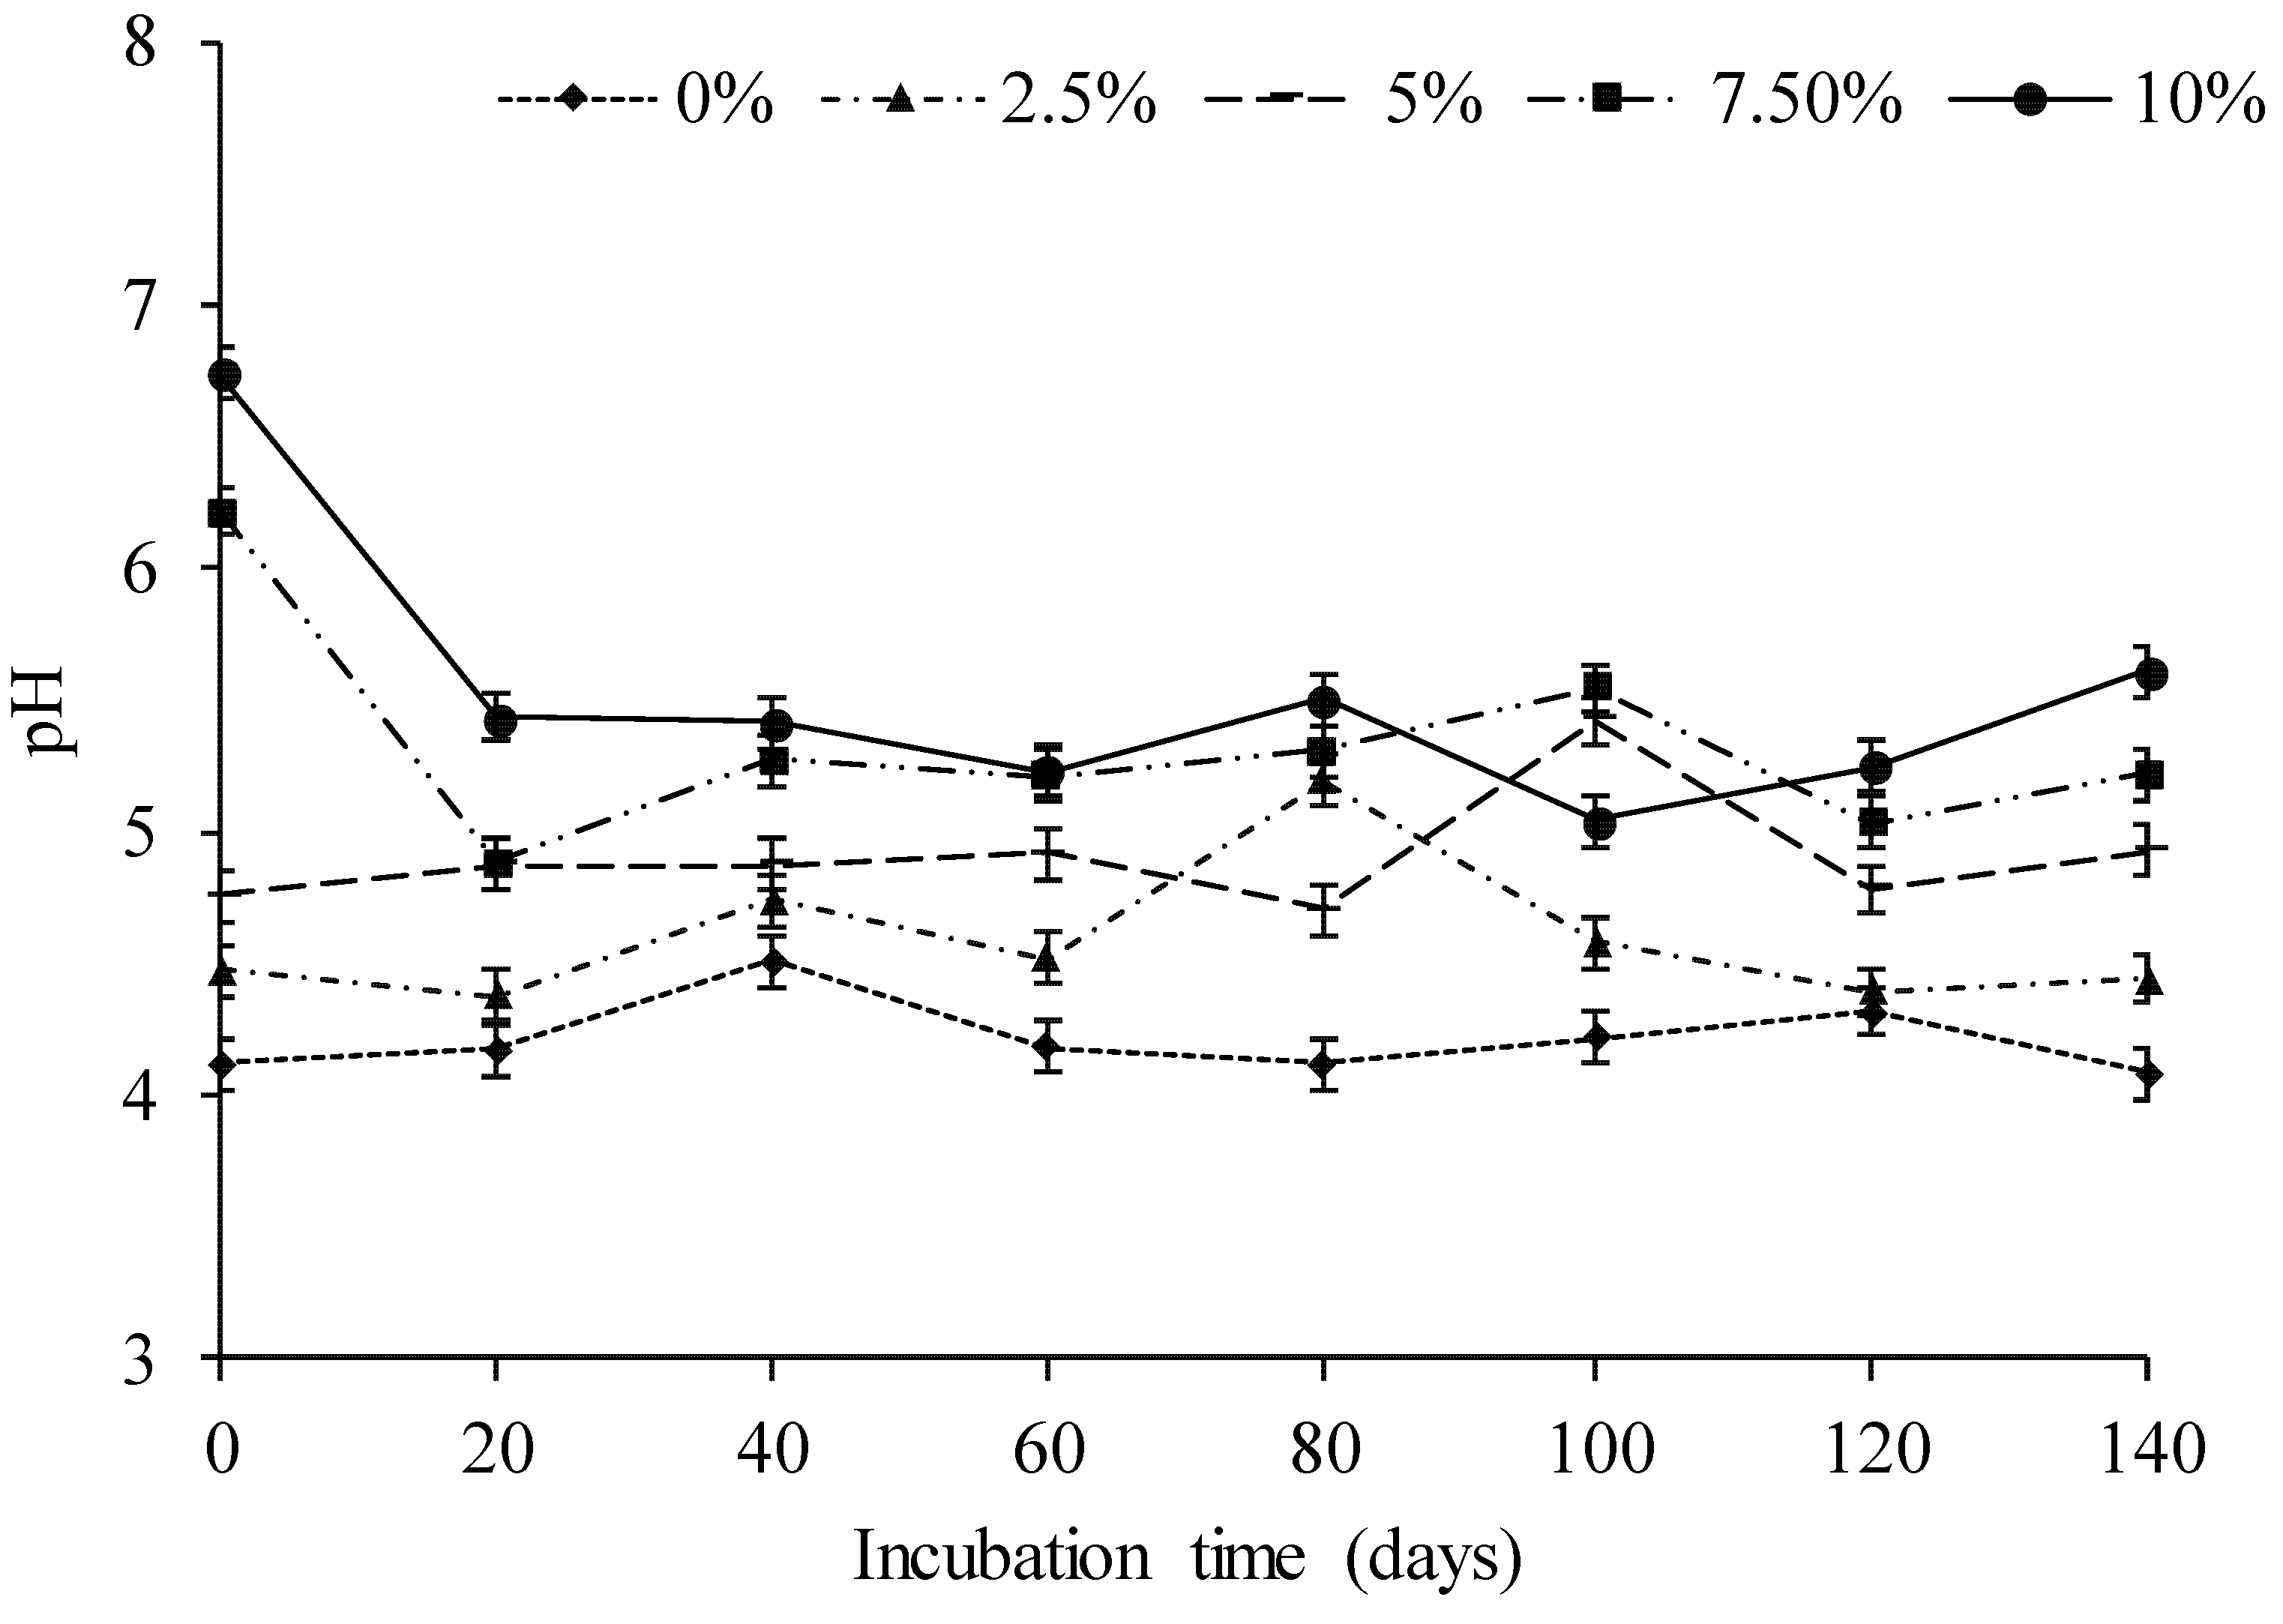
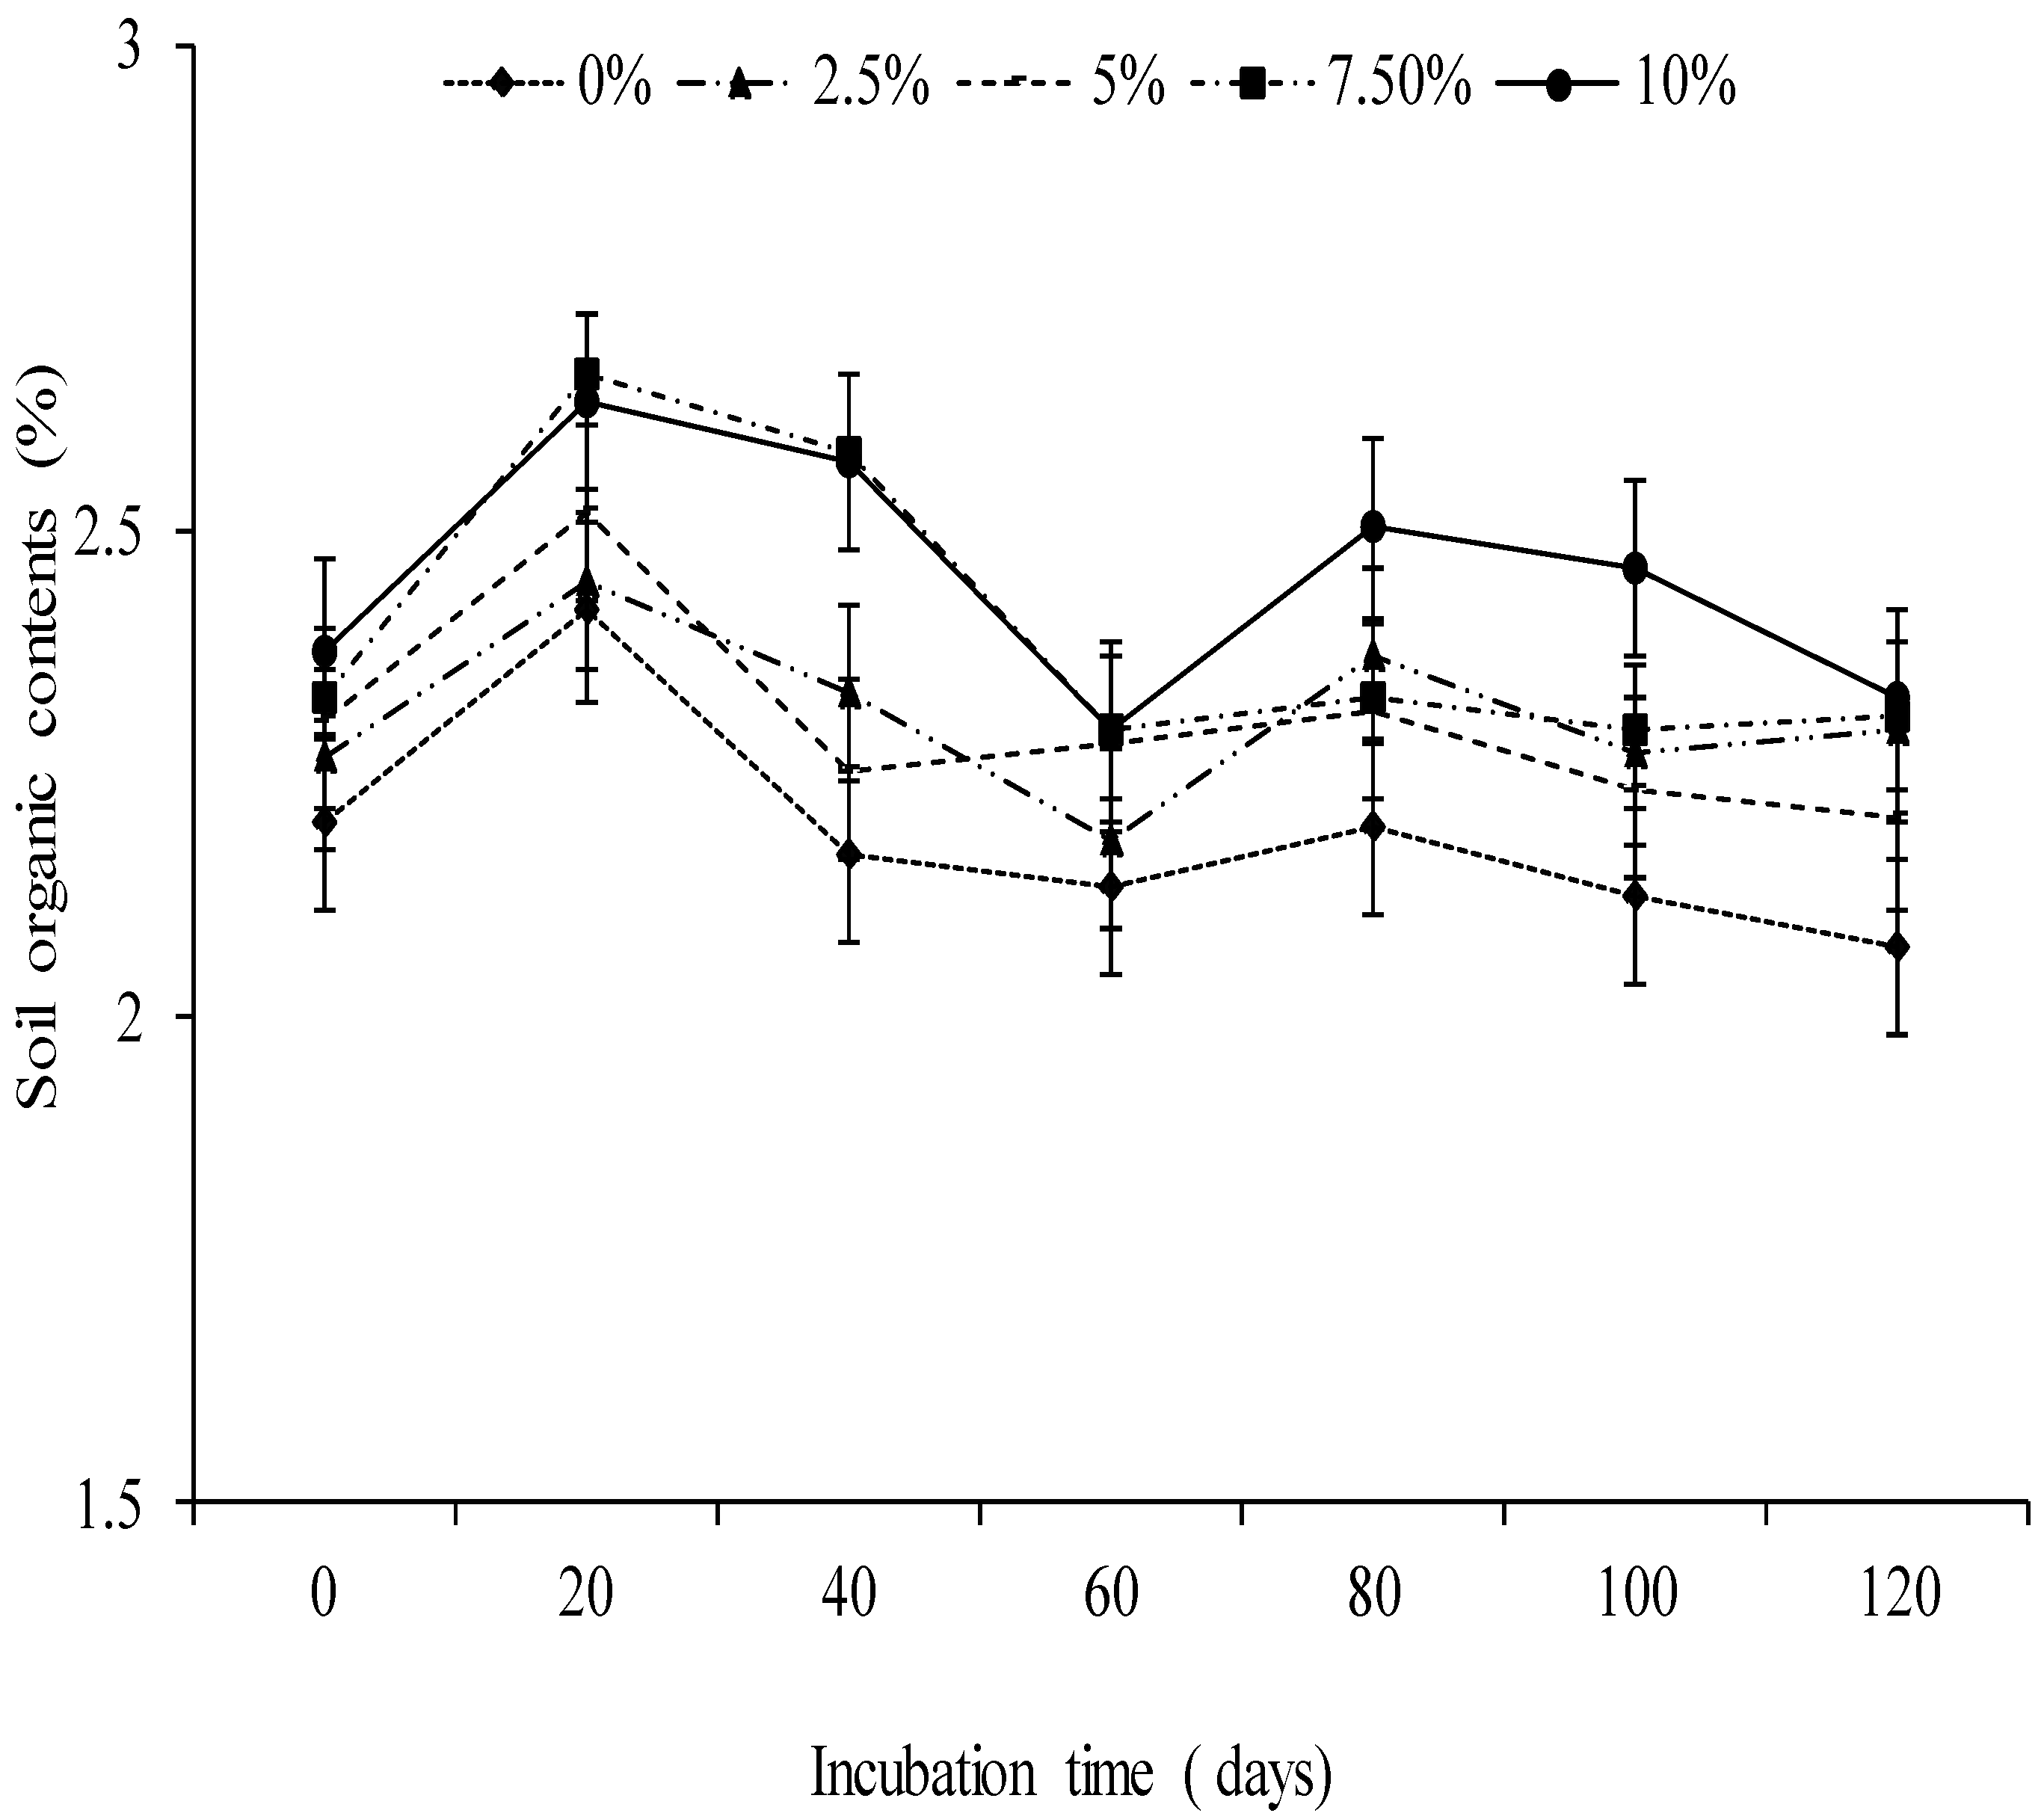
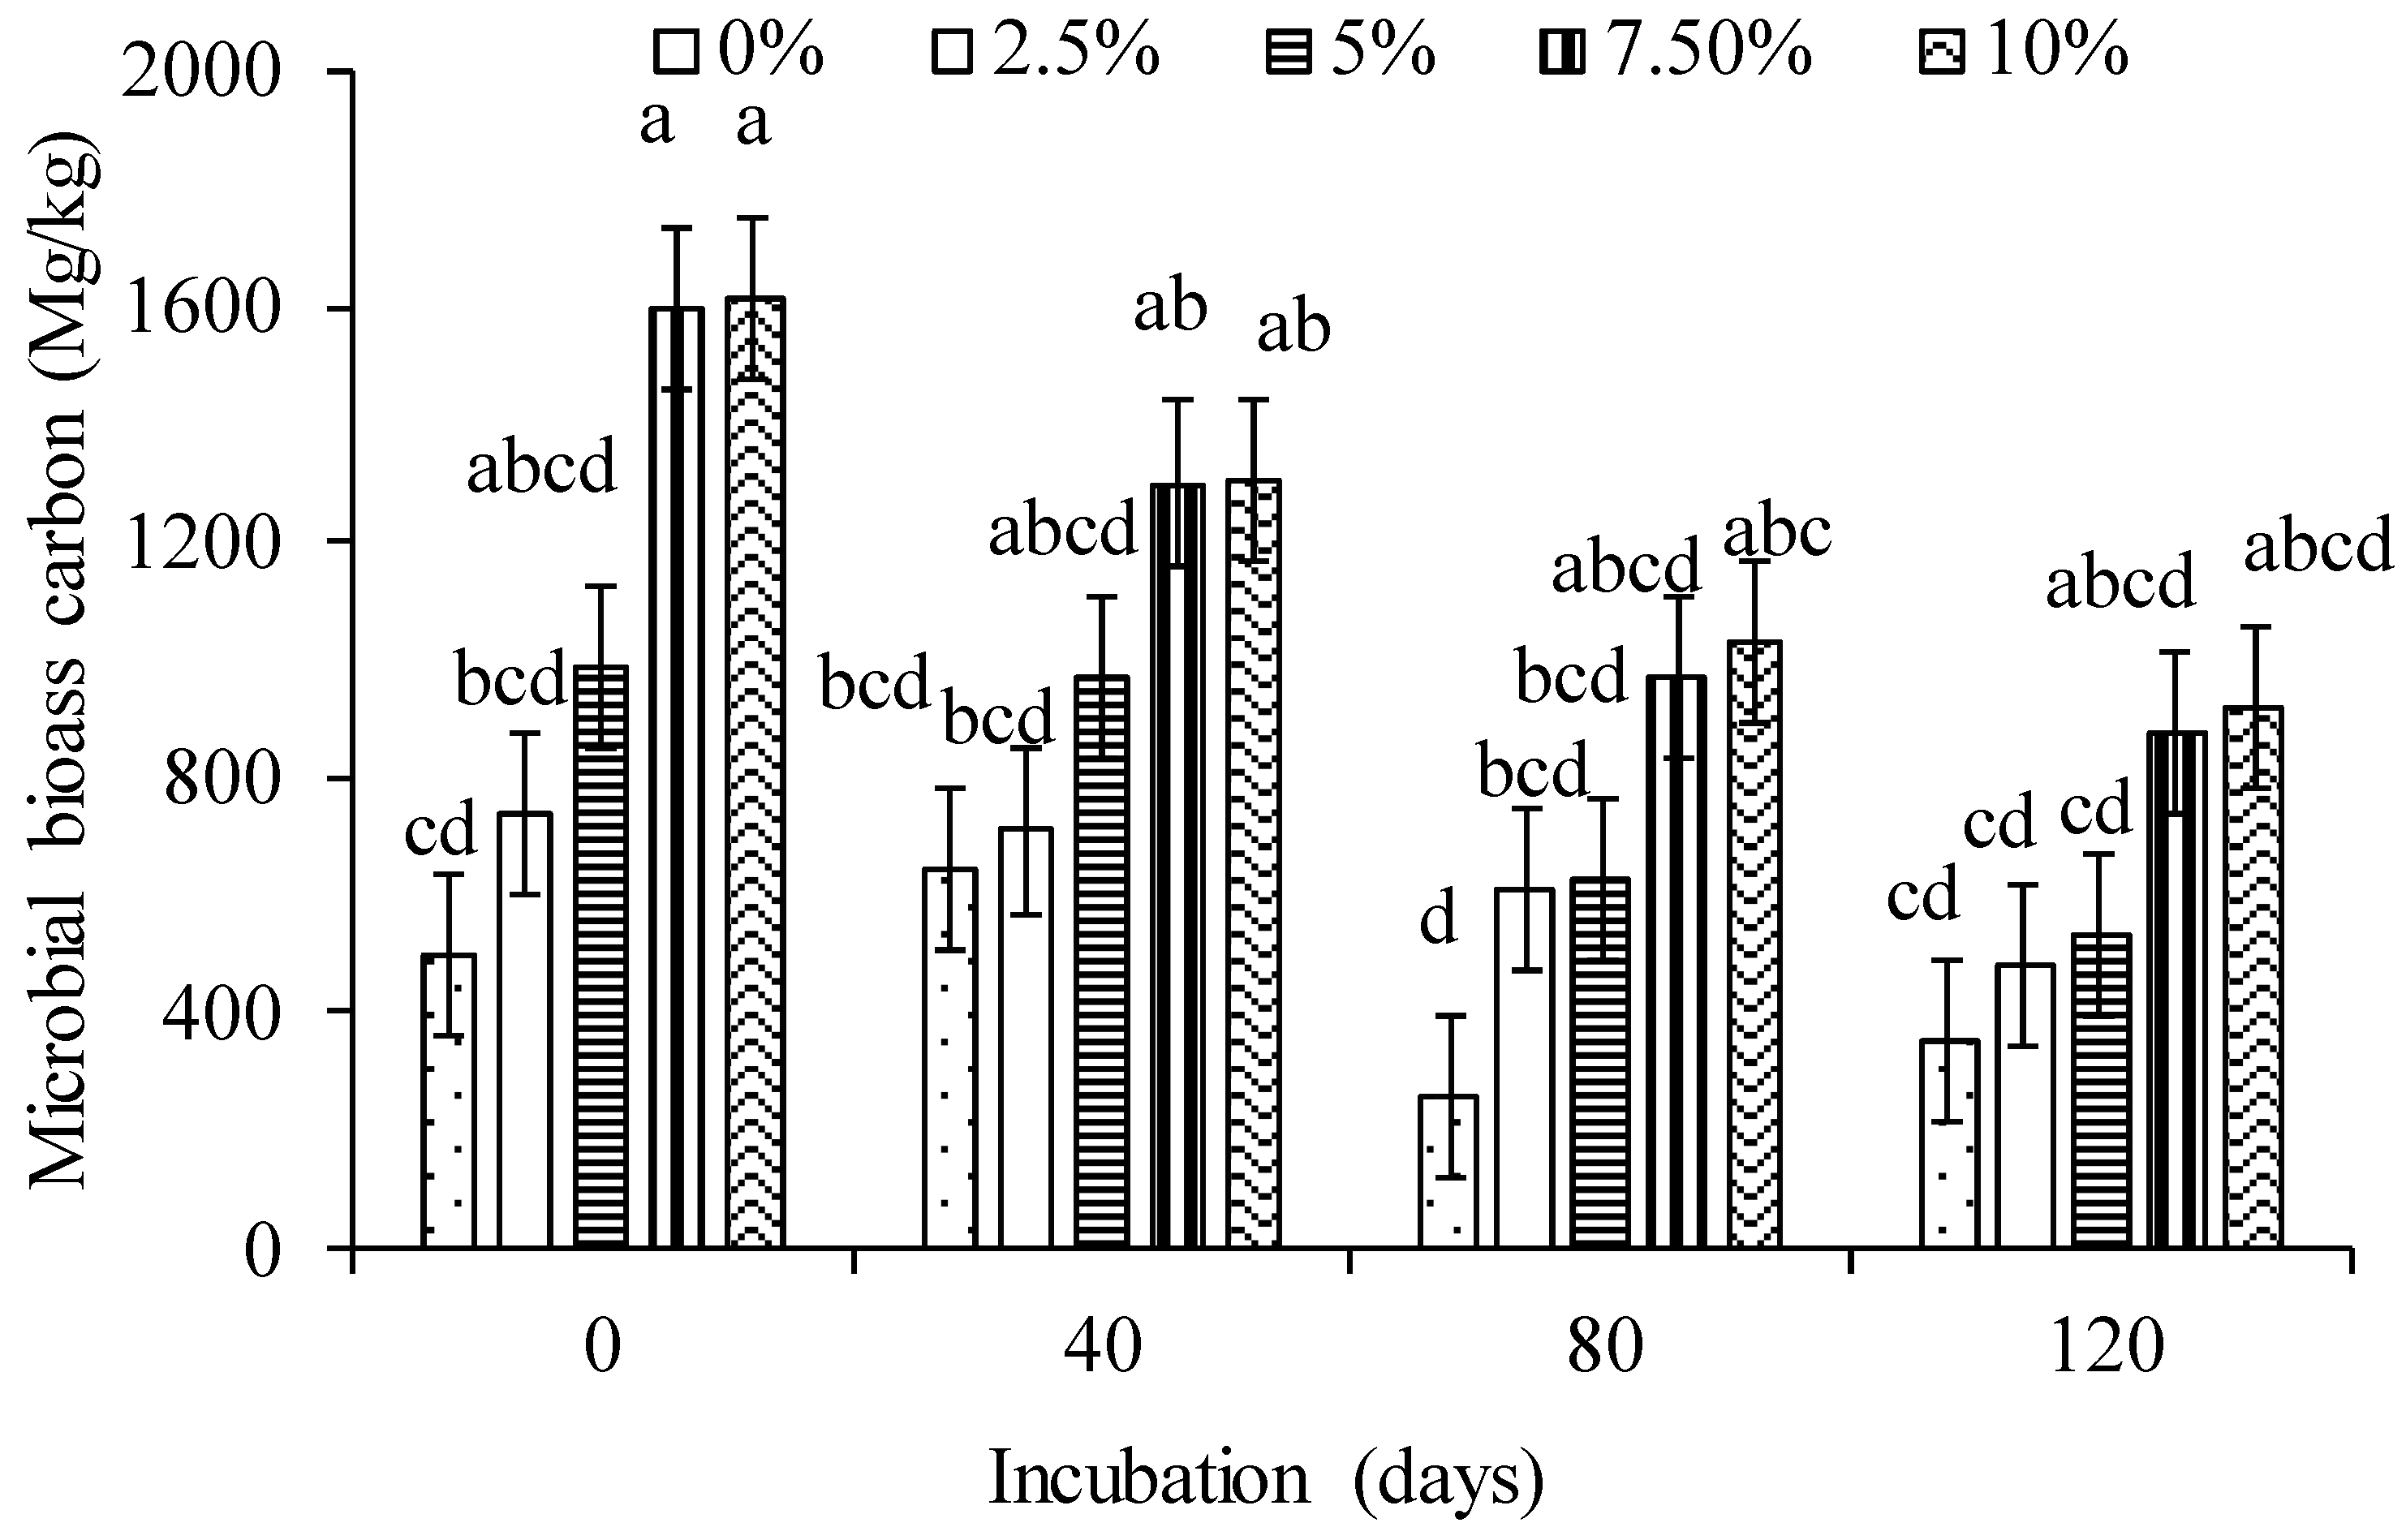
3.2. Effects of Biochar on Chemical Properties

The soil pH was significantly (p < 0.0001) affected by biochar amendment (Table 3; Figure 2). There were highly significant interactions between time and the biochar application rates on pH (p < 0.001; Table 3). The results showed that amending the soil with biochar increased pH across all the application rates which were found to be directly proportional to the rate of application. Observations are in line with [11,63]. The greatest changes in soil pH were observed at week 0. The highest soil pH was found in soils treated at 10% biochar rate (pH, 6.74) relative to the control treatment (pH, 4.1) (Figure 2). The soil pH was increased by 1.51, 1.12, 0.83, and 0.34 at 10%, 7.5%, 5%, and 2.5% biochar application rates at the end of day the 140 period, respectively (Figure 2). Maize residue biochar has the potential to act as an effective liming material as evidenced by the increase in soil pH following biochar amendment. Similar findings were reported by [64,65,66,67]. The liming potential of biochar used in this study can possibly be attributed to the high ash content (43.34%). Biochar ash content is very variable and dependent on the feedstock [42,68], biochar with low ash content will have little effect on the soil pH. Biochar ash alkalinity and the mineralization of organic N in the soil are associated with an increase in soil pH at the inception of the incubation while the nitrification of NH4+ to NO3 in the soil presumably decreased soil pH with time in the incubation; the balance of these reactions determined the final soil pH [63]. Additionally, the high surface area and porous nature of biochar can potentially increase the cation exchange capacity of the soil, which increases the potential for sorption of many organic and inorganic substances.
No interaction was observed between incubation time and biochar rates on SOC (p > 0.05), however, significantly different observations were found with biochar application rates and incubation time (p < 0.0001; Table 3). The biochar amended soils had significantly higher SOC than the control throughout the incubation period (Figure 3). The results also indicate that increase in SOC was proportional to the biochar application rates. The highest SOC (2.66%) was observed on day 20 at biochar application rate of 7.5% while the control with no biochar decreased to 2.2% from 2.0% (Figure 3). However, no significant differences were observed between 10% and 7.5% application rates. According to [69], amending soils with biochar could possibly result in high amounts of SOC which suggests that the OC in biochar is recalcitrant. Furthermore, higher rates of SOC soon after application of biochar could possibly be due to the sorption of labile SOM on to biochar particles, thus decreasing its mineralisation effect [13,70]. Soil microbial activity was significantly affected by biochar application throughout the incubation period (Figure 4). Biochar application at 7.5% and 10% rates were observed to have significantly higher (p < 0.05) MBC followed by 5% as compared to the control throughout incubation period. Highest activity was observed at the start of the incubation which were 496 mg kg−1, 738 mg kg−1, 989 mg kg−1, 1594 mg kg−1, and 1615 mg kg−1 for control, 2.5%, 5%, 7.5%, and 10% biochar amendments, respectively (Figure 4). The increase in MBC can possibly be due to the increase in the soil pH, SOC and the porous structure of the biochar which also corresponds with the gradual decrease in microbial activity as it levels to a constant [11,71]. According to [72], all labile biochar C is fully utilised as an energy source by microorganisms within the first six days, hence the general decrease in MBC from throughout the incubation period. Disturbing the soils by sieving disrupt macro aggregates protecting SOC. Addition of biochar increases mineralization of the exposed labile C in the soil to microbial attack facilitating co-metabolic decomposition of biochar [73,74] This promotes a rapid microbial growth [70] within the first few days after biochar application at 60% moisture content (Figure 4).

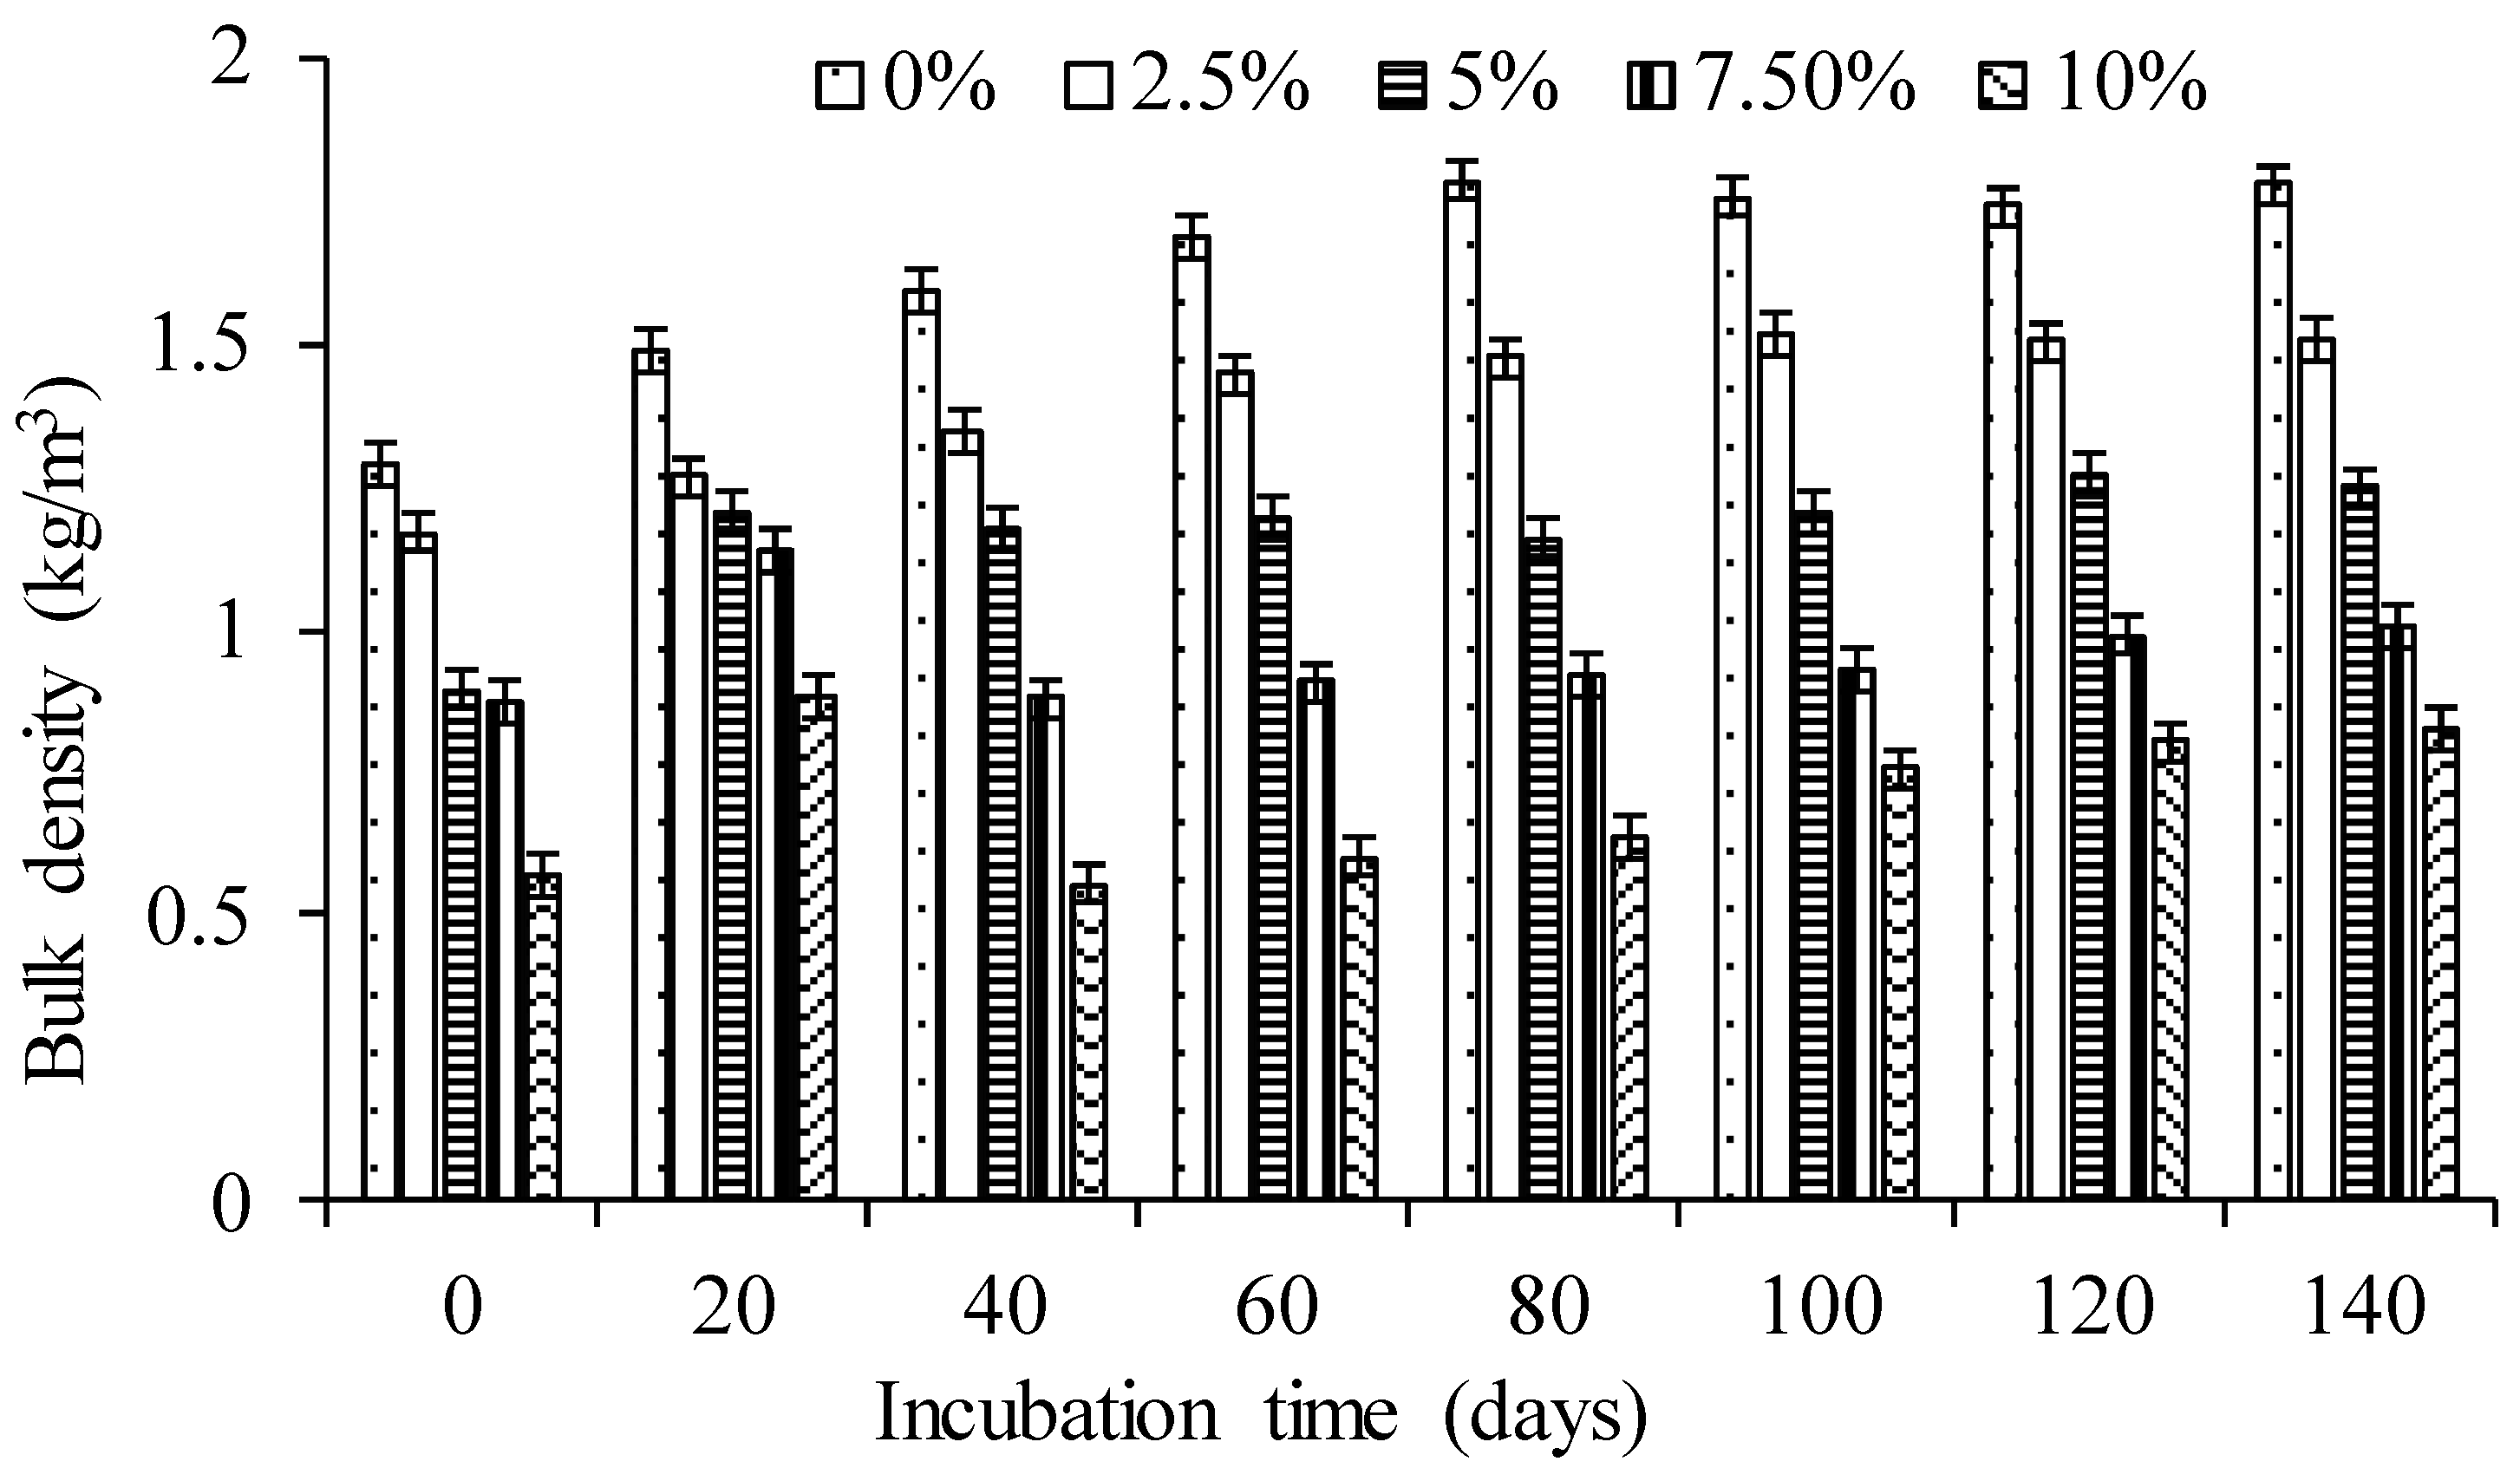
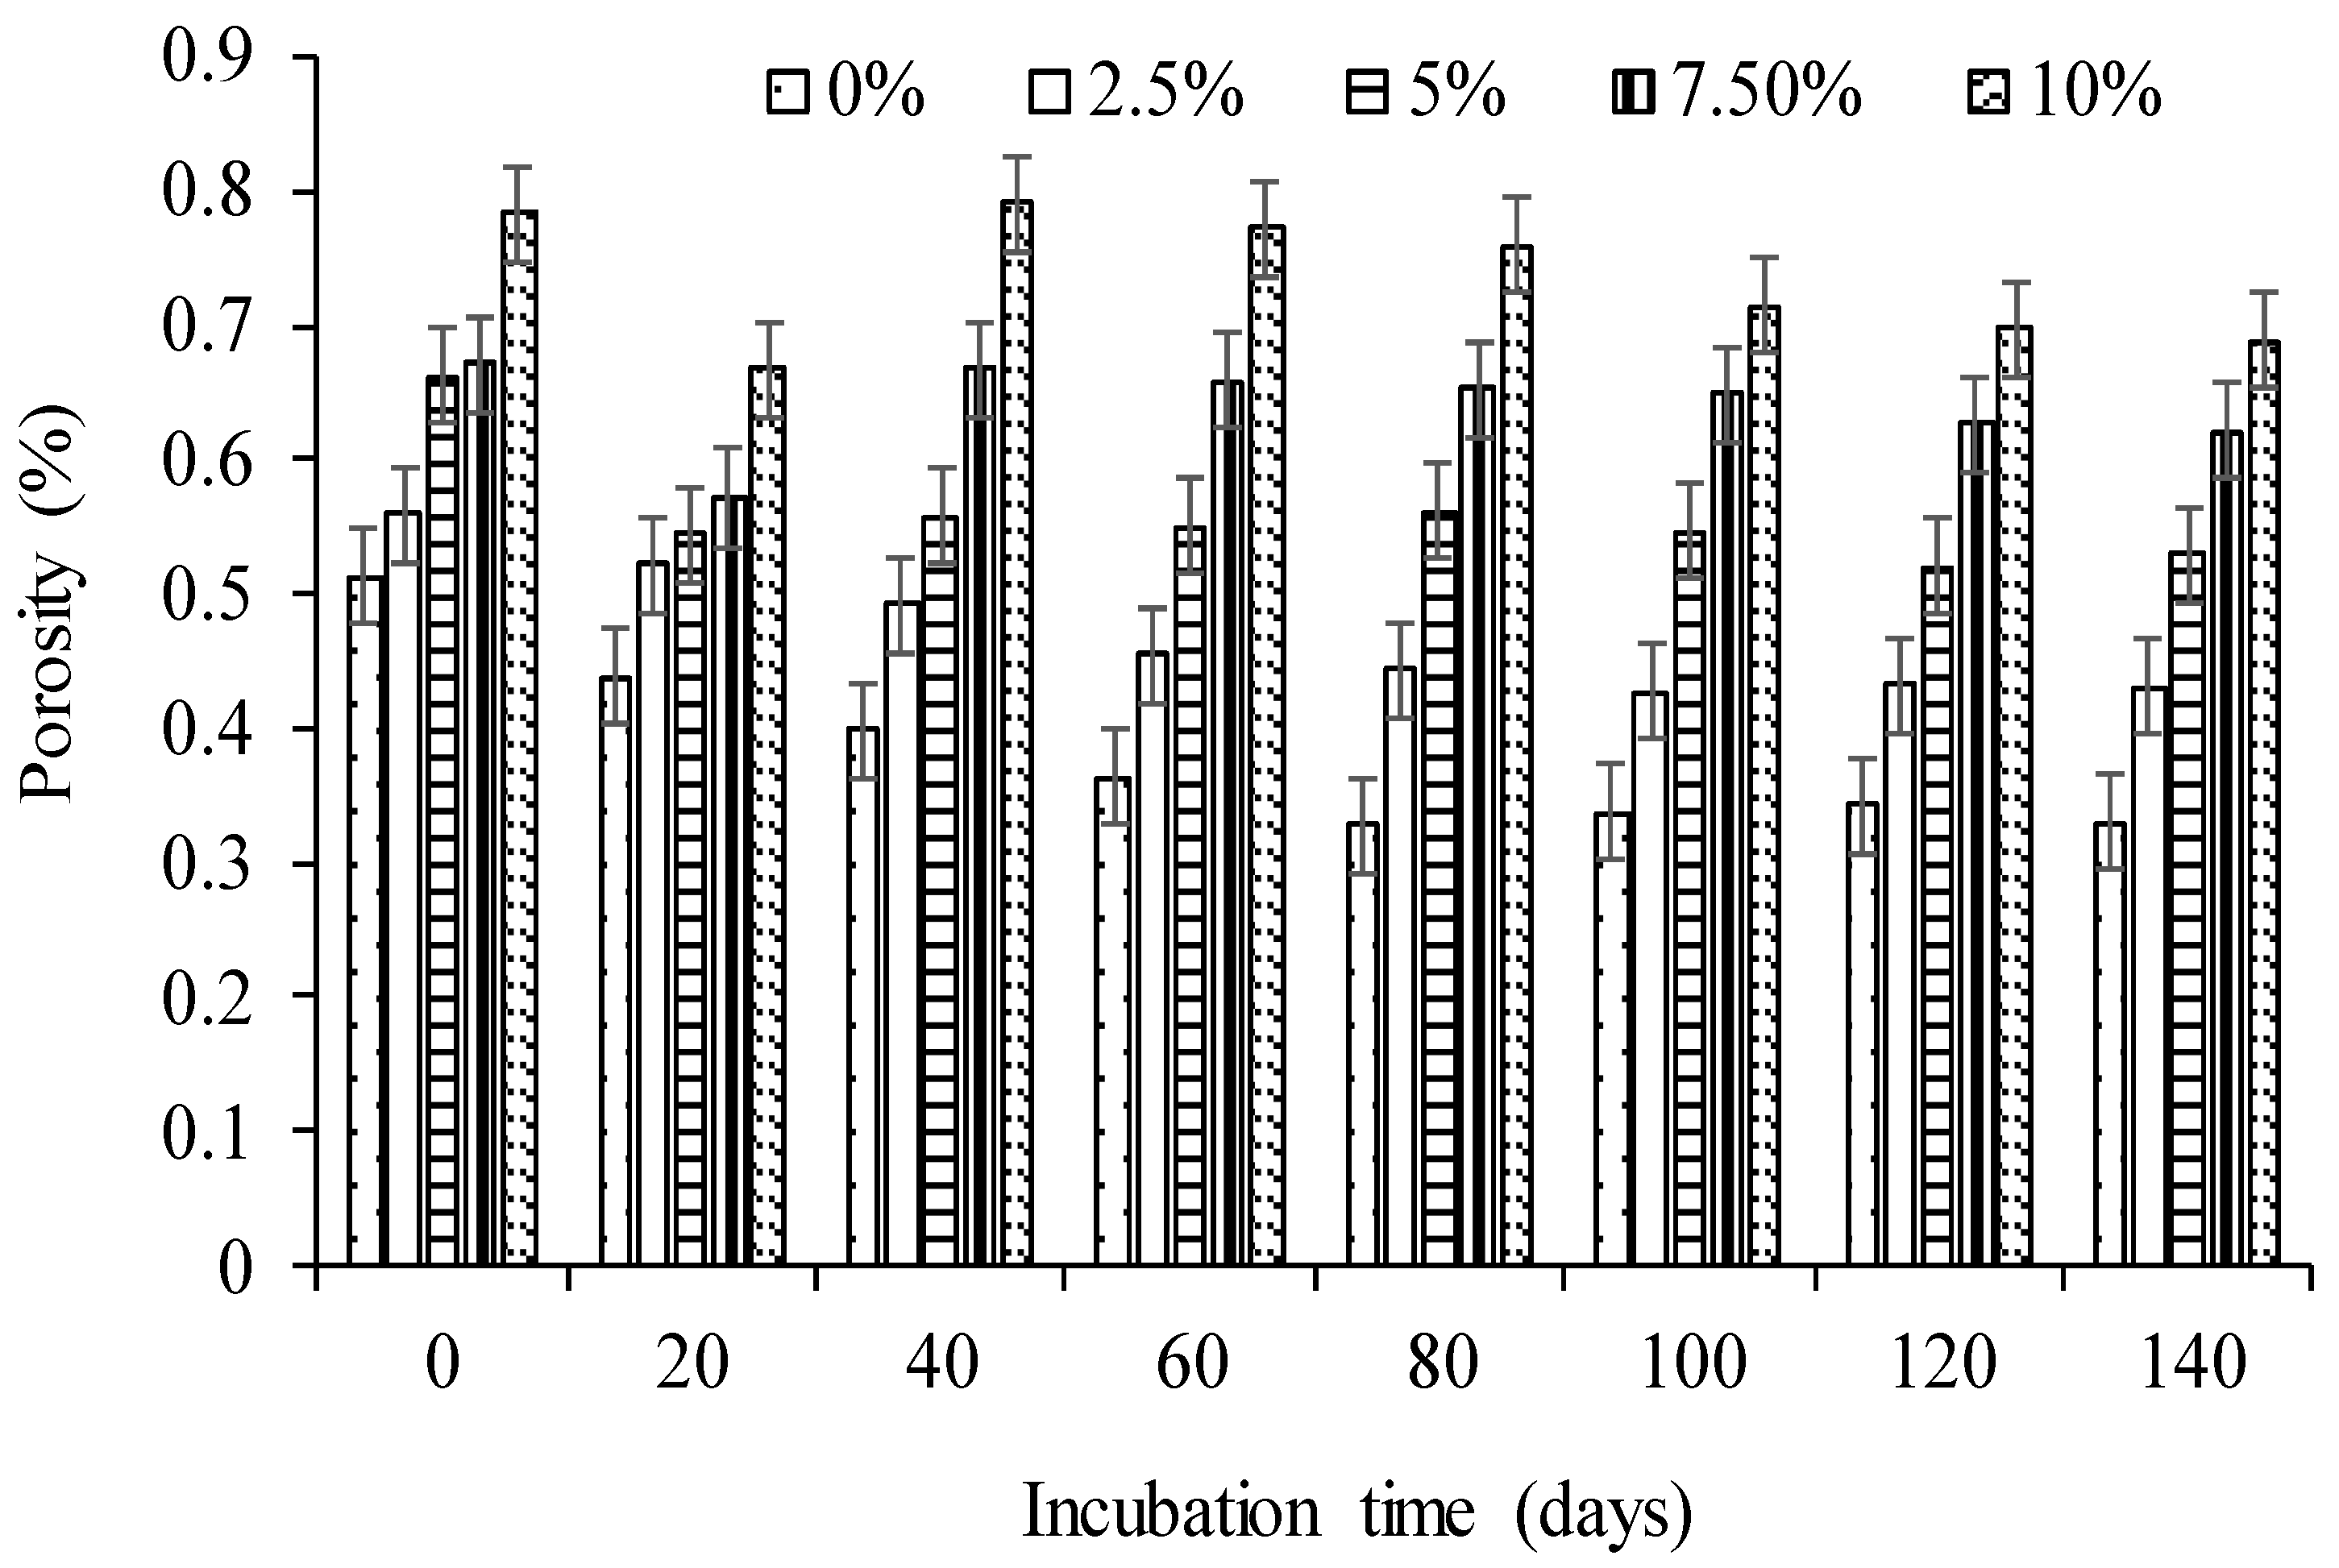
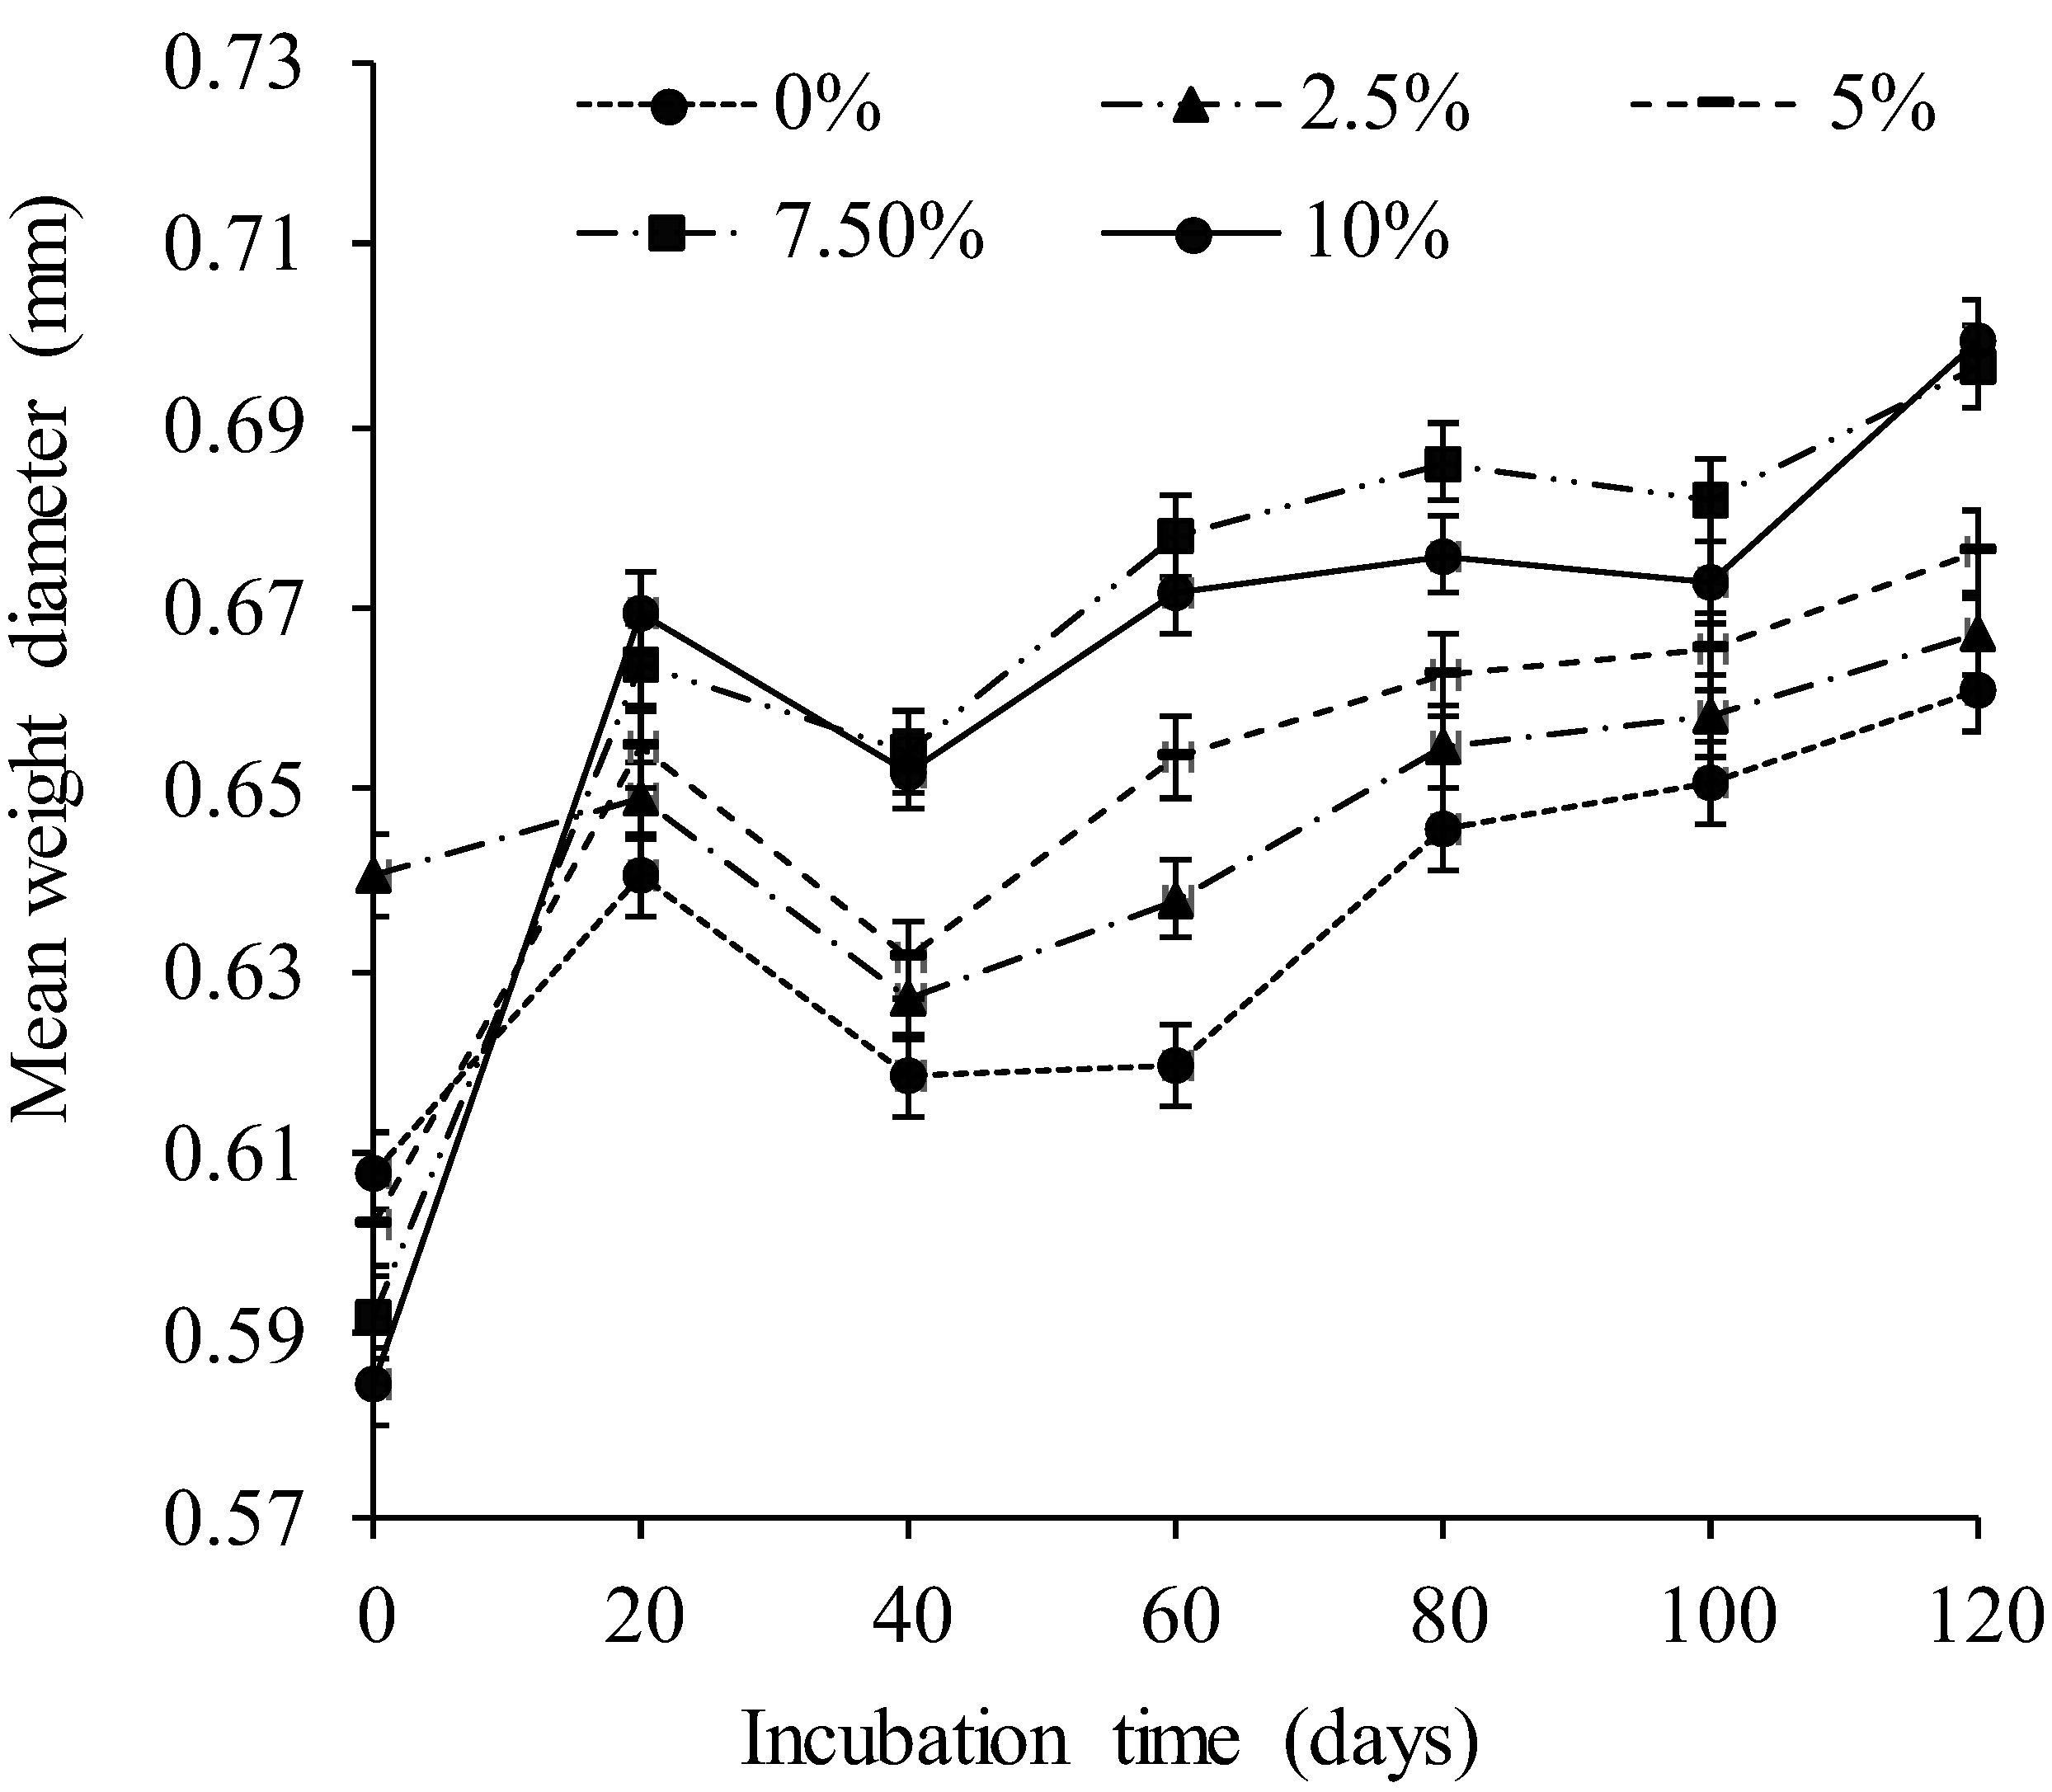
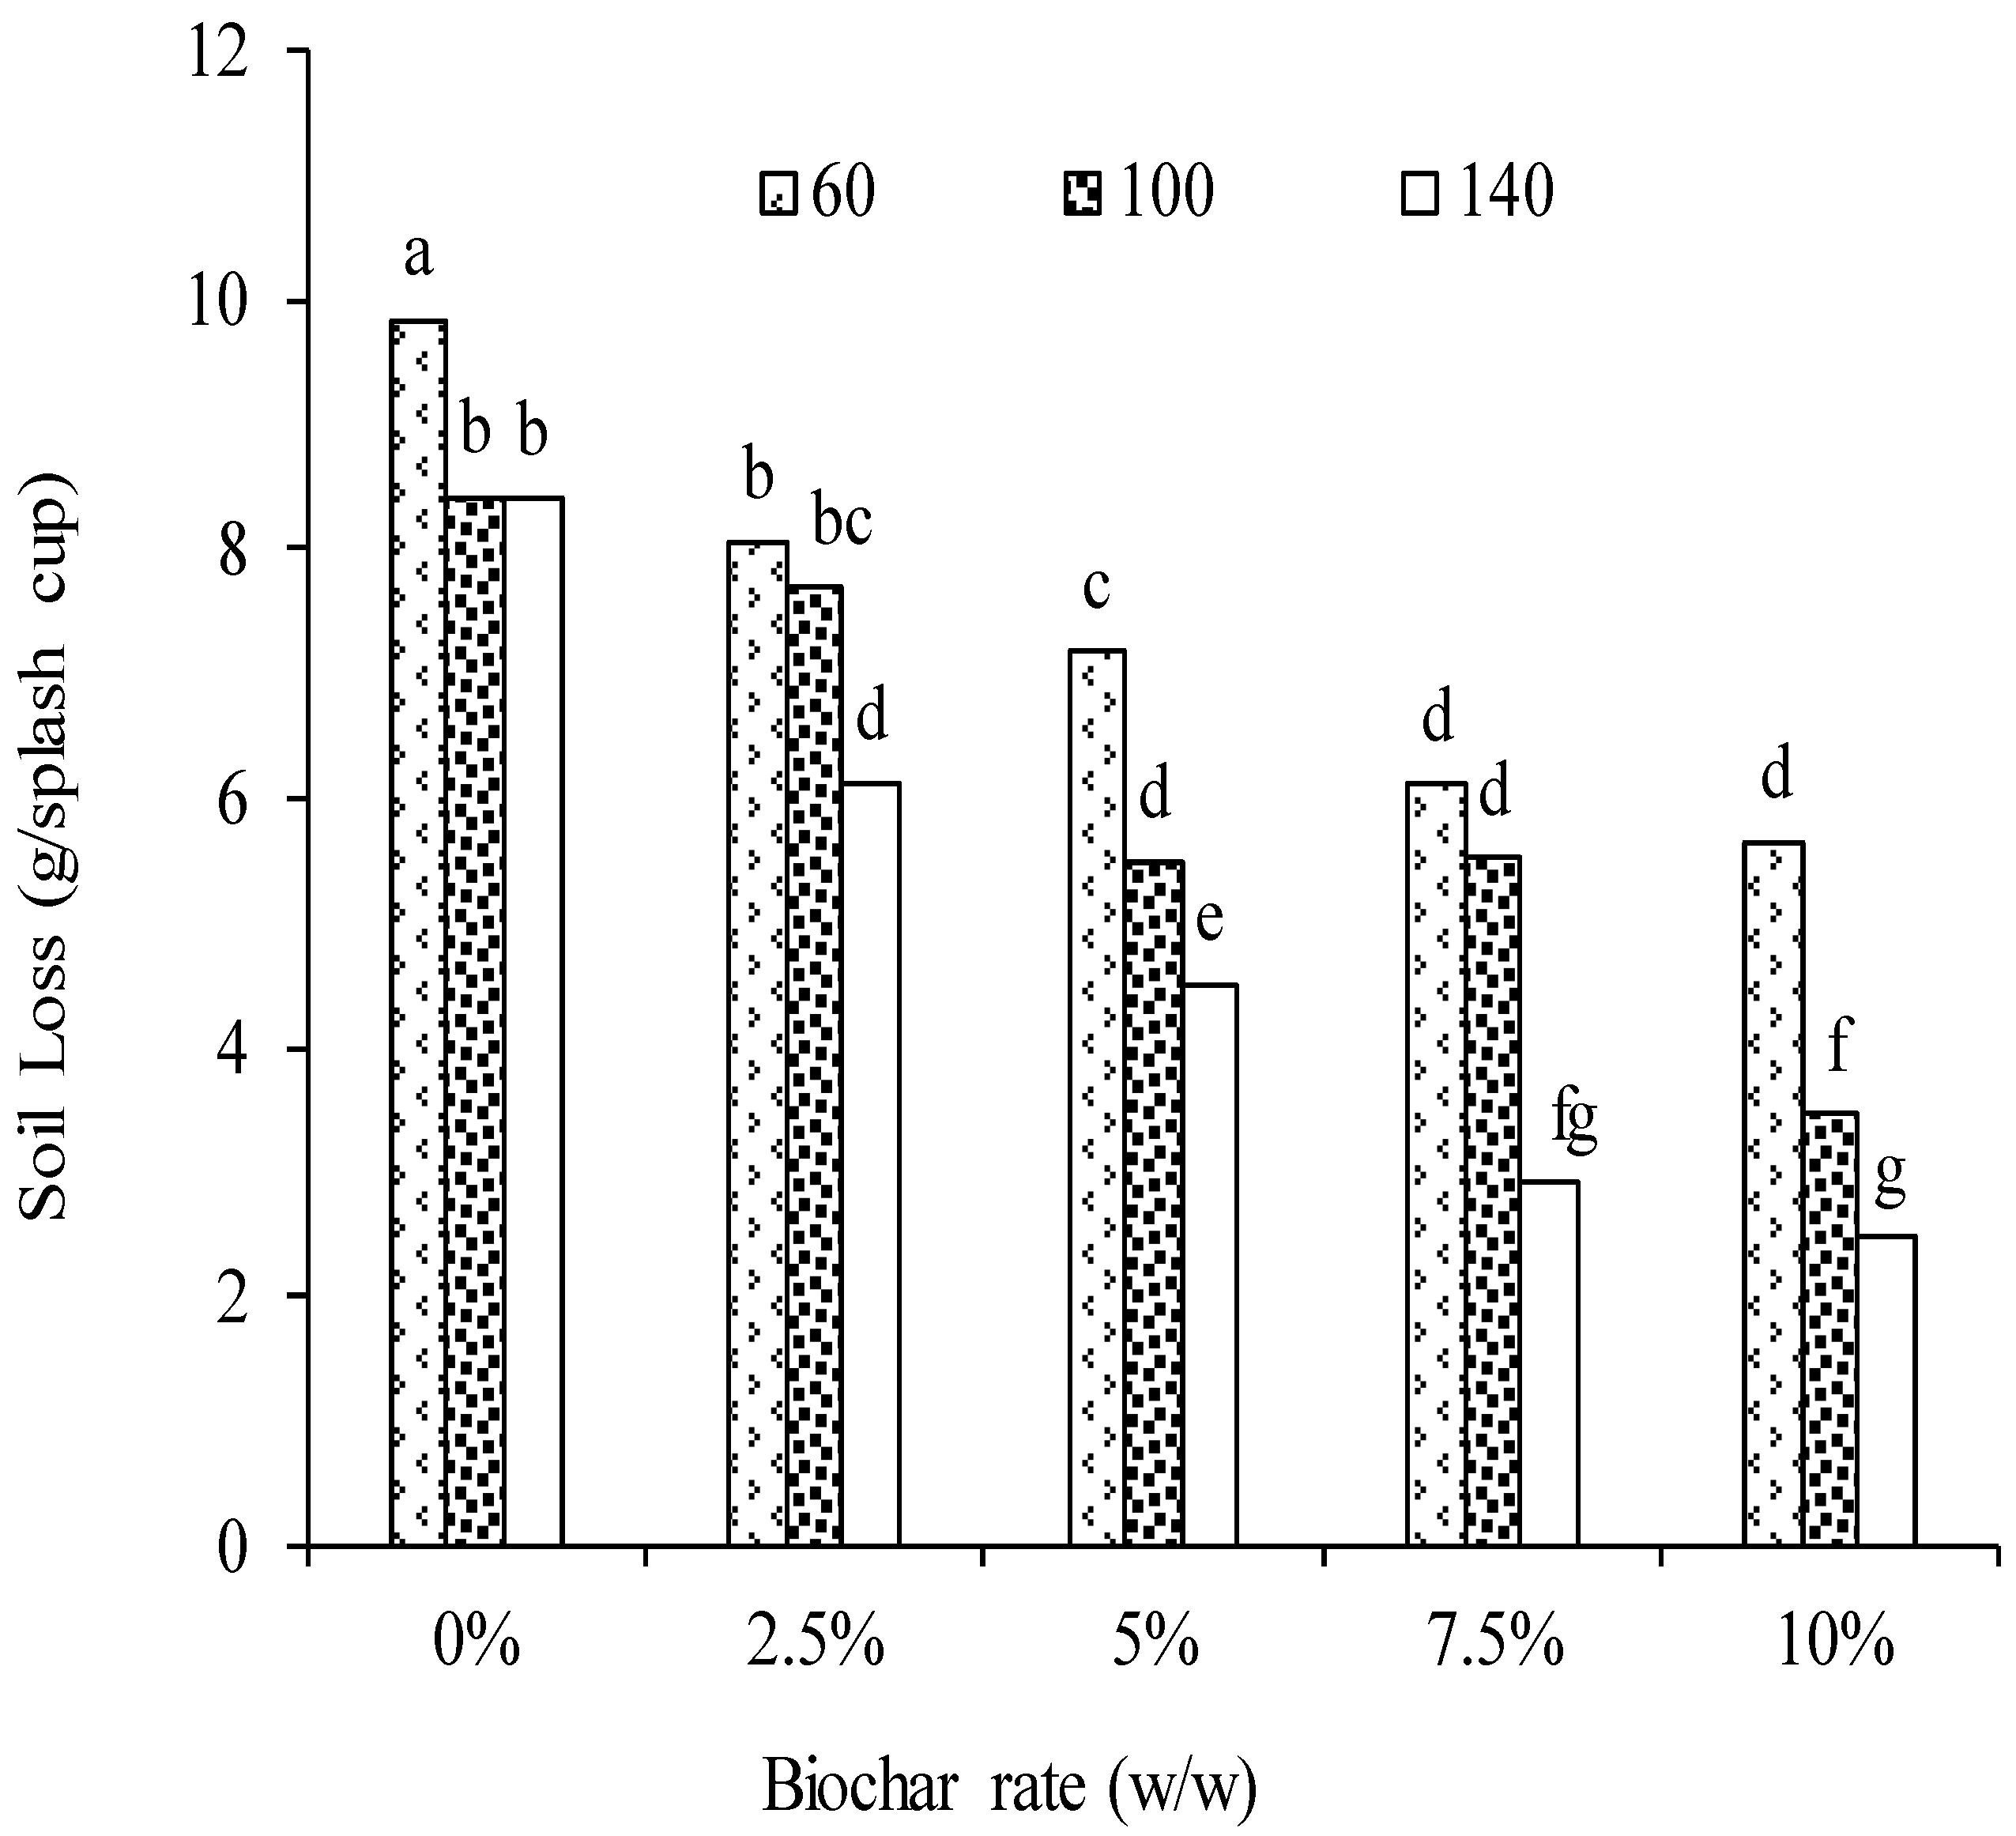
3.3. Effects of Biochar on Physical Properties

Significant interaction (p < 0.0001) was observed between incubation time and amendment rates of biochar on BD, porosity and MWD (Table 3). The control had significantly higher (p < 0.0001) BD compared to other treatments throughout the incubation period. Bulk density gradually decreased with an increase in biochar application rates from 2.5% to 10% relative to the control. The highest BD in the control of 1.28 kg m−3 was at 0 days after incubation time and it gradually increased to 1.77 kg m−3 at the end of the incubation period (Figure 5). The lowest BD was observed at 10% biochar application rate at 40 days after incubation time (0.55 kg m−3) which increased to 0.82 kg m−3 at 140 days after incubation time. Unlike BD, porosity increased directly proportional to increase in biochar rate. The lowest porosity was recoded at 80 days after incubation time for the control treatment (33%) while the highest was 0.79 kg m−3 at 40 days after incubation time with 10% biochar treated experiments (Figure 6). The findings were similar with other studies [11,75]. Similarly, [75] reported that bulk density decreased with increased rate of biochar amendment with the highest bulk density of 1.33 g cm−3 for control, 1.09 g cm−3 for 25% rate, 0.89 g cm−3 for 50% rate, 0.61 g cm−3 for 75% rate, and 0.36 g cm−3 for 100% rate of biochar application. Additionally, porosity was observed to increase with an increase in the biochar application rate [10,13,16,32]. Changes in bulk density and porosity can be attributed to the relatively lower bulk density of biochar compared to mineral particles [13,21]. Biochar has high pore volume and when mixed with soil it increases porosity and, hence, decreases bulk density; increasing biochar application rates significantly decreases bulk density while increasing porosity [30]. According to [76], the change in porosity with biochar treated soils was a result of formation of macropores and rearrangement of soil particles. Biochar is having a high internal surface area and high macro porosity which increase in smoothness with age enabling it to adsorb soluble inorganic nutrients and serve as an appropriate habitat for microbial growth and reproduction which, in turn, produces binding agents in the formation of macro aggregates.
The interaction between incubation time and amendment rates for the mean weight diameter (MWD) of the soil aggregate was found to be significantly different (p < 0.0001; Table 3). There was a gradual proportional increase in the MWD with time and application rate in all treatments (Figure 7). The MWD at 10% (0.699 mm) biochar rate treatment was highest at day 120 after incubation followed by MWD at 7.5% (0.696 mm) biochar rate treatment. The MWD at 10% and 7.5% biochar application rates from day 40 until day 120 were significantly higher (p < 0.0001) from 0%, 2.5%, and 5% rates. The changes can be possibly attributed to organic material and OC in the biochar which is crucial as a binding agent in the formation and stability of soil aggregates [21,77,78]. The porous nature and structure (high internal surface area, Figure 1b) of biochar serve as binding agents for stabilisation of the soil as well as promotes microbial growth and reproduction which in turn produce temporary binding agents that promote the soil aggregate formation [79]. The interactions between oxidized carboxylic acid groups at the surface of biochar particles possibly are responsible for the increase in soil aggregate stability [80].
Soil loss was significantly (p < 0.0001) affected by the interaction between incubation time and biochar application rate (Table 3). Soil loss gradually decreased with an increase in the biochar application rate and incubation time. The highest soil loss occurred at 60 days after incubation time in the control treatment (9.9 g/splash cup) while the lowest was recorded at 140 days after incubation time (2.48 g/splash cup) with the 10% biochar treated samples (Figure 8). Soil loss significantly decreased by 70%, 65%, 46%, and 27%, for 10%, 7.5%, 5%, and 2.5% biochar treaments, respectively, at the end of the incubation period (Figure 8). The results of this study are in agreement with [66] who reported a significant decrease of 35% to 90% soil loss due to biochar treatment under an extreme rainfall event on degraded mudstone soil. The decrease in soil loss can possibly be attributed to the increase in soil aggregation that can potentially increase the infiltration rate and reduction in runoff that carries the soil (Figure 7). Similarly, [81,82] reported a significant reduction in soil loss and runoff with biochar application due to an increase in porosity. The decrease in bulk density in the control (Figure 5) is associated with soil compaction. As the soil particles settle and compact, structure, and stability of aggregates is reduced, hence they become susceptible to breakdown upon wetting, reducing infiltration, causing ponding and subsequently runoff and erosion. Biochar on the other hand increases porosity and infiltration hence resistance to ponding and erosion.

4. Conclusions

Adding maize residue biochar significantly improved the soil physiochemical properties and microbial activities of an acidic Hutton soil. Soil loss was significantly reduced with an increase in biochar application rate. The biochar application (all rates) significantly decreased soil loss relative to the control. Similarly, changes in BD, SOC, pH, MWD, and MBC were directly proportional to the increase in biochar application rate. In addition, BD, SOC, pH, MWD, and MBC were improved directly proportional to an increase in biochar application rate with the highest at 10% biochar application rate. However, high application rates may not be feasible under smallholder farmer setup, therefore, the information generated can be used for further research to test effect of applying biochar in field studies. Further field studies comparing biochar, lime, and other organic matter sources are needed. We also recommend long-term field studies on the effect of maize residue biochar on soil quality and crop productivity South Africa.

Author Contributions

P.N. designed, setup, collected data, analysed data, and wrote the manuscript. C.C. designed, setup, collected data, analysed data, and wrote the manuscript. T.A. wrote the manuscript. T.T. collected data and wrote the manuscript.

Funding

This research was funded by the National Research Foundation (NRF) of South Africa [grant number CSUR14080586821] and the Govan Mbeki Research and Development Centre (GMRDC), University of Fort Hare, for the supporting the study through funding. And the APC was funded by [GMRDC].

Conflicts of Interest

The authors declare no conflict of interest.

References

  1. Fox, R.C.; Rowntree, K.M. Redistribution, restitution and reform: Prospects for the land in the Eastern Cape Province, South Africa. In Land Degradation; Conacher, A.J., Ed.; Kluwer Academic Publishers: Dordrecht, The Netherlands, 2001. [Google Scholar]
  2. Hoffman, M.T.; Ashwell, A. Nature Divided: Land Degradation in South Africa. 1-168; University of Cape Town Press: Cape Town, South Africa, 2001. [Google Scholar]
  3. Le Roux, J.J. Monitoring Soil Erosion in South Africa at a Regional Scale; ARC-ISCW Report No GW/A/2011/23 Project GW 59/004 Task 50 FEBRUARY; ARC-Institute for Soil, Climate and Water: Pretoria, South Africa, 2011. [Google Scholar]
  4. Barnard, R.O.; du Preez, C.C. Soil fertility in South Africa: The last twenty-five years. S. Afr. J. Plant Soil 2004, 21, 301–315. [Google Scholar] [CrossRef]
  5. Bot, A.; Benites, J. The Importance of Soil Organic Matter Key to Drought-Resistant Soil and Sustained Crop Production; FAO Soils Bulletin: Rome, Italy, 2005; 80p. [Google Scholar]
  6. De Meyer, A.; Poesen, J.; Isabirye, M.; Deckers, J.; Rates, D. Soil erosion rate in tropical villages: A case study from Lake Victoria Basin, Uganda. Catena 2011, 84, 89–98. [Google Scholar] [CrossRef]
  7. Schroeder, B.L.; Robinson, J.B.; Wallace, M.; Turner, P. Soil acidification: Occurrence and effects in the South African sugar industry. In Proceedings of the South African Sugar Technologists Association; South African Sugar Technologists’ Association: eThekwini, South Africa, 1994. [Google Scholar]
  8. Goulding, K.W.T. Soil acidification and the importance of liming agricultural soils with particular reference to the United Kingdom. Soil Use Manag. 2016, 32, 390–399. [Google Scholar] [CrossRef] [PubMed] [Green Version]
  9. Lal, R.; Follett, R. Soils and climate change. In Soil Carbon Sequestration and the Greenhouse Effect, 2nd ed.; Lal, R., Follett, R., Eds.; SSSA Special Publication: Madison, WI, USA, 2009; Volume 57. [Google Scholar]
  10. Lei, O.; Zhang, R. Effects of biochars derived from different feedstocks and pyrolysis temperatures on soil physical and hydraulic properties. J. Soils Sediments 2013, 13, 1561–1572. [Google Scholar] [CrossRef]
  11. Jien, S.; Wang, C. Effects of biochar on soil properties and erosion potential in a highly weathered soil. Catena 2013, 110, 225–233. [Google Scholar] [CrossRef]
  12. Dai, Z.; Zhang, X.; Tang, C.; Muhammad, N.; Wu, J.; Brookes, P.C.; Xu, J. Potential role of biochars in decreasing soil acidification—A critical review. Sci. Total Environ. 2017, 581–582, 601–611. [Google Scholar] [CrossRef] [PubMed]
  13. Lehmann, J.; Rillig, M.C.; Thies, J.; Masiello, C.A.; Hockaday, W.C.; Crowley, D. Biochar effects on soil biota—A review. Soil Biol. Biochem. 2011, 43, 1812–1836. [Google Scholar] [CrossRef]
  14. Sika, M.; Hardie, A. Effect of pine wood biochar on ammonium nitrate leaching and availability in a South African sandy soil. Eur. J. Soil Sci. 2014, 65, 113–119. [Google Scholar] [CrossRef]
  15. Jeffery, S.; Verheijen, F.G.A.; van der Velde, M.; Bastos, A.C. A quantitative review of the effects of biochar application to soils on crop productivity using meta-analysis. Agric. Ecosyst. Environ. 2011, 144, 175–187. [Google Scholar] [CrossRef]
  16. Gwenzi, W.; Chaukura, N.; Mukome, F.N.D.; Machado, S.; Nyamasoka, B. Biochar production and applications in sub-Saharan Africa: Opportunities, constraints, risks and uncertainties. J. Environ. Manag. 2015, 150, 250–261. [Google Scholar] [CrossRef] [PubMed]
  17. Laird, D.A.; Fleming, P.; Davis, D.D.; Horton, R.; Wang, B.Q.; Karlen, D.L. Impact of biochar amendments on the quality of a typical midwestern agricultural soil. Geoderma 2010, 158, 443–449. [Google Scholar] [CrossRef]
  18. International Biochar Initiative (IBI). Climate Change and Biochar. Available online: http://www.biochar-international.org/biochar/carbon (accessed on 16 January 2017).
  19. Turmel, M.S.; Speratti, A.; Baudron, F.; Verhulst, N.; Govaerts, B. Crop residue management and soil health: A systems analysis. Agric. Syst. 2015, 134, 6–16. [Google Scholar] [CrossRef]
  20. Leach, M.; Fairhead, J.; Fraser, J. Green grabs and biochar: Revaluing African soils and farming in the new carbon economy. J. Peasant Stud. 2012, 39, 285–307. [Google Scholar] [CrossRef] [Green Version]
  21. Verheijen, F.G.A.; Jeffery, S.; Bastos, A.C.; Van der Velde, M.; Diafas, I. Biochar Application to Soils: A Critical Scientific Review of Effects on Soil Properties, Processes and Functions; EUR 24099 EN; Office for the Official Publications of the European Communities: Luxembourg, 2010. [Google Scholar]
  22. Raboin, L.M.; Razafimahafaly, A.H.D.; Rabenjarisoa, M.B.; Rabary, B.; Dusserre, J.; Becquer, T. Improving the fertility of tropical acid soils: Liming versus biochar application? A long-term comparison in the highlands of Madagascar. Field Crops Res. 2016, 199, 99–108. [Google Scholar] [CrossRef]
  23. Nguyen, D.H.; Scheer, C.; Rowlings, D.W.; Grace, P.R. Rice husk biochar and crop residue amendment in subtropical cropping soils: Effect on biomass production, nitrogen use efficiency and greenhouse gas emissions. Boil. Fertil. Soils 2016, 52, 261–270. [Google Scholar] [CrossRef] [Green Version]
  24. Haider, G.; Steffens, D.; Mosera, G.; Müllera, C.; Kammann, C.I. Biochar reduced nitrate leaching and improved soil moisture content without yield improvements in a four-year field study. Agric. Ecosyst. Environ. 2017, 237, 80–94. [Google Scholar] [CrossRef]
  25. Hansen, V.; Müller-Stover, D.; Imparato, V.; Kroh, P.H.; Jensen, L.S.; Dolmer, A.; Hauggaard-Nielsen, H. The effects of straw or straw-derived gasification biochar applications on soil quality and crop productivity: A farm case study. J. Environ. Manag. 2017, 186, 88–95. [Google Scholar] [CrossRef] [PubMed]
  26. Malinska, K.; Golanska, M.; Caceres, R.; Rorat, A.; Weisser, P.; Slezak, E. Biochar amendment for integrated composting and vermicomposting of sewage sludge—The effect of biochar on the activity of Eisenia fetida and the obtained vermicompost. Bioresour. Technol. 2017, 225, 206–214. [Google Scholar] [CrossRef] [PubMed]
  27. Shareef, T.M.E.; Zhao, B. Review Paper: The Fundamentals of Biochar as a Soil Amendment Tool and Management in Agriculture Scope: An Overview for Farmers and Gardeners. J. Agric. Chem. Environ. 2017, 6, 38–61. [Google Scholar] [CrossRef]
  28. Tammeorg, P.; Bastos, A.C.; Jeffery, S.; Rees, F.; Kern, J.; Graber, E.R.; Ventura, M.; Kibblewhite, M.G.; Amaro, A.; Budai, A.; et al. Biochars in soils: Towards the required level of scientific understanding. J. Environ. Eng. Landsc. Manag. 2017, 25, 192–207. [Google Scholar] [CrossRef]
  29. Liu, X.H.; Han, F.P.; Zhang, X.C. Effect of biochar on soil aggregates in the loess plateau: Results from incubation experiments. Int. J. Agric. Biol. 2012, 14, 975–979. [Google Scholar]
  30. Mukherjee, A.; Lal, R.; Zimmerman, A.R. Effects of biochar and other amendments on the physical properties and greenhouse gas emissions of an artificially degraded soil. Sci. Total Environ. 2014, 487, 26–36. [Google Scholar] [CrossRef] [PubMed]
  31. Chan, K.; Van Zwieten, L.; Meszaros, I.; Downie, A.; Joseph, S. Agronomic values of green waste biochar as a soil amendment. Aust. J. Soil Res. 2007, 45, 629. [Google Scholar] [CrossRef]
  32. Asai, H.; Samson, B.K.; Stephan, H.M.; Songyikhangsuthor, K.; Homma, K.; Kiyono, Y.; Inoue, Y.; Shiraiwa, T.; Horie, T. Biochar amendment techniques for upland rice production in Northern Laos 1. Soil physical properties, leaf SPAD and grain yield. Field Crop. Res. 2009, 111, 81–89. [Google Scholar] [CrossRef]
  33. Makoto, K.; Tamai, Y.; Kim, Y.S.; Koike, T. Buried charcoal layer and ectomycorrhizae cooperatively promote the growth of Larix gmelinii seedlings. Plant Soil 2010, 327, 143–152. [Google Scholar] [CrossRef]
  34. Rutigliano, F.A.; Romano, M.; Marzaioli, R.; Baglivo, I.; Baronti, S.; Miglietta, F.; Castaldi, S. Effect of biochar addition on soil microbial community in a wheat crop. Eur. J. Biol. 2014, 60, 9–15. [Google Scholar] [CrossRef]
  35. Lehmann, J. Bio-energy in the black Front. Ecol. Environ. 2007, 5, 381–387. [Google Scholar] [CrossRef]
  36. Yousaf, B.; Liu, G.; Wang, R.; Abbas, Q.; Imtiaz, M.; Liu, R. Investigating the biochar effects on C-mineralization and sequestration of carbon in soil compared with conventional amendments using the stable isotope (d13C) approach. CB Bioenergy 2016, 1085–1099. [Google Scholar] [CrossRef]
  37. Bruun, S.; Harmer, S.L.; Bekiaris, G.; Christel, W.; Zuin, L.; Hu, Y.; Jensen, L.S.; Lombi, E. The effect of different pyrolysis temperatures on the speciation and availability in soil of P in biochar produced from the solid fraction of manure. Chemosphere 2017, 169, 377–386. [Google Scholar] [CrossRef] [PubMed]
  38. Nalivata, P.C.; Munthali, M.W.; Makumba, W.I.; Mbewe, E.; Manase, H. Integrated Soil Fertility Management in Sub-Saharan Africa. Fertil. Use Optim. Sub-Saharan Afr. 2017, 25–39. [Google Scholar] [CrossRef]
  39. Lehmann, J.; Gaunt, J.; Rondon, M. Bio-char sequestration in terrestrial ecosystems—A review. Mitig. Adapt. Strateg. Glob. Chang. 2006, 11, 403–427. [Google Scholar] [CrossRef]
  40. Teutscherova, N.; Vazquez, E.; Masaguer, A.; Navas, M.; Scow, K.M.; Schmid, R.; Benito, M. Comparison of lime- and biochar-mediated pH changes in nitrification and ammonia oxidizers in degraded acid soil. Biol. Fertil. Soils 2017, 53, 811–821. [Google Scholar] [CrossRef]
  41. Department of Environmental Affairs. UKAID, Research Report. Assessment of the Potential to Produce Biochar and Its Application to South African Soils as a Mitigation Measure; Department of Environmental Affairs: Pretoria, South Africa, 2015. [Google Scholar]
  42. Ronsse, F.; Van Hecke, S.; Nachenius, R.; Prins, W. Production and characterization of slow pyrolysis biochar: Influence of feedstock type and pyrolysis conditions. Gcb Bioenergy 2013, 104–115. [Google Scholar] [CrossRef]
  43. Nartey, O.D.; Zhao, B. Biochar Preparation, Characterization, and Adsorptive Capacity and Its Effect on Bioavailability of Contaminants: An Overview. Adv. Mater. Sci. Eng. 2014, 12. [Google Scholar] [CrossRef]
  44. Muzangwa, L.; Chiduza, C.; Muchaonyerwa, P. Biomass production, weed suppression, nitrogen and phosphorus uptake in white oat (Avena sativa L.) and grazing vetch (Vicia dasycarpa L.) cover crop bicultures under an irrigated no-tillage system. S. Afr. J. Plant Soil 2012, 29, 135–141. [Google Scholar] [CrossRef]
  45. Dube, E.; Chiduza, C.; Muchaonyerwa, P. Conservation agriculture effects on plant nutrients and maize grain yield after four years of maize-winter cover crop rotations. S. Afr. J. Plant Soil 2013, 30, 227–232. [Google Scholar] [CrossRef]
  46. Sohi, S.; Lopez-Capel, E.; Krull, E.; Bol, R. Biochar, climate change and soil: A review to guide future research. CSIRO Land Water Sci. Rep. 2009, 5, 17–31. [Google Scholar]
  47. Soil Classification Working Group. Soil Classification: A Taxonomic System for South Africa; Memoirs on the Agricultural Natural Resources of South Africa. No 15; Soil Classification Working Group: Pretoria, South Africa, 1991. [Google Scholar]
  48. World Reference Base for Soil Resources (WRB). International Soil Classification System for Naming Soils and Creating Legends for Soil Maps; World Soil Resources Reports; Food and Agriculture Organization of the United Nations: Rome, Italy, 2014. [Google Scholar]
  49. Liu, Z.; Dugan, B.; Masiello, C.A.; Barnes, R.T.; Gallagher, M.E.; Gonnermann, H. Impacts of biochar concentration and particle size on hydraulic conductivity and DOC leaching of biochar-sand mixtures. J. Hydrol. 2016, 533, 461–472. [Google Scholar] [CrossRef]
  50. Dane, J.H.; Hopmans, J.W. Water retention and storage. In Methods of Soil Analysis Part 4 (Physical Methods); SSSA Book Ser. No 5; Dane, J.H., Topp, C.G., Eds.; SSSA: Madison, WI, USA; pp. 671–720.
  51. Agri Laboratory Association of Southern Africa. Soil Handbook; Agri Laboratory Association of Southern Africa: Pretoria, South Africa, 2004. [Google Scholar]
  52. Okalebo, J.R.; Gathua, K.W.; Woomer, P.L. Laboratory Methods of Soil and Plant Analysis: A Working Manual; TSBF-KARI-UNESCO: Nairobi, Kenya, 2002. [Google Scholar]
  53. Solaiman, Z.M.; Murphy, D.V.; Abbott, L.K. Biochars influence seed germination andearly growth of seedlings. Plant Soil 2012, 353, 273–287. [Google Scholar] [CrossRef]
  54. ASTM. D1762-84: Standard Method for Chemical Analysis of Wood Charcoal; American Society for Testing and Materials International: West Conshohocken, PA, USA, 2007. [Google Scholar]
  55. LECO. Truspec CN Carbo/Nitrogen Determinator Instructions Manual; LECO Corporation: St Joseph, MI, USA, 2003. [Google Scholar]
  56. Witt, C.; Biker, U.; Galicia, C.C.; Ottow, J.C.G. Dynamics of soil microbial biomass and nitrogen availability in a flooded rice soil amended with different C and N sources. Biol. Fertil. Soils 2000. [Google Scholar] [CrossRef]
  57. Anderson, J.M.; Ingram, J.S.I. Tropical Soil Bioloy and Fertility. A Handbook of Methods; ACB International: Wallingford, UK, 1993; pp. 68–71. [Google Scholar]
  58. Hardie, M.; Clothier, B.; Bound, S.; Oliver, G.; Close, D. Does biochar influence soil physical properties and soil water availability? Plant Soil 2014, 376, 347–361. [Google Scholar] [CrossRef]
  59. Le Bissonnais, Y. Aggregate stability and assessment of soil crustability and erodibility: I. Theory and methodology. Eur. J. Soil Sci. 1996, 47, 425–437. [Google Scholar] [CrossRef]
  60. Martin, C.; Pohl, M.; Alewell, C.; Korner, C.; Rixen, C. Interrill erosion at disturbed alpine sites: Effects of plant functional diversity and vegetation cover. Basic Appl. Ecol. 2010, 11, 619–626. [Google Scholar] [CrossRef]
  61. Nciizah, A.; Wakindiki, I.I.C. Rainfall pattern effects on crusting, infiltration and erodibility in some South African soils with various texture and mineralogy. Water SA 2014, 40, 57–63. [Google Scholar] [CrossRef]
  62. Parwada, C.; Van Tol, J. The nature of soil erosion and possible conservation strategies in Ntabelanga area, Eastern Cape Province, South Africa. Acta Agric. Scand. Sect. B Soil Plant Sci. 2016. [Google Scholar] [CrossRef]
  63. Yuan, J.H.; Xu, R.K.; Wang, N.; Li, J.Y. Amendment of acid soils with crop residues and biochars. Pedosphere 2011, 21, 302–308. [Google Scholar] [CrossRef]
  64. Sohi, S.P.; Krull, E.; Lopez-Capel, E.; Bol, R. A review of biochar and its use and function in soil. Adv. Agron. 2010, 105, 47–82. [Google Scholar]
  65. Curaqueo, G.; Meier, S.; Khan, N.; Cea, M.; Navia, R. Use of biochar on two volcanic soils: Effects on soil properties and barley yield. J. Soil Sci. Plant Nutr. 2014, 14, 911–924. [Google Scholar] [CrossRef]
  66. Chintala, R.; Mollinedo, J.; Schumacher, T.E.; Malo, D.D.; Julson, J.L. Effect of biochar on chemical properties of acidic soil. Arch. Agron. Soil Sci. 2014, 60, 393–404. [Google Scholar] [CrossRef]
  67. Obia, A.; Cornelissen, G.; Mulder, J.; Dorsch, P. Effect of Soil pH Increase by Biochar on NO, N2O and N2 Production during Denitrification in Acid Soils. PLoS ONE 2015, 1–19. [Google Scholar] [CrossRef] [PubMed] [Green Version]
  68. Chaiyaraksa, C.; Jaipong, T.; Tamnao, P.; Imjai, A. Durian and angosteen Shell-Derived Biochar Amendment on the Removal of Zinc, Lead and Cadmium. Thammasat Int. J. Sci. Technol. 2017, 22, 88–97. [Google Scholar] [CrossRef]
  69. Abrishamkesh, S.; Gorji, M.; Asadi, H.; Bagheri-Marandi, G.H.; Pourbabaee, A.A. Effects of rice husk biochar application on the properties of alkaline soil and lentil growth. Plant Soil Environ. 2015, 61, 475–482. [Google Scholar] [CrossRef]
  70. Singh, B.P.; Cowie, A.L. Long-term influence of biochar on native organic carbon mineralisation in a low-carbon clayey soil. Sci. Rep. 2014, 4, 3687. [Google Scholar] [CrossRef] [PubMed]
  71. Luo, Y.; Durenkamp, M.; De Nobili, M.; Lin, Q.; Brookes, P.C. Short term soil priming effects and the mineralization of biochar following its incorporation to soils of different pH. Soil Boil. Biochem. 2011, 43, 2304–2314. [Google Scholar] [CrossRef]
  72. Smith, J.L.; Collins, H.P.; Bailey, V.L. The effect of young biochar on soil respiration. Soil Boil. Biochem. 2010, 42, 2345–2347. [Google Scholar] [CrossRef]
  73. Kuzyakov, Y.; Subbotina, I.; Chen, H.; Bogomolova, I.; Xu, X. Black carbon decomposition and incorporation into soil microbial biomass estimated by 14C labeling. Soil Boil. Biochem. 2009, 41, 210–219. [Google Scholar] [CrossRef]
  74. Joseph, S.D.; Camps-Arbestain, M.; Lin, Y.; Munroe, P.; Chia, C.H.; Hook, J.; van Zwieten, L.; Kimber, S.; Cowie, A.; Singh, B.P.; et al. An investigation into the reactions of biochar in soil. Aust. J. Soil Res. 2010, 48, 501–515. [Google Scholar] [CrossRef] [Green Version]
  75. Githinji, L. Effect of biochar application rate on soil physical and hydraulic properties of a sandy loam. Arch. Agron. Soil Sci. 2014, 60, 457–470. [Google Scholar] [CrossRef]
  76. Hseu, Z.Y.; Jien, S.H.; Chien, W.H.; Liou, R.C. Impacts of biochar on physical properties and erosion potential of a mudstone slope land soil. Sci. World J. 2014. [Google Scholar] [CrossRef] [PubMed]
  77. Six, J.; Bossuyt, H.; Degryze, S.; Denef, K. A history of research on the link between (micro)aggregates, soil biota, and soil organic matter dynamics. Soil Till. Res. 2004, 79, 7–31. [Google Scholar] [CrossRef]
  78. Hati, K.M.; Swarup, A.; Dwivedi, A.K.; Misra, A.K.; Bandyopadhyay, K.K. Changes in soil physical properties and organic carbon status at the topsoil horizon of a vertisol of central India after 28 years of continuous cropping, fertilization and manuring. Agric. Ecosyst. Environ. 2007, 119, 127–134. [Google Scholar] [CrossRef]
  79. Ma, N.; Zhang, L.; Zhang, Y.; Yang, L.; Yu, C.; Yin, G.; Doane, T.A.; Wu, Z.; Zhu, P.; Ma, X. Biochar Improves Soil Aggregate Stability and Water Availability in a Mollisol after Three Years of Field Application. PLoS ONE 2016, 11, e0154091. [Google Scholar] [CrossRef] [PubMed]
  80. Glaser, B.; Lehmann, J.; Zech, W. Ameliorating physical and chemical Thsoproperties of highly weathered soils in the tropics with charcoal—A review. Biol. Fertil. Soils. 2002, 35, 219–230. [Google Scholar] [CrossRef]
  81. Abrol, V.; Ben-Hur, M.; Verheijen, F.G.A.; Keizer, J.J.; Martins, M.A.S.; Tenaw, H.; Tchehansky, L.; Graber, E.R. Biochar effects on soil water infiltration and erosion under seal formation conditions: Rainfall simulation experiment. J. Soils Sediments 2016, 16, 2709–2719. [Google Scholar] [CrossRef]
  82. Sadeghi, S.H.; Hazbavi, Z.; Harchegani, M.K. Controllability of runoff and soil loss fromsmall plots treated by vinasseproduced Biochar. Sci. Total Environ. 2016, 541, 483–490. [Google Scholar] [CrossRef] [PubMed]
Figure 1. Maize residue biochar images from (a) Scanning electron micrographs (SEM) and (b) energy-dispersive spectroscopy (EDX) showing the chemical composition intensity. Kev: kilo-electron volt.
Agronomy 08 00256 g001
Figure 2. pH Fluctuations during incubation of a Hutton soil amended with different biochar rates. Error bars indicate standard deviation (SD).
Agronomy 08 00256 g002
Figure 3. Soil organic carbon fluctuations during incubation of a Hutton soil amended with different biochar rates. Error bars indicate SD.
Agronomy 08 00256 g003
Figure 4. Fluctuations in microbial biomass carbon during incubation of a Hutton soil amended with different biochar rates. Error bars indicate SD. Different lowercase letters indicate significant differences at p ≤ 0.001.
Agronomy 08 00256 g004
Figure 5. Changes in bulk density during incubation of a Hutton soil amended with different biochar rates. Error bars indicate SD.
Agronomy 08 00256 g005
Figure 6. Changes in porosity during incubation of a Hutton soil amended with different biochar rates. Error bars indicate SD.
Agronomy 08 00256 g006
Figure 7. Changes in mean weight diameter (MWD) during incubation of a Hutton soil amended with different biochar rates. Error bars indicate SD.
Agronomy 08 00256 g007
Figure 8. Changes in soil loss during incubation of a Hutton soil amended with different biochar rates. Different lowercase letters indicate significant differences at p ≤ 0.001.
Agronomy 08 00256 g008
Table 1. The calculated application rates of biochar used in the incubation trial.
% (w/w)Estimated Biochar kg−1 Soil (g)Estimated t ha−1 (15 cm Depth)
2.52550
550100
7.575150
10100200
Table 2. Selected properties of the soil, biochar feed-stock (maize residue) and biochar used in the incubation study.
PropertiesSoilFeed-Stock MaterialMaize Biochar
Sand (%)41--
Silt (%)33.6--
Clay (%)25.4--
Field capacity (m3/m3)0.36--
pH4.1-9.42
EC (m S m−1)80.9-2.61
SOC (%)2.2--
TN (%)0.161.621.92
TOC (%)2.6945.2646.89
C/N16.7727.9424.42
Exc. Ca (mg kg−1)2210.30.27
Exc. Mg (mg kg−1)790.340.17
Exc. K (mg kg−1)125–2211.120.45
Exc. Na (mg kg−1)5.9121.91419.5
Ash Content (%)--43.34
Volatile Matter (%)--8.57
EC: electrical conductivity; SOC: organic carbon; TN: total nitrogen; TOC: total organic carbon; C/N: carbon notrogen ratio; Exc. Ca: exchangeable Ca; Exc. Mg: exchangeable Mg; Exc. K: exchangeable K; Exc. Na: exchangeable Na; -: Not determine.
Table 3. Summary of analysis of variance for various parameters analysed.
Source of Variation pHECMWDSOCBulk DensityPorositySoil Loss
Biochar Rate (BR)p0.0001 *ns0.0001 *0.0001 *0.0001 *0.0001 *0.0001 *
f (4119)253.79ns49.388.93853.45853.45613.5
Time (T)p0.0001 *ns0.0001 *0.0001 *0.0001 *0.0001 *0.0001 *
f (7119)15.571.16151.009.2740.8440.84418.9
T × BRp0.0001 *ns0.0001 *ns0.0001 *0.0001 *0.0001 *
f (39,119)12.381.029.930.706.570.5716.2
CV 3.3210.317.406.731.175.284.20
ns: not significant; * significant at p ≤ 0.0001; EC: electrical conductivity; MWD: mean weight diameter of soil aggregates; SOC: soil organic carbon.

