Article

Effects of Cultivar, Nitrogen Rate, and Planting Density on Rice-Grain Quality

1
College of Agronomy, Shenyang Agricultural University, Shenyang110866, China
2
Texas A and M AgriLife Research Center, 1509 Aggie Dr., Beaumont, TX 77713, USA
*
Authors to whom correspondence should be addressed.
Agronomy 2018, 8(11), 246; https://doi.org/10.3390/agronomy8110246
Submission received: 13 September 2018 / Revised: 23 October 2018 / Accepted: 1 November 2018 / Published: 2 November 2018

Abstract

:
To achieve superior rice-grain quality, more emphasis has been placed on the genetic diversity of breeding programs, although this improvement could be seriously restricted in the absence of comparable agricultural management practices. Nitrogen (N) application and planting density are two important agronomic practices influencing rice growth, yield, and grain quality. This study investigated the four main aspects of rice-grain quality, namely, milling (brown-rice, milled-rice, and head-rice percentage), appearance (length/width ratio, chalky-kernel percentage, and chalkiness), nutrition (protein content), and cooking and eating quality (apparent amylose content, gel consistency, and pasting viscosities) of two rice cultivars (Shendao 47 and Jingyou 586) under four N rates (0, 140, 180, and 220 kg ha−1), and three planting densities (25 × 104, 16.7 × 10⁴, and 12.5 × 10⁴ hills ha−1) in a field trial from 2015 to 2016. The four main aspects of rice-grain quality were significantly influenced by cultivar. Several aspects were affected by the interactions of N rate and cultivar. No significant interaction between N rate and plating density was detected for all grain-quality parameters. A higher N rate increased the percentages of brown rice and head rice, chalky-kernel percentage, and setback and peak time values, but reduced the length/width ratio, chalkiness, apparent amylose content, gel consistency, and peak-, trough-, and final-viscosity values. These results indicate that the N rate has a beneficial effect on milling and nutritional quality, but a detrimental effect on appearance and cooking and eating quality. Jingyou 586 and Shendao 47 had different responses to planting density in terms of grain quality. Our study indicates that low planting density for Jingyou 586, but a medium one for Shendao 47, is favorable for grain quality.

1. Introduction

Rice (Oryza sativa L.) is one of the most important cereal crops in Asia. Worldwide, more than two billion people consume rice as a staple food [1]. However, due to the pressure of grain supply, less attention is paid to improving rice-grain quality. With continuous economic development and rising standards of living, a preference for high grain quality gradually increases. Thus, improving rice quantity and quality is not only closely associated with the improvement of people’s living conditions, but it is also a major response measure for ensuring world food security under extreme climate change and tremendous population growth [2].
Rice quality is an important characteristic, as grain-quality traits dictate its market value and have an important effect on consumer acceptance. Rice quality is mainly evaluated in terms of four aspects, namely, milling, appearance, cooking and eating, and nutrition quality [3,4]. Each trait value varies lobally according to cuisine and culture because different rice properties appeal to different consumers [5]. The assessment criteria for milling quality mainly measure brown-rice, milled-rice, and head-rice percentage, reflecting the ratio of whole and broken kernels produced during milling rough rice. Appearance quality is primarily determined by grain size, chalky-grain percentage, chalky area, and degree of chalkiness [6], which is the main factor defining rice market value. Eating and cooking quality are considered the most essential traits influencing consumer rice acceptance. The physicochemical measurements specifying eating and cooking quality have been well-established, including amylose content, gelatinization temperature, gel consistency, and pasting properties [1,2]. Nutrition quality plays a vital role in dietary supplementation of protein and micronutrients for most rice-growing countries.
Many studies have reported on the genetic control of rice cultivar on the grain-shape, appearance-quality [7], gel-consistency, gelatinization-temperature [8,9], and pasting-viscosity parameters [4]. It was found that introducing GS9 (Grain-Shape Gene on Chromosome 9) to rice cultivars could progressively improve grain shape and appearance quality [7]. Bao et al. [10] suggested that amylose content, final viscosity, breakdown, and setback were mainly influenced by genotypic variance. Recently, the association-mapping approach has been widely used to study the genetic basis of complex rice traits [2,7]. A total of 22 main-effect quantitative trait loci (QTLs), which are responsible for almost all traits, were identified by association mapping [2]. Genetic studies, such as linkage mapping, showed that apparent amylose content and all the values of pasting viscosity are mainly regulated by the Wx gene [2,4,11]. These studies greatly provide bases for the amelioration of rice-grain quality using marker-assisted breeding with the identified QTLs/genes.
Nevertheless, rice-grain quality depends not only on genetic background, but also on soil and climatic conditions, and agronomic treatments, during rice growth and development. However, to date, information on how crop-management practices affect rice-grain quality is lacking. Giving more importance to genetic diversity in rice-breeding programs on one hand is crucial to improve rice quality, but this improvement could be seriously restricted in the absence of appropriate agricultural approaches. Thus, it is imperative to simultaneously consider genetic and management practices to achieve the target amelioration of rice-grain quality. Nitrogen (N) rate and planting density are more easily controlled cultivation methods, and they are key factors affecting rice-grain quality. Research in this field is of great significance not only for breeders, but also for producers, and has a direct effect on the production of high-quality grains.
As China’s largest commercial rice-production region, Northeast China is becoming the most important japonica-rice production area. The production of japonica rice in northern China plays a vital role in food safety and social stability, due to its yield and grain quality [12]. In this study, field experiments were conducted using inbred japonica rice cultivar Shendao 47 and hybrid japonica-rice cultivar Jingyou 586, and grown under different N rates and planting densities in Shenyang, Northeast China, where ecological conditions (light, diurnal temperature and soil, etc.) are favorable for the production of japonica rice. Appearance characteristics, and milling, nutrition, and eating and cooking quality were studied. Our objective was to determine the effect of cultivar, N application rates, and planting density on rice-grain quality, and to provide useful knowledge for achieving high-quality rice production.

2. Materials and Methods

2.1. Experimental Design and Field Trails

A split–split plot design with three replications was used to test the effects of rice cultivar, N fertilization, and plant density on rice-grain quality. Four nitrogen rates, (0 (N0), 140 (N1), 180 (N2), and 220 kg ha−1 (N3)) were assigned as the main plots; three planting densities (25 × 104 (D1), 16.7 × 10⁴ (D2), and 12.5 × 10⁴ hills ha−1 (D3) with three seedlings per hill) were designated as the subplots; and two cultivars were designated as sub-subplots. The two cultivars used were Shendao 47 (an inbred cultivar) and Jingyou 586 (a hybrid cultivar), which have broadly been cultivated by local farmers because of their good yield and palatability performance.
The study was conducted in 2015 and 2016 at the Teaching and Research Institute of Shenyang Agricultural University, Liaoning Province, China (41°48′ N, 123°24′ E) on a mixed silt loam in fields that have continuously been rice plantations for the past few decades. The experimental site had an average soil pH of 6.8 (1:2 soil/water), organic matter of 29.7 g kg−1, total N of 1.03 g kg−1, alkali-hydrolysable N of 77.3 mg kg−1, Olsen-P of 22.7 mg kg−1, and exchangeable K of 111.6 mg kg−1.Rice seeds were pre-germinated each year, and the pre-germinated seeds were sown on a seedbed on 19 April 2015, transplanted at the four-leaf stage on 25 May2015, sown on 17 April 2016, and transplanted on 26 May2016. Each hill had spacing of 30 × 13.3, 30 × 19.8, and 30 × 26.7 cm for D1, D2, and D3 plant-density treatments, respectively. The size of each plot was 12 m2 (5 m long, 2.4 m wide, 8 rows, 30 cm row spacing). Urea was broadcasted as N fertilizer and was split applied as 50% at basal, 30% at 7 days after transplanting, and the remainder at panicle initiation around 24 June in both years. One day before transplanting, triple superphosphate and potassium sulfate were broadcasted as basal P and K fertilizers at the amount of 90 and 75 kg ha−1, respectively. To prevent potential fertilizer contamination between neighboring plots, each plot was separated by 50 cm wide ridges covered with a plastic film by inserting into the soil at a depth of 30 cm. Other field operations, including pest management and irrigation, followed with local practices.

2.2. Grain-Quality Measurement

At maturity, rice grains were randomly sampled from an area of 1 m2 in each plot for quality analysis. The grain samples were carefully threshed, cleaned, air-dried to a constant weight, and then stored at an ambient temperature before processing for grain-quality analysis. One hundred and fifty grams of each rough rice sample was dehulled to produce brown rice with a roller sheller, and then brown rice was polished according to the National Standard NT-88 of China. The milled rice was separated into head and broken rice and weighed. The brown-rice percentage (BRP), milled-rice percentage (MRP), and head-rice percentage (HRP) of a milled-rice sample were calculated based on rough rice weight. Head rice was defined as kernels that kept three-quarters or longer of their original length. The appearance quality characteristics (grain length/width ratio, chalky grain percentage, and chalkiness degree) of a head-rice sample were analyzed with a rice-quality analyzer (SC-E, Hangzhou Wanshen Test Technology Corporation, Hangzhou, Zhejiang, China). The amylose and protein contents of a head-rice sample were measured with an Infratec 1241 grain analyzer (FOSS Tecator, Copenhagen, Denmark) [6].
The milled-rice samples were oven-dried to constant weight at 60 °C, then ground into flour with a stainless-steel grinder (FW-100, China), and passed through a 100 mesh sieve in order to further prepare them for subsequent analysis of gel consistency, gelatinization temperature, and starch viscosity. Gel consistency was measured by the length of cold milled-rice paste in a horizontal position, and the procedure was as follows—0.1 g of the flour was dispersed in 0.2 mL of 95% ethanol containing 0.025% thymol blue in a 10 × 110 mm tube, and then we added 2.0 mL of 0.2 mol L−1 KOH, shaking well. The tubes were covered with glass marbles and boiled in a water bath for 8 min, taken out of the tubes and left for 5 min; after being placed in an ice-water bath at 0 °C for 20 min, the tubes were laid down horizontally onto a table surface. After 1 h, the gel length from the bottom of the tube to the front of the gel was measured. Starch viscosity and gelatinization analyses were carried out by Rapid Visco Analyzer (RVA-3D, Newport Scientific, Sydney, Australia) according to the American Association of Cereal Chemists (AACC) 1995 protocol. Starch samples (3.00 g, 14.0%, w/w, dry basis) were mixed with 25.00 g of H2O. The pasting programmed cycle was set to 13 min. Starch samples were heated at 50 °C for 1 min, and then from 50 to 95 °C at the rate of 12 °C/min, held at 95 °C for 2.5 min, cooled to 50 °C at the same speed, and held for 2 min. The major starch-viscosity characteristics were described as peak, hot, and final viscosity, breakdown, setback, and peak time. Viscosity values were recorded as centipoises (cp).

2.3. Statistical Analysis

Analysis of variance (ANOVA) was performed using the GLM procedure in SAS (version 9.4, SAS institute, Cary, NC, USA). The year was treated as a random factor, and the other factors as fixed effects. Since the interactions between years and all other factors for the tested parameters of rice-grain samples were not significant (Table 1), the data were presented as the average across the two study years. Differences between fixed effects were separated by the least-square means at a 5% probability level. All figures were generated with Origin 9.0 (Origin Lab, Northampthon, MA, USA), and standard errors of means were calculated and presented in the graphs as error bars.

3. Results and Discussion

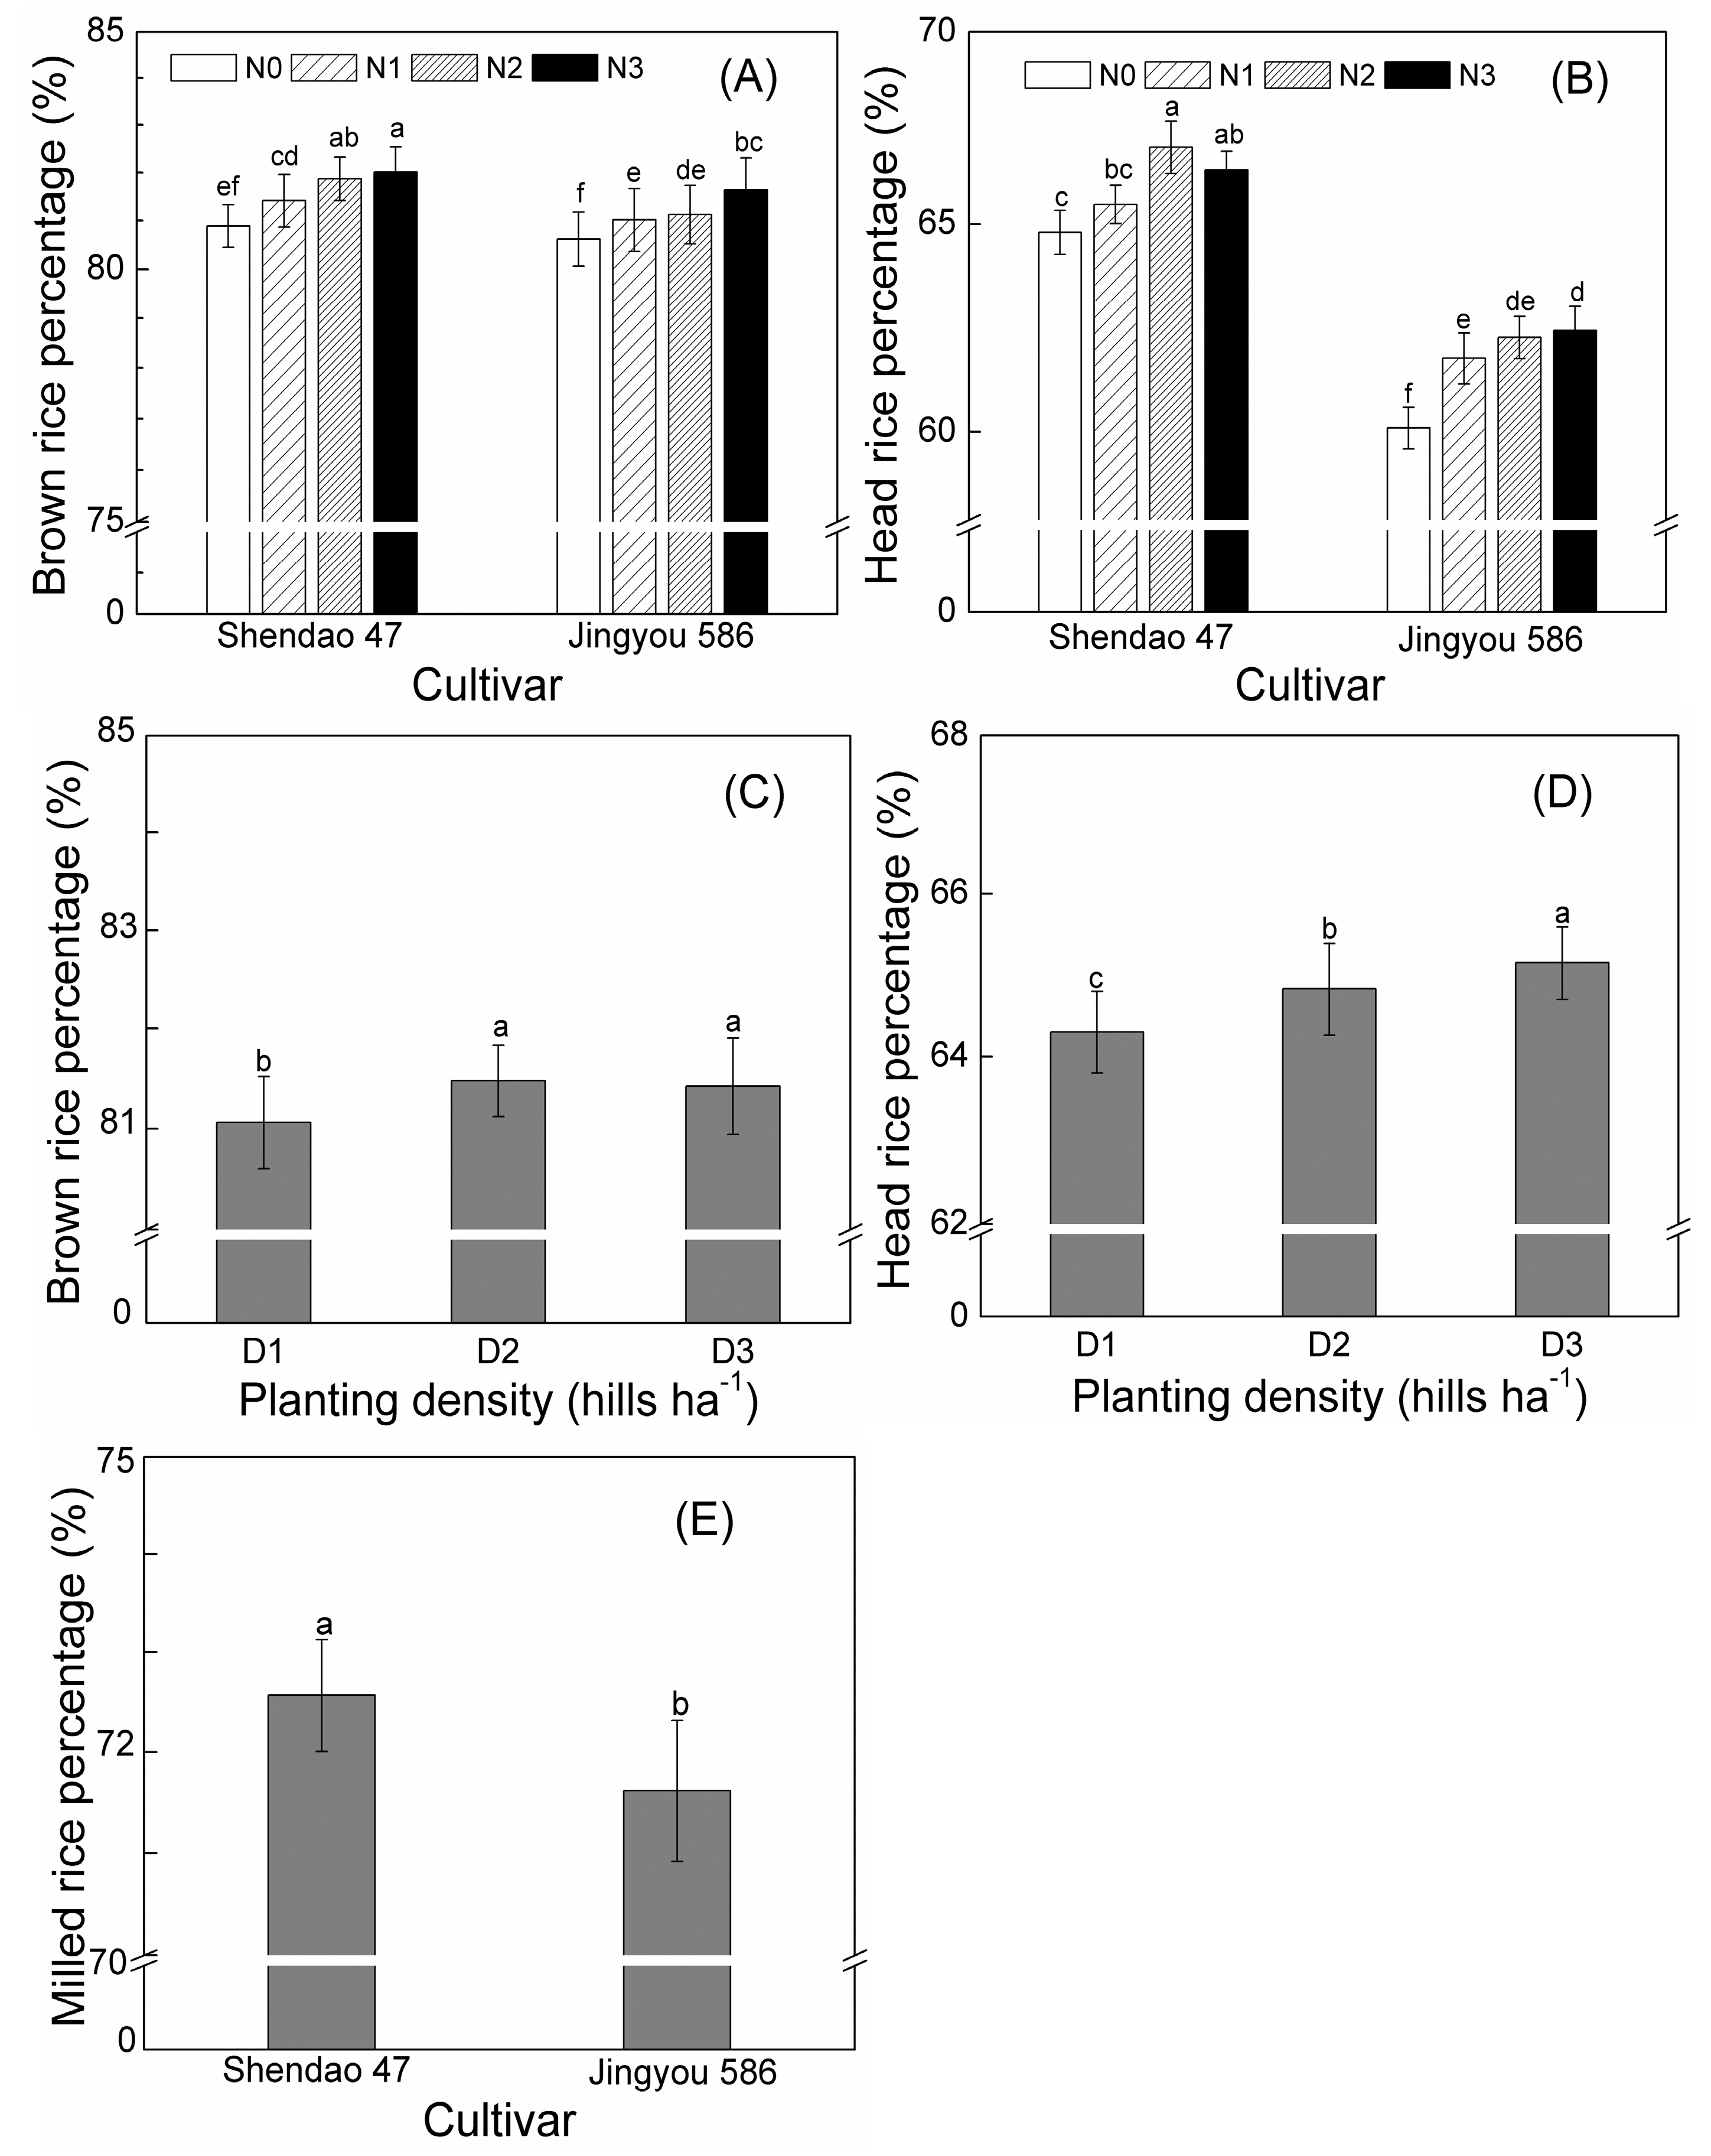
3.1. Milling Quality

Milled-rice percentage was significantly affected by cultivar (Table 1). The milled-rice percentage of Shendao 47 was much higher than that of Jingyou 586 (Figure 1E), which is in accord with the fact that inbreds like Shendao 47 have higher milled-rice percentage than hybrids like Jingyou 586 [13]. Cultivar × N rate interactions were significant for brown-rice (p = 0.044) and head-rice percentage (p = 0.008), suggesting that, for both milling-quality parameters, the two cultivars responded differently to the N rate. Nitrogen application significantly increased head-rice and brown rice percentages for both cultivars compared with the control (Figure 1A,B).These results confirmed the findings by Rosario et al. [14] and Leesawatwong et al. [15], who attributed the increase in head-rice percentage of a cultivar to an increase in protein content caused by N application. These authors suggested that high protein content in the endosperm provides resilience and reduces grain breakage during milling. Furthermore, additional protein increases hardness in rice grains, thus making rice grains more resistant to breakage during milling.
Planting density also had a significant effect on both brown-rice and head-rice percentage (Table 1). In general, increasing planting density decreased the milling quality (Figure 1C,D).Our results agree with previous work by Fagade and Ojo [16],suggesting that poor grain filling in dense populations resulting from excessive lodging and shading effects could be a main reason for low milling recovery. It is hypothesized that competition for nutrients could be one of the main constraints to increasing head-rice return at high planting densities. However, responses in head rice and total milled rice to planting density could be genotype-dependent. Gravois and Helms [17] found that there was a linear or a quadratic relationship between head-rice percentage and seeding rate depending on used cultivars. They speculated that lower rice-planting densities would increase its tillering, which prolongs the grain-filling period, thus leading to greater variation in rice-kernel maturity at harvest.

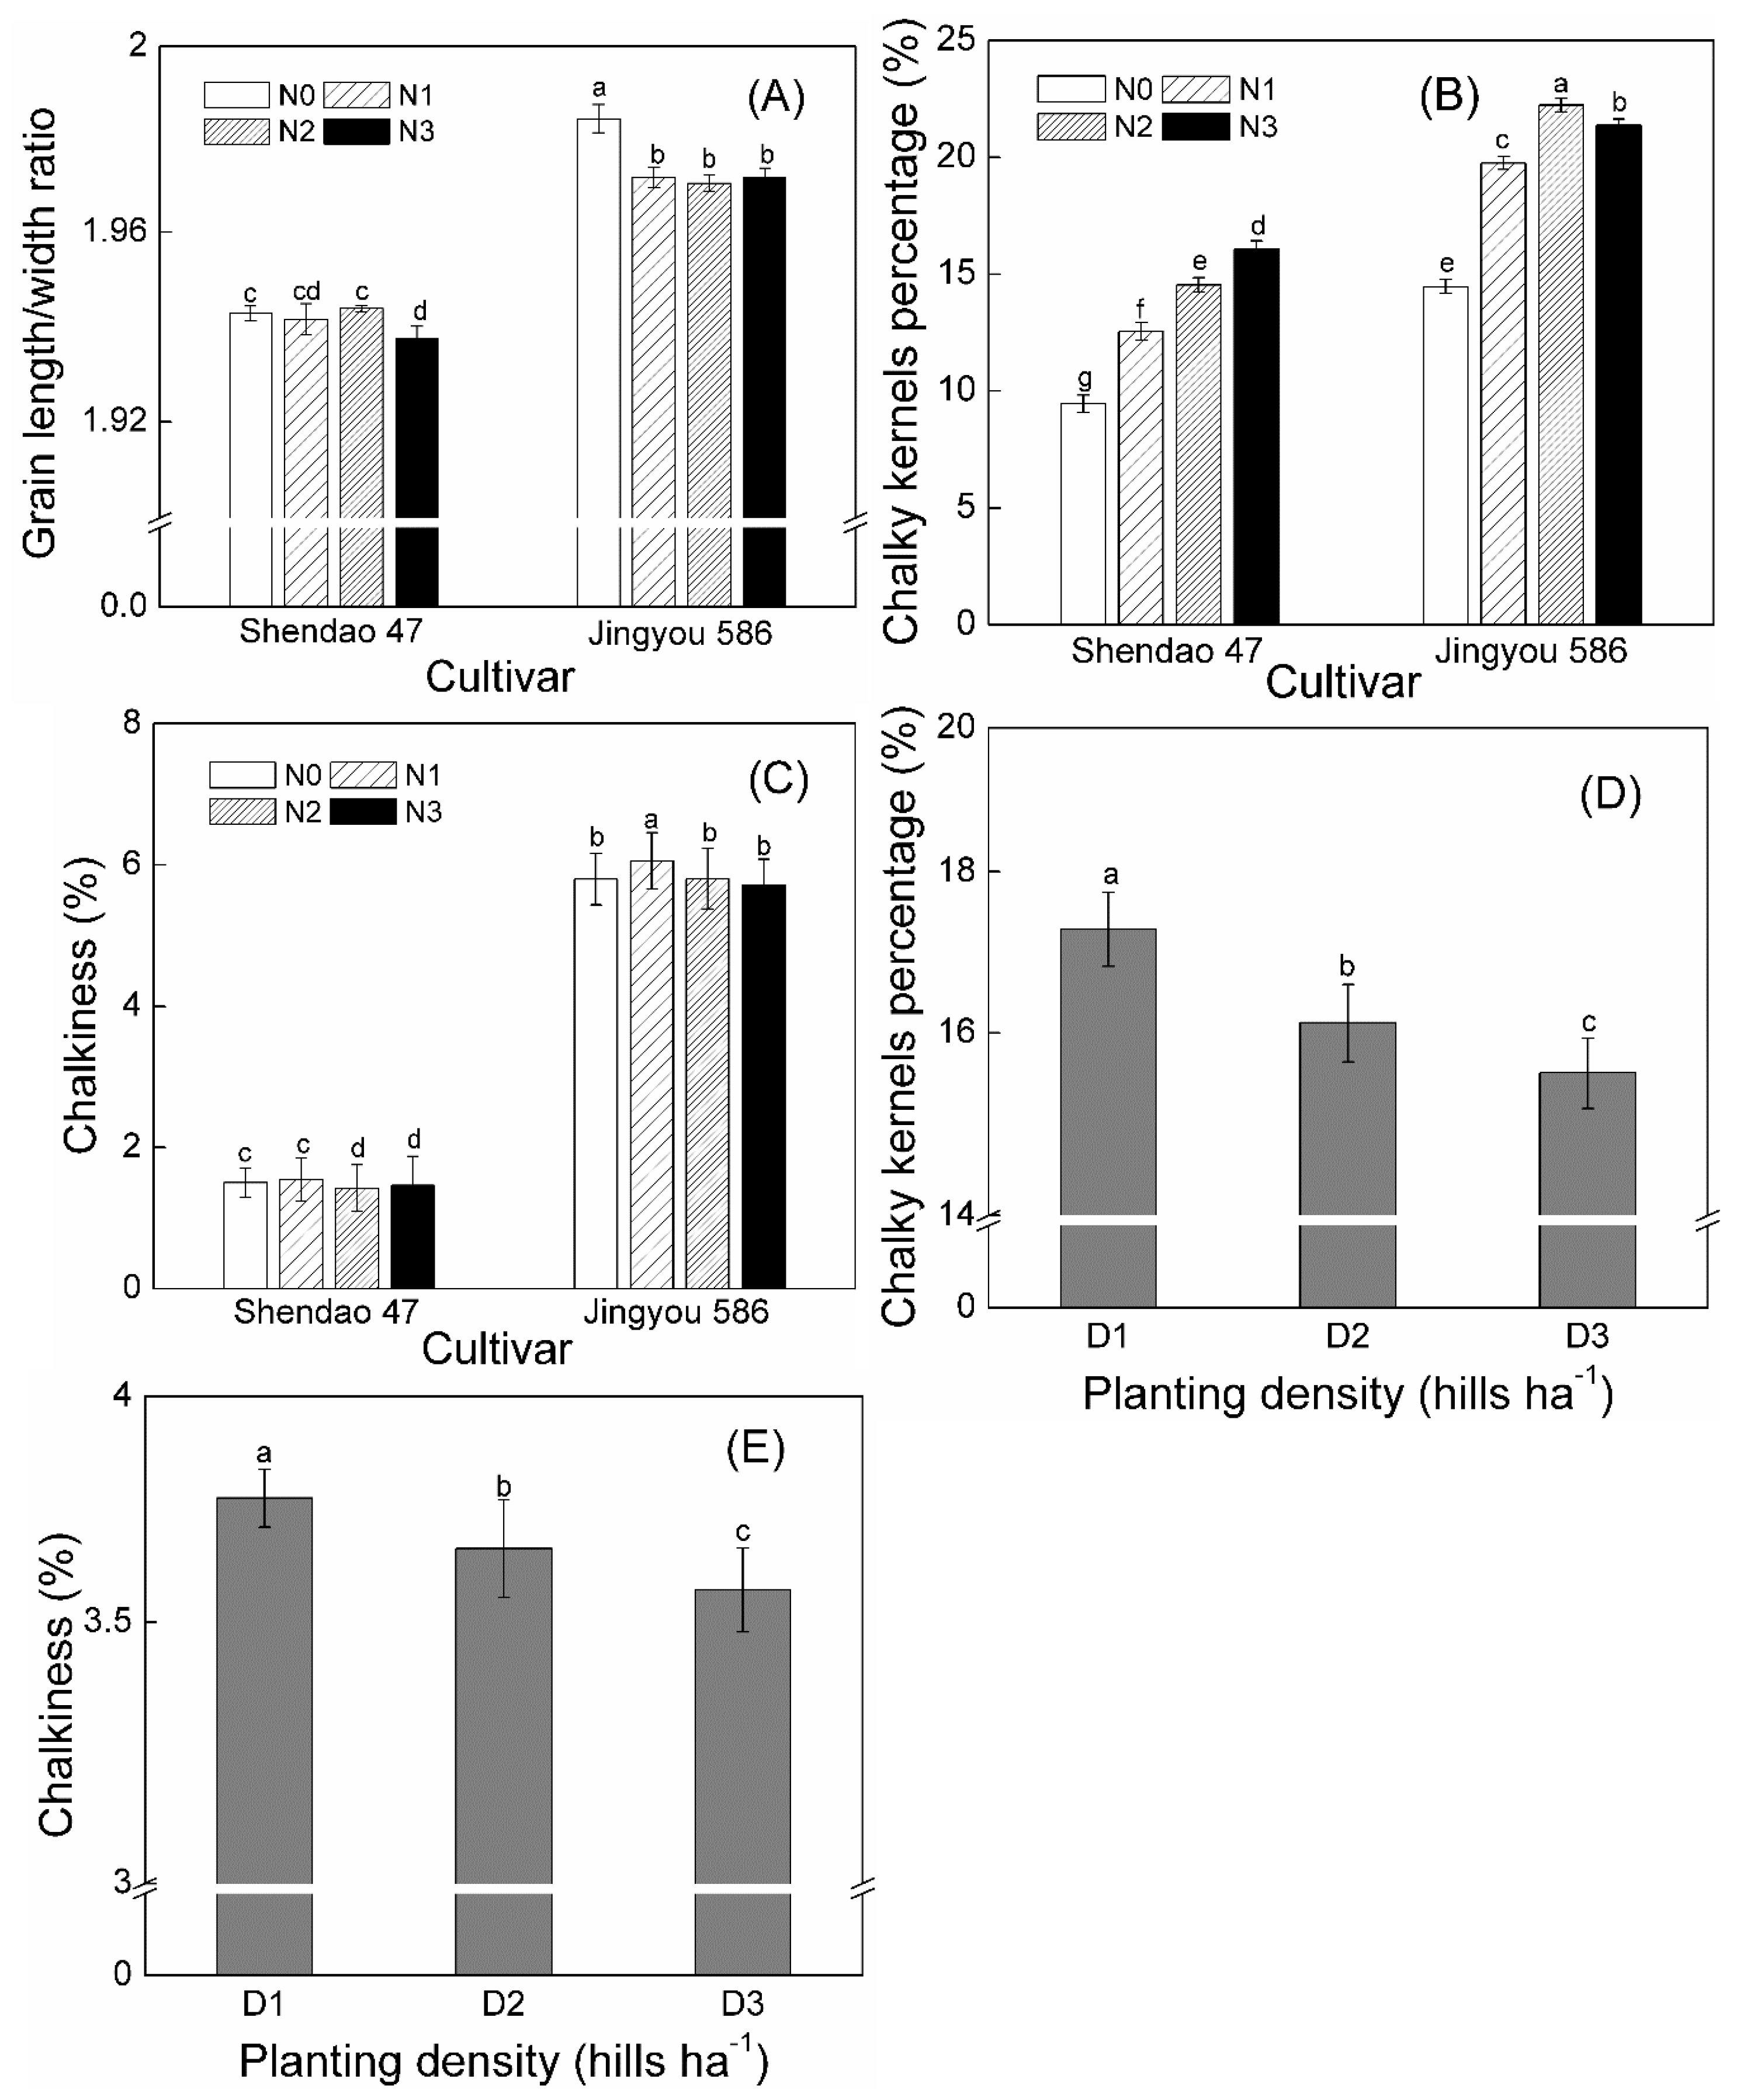
3.2. Appearance Quality

The grain length/width ratio was affected by cultivar and the interaction between cultivar and N rate (Table 1). Our results indicated that the grain shape of Jingyou 586 was much slenderer than that of Shendao 47 (Figure 2A), which may be due to genetic diversity. Zhao et al. [7] revealed that the GS9 gene regulates grain shape by altering cell division. The two cultivars responded differently to N rate in the grain length/width ratio. By increasing N application rates, no significant change in the grain length/width ratio for Shendao 47 was observed except at the highest N rate (N3); for Jingyou 586, the highest value was observed under the N0 treatment (Figure 2A). Grigg et al. [18] reported that increasing N rate reduced the kernel length and thickness of brown rice, while kernel width remained constant, which was consistent with the impact of N application on the grain length/width ratio observed here.
Chalk is an unfavorable characteristic of rice appearance that directly influences consumers’ acceptance and rice’s market value [19]. In this study, both the chalky-kernel percentage and chalkiness were significantly affected by cultivar (p < 0.001) (Table 1). Under the same treatment, the Jingyou 586 cultivar exhibited a greater percentage of chalky-kernel grains and chalkiness than Shendao 47 (Figure 2B,C). The chalky-kernel percentage and chalkiness of rice grains also responded differently to the same N rate between both cultivars, which was in agreement with previous reports [6,20].
The overall chalkiness of Shendao 47 was significantly lower than that of Jingyou 586 (Figure 2C). Nitrogen application decreased the chalkiness of Shendao 47 at high N rates, but not for Jingyou 586. Decreased chalkiness in response to increasing N rates agrees with the findings of Zhou et al. [21], and Dou et al. [22]. According to morphological studies [23,24], chalk is a white opaque part formed from compound starch granules that are loosely packed with numerous air spaces. Numerous studies on chalk occurrence have been performed in the past decades [22,23,25], and the mechanism of chalk formation has mainly been attributed to the accelerated filling rate during the grain-filling period, which results in loosely packed starch granules [26]. In the present study, the effect of N application on the percentage of chalky grains may be relevant to an assimilate deficit. Increased N application may enhance plant-growth rate and inefficient tillers, which then reduces assimilate supply to spike lets, causing poor starch accumulation and loosely packed starch granules, and finally producing chalky grains.
Planting density had a significant effect on chalky-kernel percentage and chalkiness. Chalky-kernel percentage and chalkiness significantly increased with increasing planting density (Figure 2D,E), which indicated that increasing planting density deteriorates the appearance quality of rice grains. It is possible that high planting density might reduce photosynthesis rate, which might lead to insufficient nutrient supply to the developing endosperm, reduce the ability to synthesize starch in the endosperm [23,27], and disorganize amyloplast development, consequently increasing chalky percentage and chalkiness.

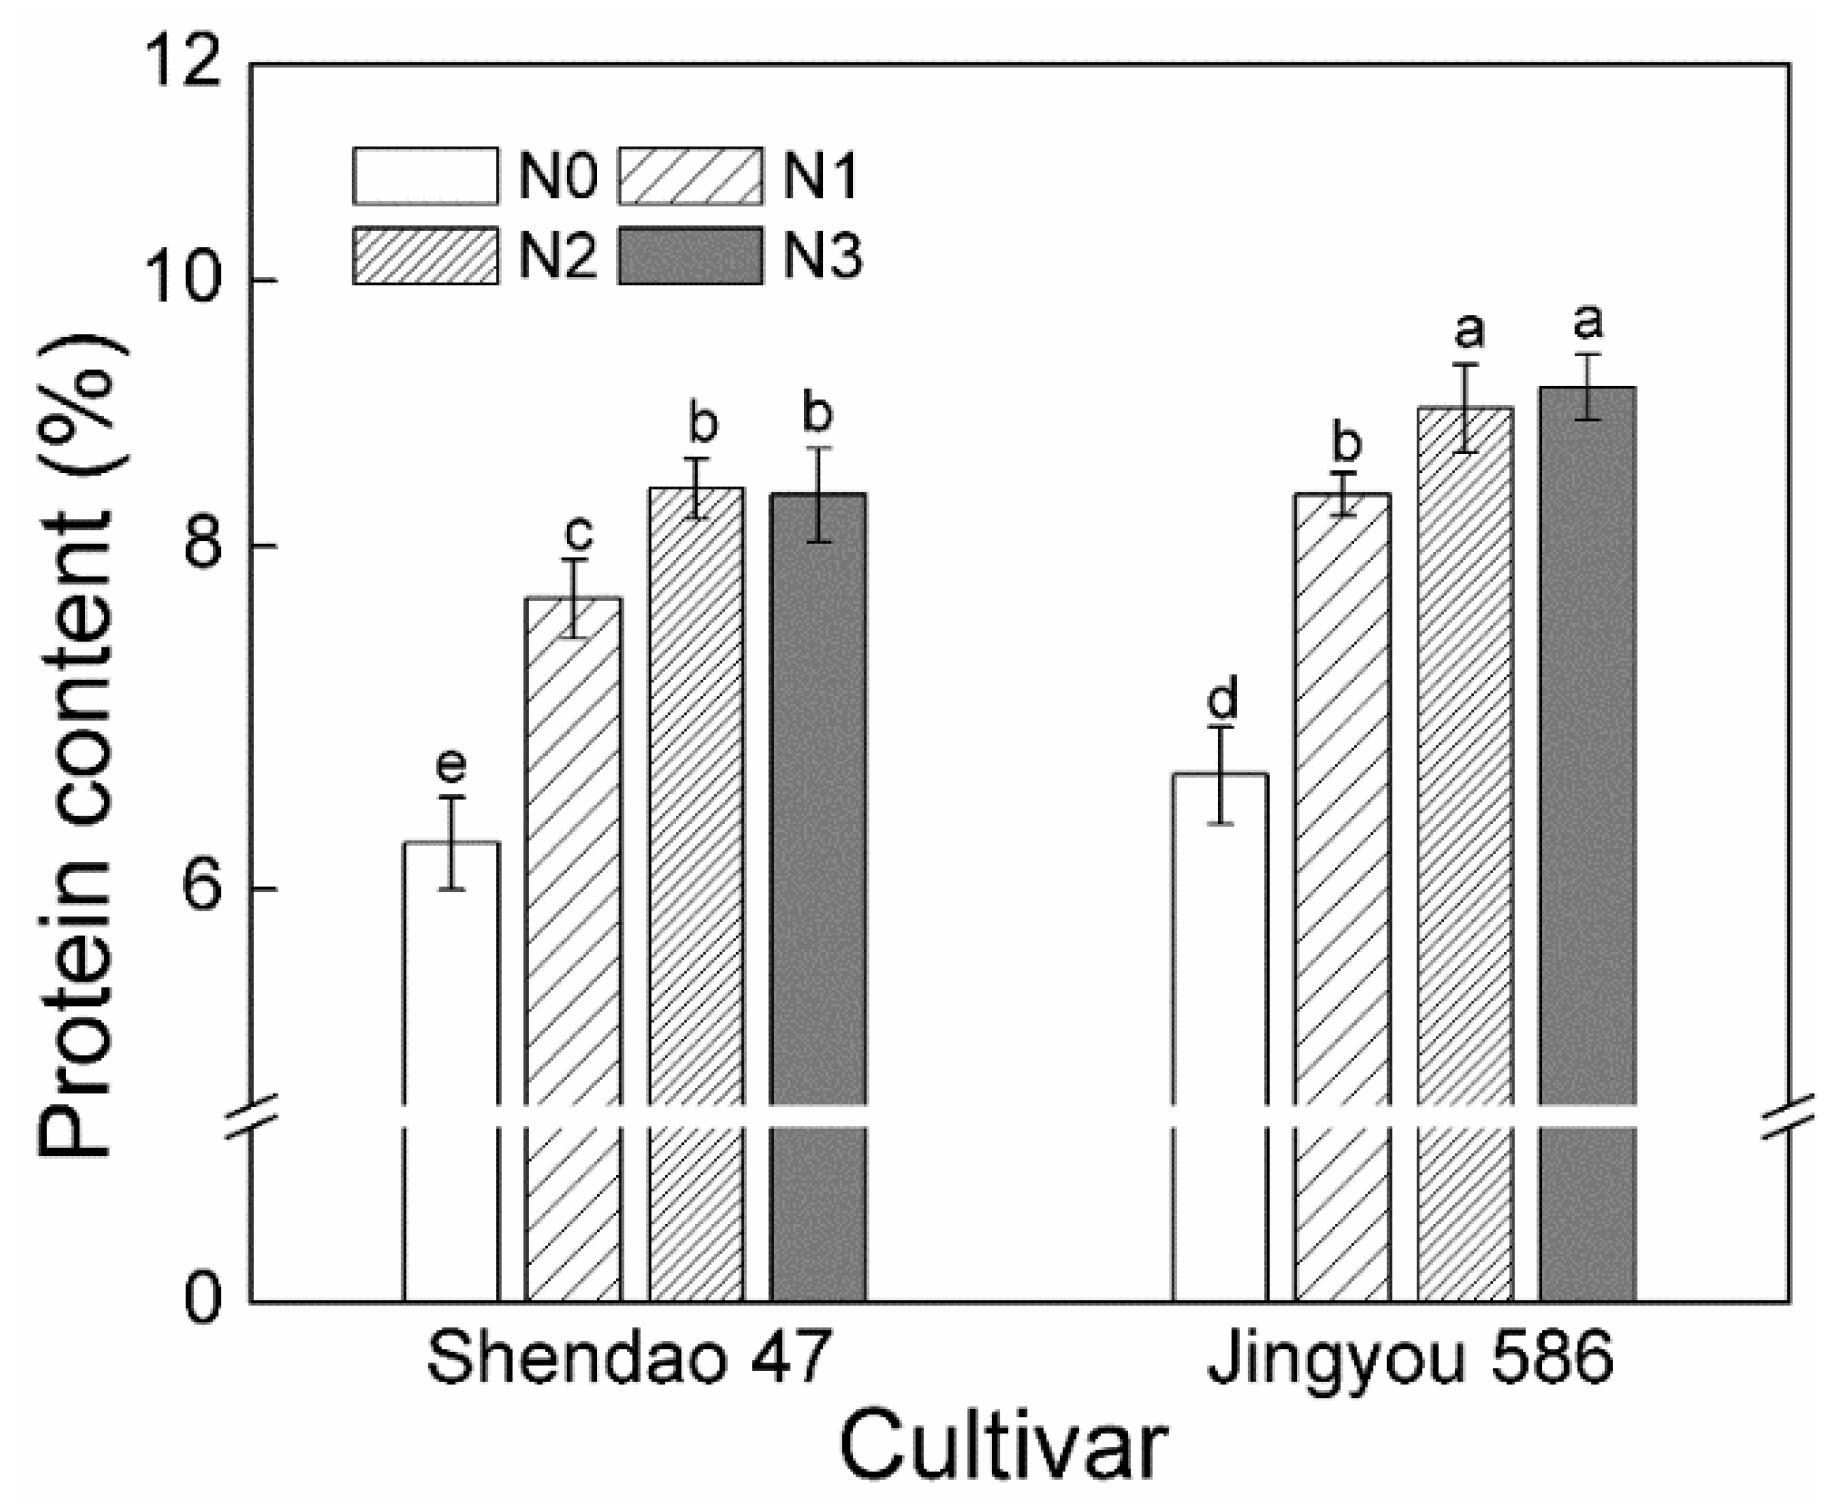
3.3. Protein Content

The protein content of milled rice was significantly affected by the N rate and cultivar. The N rate × cultivar interaction effect was also significant (Table 1). At the same N rate, Jingyou 586 exhibited significantly higher protein content than Shendao 47 (Figure 3). Increasing N rate elevated the protein content for both cultivars, agreeing with previous reports [15,28,29].Increasing the N rate from 0 to 180 kg N ha−1 (N2) resulted in higher protein content, ranging from 6.2% to 8.4% and 6.5% to 9.2% for Shendao 47 and Jingyou 586, respectively, agreeing with the trends reported by Grigg et al. [18].When continuously increasing the N fertilizer up to 220 kg N ha−1 (N3), only the protein content of Jingyou 586 slightly increased, from 8.9% to 9.2%, while the protein content of Shendao 47 slightly decreased, from 8.4% to 8.3%, in response to an increasing N rate from 180 to 220 kg N ha−1; the difference between N2 and N3 is not significant (Figure 3). These results indicated that the response of grain proteins to N-fertilizer application was cultivar-dependent [15,30]. Rice proteins, with abundant lysine and other essential amino acids, are commonly considered favorable plant proteins that provide excellent nutrition for the human diet [31]. Leesawatwong et al. [15] and Cagampang et al. [32] reported that N fertilizer increased the proportion of storage proteins that are located in protein bodies concentrated in the outer cell layers of rice endosperm, while only glutelin, the main storage protein of rice, was the soluble protein fraction that most increased with N nutrition. Consistent with these reports, Ning et al. [30] also reported that N application reduced phytic acid concentrations, but increased the four protein fractions (albumin, globulin, prolamin, and glutelin), and total protein significantly increased the concentration of glutelin. According to Julinao et al. [33], glutelin is relatively rich in lysine, suggesting that N fertilizer has a favorable effect on rice-protein quality, thus obviously promoting the nutritional value of rice. In this study, planting density showed no effect on the protein content of milled rice (Table 1). However, Xu et al. [34] reported that reductions in planting density resulted in significantly higher protein content in milled rice; they attributed this increase in protein content to reduced planting density, and, thereby, a decrease in starch accumulation. These results suggest that protein synthesis is a stronger sink than starch synthesis, agreeing with data indicating that mechanisms exist within the endosperm to partition common substrates toward the maintenance of protein synthesis at the expense of starch production [28,35].

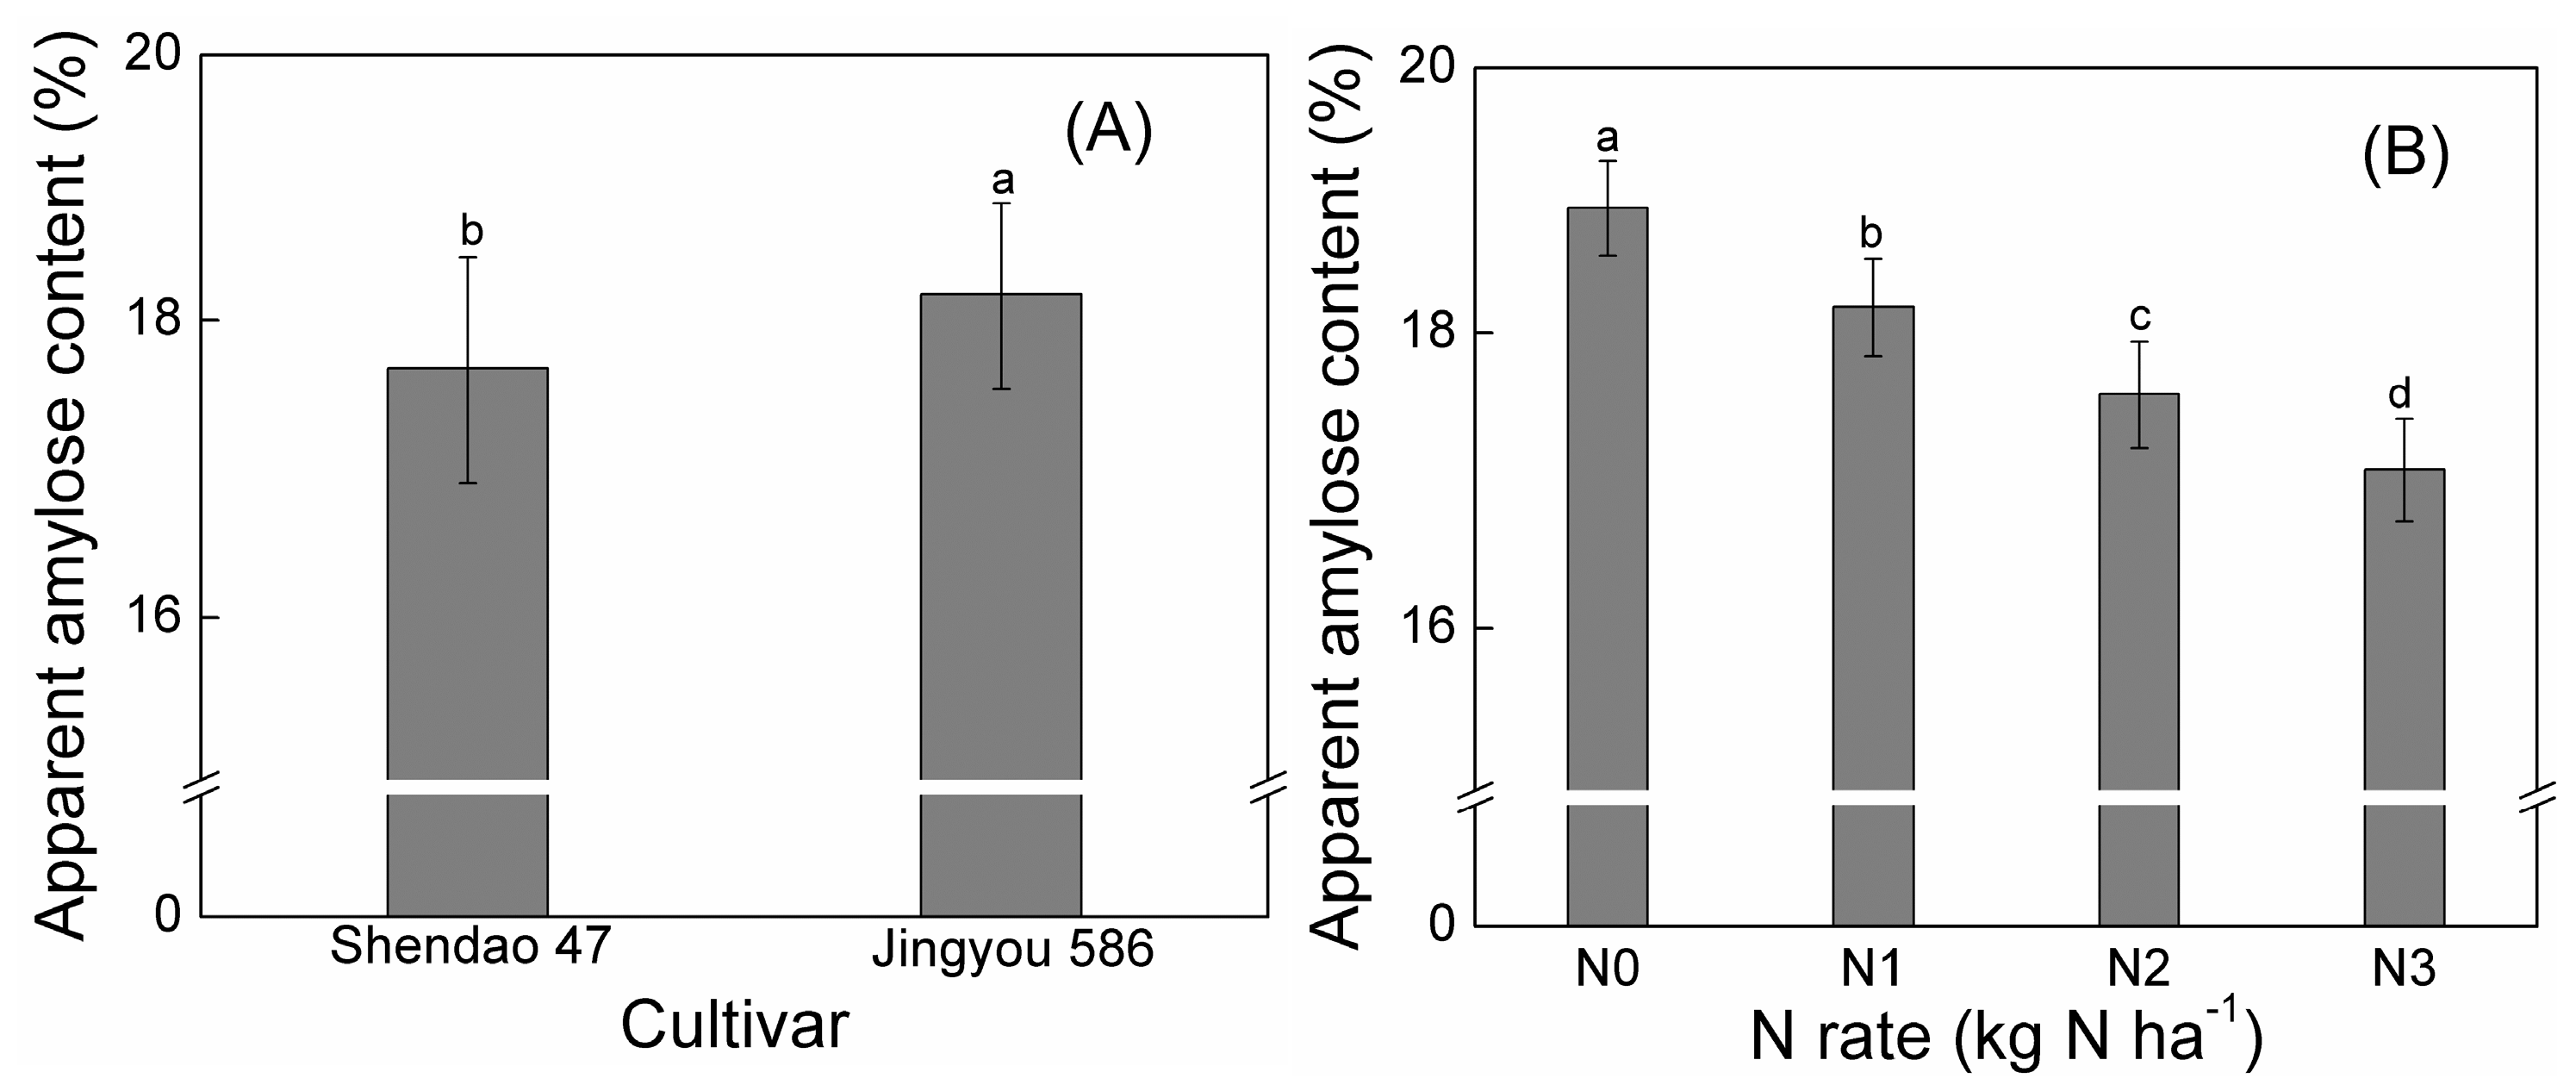
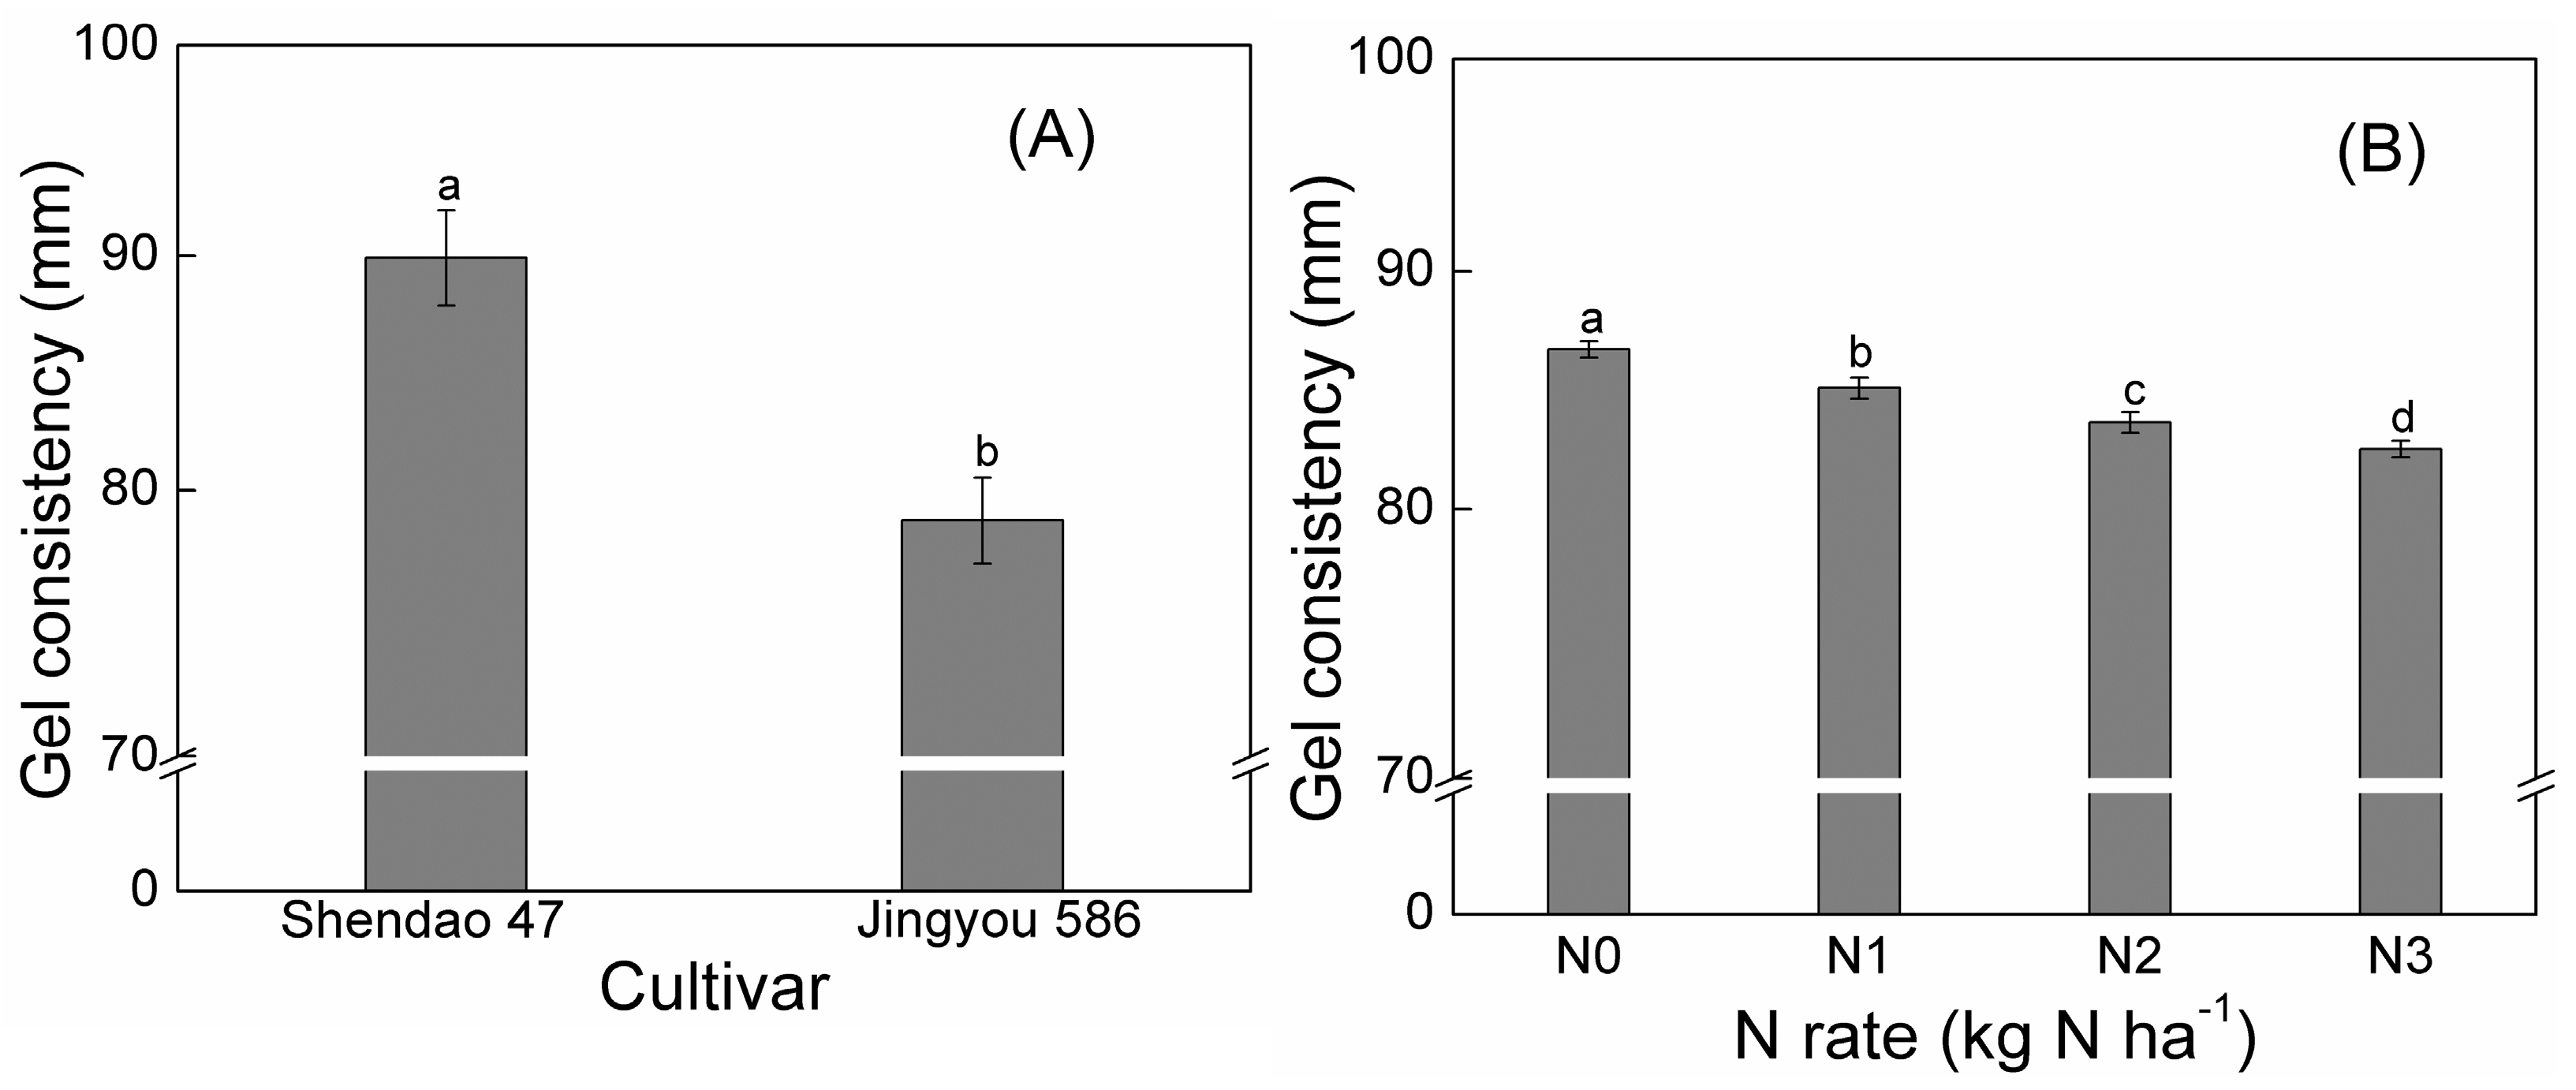
3.4. Cooking and Eating Quality

Rice cooking and eating quality is mostly determined by the physicochemical characteristics of the starch in it sendosperm, namely, apparent amylose content (AAC), gel consistency (GC), and starch pasting viscosity [2]. AAC is one of the most important quality predictors for rice-eating quality. For cooked rice, grains with high AAC are of poor cooking and eating quality, with dry, fluffy, separate, and hard characteristics, whereas those with low AAC are usually glossy, soft, and sticky [4]. In the present study, AAC was significantly affected by cultivar (Table 1). The cultivar of Jingyou 586 exhibited higher AAC than Shendao 47 (Figure 4A). The differences can be explained by genetic diversity-related variation in amylose and amylopectin amount and structure in the rice grain [4].
Although AAC is mainly influenced by genotypes, cultivation management practices can also play a role. Previous research has shown that an increase in nitrogen decreased amylose content [6,36]. Consistent with these reports, we observed that the N rate had a significant effect on AAC, that is, AAC decreased with an increasing N rate (Table 1; Figure 4B). Rice endosperm contains two evident groups of starch granules, A- and B-type. Generally, A-type starch granules possess slightly higher apparent and total amylose content than B-type starch granules [37]. Kaufman et al. [38] reported that N fertilization reduced the proportion of A-type starch granules, which could explain the amylose content reduction with a higher N fertilization rate in this study. Planting density had no significant effect on AAC.
Similar to AAC, GC was also significantly affected by cultivar and N rate, but not by planting densities (Table 1). On average, the GC value of Shendao 47 was 11.1 mm higher than that of Jingyou 586 (Figure 5A). With increasing N rate, GC significantly decreased (Figure 5B). Other research has also shown that an increase in N application decreases rice GC [6,11]. Although declined GC softens cooked rice, rice with low GC values is not always good for cooking [31].
Pasting viscosity is another critical indicator for rice cooking and eating quality, and is commonly measured with a Rapid Visco Analyzer (RVA). N rate, cultivar, and N rate × cultivar interaction had a significant effect on all RVA parameters. Planting density had a significant effect on all RVA parameters except breakdown and peak time. Furthermore, the interactive effect between planting density and cultivar was significant for peak, trough, and final viscosity, and setback, whereas no significant interaction between N rate and planting density was detected for any of the RVA parameters (Table 2).
In this study, Shendao 47 exhibited higher pasting viscosities than Jingyou 586 under the same treatment (Table 3), presumably due to its lower amylose content, as suggested by Bao [4], who found that pasting profile parameters are significantly correlated with apparent amylose content. Nitrogen application significantly reduced peak viscosity. Peak viscosities decreased by approximately 524 and 352 cP for Shendao 47 and Jingyou 586, respectively, in response to increasing the N rate from 0 to 220 kg N ha−1. Decreases in peak viscosity due to increased fertilization were also reported by Bryant et al. [29] and Grigg et al. [18]. These decreases in peak viscosity might be due to an increase in crude-protein content. Martin and Fitzgerald [39] showed negative correlation between peak viscosity and protein in response to N fertilization, attributing these phenomena to decreased disulphide bonding that disrupts the disulphide-bonded protein network.
The two cultivars responded differently to planting density in peak viscosity. In response to decreasing planting density, significant increases in the peak viscosity of Jingyou 586 were observed as planting density ranged from 25 × 104 (D1) to 12.5 × 10⁴ hills ha−1(D3), peaking at D3; the peak viscosity of Shendao 47 exhibited a different trend by peaking at the D2 treatment (Table 4). Similar trends as peak viscosities were observed for trough and final viscosity in response to the addition of Nand planting density, which agreed with Gu et al. [6] and Zhou et al. [40] who reported that low N and high sowing rates increased trough and final viscosity.
Trough and final viscosity are indications of the ability of cooked rice to retrograde, and the high values of trough and final viscosities may be due to a reduction in amylose and granule swelling. A higher peak viscosity value and lower trough-and final-viscosity values have been proposed to be associated with better-tasting cooked rice [41]. The results here demonstrate that high N application and planting density exhibited a detrimental effect on rice eating quality.
Breakdown and setback viscosities represent starch stability to sheer heat and stress. High breakdown value means low ability to bear heating, and setback viscosity reflects the retro-gradation of the starch molecules. High breakdown and low setback values are indicative of good cooking quality because the rice neither becomes hard nor retrogrades during cooking [29,36,42]. In our study, breakdown viscosity decreased with an increasing N rate for both cultivars; in response to planting density, no significant difference was detected in breakdown viscosity. In contrast, setback-viscosity value increased as the N rate increased for both cultivars, and an increase in planting density also increased setback value (Table 3 and Table 4). These results indicate that the application of N and high planting density led to the deterioration of rice cooking quality.
Pasting temperature is the temperature when starch paste begins to rise. Zhou et al. [40] found that high N and sowing rates increased pasting temperature and prolonged the peak time (the time to reach peak viscosity). Cao et al. [11] also reported that the application of N increased peak time, which was harmful to rice cooking quality. Consistent with these reports, we observed that rice starch had a higher pasting temperature and a longer peak time under a high N rate for Jingyou 586. It is well known that amylopectin is the predominant component in rice starch, and its chain length distribution plays a vital role in rice cooking quality [22]. That rice-starch pasting temperature and peak time increased under a high N rate might be due to an increase in long chains, which need more water and time to cook.

4. Conclusions

This study demonstrated that the main aspects of rice-grain quality (milling, appearance, nutrition, and cooking and eating quality) were influenced by cultivar, indicating that the difference in the traits related to grain quality between the two cultivars could be significant. The application of N led to a significant increase in brown-rice and head-rice percentage, and protein content of both cultivars. There exist significant interactions between N rate and cultivar for brown-rice and head-rice percentage, length/width ratio, chalky-kernel percentage, chalkiness, and protein content, suggesting that, for these quality parameters, the two cultivars responded differently to N rate. Shendao 47 and Jingyou 586 obtained much higher values of milling quality and protein content under N2 (180 kg N ha−1) and N3 (220 kg N ha−1) in response to N application, respectively. With the exception of decreasing kernel length/width ratio, increasing the N rate from 0 to 220 kg N ha−1 increased chalky-kernel percentage for both cultivars, while it decreased chalkiness, except for Jingyou 586 at N1. These results suggest that N rates of 180 and 220 kg N ha−1 are recommended for Shendao 47 and Jingyou 586 in terms of grain quality, respectively. As planting density increased from 12.5 × 10⁴ to 25 × 104 hills ha−1, brown rice and head percentage decreased; chalky-kernel percentage and chalkiness increased. These results indicated that high planting density is detrimental to rice-grain quality. For both cultivars, N rate also resulted in a dramatic decrease in apparent amylose content and gel consistency, the values of peak, trough, and final viscosity, and the breakdown of rice flour, but an increase in set back and peak time values, indicating that the N rate had an adverse effect on rice cooking and eating quality. In contrast to N rate, planting density had little impact on cooking and eating quality. The two cultivars responded differently to planting density in peak, trough, and final viscosity, and setback. Shendao 47 and Jingyou 586 gained higher values of peak, trough, and final viscosity, and lower setback value under D2 (16.7 × 10⁴ hills ha−1) and D3 (12.5 × 10⁴ hills ha−1). Therefore, the planting densities of 16.7 × 10⁴ and 12.5 × 10⁴ hills ha−1 are recommended for Shendao 47 and Jingyou 586, respectively. Our results suggest that rice cultivars and management practices, including N application and planting density, canbe used to improve grain quality.

Author Contributions

conceptualization, S.W.; data curation, C.Z., Y.H., B.J., and R.L.; formal analysis, F.D.; funding acquisition, S.W.; investigation, Y.H.; project administration, B.J.; resources, Y.H., Y.W. (Yan Wang), Y.W. (Yun Wang), and Q.X.; supervision, S.W.; writing—original draft, C.Z.; writing—review and editing, C.Z. and F.D. All authors read and approved the manuscript.

Funding

This study was supported by the National Key Research and Development Program of China (2016YFD0300104) and the China Scholarship Council (CSC).

Acknowledgments

We fully appreciate the editors and all anonymous reviewers for their constructive comments on this manuscript.

Conflicts of Interest

The authors declare no conflict of interest. Mention of trade names or commercial products in this publication is solely for the purpose of providing specific information, and does not imply recommendation or endorsement by the authors.

References

  1. Zhu, D.W.; Zhang, H.C.; Guo, B.W.; Xu, K.; Dai, Q.G.; Wei, C.X.; Zhou, G.S.; Huo, Z.Y. Physicochemical properties of Indica-japonica hybrid rice starch from Chinese varieties. Food Hydrocolloids 2017, 63, 356–363. [Google Scholar] [CrossRef]
  2. Tong, C.; Chen, Y.L.; Tang, F.F.; Xu, F.F.; Huang, Y.; Chen, H.; Bao, J.S. Genetic diversity of amylose content and RVA pasting parameters in 20 rice accessions grown in Hainan, China. Food Chem. 2014, 161, 239–245. [Google Scholar] [CrossRef] [PubMed]
  3. Koutroubas, S.D.; Mazzini, F.; Pons, B.; Ntanos, D.A. Grain quality variation and relationships with morpho-physiological traits in rice (Oryza sativa L.) genetic resource in Europe. Field Crops Res. 2004, 86, 115–130. [Google Scholar] [CrossRef]
  4. Bao, J.S. Toward understanding the genetic and molecular bases of the eating and cooking qualities of rice. Cereal Foods World 2012, 57, 148–156. [Google Scholar] [CrossRef]
  5. Lyon, B.G.; Champagne, E.T.; Vinyard, B.T.; Windham, W.R. Sensory and instrumental relationships of texture of cooked rice from selected cultivars and postharvest handling practices. Cereal Chem. 2000, 77, 64–69. [Google Scholar] [CrossRef]
  6. Gu, J.F.; Chen, J.; Chen, L.; Wang, Z.Q.; Zhang, H.; Yang, J.C. Grain quality changes and responses to nitrogen fertilizer of japonica rice cultivars released in the Yangtze River Basin from the 1950s to 2000s. Crop J. 2015, 3, 285–297. [Google Scholar] [CrossRef]
  7. Zhao, D.S.; Li, Q.F.; Zhang, C.Q.; Zhang, C.; Yang, Q.Q.; Pan, L.X.; Ren, X.Y.; Lu, J.; Gu, M.H.; Liu, Q.Q. GS9 acts as a transcriptional activator to regulate rice grain shape and appearance quality. Nat. Commun. 2018, 9, 1240. [Google Scholar] [CrossRef] [PubMed]
  8. Bao, J.S.; Sun, M.; Corke, H. Analysis of the genetic behavior of some starch properties in Indica rice thermal properties, gel texture, swelling volume. Theor. Appl. Genet. 2002, 104, 408–413. [Google Scholar] [CrossRef] [PubMed]
  9. He, P.; Li, S.G.; Qian, Q.; Ma, Y.Q.; Li, J.Z.; Wang, W.M.; Chen, Y.; Zhu, L.H. Genetic analysis of rice grain quality. Theor. Appl. Genet. 1999, 98, 502–508. [Google Scholar] [CrossRef]
  10. Bao, J.S.; Kong, X.L.; Xie, J.K.; Xu, L.J. Analysis of genotypic and environmental effects on rice starch. 1. Apparent amylose content, pasting viscosity, and gel texture. J. Agric. Food Chem. 2004, 52, 6010–6016. [Google Scholar] [CrossRef] [PubMed]
  11. Cao, X.M.; Sun, H.Y.; Wang, C.G.; Ren, X.J.; Liu, H.F.; Zhang, Z.J. Effects of late-stage nitrogen fertilizer application on the starch structure and cooking quality of rice. J. Sci. Food Agric. 2017, 98, 2332–2340. [Google Scholar] [CrossRef] [PubMed]
  12. Chen, W.F.; Pan, W.B.; Xu, Z.J. Current situation and trends in production of Japonica rice in China. J. Shenyang Agric. Univ. 2006, 37, 801–805. [Google Scholar] [CrossRef]
  13. Lu, Q.S.; Hua, Z.T.; Zou, J.C. Heterosis of Crops; China Agricultural Press: Beijing, China, 2001. [Google Scholar]
  14. Rosario, A.R.D.; Briones, V.P.; Vidal, A.J.; Juliano, B.O. Composition and endosperm structure of developing and mature rice kernel. Cereal Chem. 1968, 45, 225–235. [Google Scholar]
  15. Leesawatwong, M.; Jamjod, S.; Kuo, J.; Dell, B.; Rerkasem, B. Nitrogen fertilizer increases seed protein and milling quality of rice. Cereal Chem. 2005, 82, 588–593. [Google Scholar] [CrossRef]
  16. Fagade, S.O.; Ojo, A.A. Influence of plant density and nitrogen on yield and milling quality of lowland rice in Nigeria. Exp. Agric. 1977, 13, 17–24. [Google Scholar] [CrossRef]
  17. Gravois, K.A.; Helms, R.S. Seeding rate effects on rough rice yield, head rice, and total milled rice. Agron. J. 1996, 88, 82–84. [Google Scholar] [CrossRef]
  18. Grigg, B.C.; Siebenmorgen, T.J.; Norman, R.J. Effects of nitrogen rate and harvest moisture content on physicochemical properties and milling yields of rice. Cereal Chem. 2016, 93, 172–181. [Google Scholar] [CrossRef]
  19. Fitzgerald, M.A.; Mccouch, S.R.; Hall, R.D. Not just a grain of rice: The quest for quality. Trends Plant Sci. 2009, 14, 133–139. [Google Scholar] [CrossRef] [PubMed]
  20. Lan, Y.; Huang, P.; Jianggu, C.H.; Lei, X.B.; Ding, C.B.; Li, T. Effect of nitrogen application and planting density on grain yield and quality of japonica rice cultivar D46 in the planting area of Chengdu plain. J. Zhejiang Univ. 2015, 42, 63–73. [Google Scholar] [CrossRef]
  21. Zhou, L.J.; Liang, S.S.; Ponce, K.; Marundon, S.; Ye, G.Y.; Zhao, X.Q. Factors affecting head rice yield and chalkiness in Indica rice. Field Crops Res. 2015, 172. [Google Scholar] [CrossRef]
  22. Dou, Z.; Tang, S.; Li, G.H.; Liu, Z.H.; Ding, C.Q.; Chen, L.; Wang, S.H.; Ding, Y.F. Application of nitrogen fertilizer at heading stage improves rice quality under elevated temperature during grain-filling stage. Crop Sci. 2017, 57, 2183–2192. [Google Scholar] [CrossRef]
  23. Ishimaru, T.; Horigane, A.K.; Ida, M.; Iwasawa, N.; San-oh, Y.A.; Nakazono, M.; Nishizawa, N.K.; Masumura, T.; Kondo, M.; Yoshida, M. Formation of grain chalkiness and changes in water distribution in developing rice caryopses grown under high-temperature stress. J. Cereal Sci. 2009, 50, 166–174. [Google Scholar] [CrossRef]
  24. Xi, M.; Zhao, Y.L.; Lin, Z.M.; Zhang, X.C.; Ding, C.Q.; Tang, S.; Liu, Z.H.; Wang, S.H.; Ding, Y.F. Comparison of physicochemical characteristics between white-belly and white-core rice grains. J. Cereal Sci. 2016, 69, 392–397. [Google Scholar] [CrossRef]
  25. Lanning, S.B.; Siebenmorgen, T.J.; Counce, P.A.; Ambardekar, A.A.; Mauromoustakos, A. Extreme nighttime air temperatures in 2010 impact chalkiness and milling quality. Field Crops Res. 2011, 124, 132–136. [Google Scholar] [CrossRef]
  26. Tsukaguchi, T.; Iida, Y. Effects of assimilate supply and high temperature during grain-filling period on the occurrence of various types of chalky kernels in rice plants (Oryza sativa L.). Plant Prod. Sci. 2008, 11, 203–210. [Google Scholar] [CrossRef]
  27. Yamakawa, H.; Hirose, T.; Kuroda, M.; Yamaguchi, T. Comprehensive expression profiling of rice grain ripening-related genes under high temperature using DNA microarray. Plant Physiol. 2007, 144, 258–277. [Google Scholar] [CrossRef] [PubMed]
  28. Champagne, E.T.; Bett-Garber, K.L.; Thomson, J.L.; Fitzgerald, M.A. Unraveling the impact of nitrogen nutrition on cooked rice flavor and texture. Cereal Chem. 2009, 86, 274–280. [Google Scholar] [CrossRef]
  29. Bryant, R.J.; Anders, M.; McClung, A.M. Effect of cultural management practices on grain quality of two rice cultivars. Cereal Chem. 2009, 86, 405–409. [Google Scholar] [CrossRef]
  30. Ning, H.F.; Liu, Z.H.; Wang, Q.S.; Lin, Z.M.; Chen, S.J.; Li, G.H.; Wang, S.H.; Ding, Y.F. Effect of nitrogen fertilizer application on grain phytic acid and protein concentrations in japonica rice and its variations with genotypes. J. Cereal Sci. 2009, 50, 49–55. [Google Scholar] [CrossRef]
  31. Yuan, L.; Zhang, Z.C.; Cao, X.C.; Zhu, S.C.; Zhang, X.; Wu, L.H. Responses of rice production, milled rice quality and soil properties to various nitrogen inputs and rice straw incorporation under continuous plastic film mulching cultivation. Field Crops Res. 2014, 155, 164–171. [Google Scholar] [CrossRef]
  32. Cagampang, G.B.; Cruz, L.J.; Espiritu, S.G.; Santiago, R.O.; Juliano, B.O. Studies on the extraction and composition of rice proteins. Cereal Chem. 1966, 43, 145–155. [Google Scholar]
  33. Juliano, B.O.; Antonio, A.A.; Esmama, B.V. Effects of protein content on the distribution and properties of rice protein. J. Sci. Food Agric. 1973, 24, 295–306. [Google Scholar] [CrossRef] [PubMed]
  34. Xu, C.M.; Wang, D.Y.; Shao, G.S.; Zhang, X.F. Effects of transplanting density and nitrogen fertilizer rate on yield formation and grain quality of super high yielding rice Zhongzao 22. Chin. J. Rice Sci. 2008, 22, 507–512. [Google Scholar] [CrossRef]
  35. Emes, M.J.; Bowsher, C.G.; Hedley, C.; Burrell, M.M.; Scrase-Field, E.S.F.; Tetlow, I.J. Starch synthesis and carbon partitioning in developing endosperm. J. Exp. Bot. 2003, 54, 569–575. [Google Scholar] [CrossRef] [PubMed] [Green Version]
  36. Zhu, D.W.; Zhang, H.C.; Guo, B.W.; Xu, K.; Dai, Q.G.; Wei, C.X.; Zhou, G.S.; Huo, Z.Y. Effects of nitrogen level on structure and physicochemical properties of rice starch. Food Hydrocolloids 2017, 63, 525–532. [Google Scholar] [CrossRef]
  37. Shinde, S.V.; Nelson, J.E.; Huber, K.C. Soft wheat starch pasting behavior in relation to A- and B-granule content and composition. Cereal Chem. 2003, 80, 91–98. [Google Scholar] [CrossRef]
  38. Kaufman, R.C.; Wilson, J.D.; Bean, S.R.; Presley, D.R.; Blanco-Canqui, H.; Mikha, M. Effect of nitrogen fertilizer and cover cropping systems on sorghum grain characteristics. J. Agric. Food Chem. 2013, 61, 5715–5719. [Google Scholar] [CrossRef] [PubMed]
  39. Martin, M.; Fitzgerald, M.A. Proteins in rice grains influence cooking properties. J. Cereal Sci. 2002, 36, 285–294. [Google Scholar] [CrossRef]
  40. Zhou, M.X.; Roberts, G.L.; Robards, K.; Glennie-Holmes, M.; Helliwell, S. Effects of sowing date, nitrogen application, and sowing rate on oat quality. Aust. J. Agric. Res. 1998, 49, 845–852. [Google Scholar] [CrossRef]
  41. Zhang, Z.C.; Zhang, S.F.; Yang, J.C.; Zhang, J.H. Yield, grain quality and water use efficiency of rice under non-flooded mulching cultivation. Field Crops Res. 2008, 108, 71–81. [Google Scholar] [CrossRef]
  42. Asante, M.D.; Offei, S.K.; Gracen, V.; Adu-Dapaah, H.; Danquah, E.Y.; Bryant, R.; McClung, A. Starch physicochemical properties of rice accessions and their association with molecular markers. Starch-Stärke 2013, 65, 1022–1028. [Google Scholar] [CrossRef]
Figure 1. (A) Brown-rice and (B) head-rice percentage of two cultivars under different N rates; (C) brown-rice and (D) head-rice percentage under different planting density; (E) milled-rice percentage of two cultivars. N0, N1, N2, and N3 refer to nitrogen rate of 0, 140, 180, and 220 kg ha−1, respectively; D1, D2, and D3 refer to25 × 104, 16.7 × 10⁴, and 12.5 × 10⁴ hills ha−1, respectively. Data were averaged for two years. Different letters within each panel indicated significant differences at p < 0.05.
Agronomy 08 00246 g001
Figure 2. (A) Grain length/width ratio, (B) chalky-kernel percentage, and (C) chalkiness of two cultivars under different N rate; (D) chalky-kernel percentage and (E) chalkiness under different planting density. N0, N1, N2, and N3 refer to nitrogen rate of 0, 140, 180, and 220 kg ha−1, respectively; D1, D2, and D3 refer to25 × 104, 16.7 × 10⁴, and 12.5 × 10⁴ hills ha−1, respectively. Data were averaged for two years. Different letters within each panel indicated significant differences at p < 0.05.
Agronomy 08 00246 g002
Figure 3. Protein content of two cultivars under different N rates. N0, N1, N2, and N3 refer to a nitrogen rate of 0, 140, 180, and 220 kg ha−1, respectively. Data were averaged for two years. Different letters indicated significant differences at p < 0.05.
Agronomy 08 00246 g003
Figure 4. (A) Apparent amylose content of two cultivars; (B) apparent amylose content under different N rate. N0, N1, N2, and N3 refer to nitrogen rate of 0, 140, 180, and 220 kg ha−1, respectively. Data were averaged for two years. Different letters within each panel indicated significant differences at p < 0.05.
Agronomy 08 00246 g004
Figure 5. (A) Gel consistency of two cultivars; (B) gel consistency under different N rates. N0, N1, N2, and N3 refer to a nitrogen rate of 0, 140, 180, and 220 kg ha−1, respectively. Data were averaged for two years. Different letters within each panel indicated significant differences at p < 0.05.
Agronomy 08 00246 g005
Table 1. Analysis of variance p values for rice-grain quality traits as affected by trial year (Y), cultivar (C), N rate (N), planting density (D), and their interactions for field experiments conducted in 2015 and 2016.
Source of VariationBRPMRPHRPLWRCKPCKPCAACGC
p Value
Year (Y)0.6960.5240.2940.1530.0480.1150.3060.5030.221
Cultivar(C)<0.001<0.001<0.001<0.001<0.001<0.001<0.001<0.001<0.001
N rate (N)<0.0010.355<0.0010.461<0.0010.025<0.001<0.001<0.001
Planting density (D)<0.0010.526<0.0010.828<0.001<0.0010.5710.2320.205
Y × N0.7990.9780.8290.1280.5310.9970.1040.3960.700
Y × D0.8210.8950.3000.1930.9620.8690.9260.9560.993
Y × C0.4610.7290.5520.2250.1150.2880.3350.3710.802
N × D0.8620.9960.9700.1270.0970.9990.9990.9990.998
N × C0.0440.6160.0080.0410.0470.0410.0170.1230.550
D × C0.1890.9410.1390.9840.8670.0800.5130.7250.852
Y × N × C0.9800.9760.6540.8970.3060.9730.4010.7820.849
Y × D × C0.7220.9870.1550.9060.7530.9970.9770.9320.995
Y × N × D0.9840.9980.8710.2180.2940.9540.9990.9990.999
N × D × C0.3230.9960.1660.4020.0820.8950.9990.9990.999
Y × N × D × C0.9630.9980.9800.3460.2160.9790.9990.9980.999
Abbreviations: BRP, brown-rice percentage; MRP, milled-rice percentage HRP, head-rice percentage; LWR, length/width ratio; CKP, chalky kernels percentage; CK, chalkiness; PC, protein content; AAC, apparent amylose content; GC, gel consistency.
Table 2. Analysis of variance p values for pasting properties of rice starch as affected by cultivar (C), N rate (N), planting density (D), and their interactions for field experiments.
Source of VariationPVTVBDFVSBPaTPeT
p Value
C<0.001<0.001<0.001<0.001<0.001<0.001<0.001
N<0.001<0.001<0.001<0.001<0.001<0.0010.001
D<0.001<0.0010.3770.0010.0020.0020.954
N × C<0.001<0.001<0.001<0.001<0.001<0.001<0.001
D × C<0.0010.0350.3950.0490.0270.7690.661
N × D0.6340.7680.9770.080.3280.5560.729
N × C × D0.5910.9240.9850.4580.7270.9520.594
Abbreviations: PV, peak viscosity;TV, trough viscosity; BD, breakdown viscosity; FV, final viscosity; SB, setback viscosity; PaT, pasting temperature; PeT, peak time.
Table 3. Effects of cultivar × nitrogen rate (N) interaction on pasting properties of rice starch.
CultivarTreatmentPVTVBDFVSBPaTPeT
(cP)(cP)(cP)(cP)(cP)(cP)(cP)
Shendao47N03273 a1670 a1603 a2340 a−933 h70.5 d6.14 d
N13228 b1650 b1579 b2326 b−903 g70.5 d6.23 c
N22937 d1543 e1394 d2189 d−748 d70.5 d6.25 c
N32749 g1470 g1279 g2079 g−670 a70.5 d6.3 b
Mean3047 A1583 A1464 A2233 A−814 B70.5 B6.23 B
Jingyou 586N03134 c1620 c1514 c2267 c−867 f72.3 c6.31 b
N12942 d1583 d1359 e2174 e−768 e73.5 b6.33 a b
N22827 e1535 e f1292 f2115 f−712 c73.7 a6.34 a
N32782 f1525 f1257 h2086 g−696 b73.7 a6.36 a
Mean2921 B1566 B1356 B2161 B−761 A73.3 A6.34 A
Values with a column followed by different letters were significantly different at p < 0.05. Lower- and uppercase letters indicate comparisons among treatments of each cultivar and between two cultivars, respectively. N0, N1, N2, and N3 refer to a nitrogen rate of 0, 140, 180, and 220 kg ha−1, respectively.
Table 4. Effects of cultivar × planting density (D) interaction onrice-starch pasting properties.
CultivarTreatmentPVTVBDFVSBPaTPeT
(cP)(cP)(cP)(cP)(cP)(cP)(cP)
Shendao 47D13045 b1582 b1462 a2234 a−811 d70.5 b6.22 b
D23057 a1591 a1464 a2241 a−815 d70.5 b6.23 b
D33038 b1576 c1463 a2225 b−814 d70.5 b6.23 b
Jingyou 586D12913 d1563 d1356 b2160 c−753 a73.4 a6.34 a
D22922 c1572 c1354 b2161 c−761 b73.3 a6.33 a
D32929 c1576 c1365 b2160 c−768 c73.3 a6.33 a
Values in the same column for each cultivar with different letters are significantly different (p < 0.05); D1, D2, and D3 refer to 25 × 104, 16.7 × 10⁴, and 12.5 × 10⁴ hills ha−1, respectively.

