Plant Responses to an Integrated Cropping System Designed to Maintain Yield Whilst Enhancing Soil Properties and Biodiversity


 , , ,
, , ,
Abstract
:1. Introduction
2. Materials and Methods
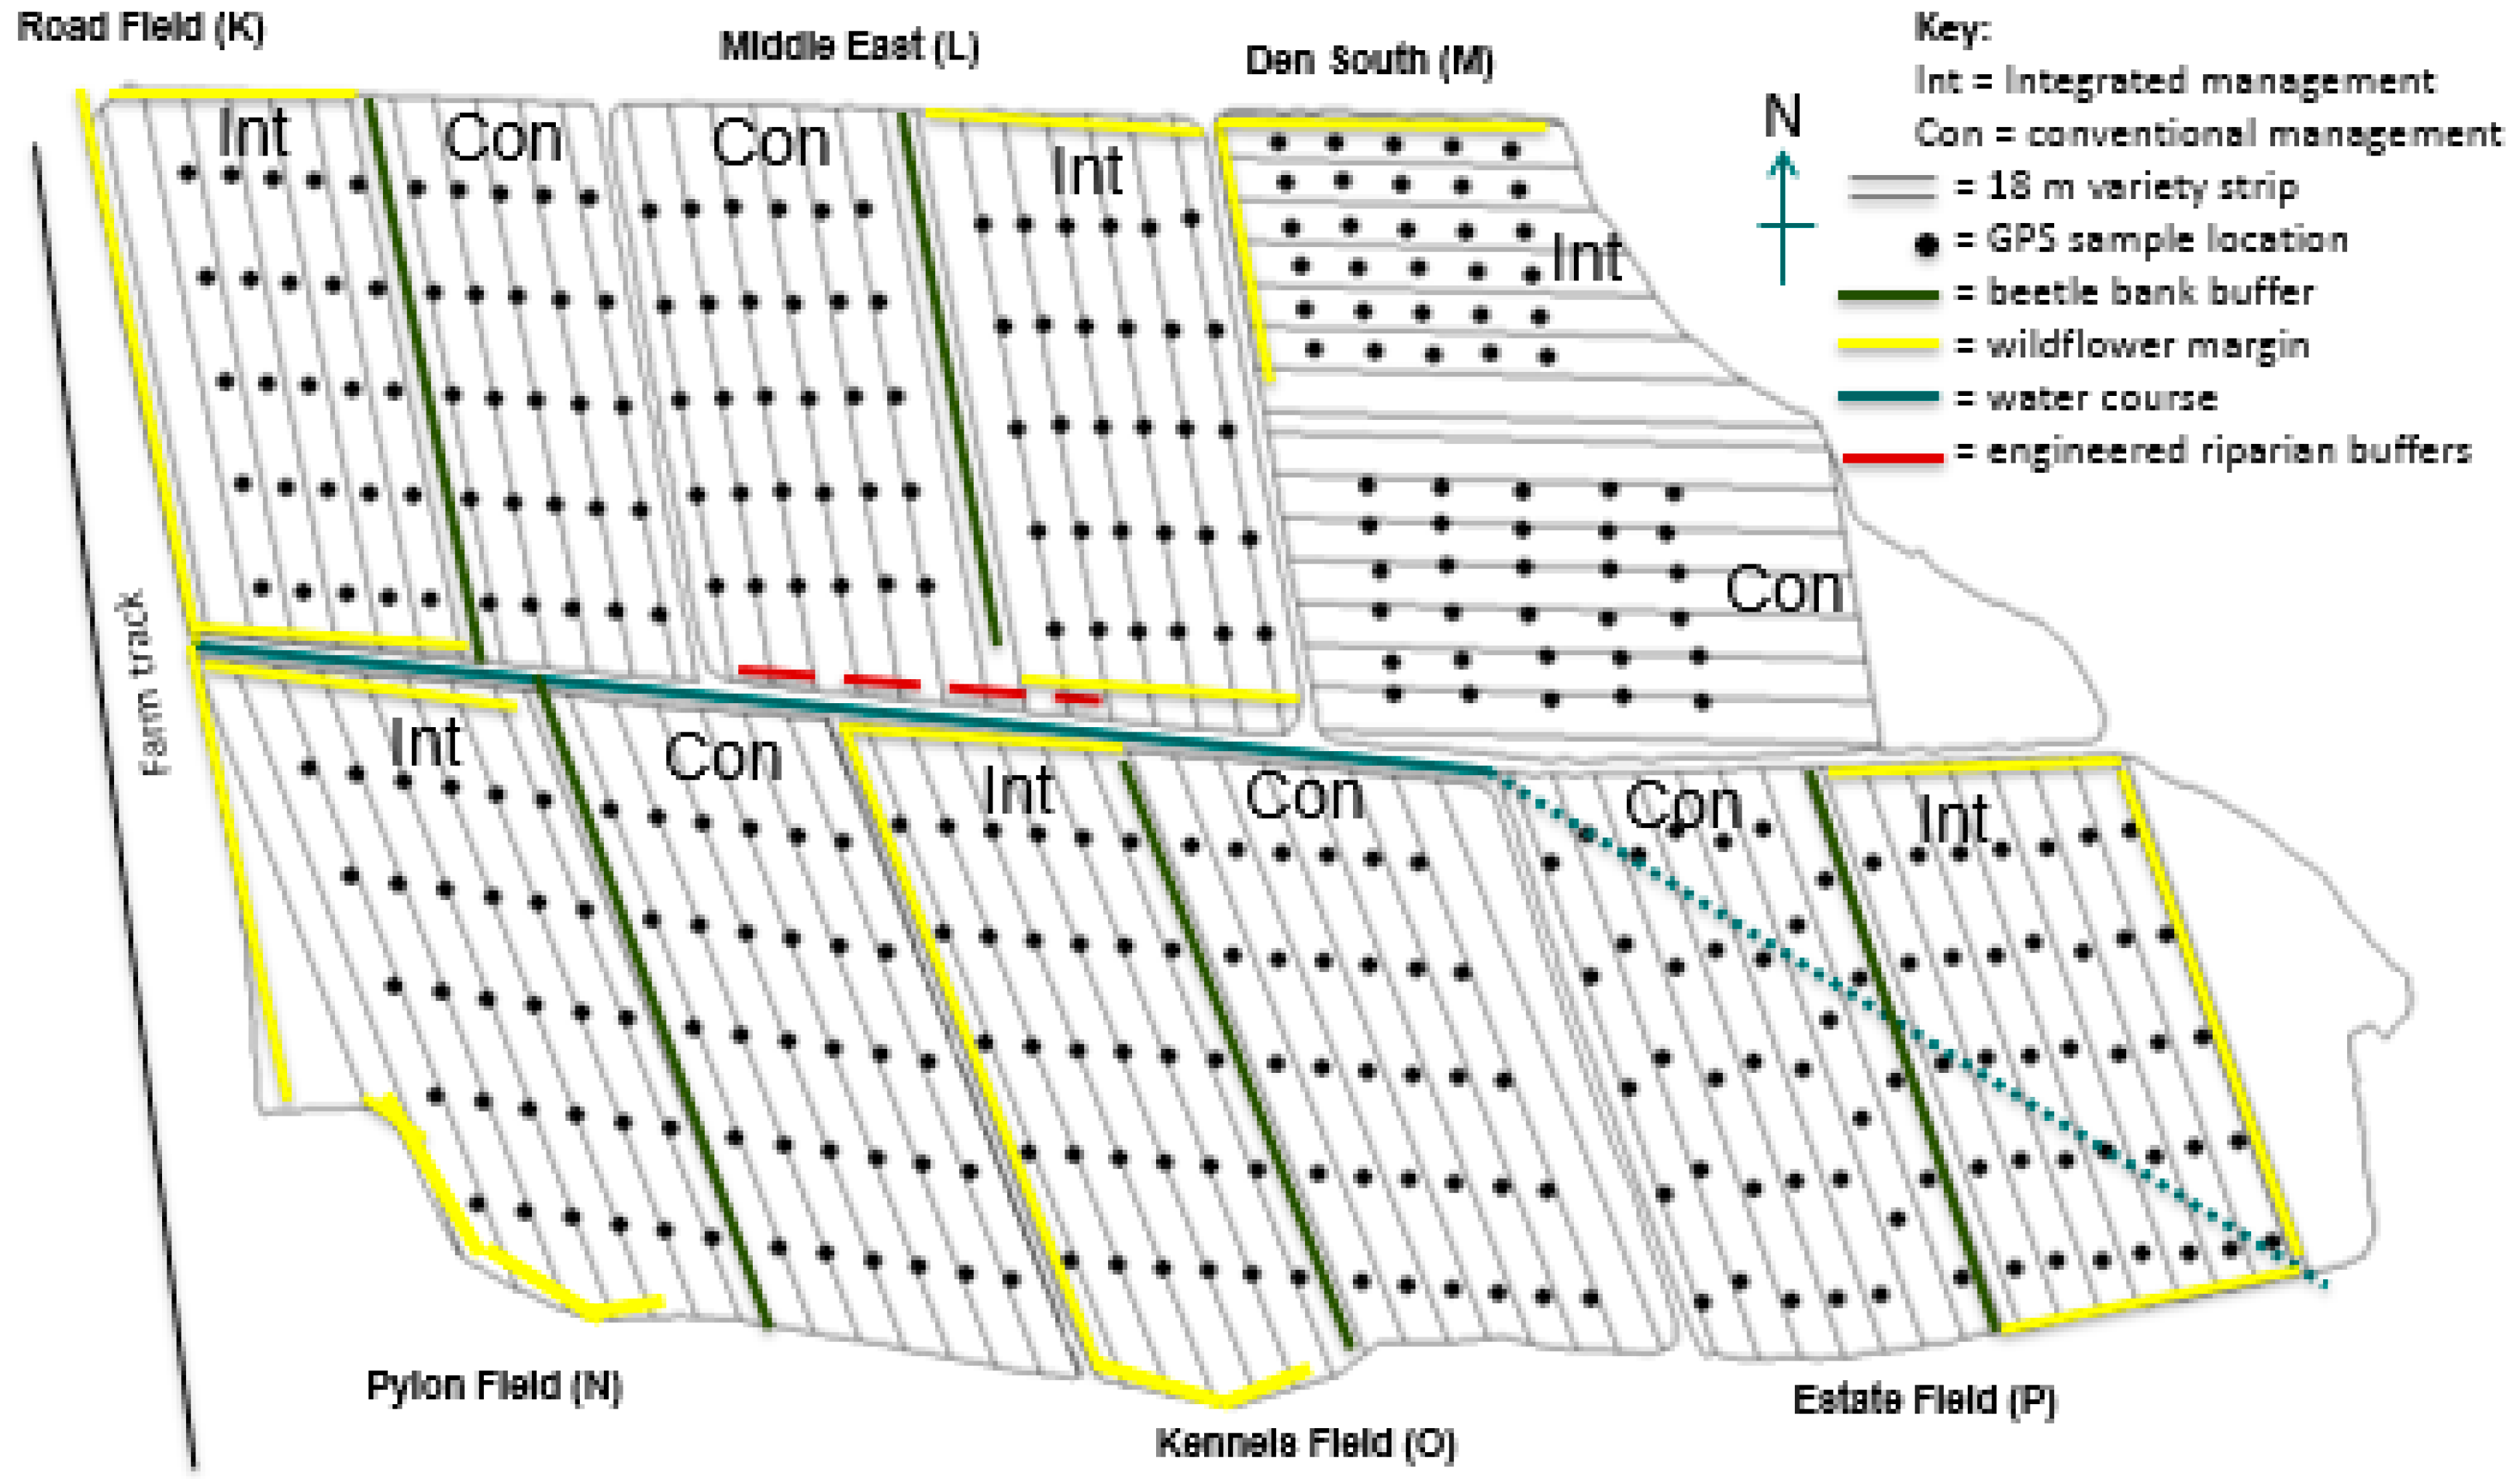
2.1. Field Site and Layout
2.2. Cropping Systems
2.3. Sampling Methods
2.3.1. Soil and Weed Seedbank
2.3.2. Emerged Weed and Crop Biomass Production
2.3.3. Crop Yields
2.3.4. Statistical Analysis
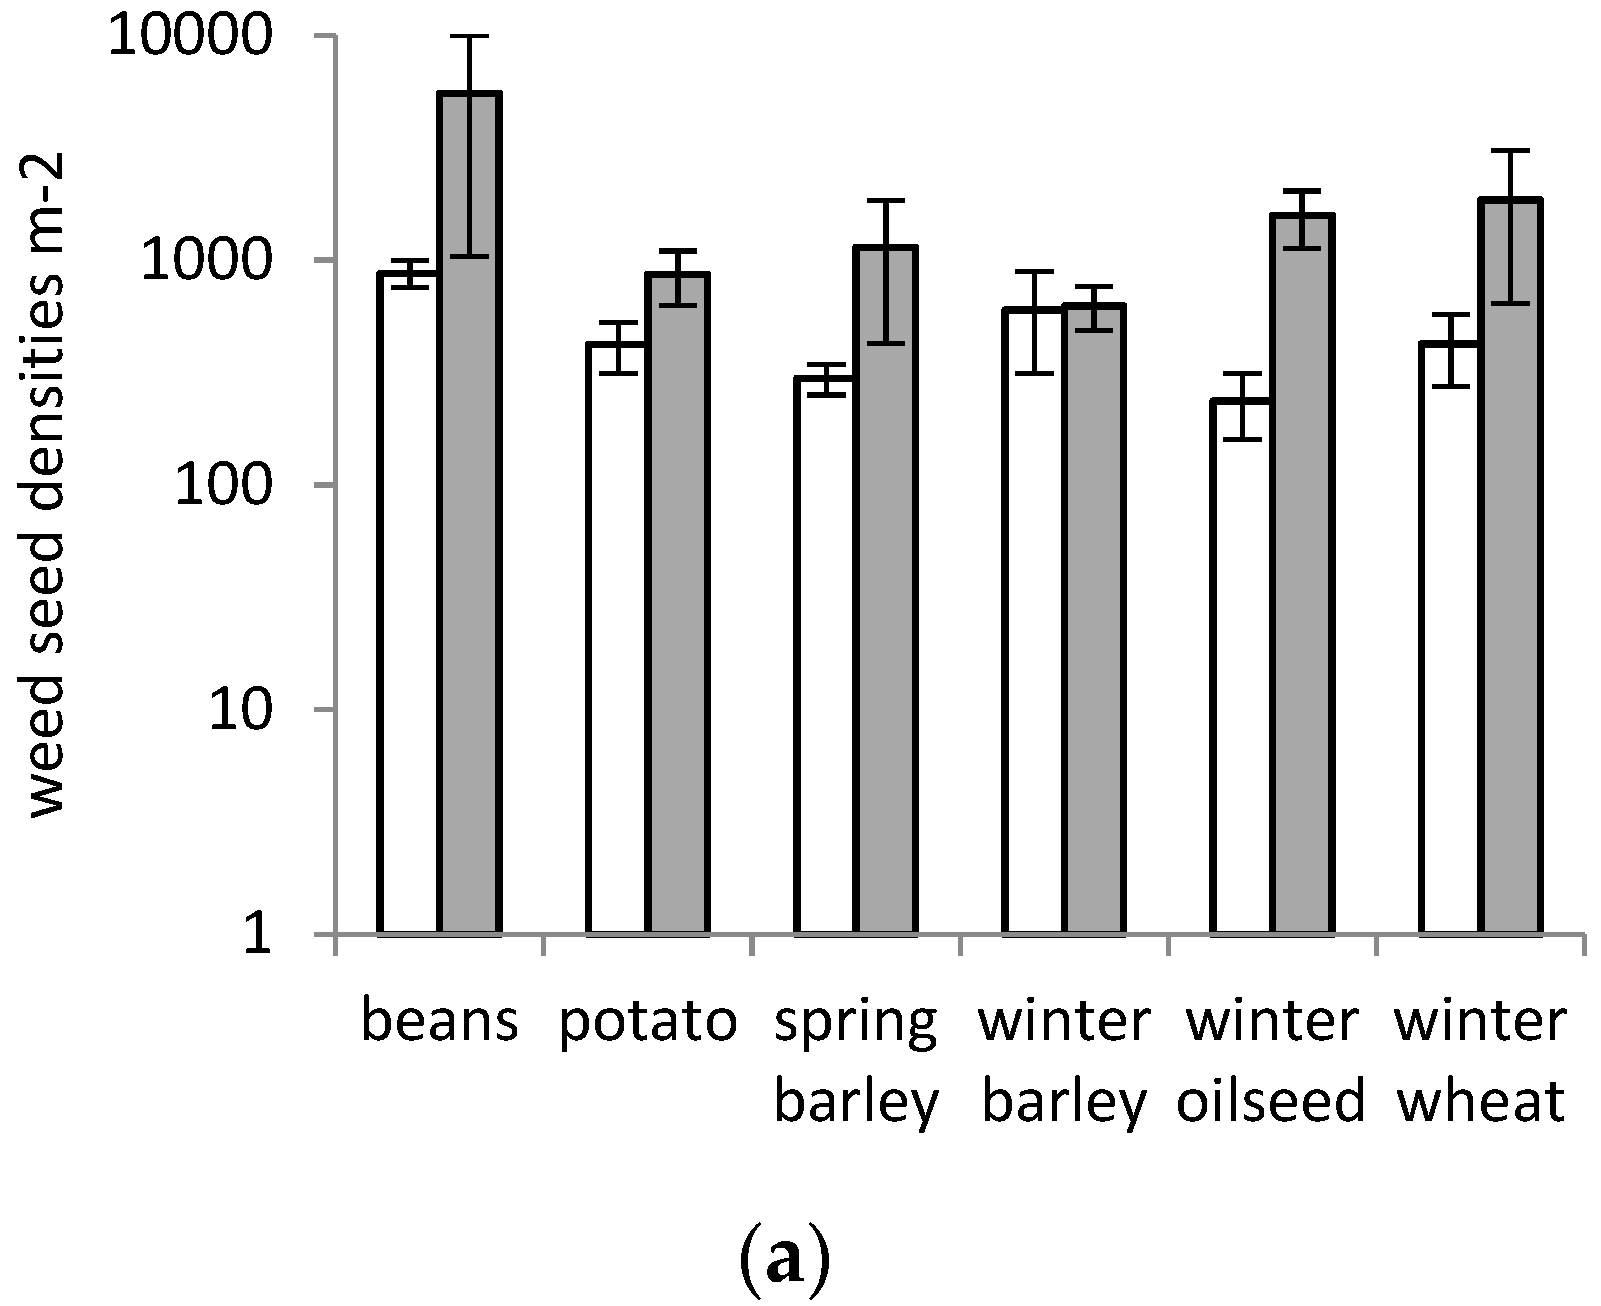
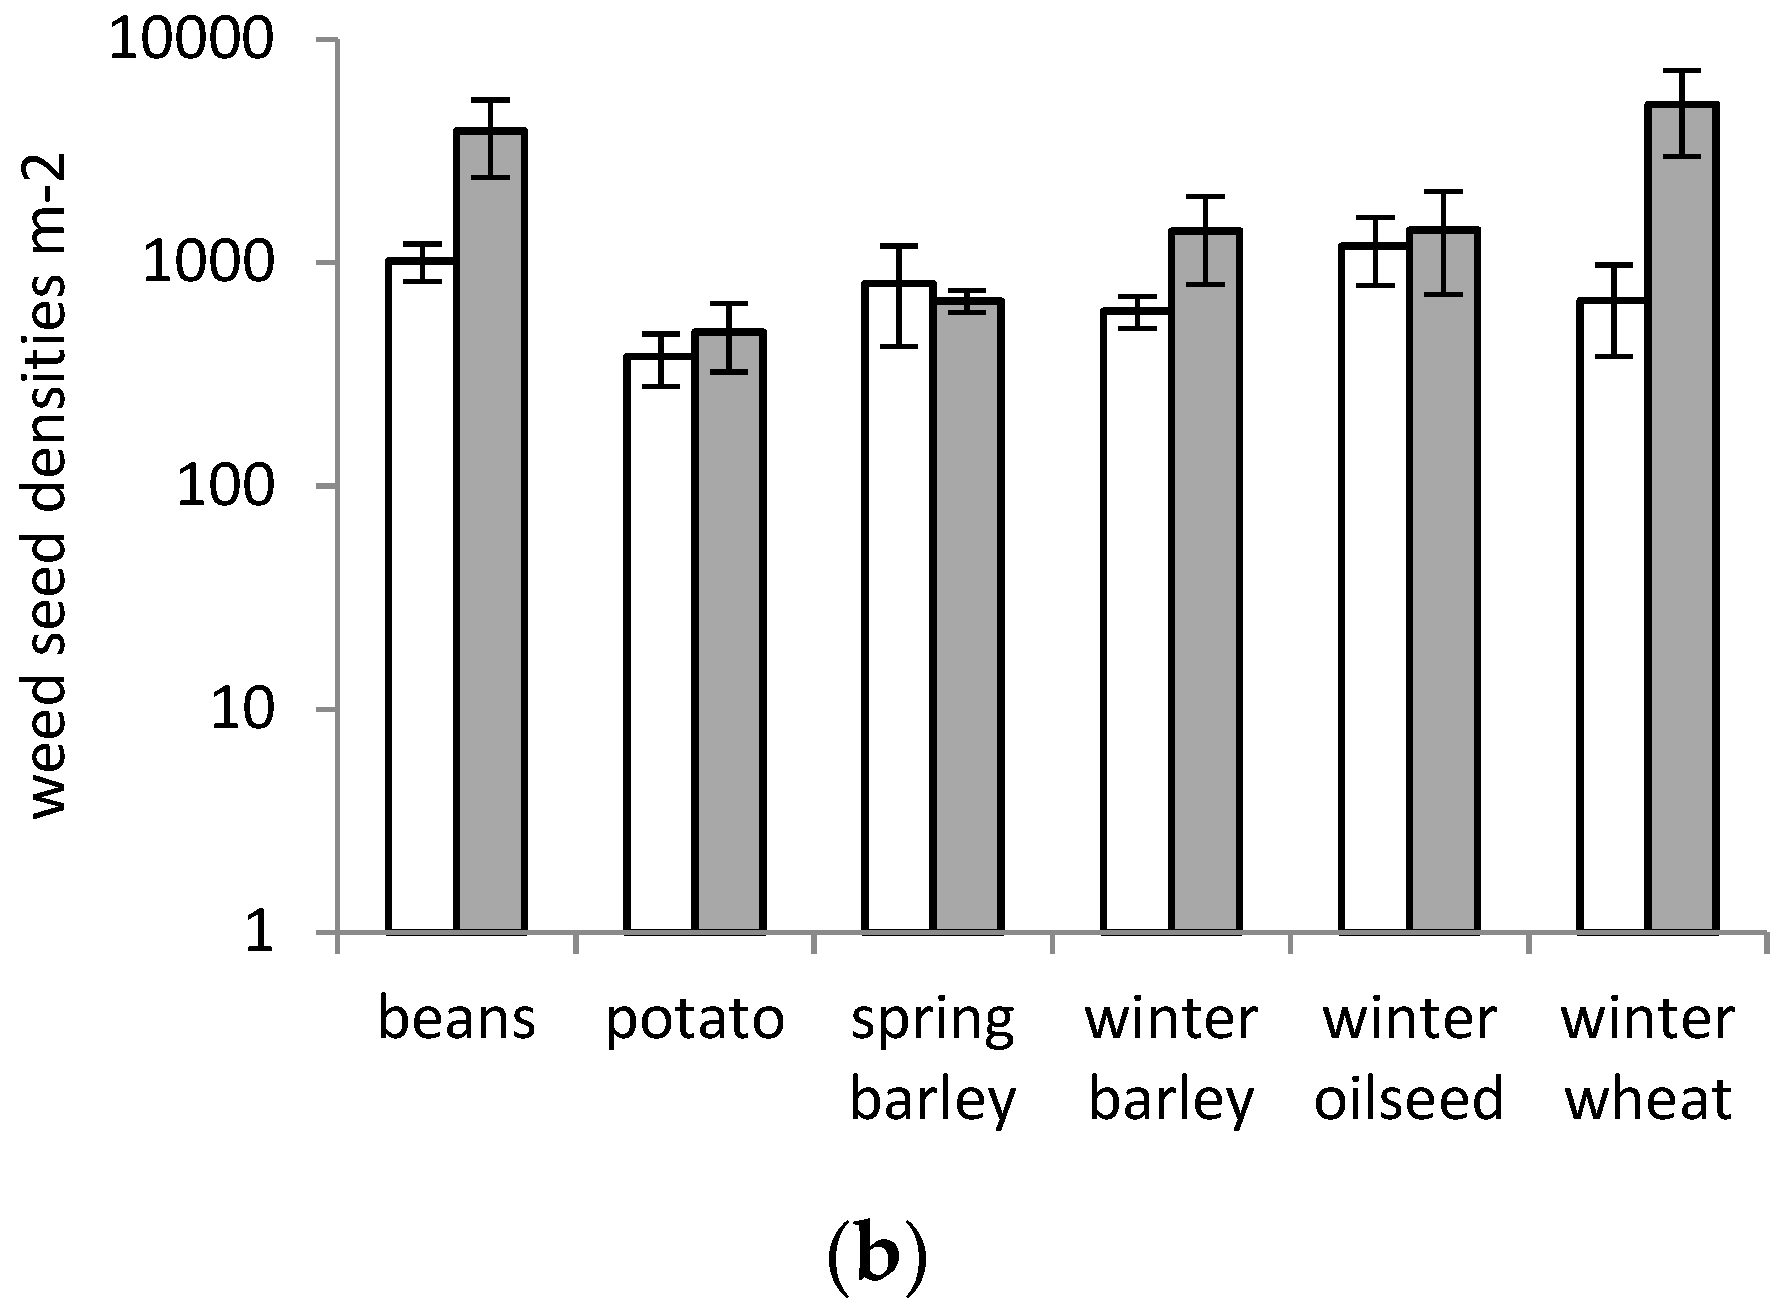
Soil and Weed Seedbanks
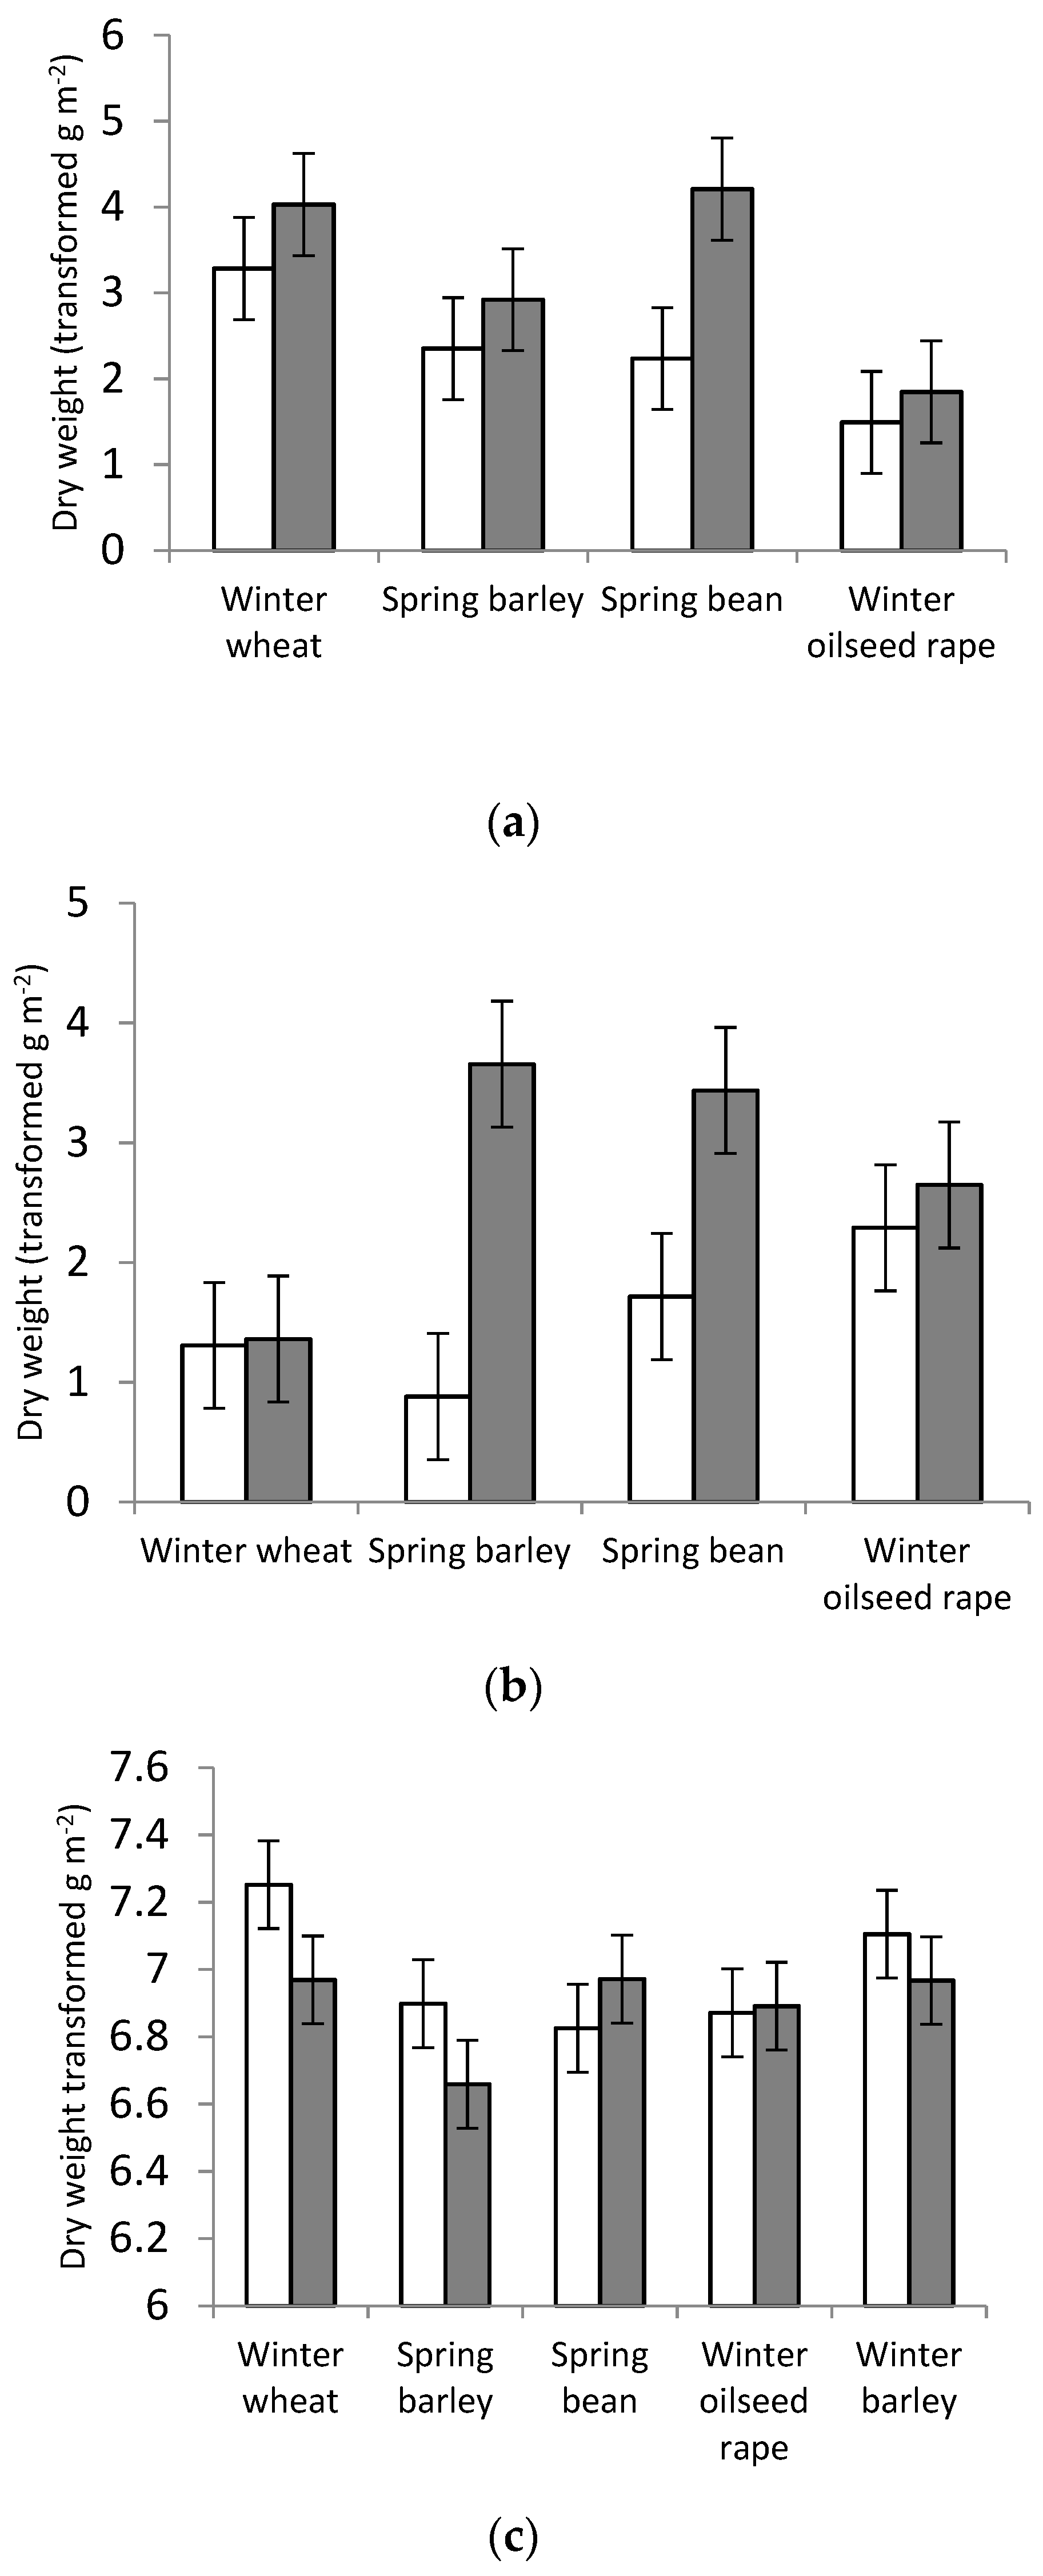
Emerged Weed and Crop Biomass Production
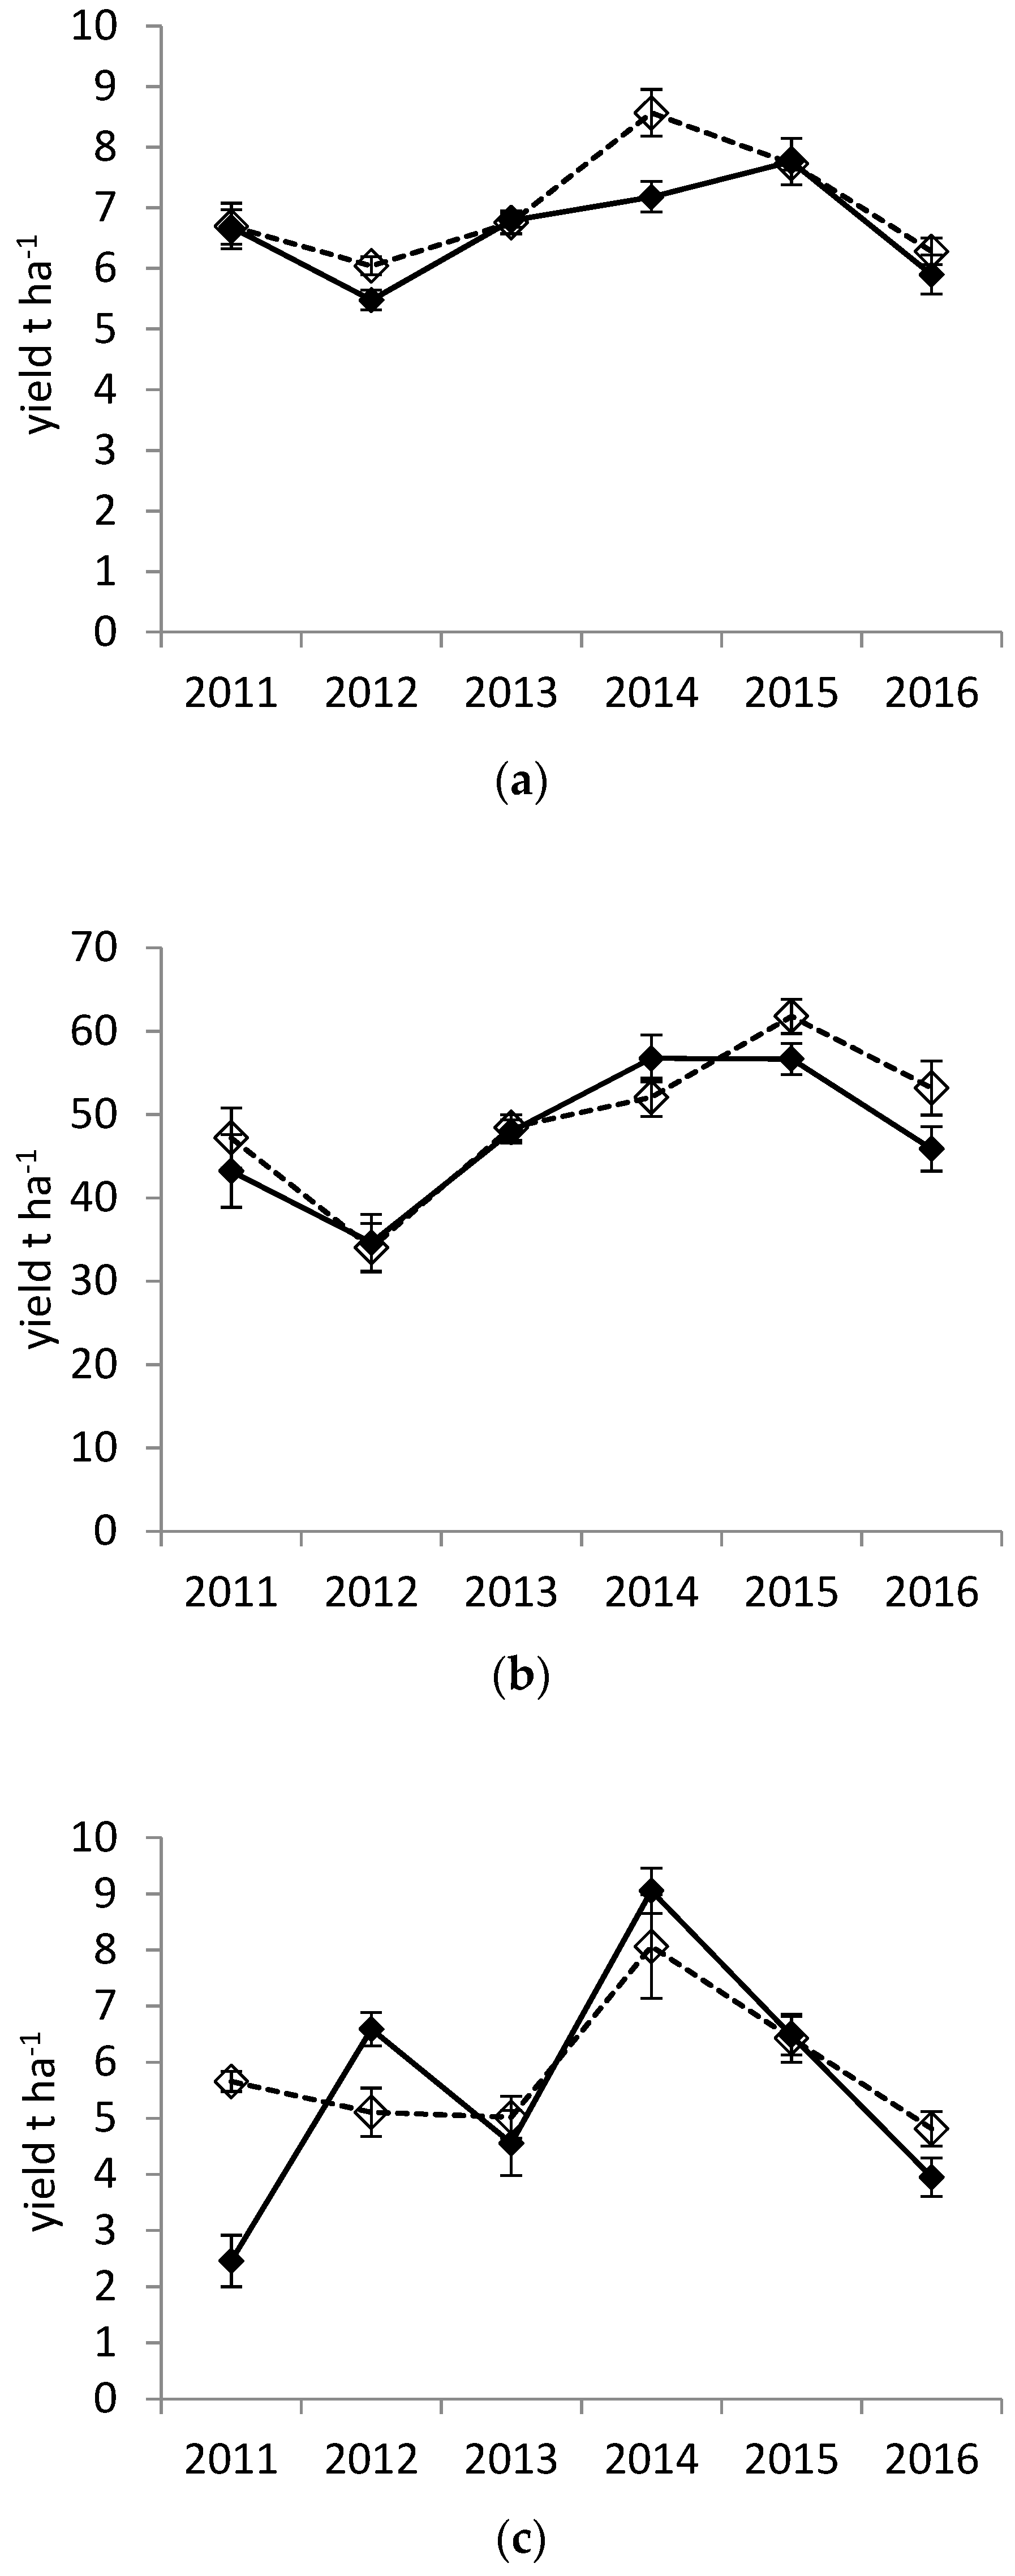
Yield
3. Results
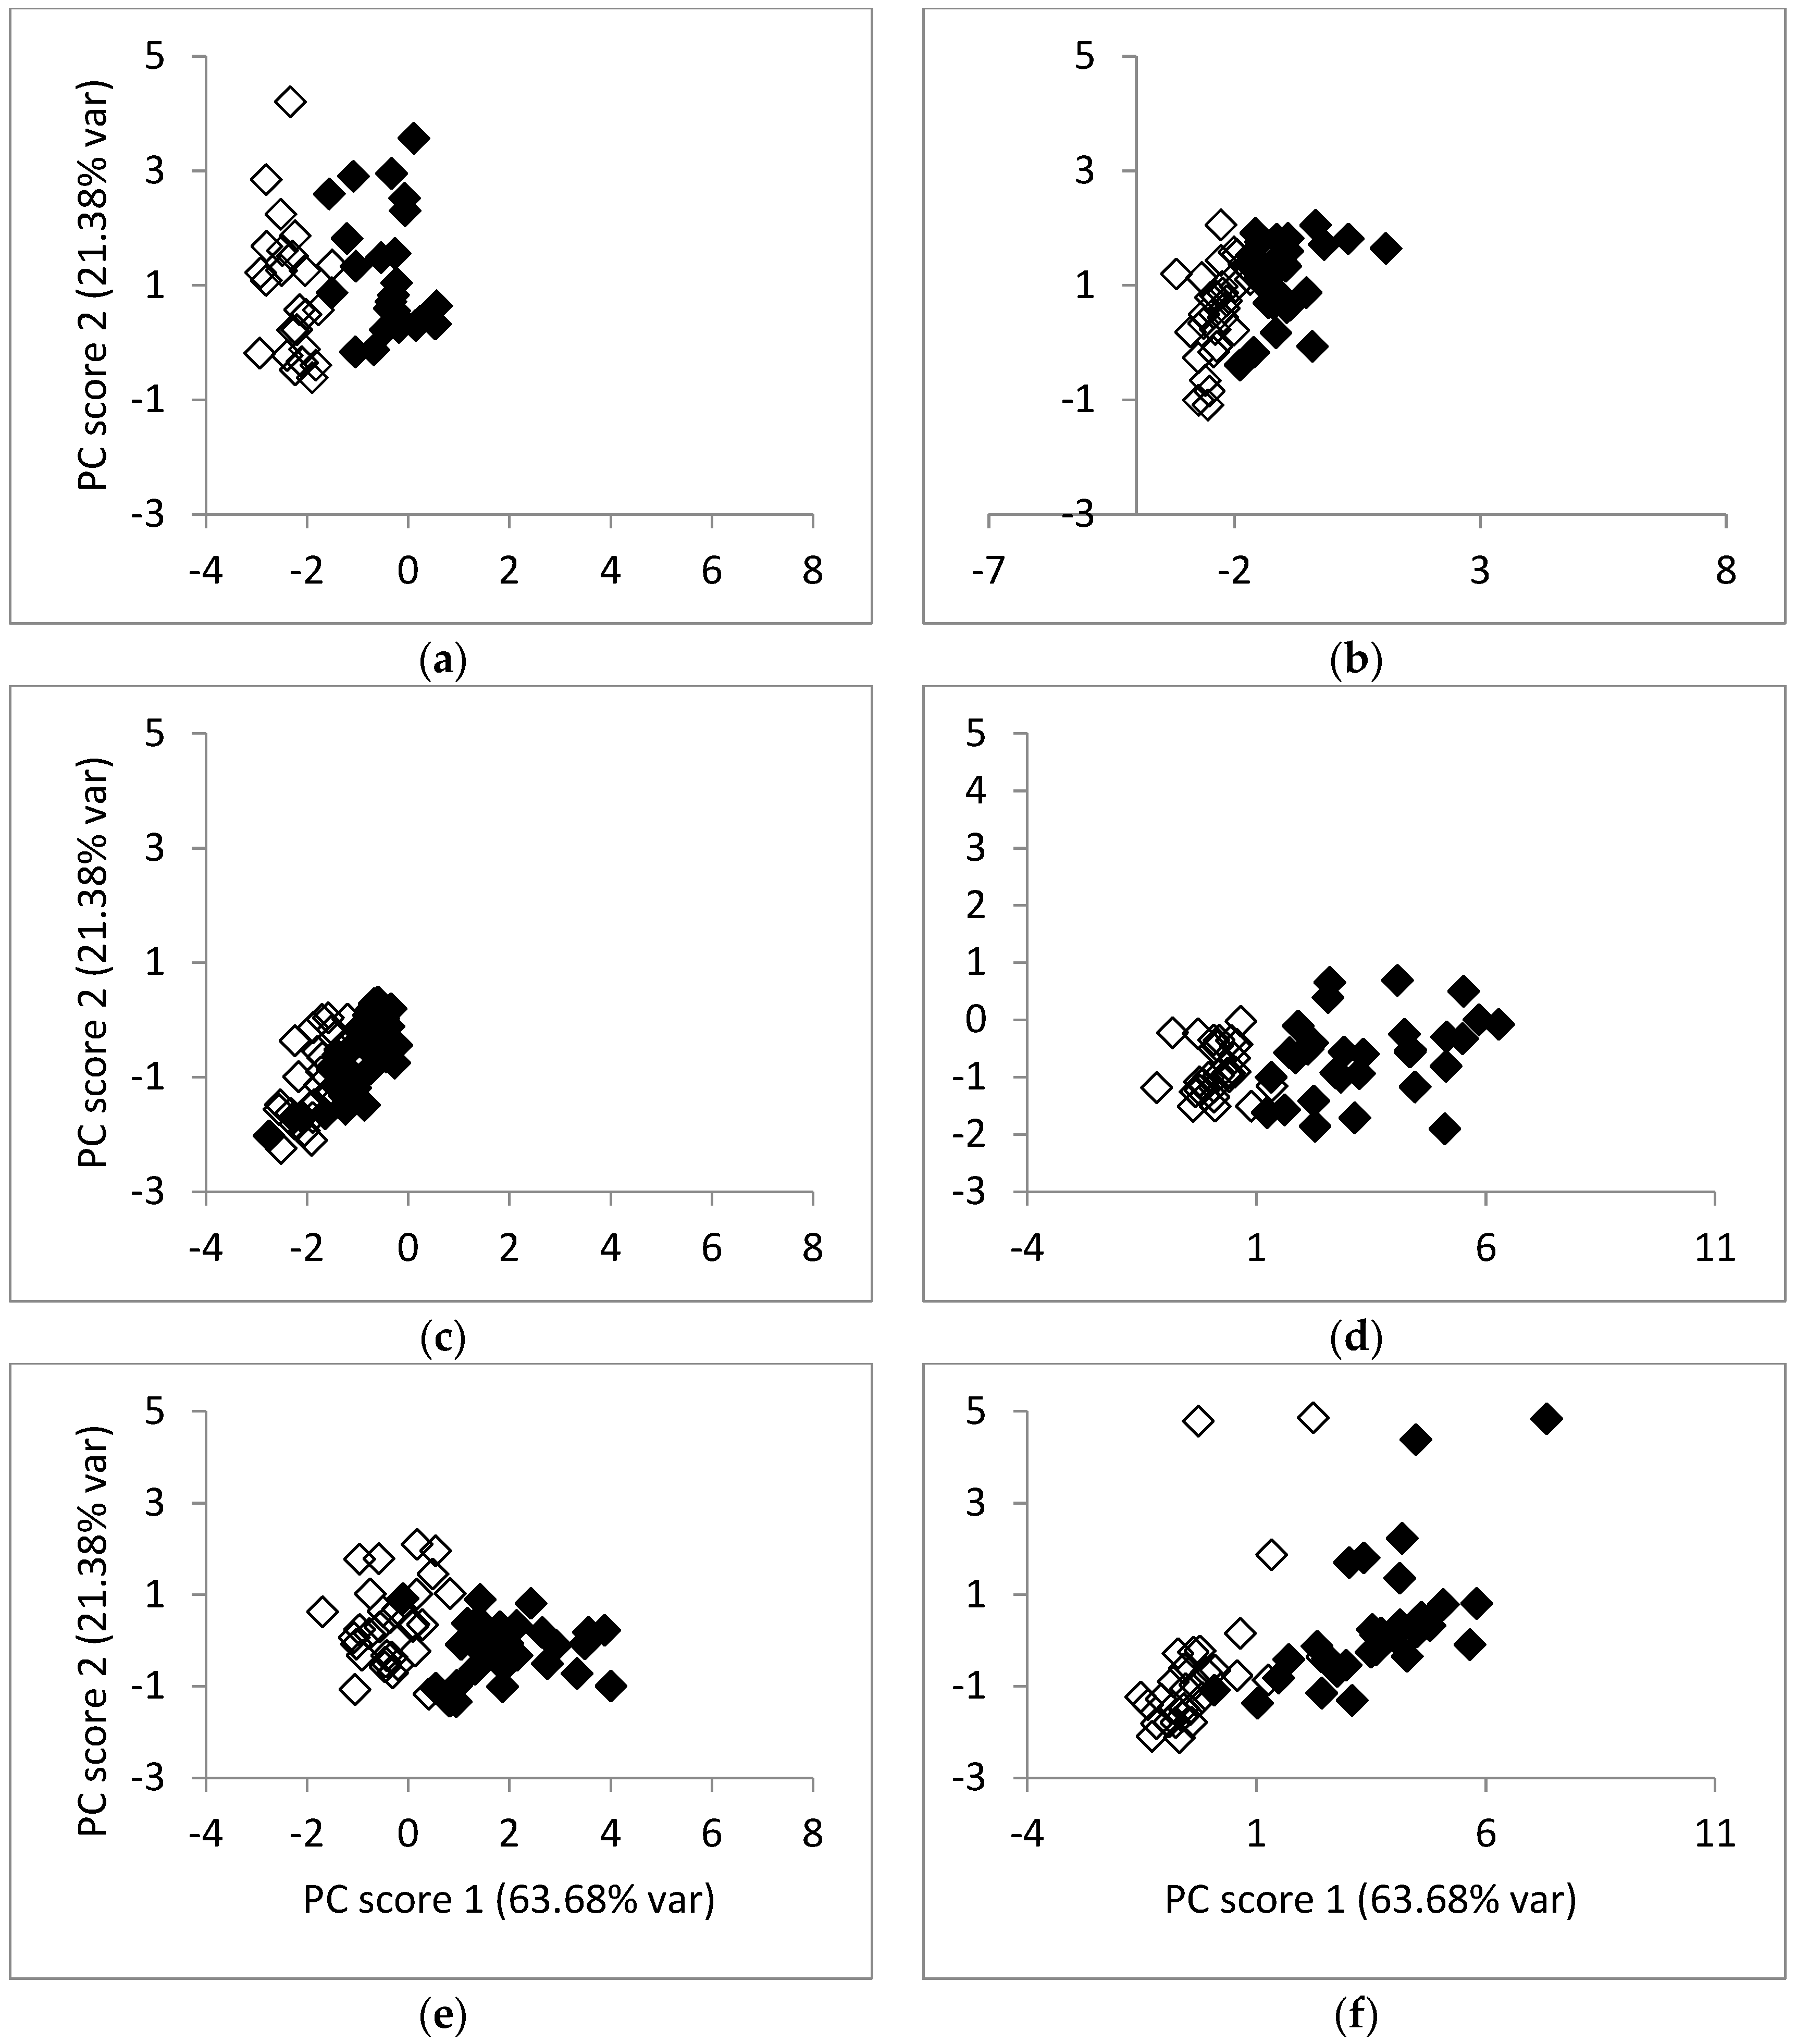
3.1. Arable Weed Seedbank
3.2. Soil
3.3. Weed and Crop Biomass
3.4. Crop Yields
4. Discussion
5. Conclusions
Author Contributions
Acknowledgments
Conflicts of Interest
References
- Bingham, I.J.; Karley, A.J.; White, P.J.; Thomas, W.T.B.; Russell, J.R. Analysis of improvements in nitrogen use efficiency associated with 75 years of barley breeding. Eur. J. Agron. 2012, 42, 49–58. [Google Scholar] [CrossRef]
- Knight, S.; Kightley, S.; Bingham, I.; Hoad, S.; Lang, B.; Philpott, H.; Stobart, R.; Barnes, T.J.A.; Ball, B. Desk Study to Evaluate Contributory Causes of the Current ‘Yield Plateau’ in Wheat and Oilseed Rape; HGCA Project Report 502; HGCA: Stoneleigh, UK, 2012; p. 226. [Google Scholar]
- Lipieca, J.; Arvidssonb, J.; Murerc, E. Experiences with the impact and prevention of subsoil compaction in the European Union. Soil Till. Res. 2003, 73, 15–29. [Google Scholar]
- Marshall, E.J.P.; Brown, V.K.; Boatman, N.D.; Lutman, P.J.W.; Squire, G.R.; Ward, L.K. The role of weeds in supporting biological diversity within crop fields. Weed Res. 2003, 43, 77–89. [Google Scholar] [CrossRef]
- Lewis, T.D.; Rowan, J.S.; Hawes, C.; McKenzie, B.M. Assessing the significance of soil erosion for arable weed seedbank diversity in agro-ecosystems. Prog. Phys. Geogr. 2013, 37, 622–641. [Google Scholar] [CrossRef]
- Valentine, T.A.; Hallett, P.D.; Binnie, K.; Young, M.W.; Squire, G.R.; Hawes, C.; Bengough, A.G. Soil strength and macropore volume limit root elongation rates in many UK agricultural soils. Ann. Bot. 2012, 110, 259–270. [Google Scholar] [CrossRef] [PubMed]
- Kleijn, D.; Sutherland, W.J. How effective are European agri-environment schemes in conserving and promoting biodiversity? J. App. Ecol. 2003, 40, 947–969. [Google Scholar] [CrossRef] [Green Version]
- Overview of CAP Reform 2014–2020. EC Agricultural Policy Perspectives Brief No. 5. 2013. Available online: https://eige.europa.eu/resources/05_en.pdf (accessed on 13 November 2017).
- Pretty, J.; Bharucha, Z.P. Sustainable intensification in agricultural systems. Ann. Bot. 2014, 114, 1571–1596. [Google Scholar] [CrossRef] [PubMed] [Green Version]
- McKenzie, B.M.; Bengough, A.G.; Hallett, P.D.; Thomas, W.T.B.; Forster, B.; McNicol, J.W. Deep rooting and drought screening of cereal crops: A novel field-based method and its application. Field Crops Res. 2009, 112, 165–171. [Google Scholar] [CrossRef]
- White, P.J.; George, T.S.; Gregory, P.J.; Bengough, A.G.; Hallett, P.D.; McKenzie, B.M. Matching roots to their environment. Ann. Bot. 2013, 112, 207–222. [Google Scholar] [CrossRef] [PubMed] [Green Version]
- Brooker, R.W.; Bennett, A.E.; Cong, W.-F.; Daniell, T.J.; George, T.S.; Hallett, P.D.; Hawes, C.; Iannetta, P.P.M.; Jones, H.G.; Karley, A.J.; et al. Improving intercropping: A synthesis of research in agronomy, plant physiology and ecology. New Phytol. 2015, 206, 107–117. [Google Scholar] [CrossRef] [PubMed] [Green Version]
- Tilman, D.; Cassman, K.G.; Matson, P.A.; Naylor, R.; Polasky, S. Agricultural sustainability and intensive production practices. Nature 2002, 418, 671–677. [Google Scholar] [CrossRef] [PubMed] [Green Version]
- Goulding, K.; Jarvis, S.; Whitmore, A. Optimising nutrient management for farm systems. Philos. Trans. R. Soc. B. 2008, 363, 667–680. [Google Scholar] [CrossRef] [PubMed]
- Hawes, C.; Begg, G.S.; Iannetta, P.; Karley, A.; Squire, G.R. A whole-systems approach for assessing measures to improve arable ecosystem sustainability. Ecosyst. Health Sustain. 2016, 2, e01252. [Google Scholar] [CrossRef]
- Hawes, C. Assessing the impact of management interventions in agroecological and conventional cropping systems using indicators of sustainability. In Agroecological Practices for Sustainable Agriculture: Principles, Applications, and Making the Transition; Wezel, A., Ed.; Imperial College Press: London, UK, 2017; pp. 229–262. [Google Scholar]
- Dungait, J.A.J.; Ghee, C.; Rowan, J.S.; McKenzie, B.L.; Hawes, C.; Dixon, E.R.; Paterson, E.; Hopkins, D.W. Microbial responses to the erosional redistribution of soil organic carbon in arable fields. Soil Biol. Biochem. 2013, 60, 195–201. [Google Scholar] [CrossRef]
- Hillier, J.; Hawes, C.; Squire, G.R.; Hilton, A.; Wale, S.; Smith, P. The Carbon Footprints of Food Crop Production. Int. J. Agric. Sustain. 2009, 7, 107–118. [Google Scholar] [CrossRef]
- Sparks, D.L. Methods of Soil Analysis Part 3: Chemical Methods. In Cation Exchange Capacity, and Exchange Coefficients; Soil Science Society of America/American Society of Agronomy: Madison, WI, USA, 1996. [Google Scholar]
- Brenchley, W.A.; Warington, K. The weed seed population of arable soil. II. Influence of crop, soil and methods of cultivation upon the relative abundance of viable seeds. J. Ecol. 1933, 21, 103–127. [Google Scholar] [CrossRef]
- Roberts, H.A. Studies on the weeds of vegetable crops. I. Initial effects of cropping on the weed seeds in the soil. J. Ecol. 1958, 46, 759–768. [Google Scholar]
- Roberts, H.A.; Chancellor, R.J. Seed banks of some arable soils in the English Midlands. Weed Res. 1986, 26, 251–257. [Google Scholar] [CrossRef]
- Heard, M.S.; Hawes, C.; Champion, G.T.; Clark, S.J.; Firbank, L.G.; Haughton, A.J.; Parish, A.M.; Perry, J.N.; Rothery, P.; Scott, R.J.; et al. Non-crop plants in fields with contrasting conventional and genetically modified herbicide-tolerant crops. 1. Main effects of treatments. Philos. Trans. R. Soc. Lond. B 2003, 358, 1819–1832. [Google Scholar]
- Debeljak, M.; Squire, G.R.; Demšar, D.; Young, M.; Džeroski, S. Relations between the oilseed rape volunteer seedbank, and soil factors, weed functional groups and geographical location in the UK. Ecol. Mod. 2008, 212, 138–146. [Google Scholar] [CrossRef]
- Hawes, C.; Squire, G.R.; Hallett, P.D.; Watson, C.A.; Young, M. Arable plant communities as indicators of farming practice. Agric. Ecosys. Environ. 2010, 138, 17–26. [Google Scholar] [CrossRef]
- Hawes, C.; Haughton, A.J.; Osborne, J.L.; Roy, D.B.; Clark, S.J.; Perry, J.N.; Rothery, P.; Bohan, D.A.; Brooks, D.R.; Champion, G.T.; et al. Responses of plant and invertebrate trophic groups to contrasting herbicide regimes in the Farm Scale Evaluations of genetically-modified herbicide-tolerant crops. Philos. Trans. R. Soc. Lond. B 2003, 358, 1899–1913. [Google Scholar]
- Altieri, M.A. The ecological role of biodiversity in agroecosystems. Agric. Ecosyst. Environ. 1999, 74, 19–31. [Google Scholar] [CrossRef] [Green Version]
- Mengel, K.; Hutsch, B.; Kane, Y. Nitrogen fertiliser application rates on cereal crops according to available mineral and organic soil nitrogen. Eur. J. Agron. 2006, 24, 343–348. [Google Scholar] [CrossRef]
- Kirchmann, H.; Kätterer, T.; Bergström, L. Nutrient Supply in Organic Agriculture—Plant Availability, Sources and Recycling. In Organic Crop Production—Ambitions and Limitations; Kirchmann, H., Bergström, L., Eds.; Springer: Dordrecht, The Netherlands, 2009; pp. 89–116. [Google Scholar]
- Burchill, W.; James, E.K.; Li, D.; Lanigan, G.J.; Williams, M.; Iannetta, P.P.M.; Humphreys, J. Comparisons of biological nitrogen fixation in association with white clover (Trifolium repens L.) under four fertiliser nitrogen inputs as measured using two 15N techniques. Plant Soil 2014, 385, 287–302. [Google Scholar] [CrossRef]
- Jones, L.; Clements, R.O. Development of a low input system for growing wheat (Triticum vulgare) in a permanent understorey of white clover (Trifolium repens). Ann. Appl. Biol. 2008, 123, 109–119. [Google Scholar] [CrossRef]
- Isbell, F.; Adler, P.R.; Eisenhauer, N.; Fornara, D.; Kimmel, K.; Kremen, C.; Letourneau, D.K.; Liebman, M.; Polley, H.W.; Quijas, S.; et al. Benefits of increasing plant diversity in sustainable agroecosystems. J. Ecol. 2017, 105, 871–879. [Google Scholar] [CrossRef] [Green Version]
- Andreasen, C.; Stryhn, H. Increasing weed flora in Danish arable fields and its importance for biodiversity. Weed Res. 2008, 48, 1–9. [Google Scholar] [CrossRef]
- Storkey, J.; Westbury, D.B. Managing arable weeds for biodiversity. Pest Manag. Sci. 2007, 63, 517–523. [Google Scholar] [CrossRef] [PubMed]
- Bohan, D.A.; Powers, S.J.; Champion, G.; Haughton, A.J.; Hawes, C.; Squire, G.R.; Cussans, J.; Mertens, S.K. Modelling rotations: Can crop sequences explain arable weed seedbank abundance? Weed Res. 2011, 51, 422–432. [Google Scholar] [CrossRef]
- Zimdahl, R.L. Weed-Crop Competition: A Review, 2nd ed.; Blackwell Publishing: Oxford, UK, 2004; p. 219. ISBN 0-8138-0279-2. [Google Scholar]
- Morris, N.L.; Miller, P.C.H.; Orson, J.H.; Froud-Williams, R.J. The adoption of non-inversion tillage systems in the United Kingdom and the agronomic impact on soil, crops and the environment—A review. Soil Till. Res. 2010, 108, 1–15. [Google Scholar] [CrossRef]
- Holland, J.M. The environmental consequences of adopting conservation tillage in Europe: Reviewing the evidence. Agric. Ecosys. Environ. 2004, 103, 1–25. [Google Scholar] [CrossRef]
- Bond, W.; Grundy, A.C. Non-chemical weed management in organic farming systems. Weed Res. 2001, 41, 383–405. [Google Scholar] [CrossRef]
- Abdul-Salam, Y.; Hawes, C.; Roberts, D.; Young, M. The economics of conventional and integrated crop production systems in the context of farmer participation in carbon trading markets—A case study of Scotland. Int. J. Sustain. 2018, in press. [Google Scholar]


| Potato | Winter Wheat | Beans | Spring Barley | Winter Oilseed | Winter Barley | |||||||
|---|---|---|---|---|---|---|---|---|---|---|---|---|
| conv | integ | conv | integ | conv | integ | conv | integ | conv | integ | conv | integ | |
| Cultivation timing | Nov-Mar | Mar-Apr | Oct | Oct | Feb-Mar | Mar | Feb-Apr | Mar-Apr | Aug-Sep | Aug-Sep | Aug-Sep | Aug-Sep |
| Cultivation method | conv | conv | conv | conv | conv | non-inv | conv | non-inv | conv | non-inv | conv | non-inv |
| Sowing/planting 1 | Apr | Apr | Oct | Oct | Mar-Apr | Mar-Apr | Mar-Apr | Mar-Apr | Aug-Sep | Aug-Sep | Sep | Sep |
| Sowing/planting 2 | clover undersow (Apr) | oil radish cover (Aug) | ||||||||||
| Fertiliser 1 product | compost | compost | compost | compost | compost | compost | ||||||
| rate (kg/ha) | 3500 | 3500 | 3500 | 3500 | 3500 | 3500 | ||||||
| Fertiliser 2 product | 14-14-21 | 14-14-21 | 30-0-0 | 30-0-0 | 0-20-30 | 0-20-30 | 30-0-0 | 30-0-0 | 17-17-17 | 17-17-17 | 0-20-30 | 0-20-30 |
| rate (kg/ha) | 1400 | 1050 | 300 | 225 | 200 | 150 | 380 | 285 | 170 | 120 | 300 | 225 |
| Fertiliser 3 product | 30-0-0 | 30-0-0 | 0-0-60 | 0-0-60 | 30-0-0 | 30-0-0 | 30-0-0 | 30-0-0 | ||||
| rate (kg/ha) | 300 | 225 | 160 | 120 | 300 | 230 | 300 | 225 | ||||
| Fertiliser 4 product | 30-0-0 | 30-0-0 | 30-0-0 | 30-0-0 | 30-0-0 | 30-0-0 | ||||||
| rate (kg/ha) | 300 | 225 | 300 | 230 | 300 | 225 | ||||||
| Herbicide (pre-em) product | Liberator | Liberator | Katamaran turbo | Katamaran turbo | Liberator | Liberator | ||||||
| rate (per ha) | 0.6 L | 0.3 L | 2.5 L | 1.25 L | 0.6 L | 0.3 L | ||||||
| Herbicide (post-em) product | Stomp, Artist, Reglone, Shark | Reglone, Shark | Traton SX, Charge | Traton SX, Charge | Stomp | Stomp | Traton SX, Charge | Headland spruce | Panarex | Panarex | Traton SX, Charge | Tomahawk Charge |
| rate (per ha) | 2.9 L, 2.5 kg, 2 L, 0.3 L | 2 L, 0.3 L | 0.04 kg, 1 L | 0.04 kg, 1 L | 3 L | 1.65 L | 30 g, 1 L | 4.5 L | 1 L | 1 L | 0.045 kg, 1 L | 0.045 kg, 1 L |
| Harvest | Sep-Oct | Sep-Oct | Sep (straw baled) | Sep (straw chopped and incorporated) | Sep-Oct | Sep-Oct | Aug-Sep (straw baled) | Aug-Sep (straw chopped and incorporated) | Aug | Aug | Aug (straw baled) | Aug (straw chopped and incorporated) |
| %C | %N | Loss on Ignition (450 °C) | P (mg kg−1) | K (mg kg−1) | pH | ||
|---|---|---|---|---|---|---|---|
| Road (K) | conventional | 1.76 | 0.16 | 3.9 | 87.72 | 140.1 | 5.44 |
| integrated | 2.58 | 0.22 | 5.4 | 90.68 | 234.4 | 5.68 | |
| Mid-east (L) | conventional | 1.74 | 0.16 | 3.9 | 77.27 | 134.0 | 5.45 |
| integrated | 2.31 | 0.19 | 4.4 | 77.99 | 203.3 | 5.68 | |
| Den South (M) | conventional | 2.49 | 0.20 | 5.7 | 46.97 | 94.68 | 5.35 |
| integrated | 2.71 | 0.24 | 5.9 | 53.81 | 149.8 | 5.36 | |
| Pylon (N) | conventional | 3.15 | 0.28 | 7.2 | 49.28 | 209.7 | 5.46 |
| integrated | 4.54 | 0.41 | 10.1 | 62.86 | 467.6 | 5.71 | |
| Kennels (O) | conventional | 2.80 | 0.24 | 6.3 | 73.23 | 152.7 | 5.53 |
| integrated | 3.87 | 0.33 | 8.5 | 69.44 | 401.6 | 5.64 | |
| Estate (P) | conventional | 2.88 | 0.25 | 6.8 | 47.60 | 190.0 | 5.53 |
| integrated | 4.33 | 0.39 | 9.8 | 79.14 | 507.7 | 5.82 |
| Dicot | Monocot | Stems | Pod/Ear | |||||
|---|---|---|---|---|---|---|---|---|
| conv | integ | conv | integ | conv | integ | conv | integ | |
| Potato | 0 | 13.45 | 0 | 2.52 | n/a | n/a | n/a | n/a |
| Winter wheat | 0.7 | 0.6 | 23.8 | 46.1 | 547.4 | 460.2 | 781.6 | 593.2 |
| Beans | 2.8 | 26.1 | 3.9 | 36.4 | 324.3 | 359.5 | 499.1 | 584.6 |
| Spring barley | 0.4 | 21.2 | 4.9 | 12.9 | 524.5 | 404.2 | 564.8 | 527.4 |
| Winter oilseed | 3.1 | 12.7 | 0.6 | 1.1 | 657.4 | 673.8 | 501.8 | 530 |
| Winter barley | 0 | 0 | 0 | 0.5 | 835.3 | 848.6 | 620.2 | 504.2 |
| Crop | Variety | Integrated | Conventional | S.E. | F pr var | F pr tmt | F pr inter |
|---|---|---|---|---|---|---|---|
| Field beans | Maris Bead | 6.62 | 6.16 | 0.99 | 0.12 | 0.65 | 0.78 |
| Boxer | 6.22 | 5.53 | |||||
| Fanfare | 6.04 | 5.66 | |||||
| Fuego | 5.97 | 6.20 | |||||
| Pyramid | 5.28 | 6.00 | |||||
| Babylon | 5.09 | 5.38 | |||||
| Ben | 4.92 | 5.58 | |||||
| Tattoo | 3.67 | 5.35 | |||||
| Potatoes | Lady Balfour | 54.29 | 53.74 | 3.76 | <0.001 | 0.31 | 0.7 |
| Maris Piper | 48.33 | 49.55 | |||||
| Vales Sovereign | 47.80 | 51.45 | |||||
| Cabaret | 45.54 | 50.12 | |||||
| Mayan Gold | 37.69 | 39.70 | |||||
| Spring barley | Concerto | 7.38 | 7.34 | 0.41 | <0.001 | 0.16 | 0.58 |
| Waggon | 6.96 | 7.29 | |||||
| Westminster | 6.50 | 6.95 | |||||
| Optic | 6.34 | 6.71 | |||||
| Variety mixture | 6.28 | 6.99 | |||||
| Winter barley | Retriever | 8.69 | 9.84 | 0.72 | <0.001 | 0.06 | 0.22 |
| Sequel | 8.26 | 9.38 | |||||
| Variety mixture | 8.12 | 9.02 | |||||
| Saffron | 7.58 | 9.59 | |||||
| Cassata | 6.96 | 8.86 | |||||
| Winter wheat | Viscount | 10.38 | 6.83 | 0.79 | 0.04 | 0.001 | 0.004 |
| Istabraq | 9.63 | 7.26 | |||||
| Consort | 9.51 | 7.04 | |||||
| Beluga | 9.29 | 8.08 | |||||
| Alchemy | 8.85 | 6.93 | |||||
| Winter rape | Catana | 3.46 | 3.95 | 0.48 | 0.001 | 0.30 | 0.96 |
| Flash | 2.97 | 3.45 | |||||
| NK Grace | 2.85 | 3.29 | |||||
| Excalibur | 2.73 | 3.10 | |||||
| Lioness | 2.65 | 3.35 | |||||
| Cracker | 2.19 | 3.03 |
© 2018 by the authors. Licensee MDPI, Basel, Switzerland. This article is an open access article distributed under the terms and conditions of the Creative Commons Attribution (CC BY) license (http://creativecommons.org/licenses/by/4.0/).
Share and Cite
Hawes, C.; Alexander, C.J.; Begg, G.S.; Iannetta, P.P.M.; Karley, A.J.; Squire, G.R.; Young, M. Plant Responses to an Integrated Cropping System Designed to Maintain Yield Whilst Enhancing Soil Properties and Biodiversity. Agronomy 2018, 8, 229. https://doi.org/10.3390/agronomy8100229
Hawes C, Alexander CJ, Begg GS, Iannetta PPM, Karley AJ, Squire GR, Young M. Plant Responses to an Integrated Cropping System Designed to Maintain Yield Whilst Enhancing Soil Properties and Biodiversity. Agronomy. 2018; 8(10):229. https://doi.org/10.3390/agronomy8100229
Chicago/Turabian StyleHawes, Cathy, Colin J. Alexander, Graham S. Begg, Pietro P. M. Iannetta, Alison J. Karley, Geoffrey R. Squire, and Mark Young. 2018. "Plant Responses to an Integrated Cropping System Designed to Maintain Yield Whilst Enhancing Soil Properties and Biodiversity" Agronomy 8, no. 10: 229. https://doi.org/10.3390/agronomy8100229