1. Introduction
Boron (B) is an essential micronutrient needed for normal plant growth and development. It is involved in many plant processes such as sugar transport, cell wall synthesis, lignification, meristematic tissue cell division, petal and leaf bud formation, cell wall structure integrity, sugar and hydrocarbon metabolism and their transport, ribose nucleic acid (RNA) metabolism, respiration, indole acetic acid (IAA) metabolism, cytokinin production and transfer, phenol metabolism, nitrogen fixation, pollen germination, pollen tube formation and seed formation [
1,
2,
3,
4]. Intensive cropping systems and the use of high yielding hybrids has resulted in depletion of soil micronutrients [
5]. Globally, B deficiency has been recognized as the second most important micronutrient constraint in crops after zinc (Zn) [
1]. In the USA, B deficiency was the most widespread among micronutrients [
6,
7]. In soil, concentrations of total B typically ranged from 20 to 200 mg·B·kg
−1, but generally the availability to plants is less than 5%–10% [
8]. Boron requirements may vary by plant type, but the range for soil solution B concentration between deficiency and toxicity is smaller than other nutrient elements [
9]. Corn has a low requirement for B, but can be very sensitive to excess B. Several factors affect B uptake by plants including soil type (texture, pH, organic matter content), B concentration, moisture, and plant species. The interaction of B with other nutrients (N, P, K, Ca, Mg, Al, and Zn) can be synergistic or antagonistic which can influence B availability to plants [
2]. The bioavailability of B reduces as soil dries due to low rainfall or limited irrigation because of decreased B mobility in soil by mass flow to plant roots [
1,
9]. Boron is absorbed by plants as boric acid, which is easily leached in soils [
10]. Boron is relatively immobile in a corn plant and its availability is essential at all growth stages, particularly during fruit and seed development [
2]. Boron deficiency in corn was first observed during the 1960s in the United States [
11] and B applications showed more than a 10% increase in yield on coarse textured soils [
12]. The B sufficiency range for corn was from 4 to 25 ppm in the ear leaf [
13]. In corn, B deficiency caused barren ears and blank stalks at concentrations below 0.05 ppm which resulted in lower yields [
13]. Woodruff
et al. reported that B interacted with N, K and lime while B fertilization at 2.24 kg·ha
−1 was necessary for preventing a reduction in corn yields when higher K fertilizer rates were applied in South Carolina [
12]. In B deficient soils, a B application increased plant B concentration which helped to improve the quality of corn fodder for animals without causing any significant increase in dry matter yield [
14]. On a calcareous soil, B interacted with zinc (Zn) and antagonistically affected nutrient concentration and synergistically affected growth [
15]. Minimum amounts of B accumulated in corn during initial growth stages and maximum accumulation was observed after 100 days of seedling emergence in two corn hybrids in Brazil while the total amount of B required to produce one ton of corn was 0.9 g [
16]. However, B decreased P uptake and dry weight of corn genotypes [
17], while a Ca application antagonized shoot B concentrations of four corn hybrids [
18]. Boron applied with high Zn levels resulted in higher NPK concentrations in corn grains [
19].
Foliar nutrient sprays may be an effective way to correct micronutrient deficiencies, which sometimes results in higher yields and crop quality [
20,
21]. Advantages of a foliar application compared to a soil application included rapid plant response, increased convenience and effective placement [
22]. The reported negative effects of foliar applications include leaf necrosis due to the direct effects of the foliar salts, which reduce effective leaf area and photosynthate production [
23]. Boron can be soil applied (broadcast or banded) or foliar applied [
5]. An in-row application of B has showed higher plant uptake compared to foliar application while both of these application methods were more effective than a broadcast soil application [
24]. In some southeastern states, foliar spray applications increased tissue B concentration compared to a broadcast soil application [
25]. In contrast, foliar applied B at high rates have caused severe toxicity to corn compared to soil applied rates [
26]. In
Vigna radiata, soil applied B had a greater impact on dry matter yield whereas a foliar application increased grain yield [
5]. In Missouri, foliar applied B at 1.12 kg·ha
−1 increased the number of soybean (
Glycine max) branches per plant and the formation of pods on branches [
27]. A pre-plant soil application of B, at 3 kg·ha
−1, had a greater effect on corn growth and average dry matter accumulation, but had lower yields compare to the non-treated control [
28]. In a greenhouse experiment, corn plants showed injury to soil solution B concentrations of 20 mg·B·L
−1 [
29].
Boron has also helped to reduce disease severity in some crops because of the effect that B has on plant metabolism, cell membranes and cell wall structure [
30,
31,
32,
33]. Boron reduced the infection of pathogens by improving cell wall and membrane strength with cross-linked polymers and by strengthening the plant’s vascular bundles [
34]. Plant disease development and management were affected by the environment especially when nutrient deficiencies and toxicity occurred [
33]. A B application of 0.5 kg·ha
−1 along with a combination of nitrogen (100 kg·ha
−1) and Zn (0 and 1.0 kg·ha
−1) resulted in reduced fungal mycotoxin production, which were responsible for rotting of corn ears [
35]. On fine textured soils in Northeastern Missouri, B applied at VT (tasseling) with pyraclostrobin or pyraclostrobin alone reduced the disease severity most consistently [
36]. There has been limited research on a suitable B application timing (early
vs. late application) and concentration of foliar B on fine textured claypan soils in the Midwestern US. Therefore, the objective of this research was to evaluate the effects of foliar-applied B at different application concentrations and timings on corn yield, tissue B concentration, severity of diseases, grain oil, protein, starch, and extractable starch concentration.
2. Materials and Methods
Field experiments were conducted from 2008 to 2010 at four sites in Knox and Shelby counties in Northeastern Missouri. This research was conducted simultaneous to fungicide pyraclostrobin research at VT with foliar B applications at a single concentration [
36]. The two sites in Knox County were at the University of Missouri’s Greenley Research Center near Novelty (40°01′ N, 92°11′ W) and a cooperator’s farm nearby Bee Ridge (40°04′ N, 92°04′ W). The locations in Shelby County were at the University of Missouri’s Ross Jones Farm near Bethel (39°56′ N, 92°03′ W) and a cooperator’s farm nearby Leonard (39°54′ N, 92°16′ W). Different sites were selected each year for each experiment at individual locations. All locations had a silt loam soil texture and were planted with corn (
Table 1). The experiment was randomized complete block design with five replications and had seven B treatments including a non-treated control. Treatments included foliar applied B (Solubor, US Borax Inc., Valencia, CA, USA) at different timings and concentrations (
Table 2). Boron was applied at V4–V6 (4–6 leaves with visible collars) [
37] growth stage at 0.56, 1.12 and 2.24 kg·B·ha
−1 as well as VT at 0.28, 0.56 and 1.12 kg·B·ha
−1. Foliar B was applied using a CO
2 propelled backpack sprayer with 8002 flat fan nozzles (TeeJet Technologies, Wheaton, IL, USA) at 140 L·ha
−1 and no surfactant was used. The B concentrations used in this study were in the range recommended for foliar applications in corn [
38,
39]. Plants were 18 to 36 cm tall at V4–V6 and 183 to 305 cm tall at VT. The individual plot size was 3 by 15.2 m. All plots were planted in 0.76 m wide rows. Field information about the four sites, selected management practices and details about foliar B application are shown in
Table 1 and
Table 2 [
36]. These sites had different tillage operations (conventional
vs. no-till), previous crops, hybrids and seeding rates, which varied from 70,400 to 86,500 seeds ha
−1 (
Table 1). Fertilizer was applied based on recommendations from the University of Missouri soil test lab at Novelty and Bethel and by private labs at Bee Ridge and Leonard. Supplemental irrigation was scheduled using the Woodruff chart at the Novelty site [
40].
Initial soil samples before planting and fertilizer application were collected from each replication from 15-cm deep soil cores (20 cores per replication). The soil samples were dried at approximately 50 °C, ground, and analyzed using standard methods by Clemson University Agricultural Service Laboratory (Clemson, SC, USA). Soil test information at all 12 site-years are presented in
Table 3.
Before the V4–V6 B application and 10 days after application (DAA), 10 plants per plot from treatments with only foliar applied B at V4–V6 and the non-treated control were harvested, oven dried at 60 °C for 48 h, ground, weighed and tissue analyzed for B concentration. Ear leaf tissue was collected at VT and again 10 days after the VT B application, oven dried at 60 °C, weighed and analyzed for tissue B concentration. Plant stand counts were determined in order to calculate the plant population hectare−1, while ear tip fill and barren stand counts were also recorded prior to harvest. A digital caliper (Performance Tool, Tukwila, WA, USA) was used for measuring the ear tip that remained with no kernels from 20 plants row−1 at each site-year. Foliar injury due to B applications was visually rated on a scale of 0 (no crop injury) to 100% (complete plant death). Corn plants were rated for diseases severity including gray leaf spot (Cercospora zea-maydis) and common rust (Puccinia sorghi) at all site-years. There was no apparent disease in 2008 (data not presented). The severity of diseased plants in each plot was assessed 42 days after VT based on a percentage of the plants (0%–100%) showing symptoms of gray leaf spot, common rust, northern corn leaf blight (Exserohilum turcicum), or anthracnose stalk rot (Colletotrichum graminicola). The percentage of leaf area with lesions over the entire canopy (0 = no lesions to 100 = complete plant coverage) was used for rating gray leaf spot, common rust, and northern corn leaf blight. The grey leaf spot measurements were taken at all sites in 2009 and at Bethel and Bee Ridge in 2010. The northern corn leaf blight measurements were taken only at Leonard in 2010. The percentage of the stalk with lesions was rated for anthracnose stalk rot (0 = no lesions to 100 = complete stalk coverage). The centermost two rows in each plot were harvested using a small plot combine (Wintersteiger Delta, Salt Lake City, UT, USA) and weighed for grain yields and test weights were determined. The seed moisture was measured at harvest and adjusted to 150 g·kg−1 before analyzing data. Ten subsamples from collected grain samples were analyzed for oil, protein, starch, and extractable starch (Foss Infratec 1241, Eden Prairie, MN, USA).
Table 1.
Field information and selected management practices at 12 site-years [
36].
Table 1.
Field information and selected management practices at 12 site-years [36].
| Field Information † | Novelty | Bethel | Leonard | Bee Ridge |
|---|
| 2008 | 2009 | 2010 | 2008 | 2009 | 2010 | 2008 | 2009 | 2010 | 2008 | 2009 | 2010 |
|---|
| Previous crop | Soybean | Corn | Corn | Corn | Soybean | Soybean | Soybean | Soybean | Soybean | Soybean | Soybean | Soybean |
| Tillage | Conv. | Conv. | Conv. | NT | NT | NT | NT | NT | NT | Conv. | Conv. | Conv. |
| Planting date | 19 May | 11 May | 26 May | 14 June | 19 May | 28 May | 21 May | 23 May | 29 May | 21 May | 22 May | 28 May |
| Hybrid | DKC63–42VT3 | DKC63–42VT3 | DKC63–42VT3 | Burrus 795t | DKC63–42 VT3 | DKC63–42 VT3 | Crow’s 4835 | Mycogen 2D653 | Mycogen 2K594 | Pioneer 33D13 | Pioneer 33D13 | Pioneer 33T57 |
| Seeding rate, (seeds ha−1) | 86,500 | 79,000 | 84,000 | 74,000 | 74,000 | 73,400 | 74,000 | 74,000 | 74,000 | 70,400 | 75,300 | 76,600 |
| Fertilizer applications (N–P2O5–K2O, kg·ha−1) |
| Fall date | 15 December 2008 | | | 21 November 2009 | | | | 21 November 2007 | | |
| Rates | 34–90–135 | | | 66–170–252 | | | 34–90–180 | | |
| Source(s) | | DAP | | | | DAP | | | DAP | | |
| Preplant date | 19 May | 4 May | 12 April | 14 June | 8 April | 20 May | 25 April | 20 May | 19 May | 25 April | 15 April |
| Rates | 224–0–0 | 202–0–0 | 280–90–170 | 202–100–135 | 202–0–0 | 56–0–0 | 44–112–135 | 56–0–0 | 163–0–0 | 40–103–0 | 44–112–112 |
| Source(s) | AN | AN | AN + DAP | AN + DAP | AA | UAN | DAP | UAN | AA | DAP | DAP |
| Preemergence date | 4 May | | | | 1 June | | | | 21 May | 15 April |
| Rates | 90–67–22 | | | | 34–0–0 | | | | 190–0–0 | 179–0–0 |
| source(s) | AN + DAP | | | | UAN | | | | AA | AA |
| Top-dress date | | 17 June | 11 June | | | 14 June | 20 June | 23 & 28 June | |
| Rates | | 90–0–0 | 202–0–0 | | | 112–0–0 | 112–0–0 | 135–0–0 & 370–0–0 | |
| source(s) | | AA | UAN | | | UAN | UAN | UAN | |
Table 2.
Foliar B application information at V4–V6 and VT at the 12 site-years [
36].
Table 2.
Foliar B application information at V4–V6 and VT at the 12 site-years [36].
| B Application Information | Novelty | Bethel | Leonard | Bee Ridge |
|---|
| 2008 | 2009 | 2010 | 2008 | 2009 | 2010 | 2008 | 2009 | 2010 | 2008 | 2009 | 2010 |
|---|
| V4–V6 † |
| Application date | 16 June | 12 June | 17 June | 16 July | 15 June | 19 June | 15 June | 17 June | 20 June | 15 June | 10 June |
| Air temperature (°C) | 21 | 22 | 23 | 33 | 24 | 27 | 26 | 33 | 38 | 19 | 27 |
| Relative humidity, % | 61 | 90 | 92 | 56 | 82 | 65 | 83 | 71 | 45 | 95 | 69 |
| Height, cm | 25 | 25 | 30 | 36 | 28 | 36 | 27 | 25 | 36 | 33 | 18 |
| VT |
| Application date | 23 July | 20 July | 23 July | 15 August | 27 July | 28 July | 27 July | 23 July | 28 July | 27 July | 23 July |
| Air temperature (°C) | 25 | 23 | 28 | 27 | 29 | 34 | 31 | 37 | 34 | 29 | 33 |
| Relative humidity, % | 52 | 77 | 33 | 75 | 60 | 60 | 61 | 33 | 60 | 61 | 33 |
| Height, cm | 183 | 183 | 244 | 305 | 183 | 183 | 183 | 213 | 183 | 183 | 213 |
| Harvest date | 5 November | 2 November | 27 September | 13 November | 24 November | 28 October | 13 November | 4 October | 19 November | 7 December | 20 October |
| Soil type | Kilwinning | Putnam | Arbela | Wabash | Chariton | Wabash |
Table 3.
Initial soil test information at Novelty, Bethel, Leonard, and Bee Ridge in 2008, 2009, and 2010 [
36].
Table 3.
Initial soil test information at Novelty, Bethel, Leonard, and Bee Ridge in 2008, 2009, and 2010 [36].
| Soil Test Information | Novelty | Bethel | Leonard | Bee Ridge |
|---|
| 2008 |
| pH (1:1 water) | 5.8 ± 0.3 † | 6.1 ± 0.1 | 6.2 ± 0.1 | 6.3 ± 0.2 |
| Mehlich-1 | |
| P, kg·ha−1 | 30 ± 8 | 76 ± 21 | 62 ± 9 | 89 ± 4 |
| K, kg·ha−1 | 220 ± 43 | 173 ± 13 | 176 ± 12 | 220 ± 4 |
| Ca, kg·ha−1 | 3660 ± 310 | 3920 ± 140 | 4110 ± 200 | 3720 ± 110 |
| Mg, kg·ha−1 | 509 ± 48 | 336 ± 15 | 298 ± 24 | 246 ± 8 |
| B, kg·ha−1 | 0.67 ± 0.08 | 0.58 ± 0.04 | 0.47 ± 0.04 | 0.96 ± 0.09 |
| CEC ‡, cmolckg−1 | 14.2 ± 0.9 | 12.8 ± 0.3 | 13.4 ± 0.6 | 11.8 ± 0.4 |
| 2009 |
| pH (1:1 water) | 6.3 ± 0.1 | 6.3 ± 0.2 | 7.2 ± 0 | 7.0 ± 0.2 |
| Mehlich-1 | |
| P, kg·ha−1 | 71 ± 10 | 37 ± 1 | 75 ± 8 | 100 ± 16 |
| K, kg·ha−1 | 387 ± 74 | 181 ± 10 | 136 ± 4 | 163 ± 13 |
| Ca, kg·ha−1 | 4260 ± 140 | 3610 ± 360 | 4800 ± 420 | 4790 ± 620 |
| Mg, kg·ha−1 | 538 ± 24 | 360 ± 36 | 286 ± 47 | 361 ± 6 |
| B, kg·ha−1 | 1.05 ± 0.06 | 1.03 ± 0.04 | 1.01 ± 0.13 | 0.81 ± 0.09 |
| CEC, cmolckg−1 | 16.0 ± 0.5 | 12.9 ± 0.9 | 14.1 ± 1.4 | 14.3 ± 1.2 |
| 2010 |
| pH (1:1 water) | 5.7 ± 0.3 | 7.3 ± 0.2 | 6.4 ± 0.1 | 6.7 ± 0.2 |
| Mehlich-1 | |
| P, kg· ha−1 | 28 ± 4 | 34 ± 2 | 48 ± 4 | 92 ± 27 |
| K, kg·ha−1 | 166 ± 16 | 101 ± 9 | 137 ± 27 | 186 ± 47 |
| Ca, kg·ha−1 | 3010 ± 380 | 4870 ± 340 | 4870 ± 210 | 3990 ± 490 |
| Mg, kg·ha−1 | 377 ± 34 | 367 ± 24 | 343 ± 27 | 341 ± 50 |
| B, kg·ha−1 | 0.47 ± 0.27 | 0.76 ± 0.27 | 0.43 ± 0.27 | 0.54 ± 0.27 |
| CEC, cmolckg−1 | 12.3 ± 0.6 | 14.4 ± 0.8 | 15.4 ± 0.6 | 12.8 ± 1.1 |
All the collected data were analyzed using analysis of variance (ANOVA) in PROC GLM with the SAS statistical computer program [
41]. If the overall F was significant, Fisher’s Protected Least Significant Difference (LSD) at
p = 0.1 was used for mean separation. In absence of a significant interaction between B treatments and site-years, data were averaged over the 12 site-years. Pearson correlation analysis (PROC CORR procedure of SAS) was used to determine the relationship between corn yield and other plant measurements.
3. Results and Discussion
The initial soil B concentration ranged from 0.43 kg·ha
−1 at Leonard in 2010 to 1.05 kg·ha
−1 at Novelty in 2009 (
Table 3). All sites had acidic to neutral pH soils. The soils at all site-years were high in potassium concentration (101 to 387 kg·ha
−1). The monthly precipitation at Novelty and Bee Ridge in Knox County was higher than the 10-year average precipitation for northeast Missouri except in the month of August in 2010. In 2010, there was 62% and 63% lower monthly precipitation in August at all sites compare to the 10-year average precipitation (
Table 4) which made it drier compare to other years. In Shelby County during 2008 and 2010, the average monthly precipitation was 19% and 33% lower in May compared to the 10-year average precipitation. Since rainfall early in the season and during pollination was generally high, the overall availability of B to corn plants should have been readily available during critical portions of plant development. In general, overall corn yields were high for the period this research was conducted.
Table 4.
Monthly precipitation average (10-year) for Northeast Missouri during the growing season and at Novelty, Bee Ridge, Bethel, and Leonard in 2008, 2009, and 2010. Novelty and Bee Ridge are in Knox County, and Bethel and Leonard are in Shelby County [
36].
Table 4.
Monthly precipitation average (10-year) for Northeast Missouri during the growing season and at Novelty, Bee Ridge, Bethel, and Leonard in 2008, 2009, and 2010. Novelty and Bee Ridge are in Knox County, and Bethel and Leonard are in Shelby County [36].
| Month | Northeast Missouri 10-Year Average † | Knox County (Novelty and Bee Ridge) (mm) | Shelby County (Bethel and Leonard) (mm) |
|---|
| 2008 | 2009 | 2010 | 2008 | 2009 | 2010 |
|---|
| April | 100 | 116 | 121 | 146 | 116 | 120 | 135 |
| May | 113 | 112 | 170 | 160 | 92 | 170 | 76 |
| June | 124 | 257 | 145 | 163 | 133 | 148 | 168 |
| July | 93 | 272 | 108 | 326 | 195 | 79 | 93 |
| August | 122 | 108 | 167 | 45 | 206 | 141 | 46 |
| September | 85 | 201 | 86 | 242 | 315 | 96 | 250 |
| Total | 637 | 1066 | 797 | 1082 | 1057 | 754 | 768 |
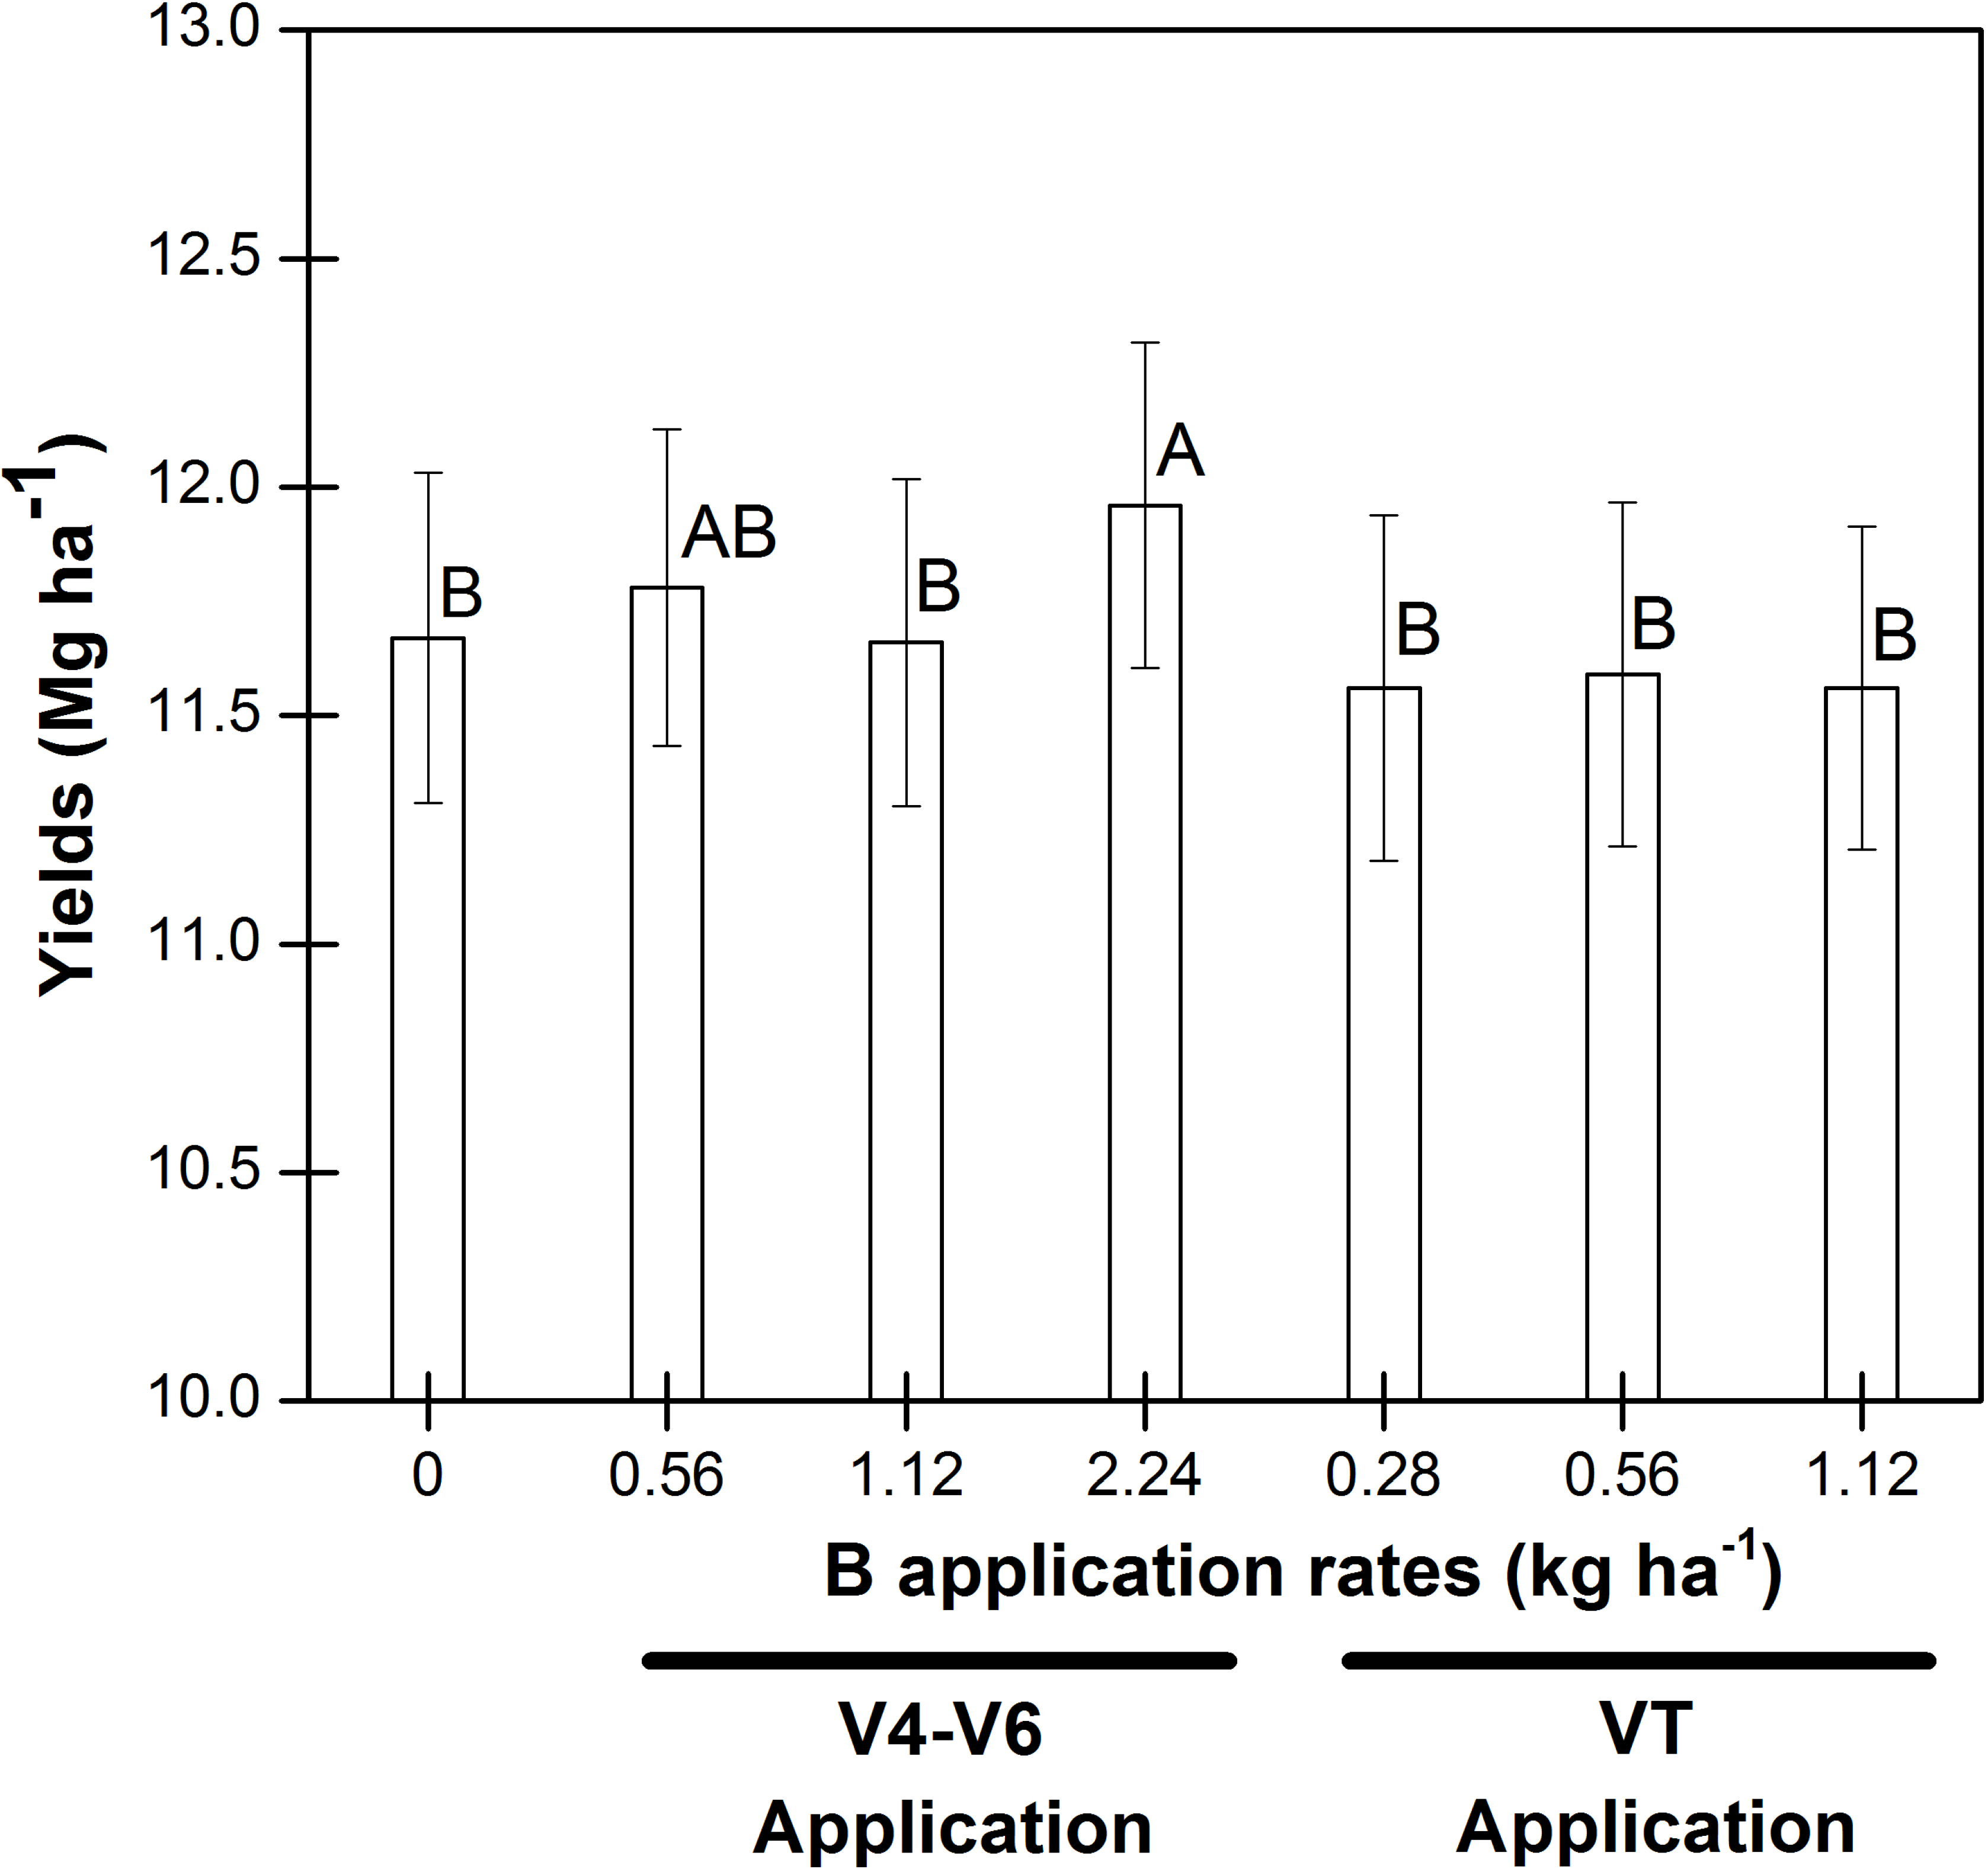
The mean corn yield averaged over the 12 site-years and B treatments was 11.7 Mg·ha
−1. A significant effect of B treatments, site-years and B treatment × site-year interaction was found for corn yields (
Table 5). Boron applied at V4–V6 at 2.24 kg·ha
−1 was the highest yielding treatment in five of the 12 site-years, and had the highest average yield of 11.96 Mg·ha
−1 compared to all other treatments (
Figure 1). The V4–V6 B application at 2.24 kg·ha
−1 increased yield 0.29 Mg·ha
−1 compared to the non-treated control. None of the other B treatments affected yield when averaged over the 12 site-years in this research. The V4–V6 B application at 0.56 and 1.12 kg·ha
−1 had higher yields than VT B application at the same concentrations, but they were not significantly different. Corn yields from B applications at VT ranged from 11.56 to 11.58 Mg·ha
−1. Foliar B applications at VT resulted in 0.24 Mg·ha
−1 lower yields than V4–V6 B applications. Higher yields due to an early application of B compared to late B application were reported for rice in Missouri [
42]. Woodruff
et al. [
12] also reported an increase in corn yields due to B at 2.24 kg·ha
−1 for soils receiving higher K fertilization (131–317 kg·ha
−1). A beneficial effect of early applications of B for grain yields were also reported for wheat, rice and cotton [
43]. In contrast to this, no differences in soybean yields were observed due to early or late B applications in Northeast Arkansas [
44]. There were no differences in yield due to B application in 2010 at all sites except Bee Ridge (
Table 5). At Leonard, greater corn yields were obtained with a V4–V6 B application at 0.56 kg·ha
−1, which was significantly different from the lowest yields obtained with a VT application at 0.28 and 0.56 kg·ha
−1 in 2009 only. The higher total rainfall received in Knox County compared to Shelby County may have resulted in greater B solubility and availability to corn plants [
9]. The maximum corn yield obtained was 15.32 Mg·ha
−1 at Novelty in 2009, which had the highest initial B concentration, of 1.05 kg·ha
−1, among all site-years and had sufficient rainfall along with supplemental irrigation (
Table 5). However, the lowest yield obtained was 6.46 Mg·ha
−1 in 2008 at Leonard, which had only 0.47 kg·ha
−1 of initial B in the soil.
Figure 1.
Corn grain yield in response to V4–V6(4–6 leaves with visible collars) and VT (tasseling) foliar B applications at different concentrations. Data were averaged over 12 site-years and the LSD (p = 0.1) was 0.24 Mg·ha−1. Similar letters on bars indicate no significant differences between treatments. Error bars represents standard error.
Table 5.
Corn grain yields at 12 site-years for V4–V6 and VT foliar B applications at different concentrations.
Table 5.
Corn grain yields at 12 site-years for V4–V6 and VT foliar B applications at different concentrations.
| Application Timing | Application Concentration (kg·ha−1) | Novelty (mg·ha−1) | Bethel (mg·ha−1) | Bee Ridge (mg·ha−1) | Leonard (mg·ha−1) |
|---|
| 2008 | 2009 | 2010 | 2008 | 2009 | 2010 | 2008 | 2009 | 2010 | 2008 | 2009 | 2010 |
|---|
| Non-treated | 0 | 8.6 | 14.9 | 9.3 | 11.6 | 10.8 | 14.1 | 14.3 | 14.3 | 9.4 | 6.5 | 12.3 | 14.0 |
| V4–V6 | 0.56 | 8.9 | 14.6 | 8.6 | 11.4 | 11.3 | 14.1 | 13.7 | 14.3 | 10.8 | 6.7 | 13.0 | 14.1 |
| V4–V6 | 1.12 | 8.8 | 15.0 | 8.3 | 10.6 | 11.3 | 14.2 | 14.0 | 14.4 | 9.7 | 6.9 | 12.6 | 14.1 |
| V4–V6 | 2.24 | 9.2 | 15.3 | 9.7 | 11.9 | 11.1 | 14.2 | 13.9 | 14.5 | 9.7 | 6.8 | 12.7 | 14.4 |
| VT | 0.28 | 8.9 | 14.9 | 9.6 | 11.6 | 10.6 | 14.4 | 14.0 | 14.0 | 7.7 | 6.5 | 12.1 | 14.3 |
| VT | 0.56 | 8.7 | 14.7 | 7.8 | 11.7 | 11.3 | 14.4 | 13.7 | 14.4 | 9.1 | 6.9 | 11.9 | 14.4 |
| VT | 1.12 | 9.0 | 14.0 | 8.2 | 11.2 | 10.8 | 14.6 | 13.6 | 14.3 | 9.1 | 7.0 | 12.6 | 14.4 |
| LSD (p = 0.1) | | 0.5 | 0.9 | ns † | 1.2 | ns | ns | ns | 0.5 | 1.8 | ns | 0.9 | ns |
Table 6.
Whole plant tissue B concentrations 10 days after V4–V6 B application at different concentrations.
Table 6.
Whole plant tissue B concentrations 10 days after V4–V6 B application at different concentrations.
| Application Rate (kg·ha−1) | Tissue B Concentration ‡ | Novelty (mg·kg−1) | Bethel (mg·kg−1) | Bee Ridge (mg·kg−1) | Leonard (mg·kg−1) |
|---|
| 2008 | 2009 | 2010 | 2008 | 2009 | 2010 | 2008 | 2009 | 2010 | 2008 | 2009 | 2010 |
|---|
| Non treated | 5.0 | 5.4 | 5.2 | 5.2 | 6.0 | 4.8 | 4.8 | 6.0 | 4.0 | 5.2 | 4.6 | 5.0 | 4.0 |
| 0.56 | 5.5 | 5.4 | 5.4 | 5.4 | 8.2 | 5.0 | 5.0 | 5.6 | 4.2 | 6.8 | 5.2 | 5.4 | 4.2 |
| 1.12 | 5.8 | 6.2 | 5.2 | 5.5 | 9.6 | 5.8 | 4.8 | 5.8 | 4.2 | 6.4 | 5.8 | 5.4 | 5.2 |
| 2.24 | 7.3 | 6.6 | 6.2 | 5.6 | 14.4 | 7.4 | 5.4 | 10.2 | 4.4 | 7.6 | 8.4 | 5.6 | 5.2 |
| LSD (p = 0.1) | 0.4 | 0.4 | 0.8 | ns † | 2.0 | 2.2 | ns | 4.1 | ns | 1.8 | 1.2 | ns | 0.7 |
The initial B concentration in plant tissue ranged from 3.8 to 6.8 mg·kg
−1. There were no significant differences in tissue B concentration between B treatments from plant samples taken before the V4–V6 application of B among all site-years except at Bee Ridge in 2008 and Leonard in 2009 (data not presented). This might be due to higher initial soil B concentration at Bee Ridge in 2008 and Leonard in 2009, which was 0.96 and 1.01 kg·ha
−1, respectively. At Bee Ridge in 2008, treatments containing B applied at V4–V6 at 0.56 kg·ha
−1 had 0.8 mg·kg
−1 greater B concentration than treatments having B applied at 2.24 kg·ha
−1. In 2009 at Leonard, both of these treatments showed no differences in tissue B concentration, but a V4–V6 B application at 0.56 kg·ha
−1 had 0.8 mg·kg
−1 lower tissue B concentration than B application at 1.12 kg·ha
−1 (data not presented). Tissue B concentration from samples taken 10 days after B application at V4–V6 showed differences among treatments and an interaction between treatments and site-years was observed (
Table 6). Foliar B applied at V4–V6 at 2.24 kg·ha
−1 had 2.3 mg·kg
−1 higher tissue B concentration when averaged over the 12 site-years compared to the non-treated control. A V4–V6 B application at 0.56 and 1.12 kg·ha
−1 had 0.5 to 0.8 mg·kg
−1 greater tissue B concentration than the non-treated control, but 1.5 to 1.8 mg·kg
−1 lower tissue B concentration than the treatment having a V4–V6 B application at 2.24 kg·ha
−1. No differences were observed between treatments at Novelty and Bethel in 2010 and at Bee Ridge and Leonard in 2009. In the remaining site-years, a V4–V6 B application at 2.24 kg·ha
−1 had higher B concentrations compared to the non-treated control. A V4–V6 application of B increased B concentration in the plant tissue among all site-years as the rate of B increased.
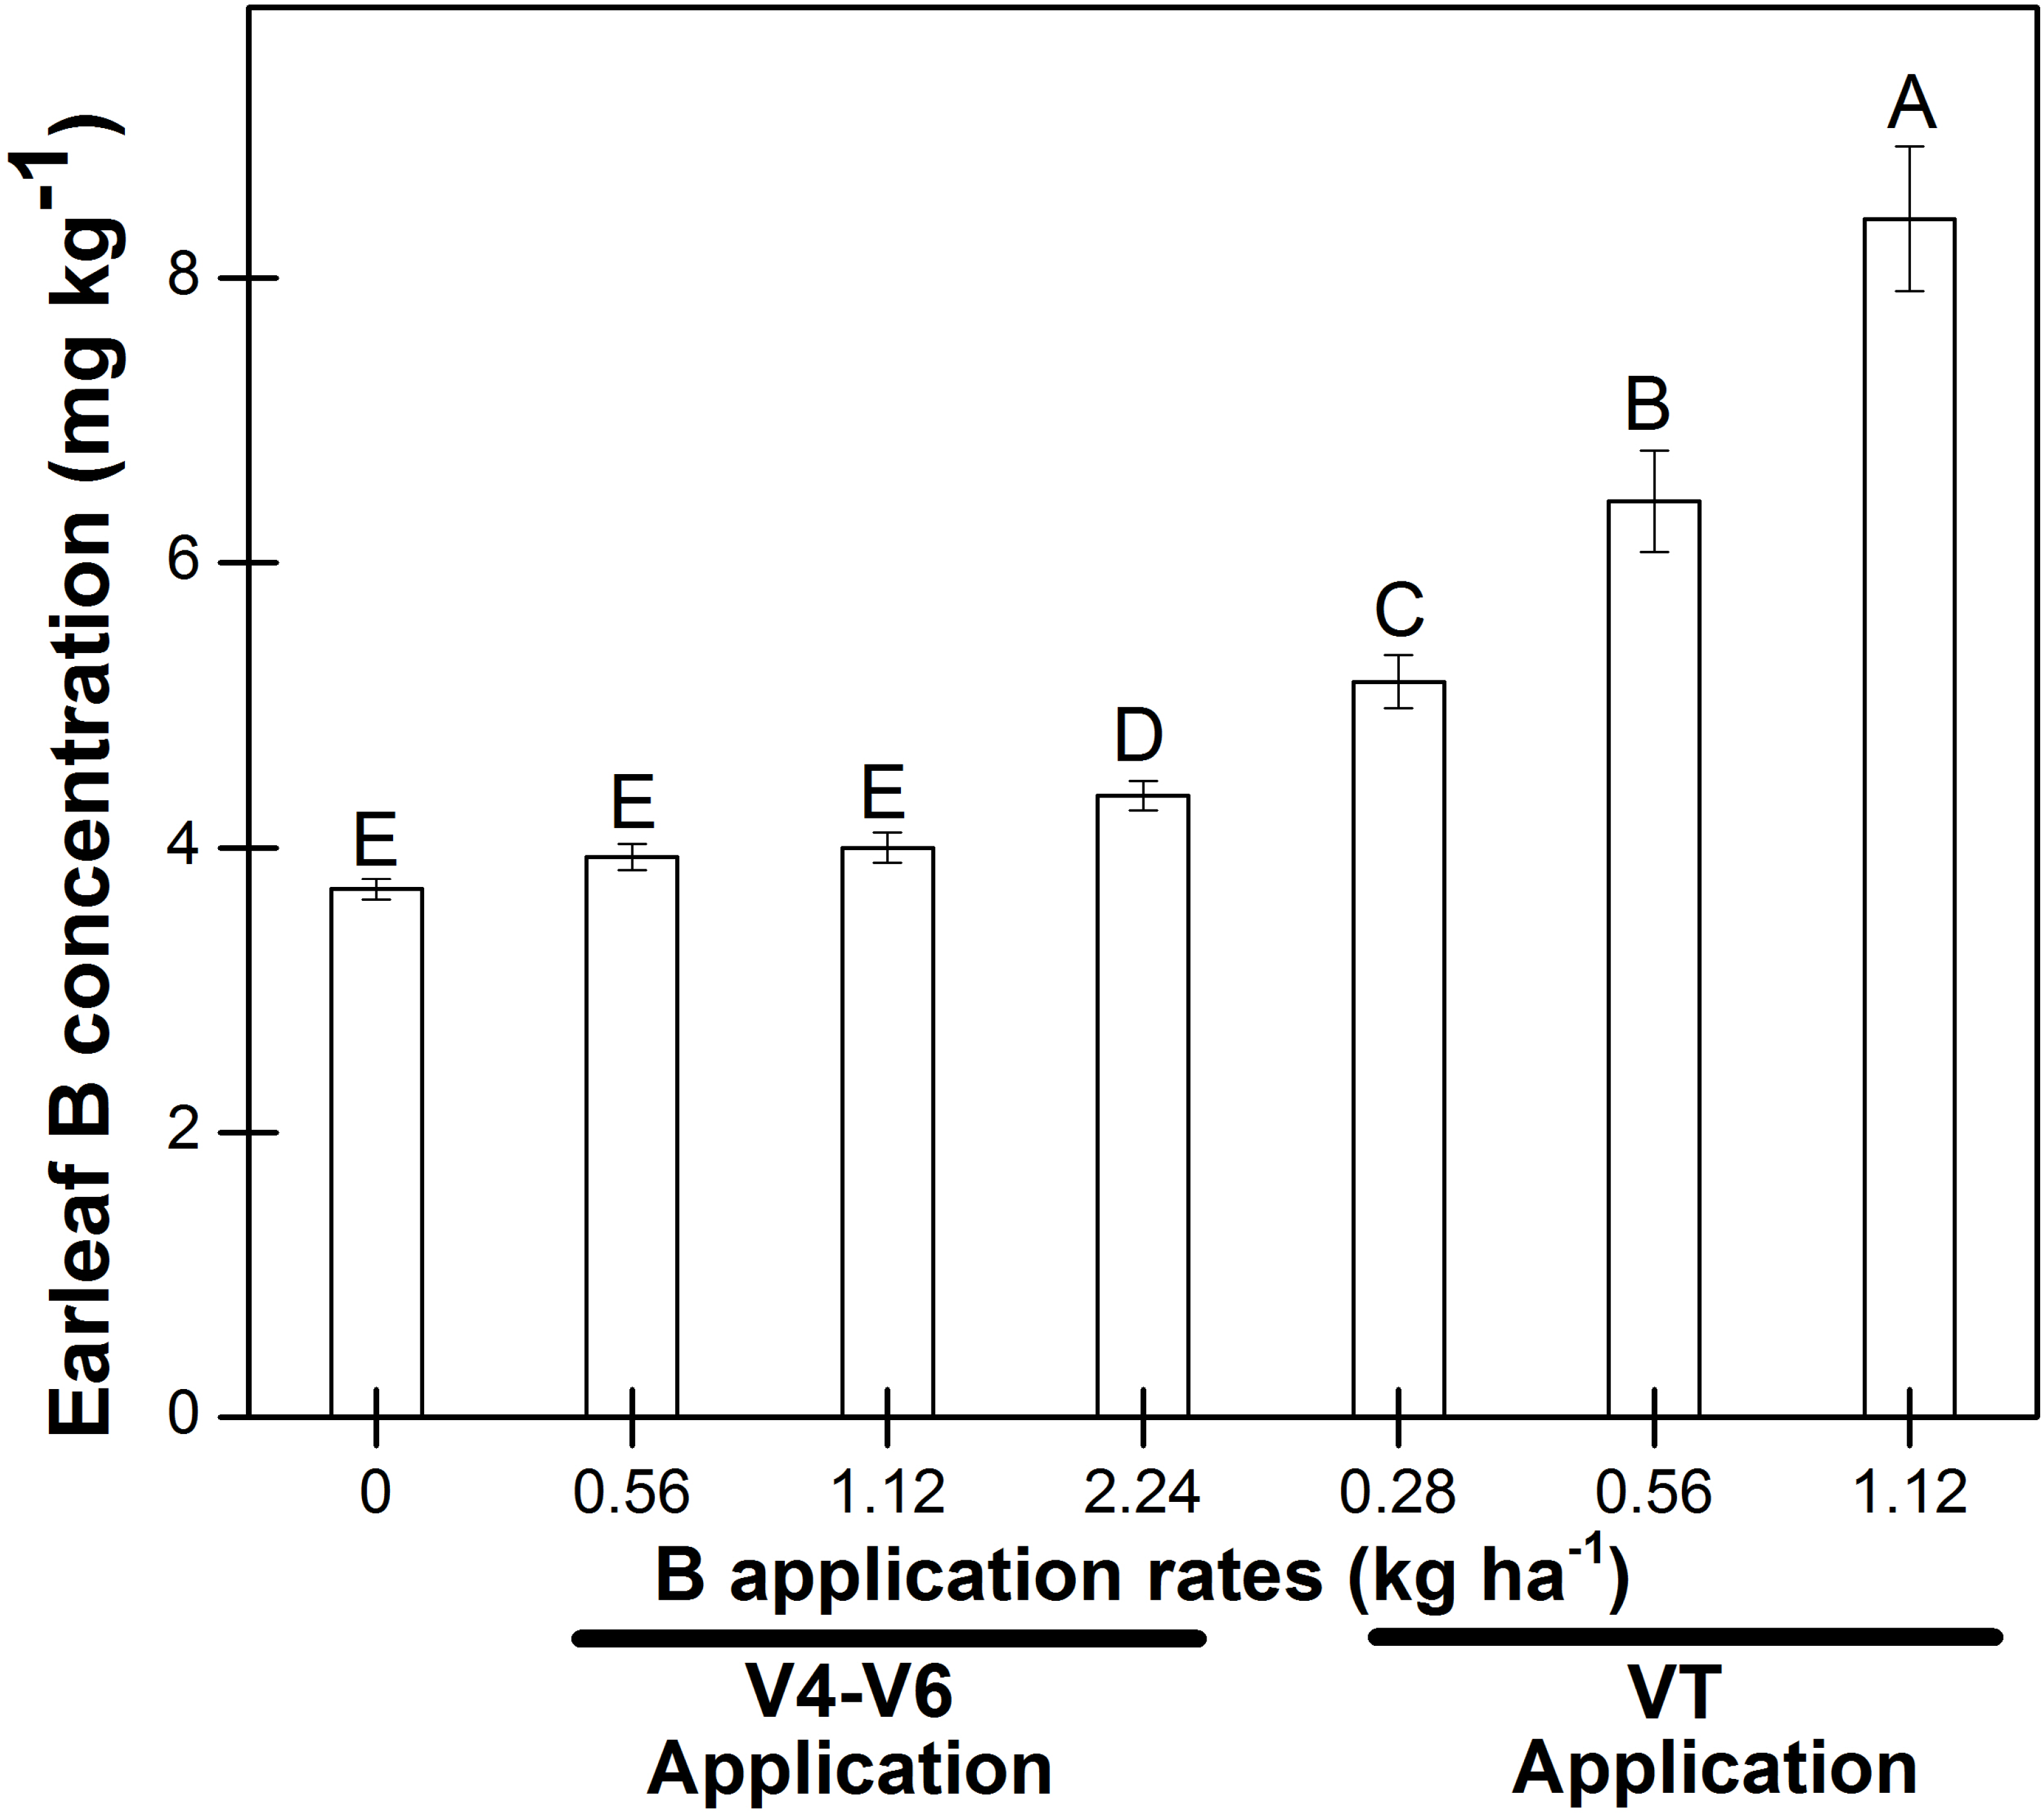
Boron concentration in plant tissue samples taken at VT before VT B application did not show any differences at the 12 site-years (data not presented). The ear leaf B concentration averaged over site-years ranged from 3.71 to 8.42 mg·kg
−1 among treatments from plant samples taken 10 days after a foliar VT application (
Figure 2). The treatments having a V4–V6 application at 0.56 and 1.12 kg·ha
−1 had similar ear leaf B concentrations as the non-treated control plots; while V4–V6 applied B at 2.24 kg·ha
−1 had a 0.37 mg·kg
−1 higher ear leaf B concentration compared to other B application concentrations at V4–V6. All VT B application treatments resulted in significantly higher ear leaf B concentration (5.2 to 8.41 mg·kg
−1) compared to non-treated (3.7 mg·kg
−1) and V4–V6 treatments. Ear leaf B concentration increased with increasing concentrations of foliar B application from 0.28 kg·ha
−1 to 1.12 kg·ha
−1 at VT. A foliar VT B application at 1.12 kg·ha
−1 had 4.7 mg·kg
−1 greater ear leaf B concentration compared to the non-treated control. A significant interaction was observed between ear leaf B concentration and site-years (
Table 7). Among all site-years, a VT B application at 1.12 kg·ha
−1 had higher ear leaf B concentrations compared to the other B treatments including the non-treated control. An increase in leaf B concentration with increasing B application concentrations were also reported in soybean in Northeast Arkansas [
45].
The plant population varied from 69,500 to 71,500 plants·ha
−1 over the 12 site-years. There was no effect of B treatments on plant population, but there were differences in plant population among site-years (
Table 8). Similar results were obtained by Nelson
et al. [
36] for B applications with fungicides in corn. The highest plant population of 86,064 plants·ha
−1 was found at Leonard in 2010 and lowest population of 61,132 plants·ha
−1 was found at Novelty in 2009 (
Table 8). Woodruff
et al. [
12] reported increased corn yields with B with plant populations more than 50,000 plants·ha
−1. Oil, protein, starch and extractable starch content of grains were not affected by the B treatments and no significant interaction of B treatments and site-years were found. Grain protein, oil, starch and extractable starch concentrations varied by site-years (
Table 8). The differences between site-years might be because of different environmental conditions, management systems, soil properties and hybrid differences. No differences in protein and oil concentration in corn grains due to B at 0.28, 0.56 and 1.12 kg·ha
−1 were also observed in Georgia [
46]; however, B at 0.45 kg·ha
−1 increased seed oil and protein concentration in soybean [
47]. Boron alone increased corn grain protein and starch concentration by 0.7% and 3.7%, respectively, in wheat [
48]. Corn yields were negatively correlated with ear leaf B concentration, plant population, grain starch and extractable starch concentration (
Table 9). There was positive correlation of corn yields with grain protein concentration. However, a highly positive correlation was reported for seed yield and leaf B content of
Vigna radiata [
5].
Figure 2.
Ear leaf B concentration in response to V4–V6 (4–6 leaves with visible collars) and VT (tasseling) foliar B application 10 days after VT application. Data were averaged over 12 site-years and the LSD (p = 0.1) was 0.3 mg·kg−1. Similar letters on bars indicate no significant differences between treatments. Error bars represents standard error.
Table 7.
Ear leaf B concentration ten days after VT at the 12 site-years for V4–V6 and VT foliar B applications.
Table 7.
Ear leaf B concentration ten days after VT at the 12 site-years for V4–V6 and VT foliar B applications.
| Application Timing | Application Concentration (kg·ha−1) | Novelty (mg·kg−1) | Bethel (mg·kg−1) | Bee Ridge (mg·kg−1) | Leonard (mg·kg−1) |
|---|
| 2008 | 2009 | 2010 | 2008 | 2009 | 2010 | 2008 | 2009 | 2010 | 2008 | 2009 | 2010 |
|---|
| Non-treated | 0 | 3.8 | 3.8 | 4.2 | 3.6 | 4.0 | 4.4 | 3.8 | 3.2 | 3.0 | 3.0 | 3.9 | 3.8 |
| V4–V6 | 0.56 | 3.8 | 4.2 | 4.4 | 4.0 | 4.4 | 4.6 | 4.0 | 3.8 | 3.0 | 3.6 | 3.6 | 3.8 |
| V4–V6 | 1.12 | 4.0 | 3.8 | 4.0 | 4.2 | 4.6 | 5.0 | 3.8 | 3.8 | 3.0 | 3.8 | 3.8 | 4.0 |
| V4–V6 | 2.24 | 4.2 | 4.2 | 4.8 | 4.4 | 5.4 | 5.0 | 4.2 | 3.8 | 3.2 | 4.4 | 4.6 | 4.4 |
| VT | 0.28 | 4.8 | 4.8 | 6.2 | 4.4 | 6.2 | 4.6 | 4.2 | 5.0 | 3.4 | 6.2 | 8.0 | 4.2 |
| VT | 0.56 | 5.8 | 5.8 | 5.2 | 5.8 | 7.8 | 4.8 | 5.4 | 6.8 | 3.2 | 12.2 | 10.4 | 4.0 |
| VT | 1.12 | 8.2 | 7.2 | 6.0 | 8.2 | 10.4 | 5.6 | 8.0 | 7.4 | 4.0 | 14.0 | 16.4 | 5.6 |
| LSD (p = 0.1) | | 1.3 | 0.9 | 1.1 | 1.6 | 1.5 | 0.9 | 1.4 | 0.9 | 0.5 | 1.9 | 2.1 | 0.7 |
Table 8.
Oil, protein, starch and extractable starch concentration in corn grains, ear tip fill, and common rust severity at 12 site-years. Data were averaged over treatments at each site-year.
Table 8.
Oil, protein, starch and extractable starch concentration in corn grains, ear tip fill, and common rust severity at 12 site-years. Data were averaged over treatments at each site-year.
| Grain Components | Novelty | Bethel | Bee Ridge | Leonard | LSD (p = 0.1) |
|---|
| 2008 | 2009 | 2010 | 2008 | 2009 | 2010 | 2008 | 2009 | 2010 | 2008 | 2009 | 2010 |
|---|
| Oil (g·kg−1) | 46 | 42 | 44 | 43 | 43 | 42 | 42 | 37 | 34 | 42 | 55 | 45 | 3 |
| Protein (g·kg−1) | 66 | 85 | 67 | 71 | 90 | 75 | 85 | 84 | 74 | 62 | 84 | 89 | 1 |
| Starch (g·kg−1) | 739 | 720 | 739 | 714 | 719 | 723 | 740 | 734 | 734 | 745 | 702 | 716 | 2 |
| Extractable starch (g·kg−1) | 702 | 675 | 679 | 693 | 649 | 690 | 688 | 687 | 703 | 709 | 653 | 639 | 2 |
| Ear tip fill (mm) | 10 | 4 | 29 | 2 | 2 | 28 | 1 | 7 | 25 | 7 | 24 | 18 | 2 |
| Common rust | - ‡ | 3 | 10 | - | 12 | 11 | - | 6 | 33 | - | 5 | 27 | 1 |
| Plant population (plants·ha−1) | 76,041 | 61,132 | 64,958 | 69,679 | 65,758 | 65,745 | 66,708 | 72,221 | 69,654 | 69,782 | 77,822 | 86,063 | 2169 |
Table 9.
Correlation analysis between corn grain yields and corn response measurements.
Table 9.
Correlation analysis between corn grain yields and corn response measurements.
| Measurement | Yield |
|---|
| Plant population | −0.13 |
| p > |r| | 0.0059 |
| Grain protein | 0.74 |
| p > |r| | <0.0001 |
| Grain starch content | −0.47 |
| p > |r| | <0.0001 |
| Grain extractable starch | −0.44 |
| p > |r| | <0.0001 |
| TipFill | −0.13 |
| p > |r| | 0.0075 |
| Common Rust | −0.21394 |
| p > |r| | 0.0003 |
No toxicity symptoms and barren stalks were observed due to foliar B treatments at all 12 site-years (data not presented). Production of barren ears in corn was reported for B levels less than 0.05 ppm [
49]. Ear tip fill was used to evaluate the effect of B treatments on ear filling. A higher number for ear tip fill indicated a greater amount of ear was barren. Although ear tip fill did not show differences between B treatments, it varied by site-years (
Table 8). The ear tip fill was greater in 2010 than in 2008 and 2009.
The severity of disease varied by sites and years, and the impact of B applications were generally subtle. The occurrence of common rust was not significantly different between B treatments, but it varied by site-year. Common rust severity was 22% higher at Bee Ridge in 2010 compared to Leonard. Ear tip fill and common rust were negatively correlated with the corn yields (
Table 9). In 2010, corn was rated for the severity of anthracnose stalk rot at Bethel and Leonard. Severity of anthracnose stalk rot at Bethel and Leonard in 2010 was not affected by B treatments (data not presented). At Leonard in 2010, severity of northern corn leaf blight was affected by the timing of foliar B application, but not by the amount of B applied (
Table 10). A reduction in the severity of common rust, gray leaf spot, and northern corn leaf blight in corn due to pyraclostrobin, not B was found by some other researchers [
36,
50]. The V4–V6 B application at 2.24 kg·ha
−1 and all VT applications increased the severity of northern corn leaf blight compared to the non-treated control. The severity of gray leaf spot was 6% and 12% lower with V4–V6 applied B at 1.12 and 2.24 kg·ha
−1 and VT applied B at 0.56 kg·ha
−1, respectively, compared to other B treatments including non-treated control (
Table 10). Boron applied at V4–V6 at 2.24 kg·ha
−1 decreased gray leaf spot severity, but the severity of northern leaf blight increased compared to non-treated control. Reductions in disease severity due to B have been reported by other researchers [
35,
36], but may be inconsistent depending on the disease, environmental conditions, and hybrids. Frequent rains along with cool and cloudy weather has favored fungal disease development, in addition to nutrient deficiencies and toxicities [
32].
Table 10.
Effect of B application timing and concentrations on severity of grey leaf spot and northern corn leaf blight. Data were averaged over 6 site-years for grey leaf spot. Severity of northern corn leaf spot was measured in 2010 at Leonard.
Table 10.
Effect of B application timing and concentrations on severity of grey leaf spot and northern corn leaf blight. Data were averaged over 6 site-years for grey leaf spot. Severity of northern corn leaf spot was measured in 2010 at Leonard.
| Application Timing | Application Concentration (kg·ha−1) | Grey Leaf Spot (%) | Northern Corn Leaf Blight (%) |
|---|
| Non-treated | 0 | 16 | 7 |
| V4–V6 | 0.56 | 16 | 8 |
| V4–V6 | 1.12 | 15 | 8 |
| V4–V6 | 2.24 | 15 | 9 |
| VT | 0.28 | 16 | 11 |
| VT | 0.56 | 14 | 9 |
| VT | 1.12 | 16 | 9 |
| LSD (p = 0.1) | | 1 | 2 |


