Genetic Dissection of QTL Associated with Grain Yield in Diverse Environments

Abstract
:
1. Introduction
2. Materials and Methods
2.1. Plant Materials
2.2. Trial Conditions and Trait Evaluations
2.3. Statistical Analysis
2.4. QTL Analysis
3. Results
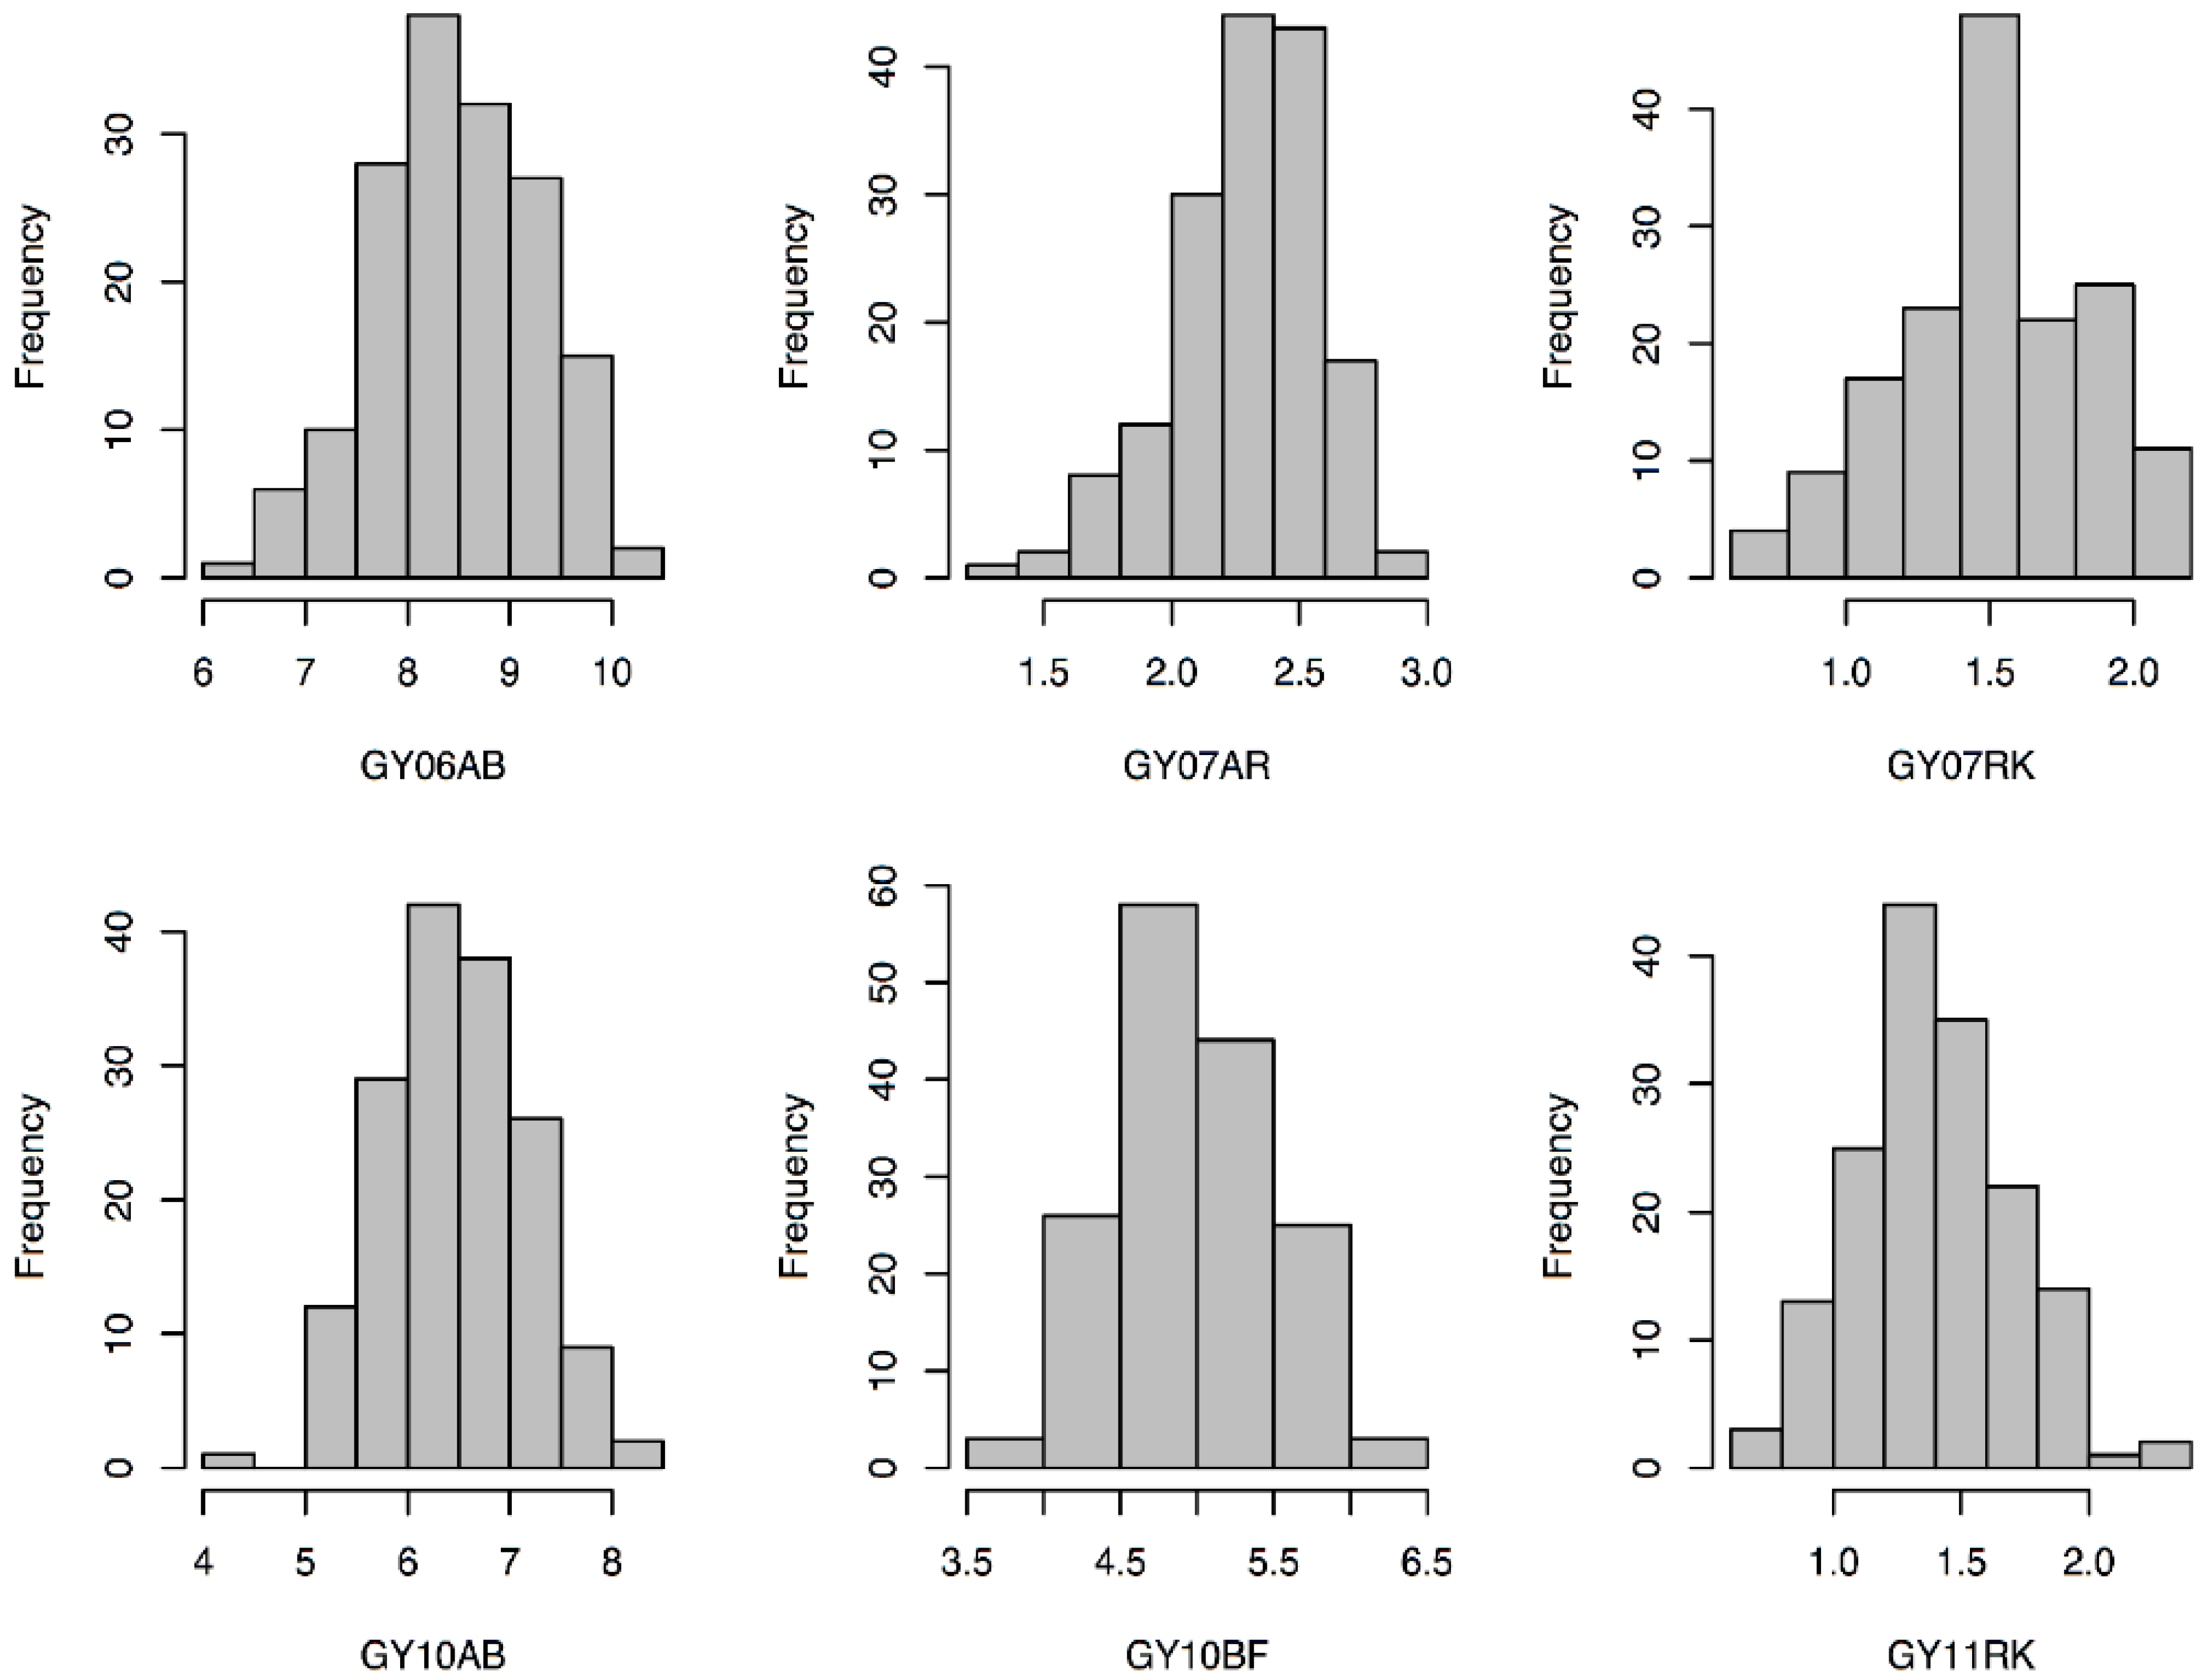
3.1. Phenotypic Analysis of GY, HD, and HT

| Trait | Env a | Parent b | RILs c | ||||||
|---|---|---|---|---|---|---|---|---|---|
| ID | RB | Diff | Mean | Std. Dev. | Min. | Max. | |||
| GY | 06AB | 8.88 | 9.18 | −0.30 | 8.46 | 0.80 | 6.24 | 10.28 | 0.63 |
| 07AR | 2.39 | 2.08 | 0.32 | 2.30 | 0.29 | 1.36 | 2.93 | 0.53 | |
| 07RK | 2.10 | 1.30 | 0.80 | 1.51 | 0.33 | 0.67 | 2.17 | 0.33 | |
| 10AB | 6.48 | 6.08 | 0.40 | 6.45 | 0.69 | 4.46 | 8.01 | 0.55 | |
| 10BF | 5.02 | 5.45 | −0.43 | 4.96 | 0.51 | 3.74 | 6.27 | 0.52 | |
| 11RK | 1.91 | 0.59 | 1.32 | 1.39 | 0.31 | 0.65 | 2.29 | 0.57 | |
| HD | 06AB | 160 | 152 | 8 | 157 | 2.46 | 152 | 164 | 0.70 |
| 07AR | 167 | 161 | 6 | 164 | 1.71 | 159 | 170 | 0.78 | |
| 07RK | 159 | 160 | NS | 160 | 1.02 | 158 | 163 | 0.40 | |
| 10AB | 169 | 163 | 6 | 168 | 2.66 | 163 | 174 | 0.78 | |
| 10BF | 174 | 164 | 10 | 171 | 1.98 | 166 | 176 | 0.77 | |
| 11RK | 181 | 175 | 6 | 176 | 2.56 | 171 | 183 | 0.59 | |
| HT | 06AB | 103.1 | 74.4 | 28.7 | 84.6 | 8.15 | 68.6 | 105 | 0.81 |
| 07AR | 80.5 | 57.4 | 23.1 | 69.2 | 7.20 | 52.1 | 86.4 | 0.79 | |
| 07RK | 59.9 | 51.8 | 8.1 | 53.6 | 4.65 | 43.2 | 67.3 | 0.08 | |
| 10AB | 104.0 | 81.2 | 22.8 | 98.8 | 6.53 | 83.8 | 121.6 | 0.47 | |
| 10BF | 109.2 | 86.4 | 22.8 | 97.1 | 8.53 | 76.2 | 121.9 | 0.83 | |
| 11RK | 64.4 | 43.8 | 20.6 | 54.7 | 5.77 | 42.2 | 67.6 | 0.62 | |
| Trait | GY | |||||
|---|---|---|---|---|---|---|
| 06AB | 07AR | 07RK | 10AB | 10BF | 11RK | |
| HD | NS | −0.18 * | −0.21 ** | −0.28 ** | −0.19 * | NS |
| HT | NS | 0.37 ** | 0.34 ** | −0.38 ** | NS | 0.30 ** |

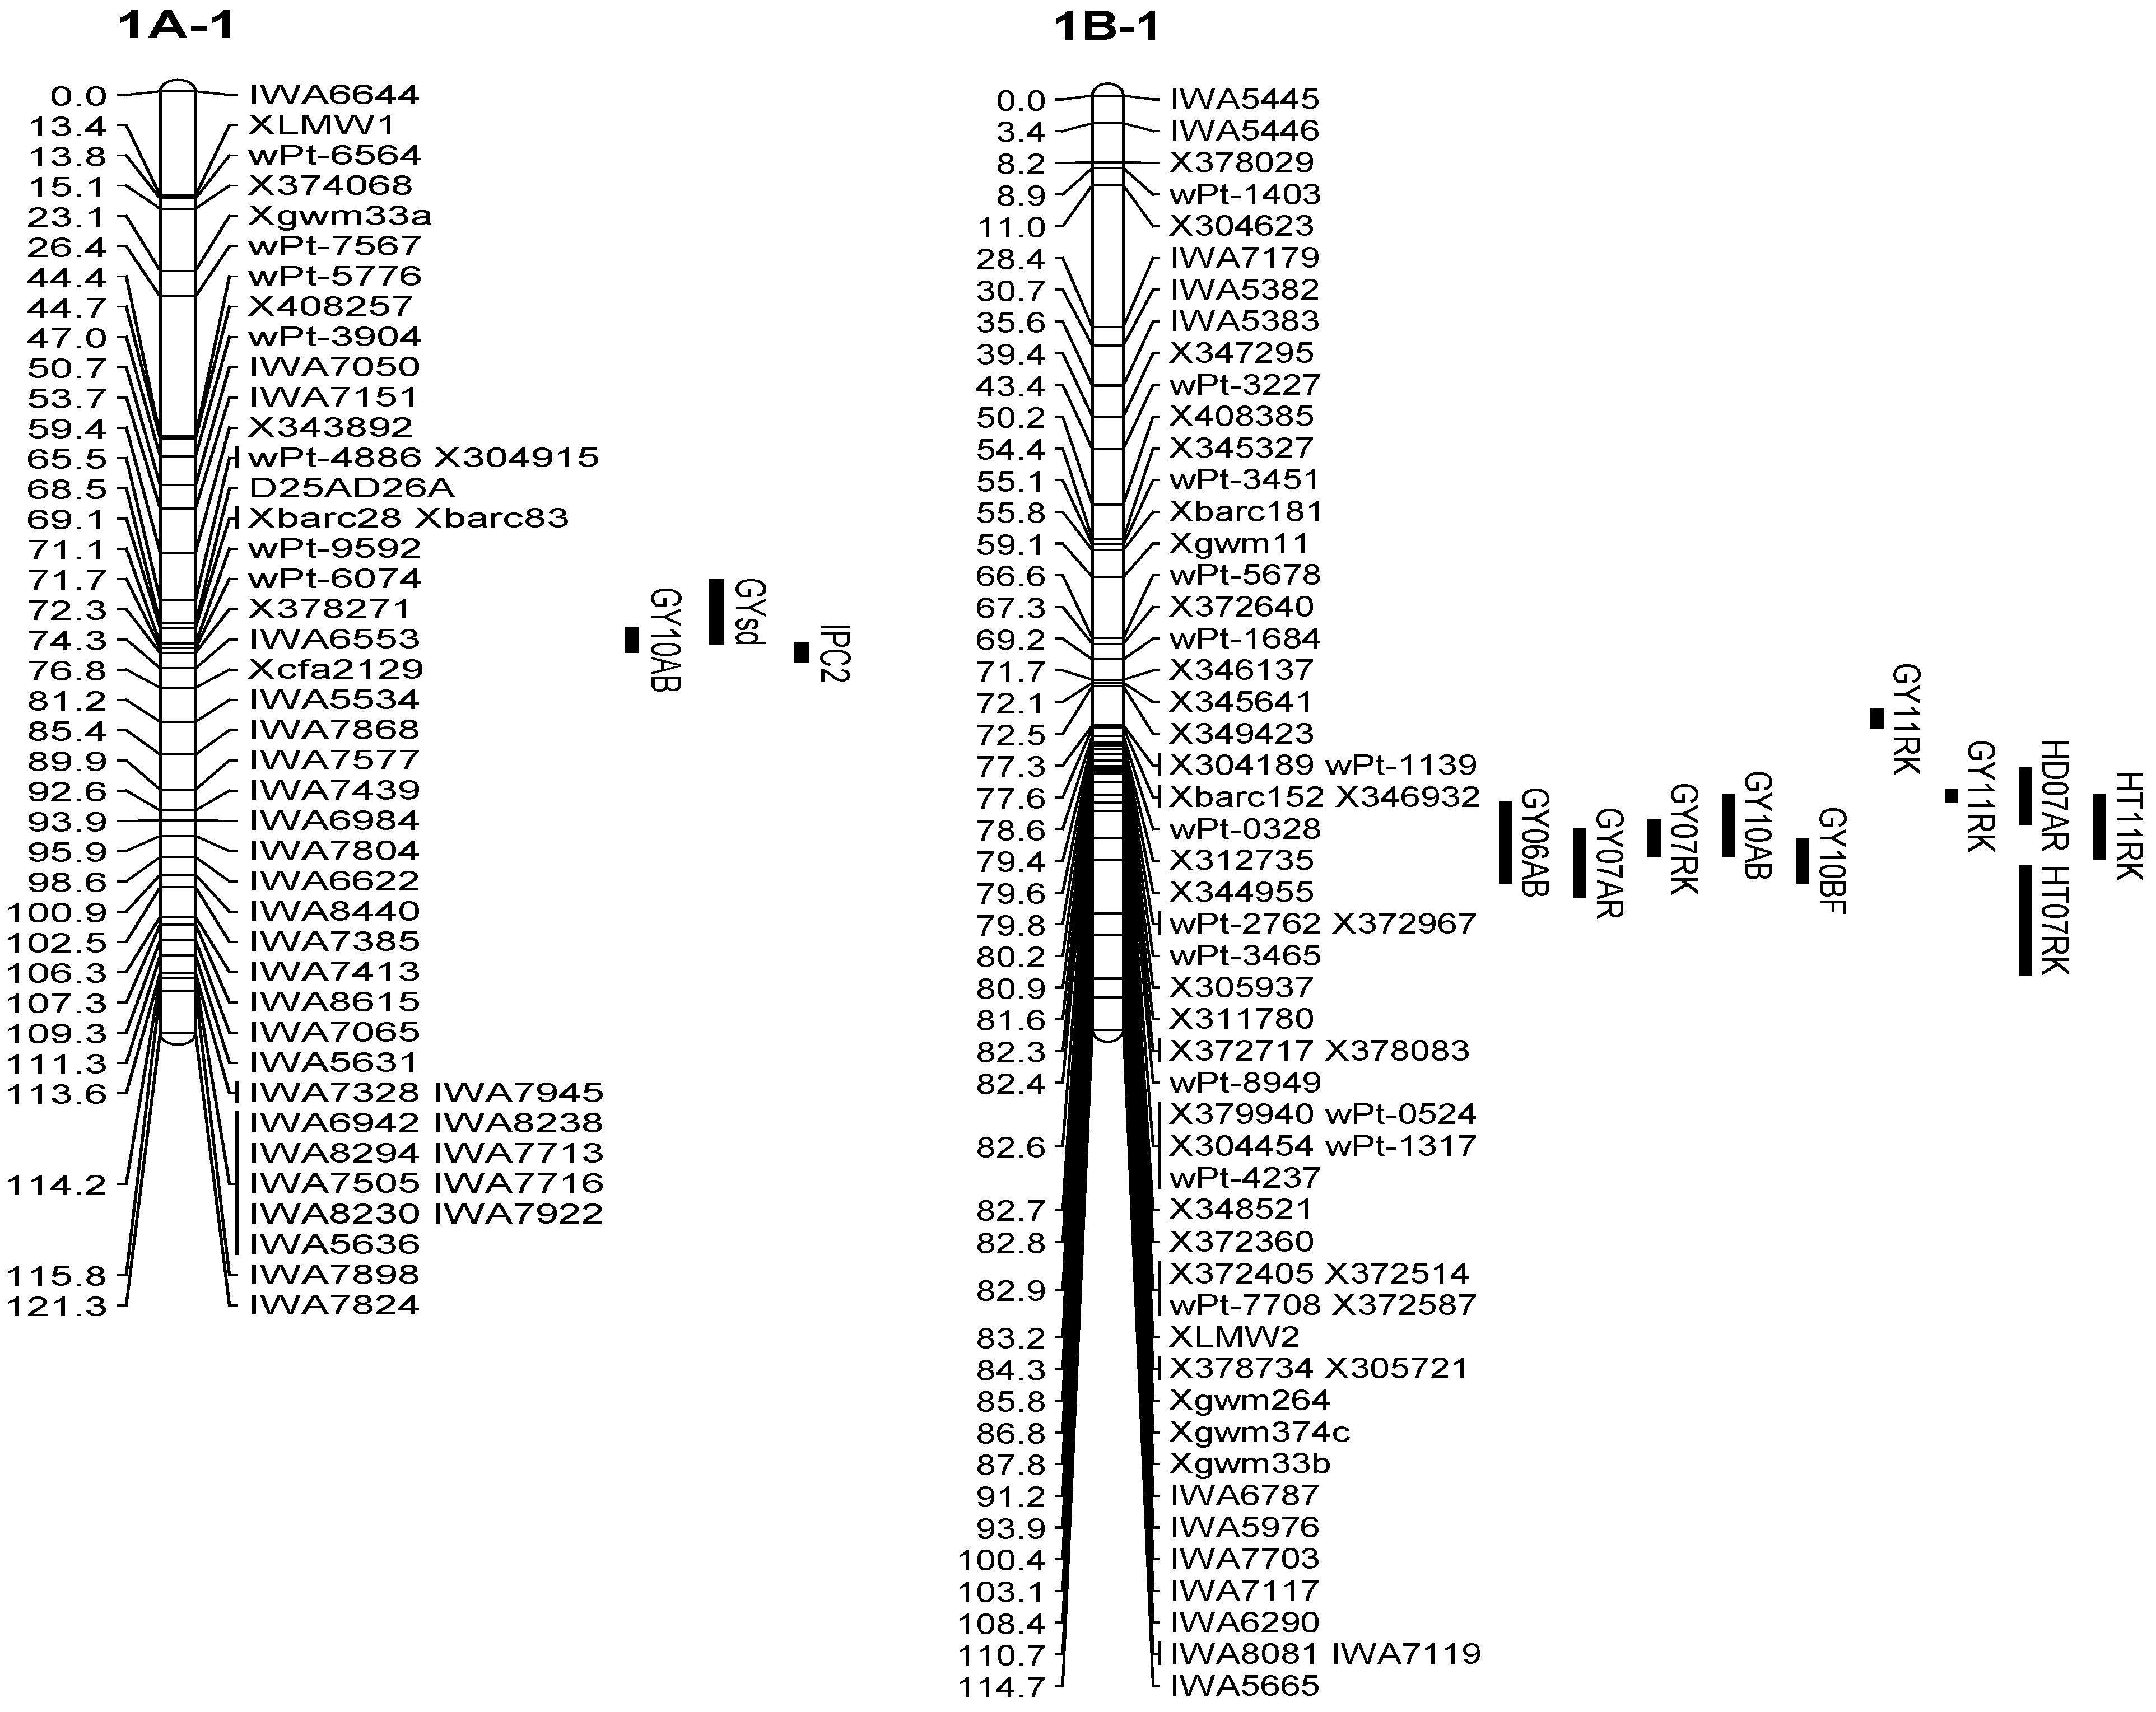
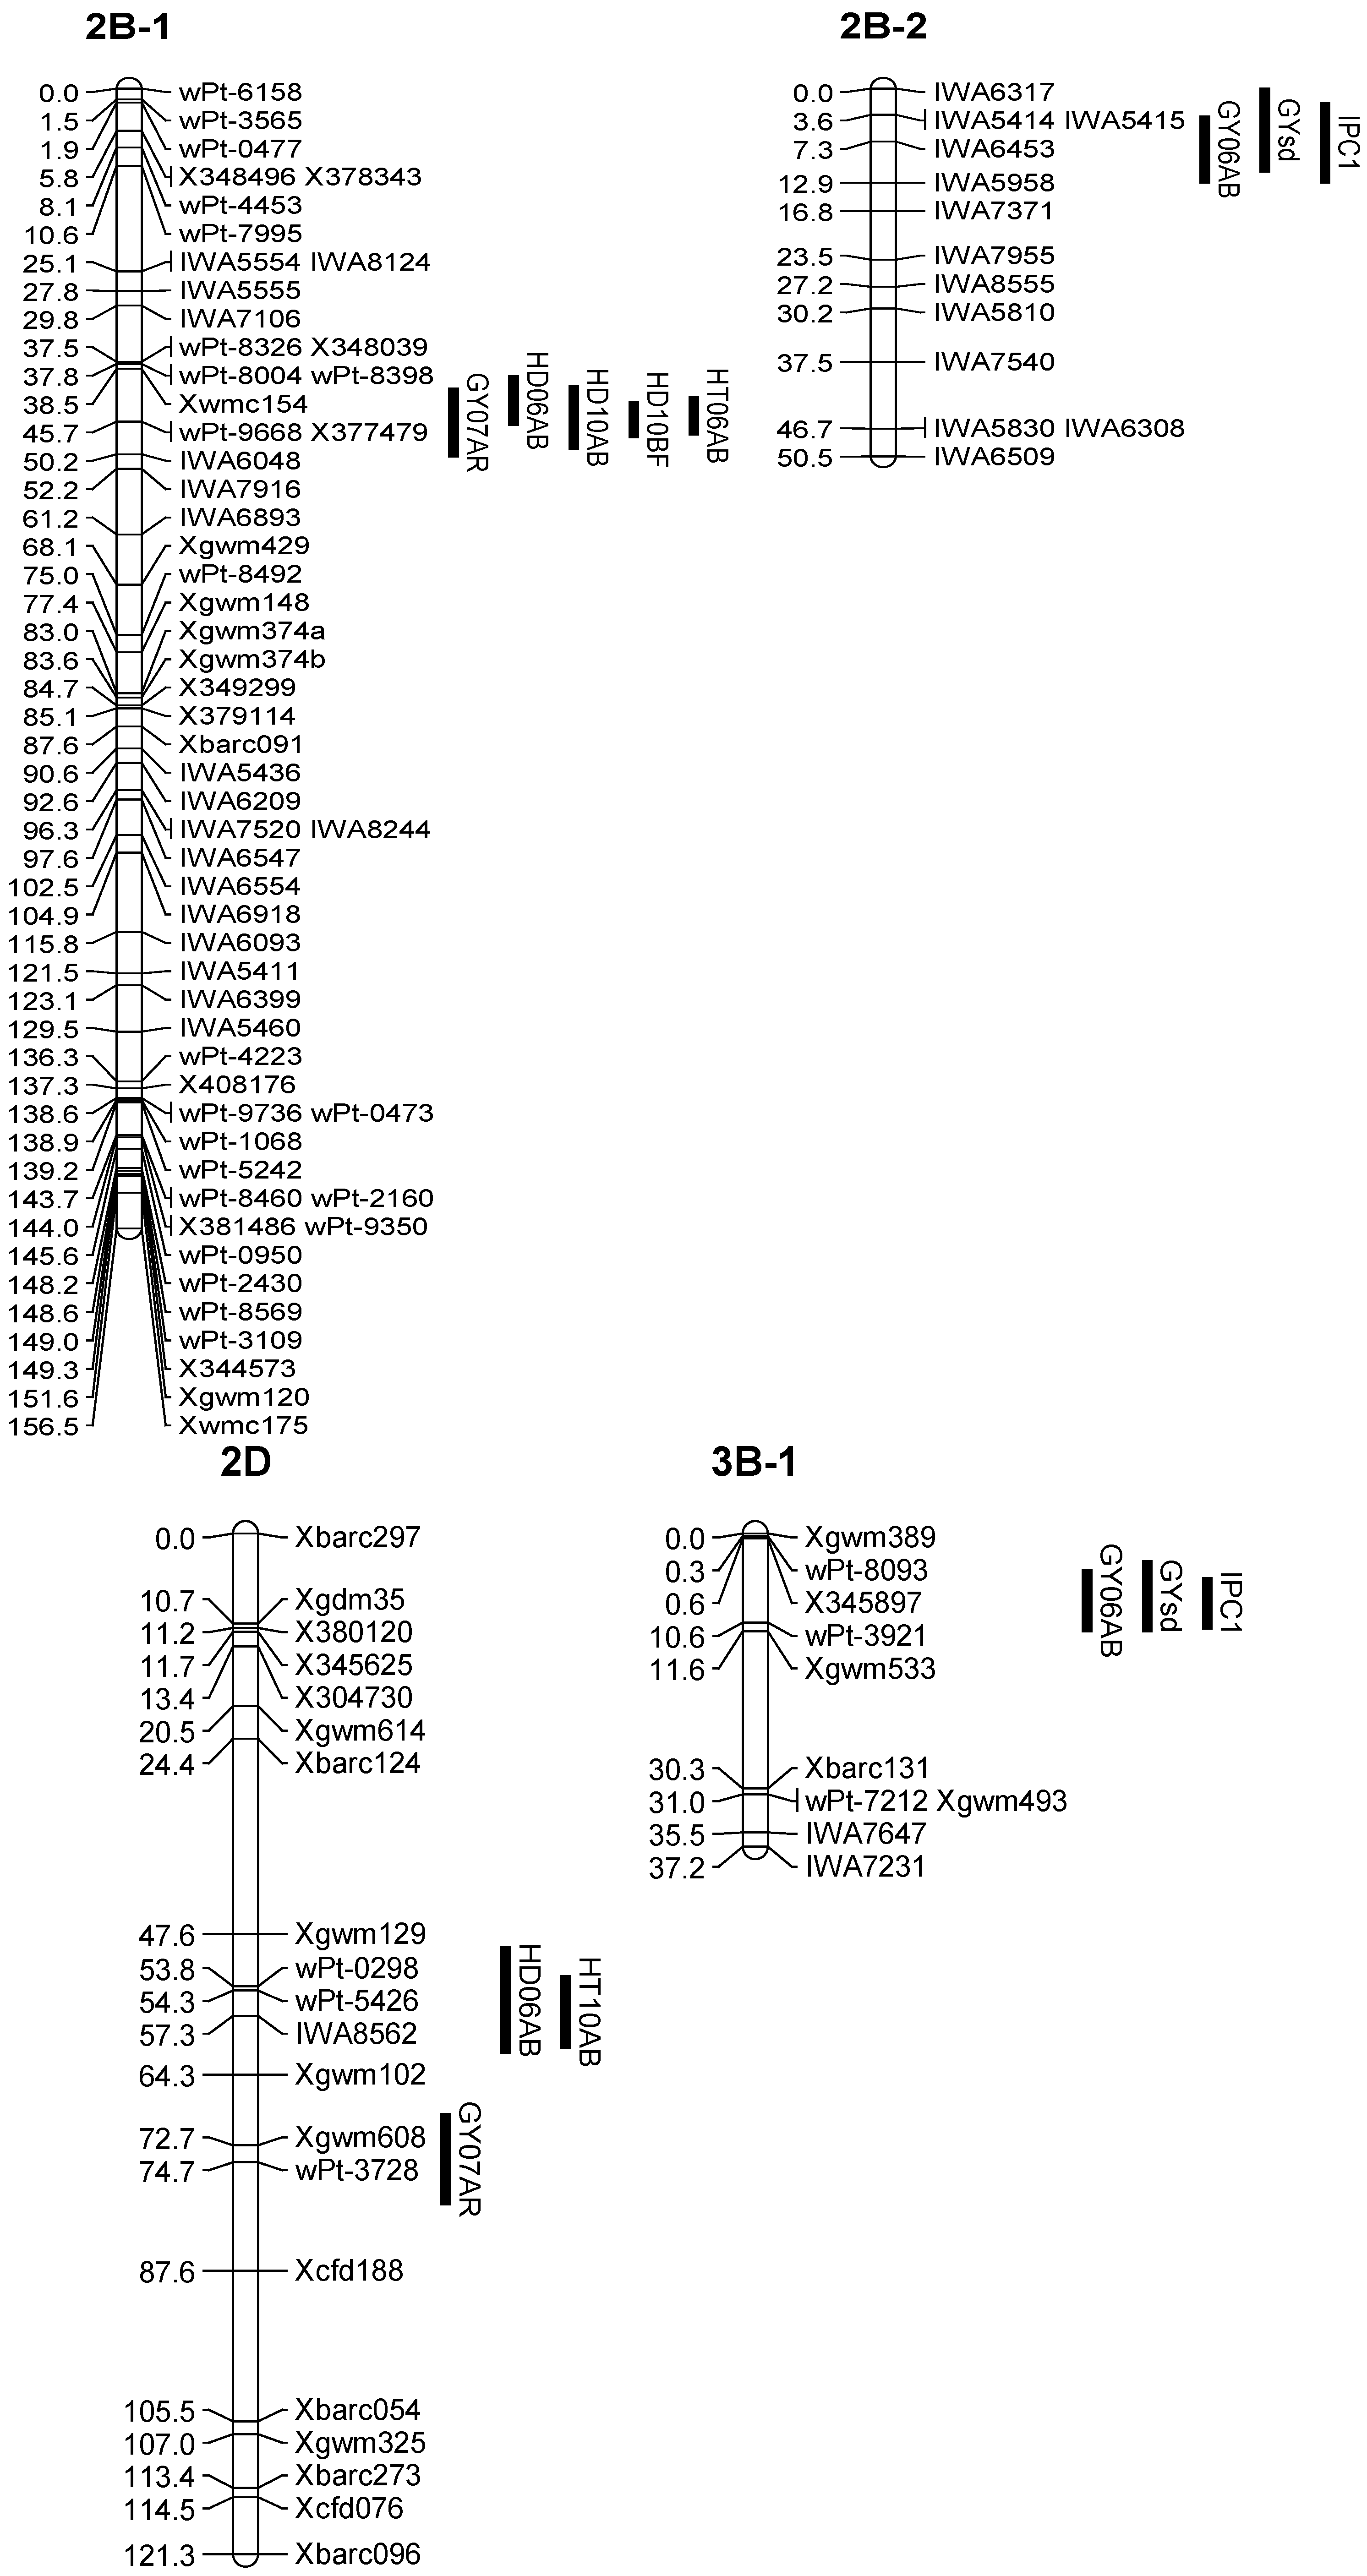
3.2. Enrichment of the Previous Genetic Maps
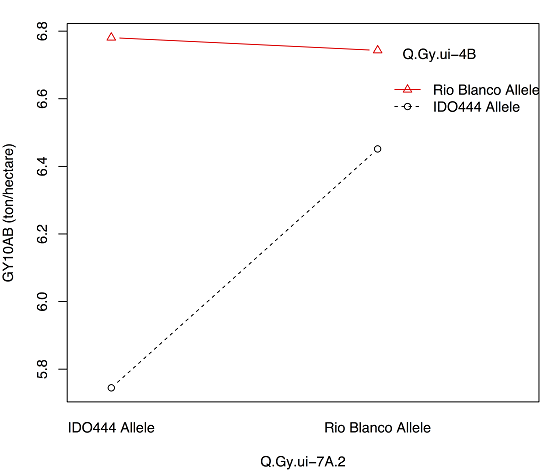
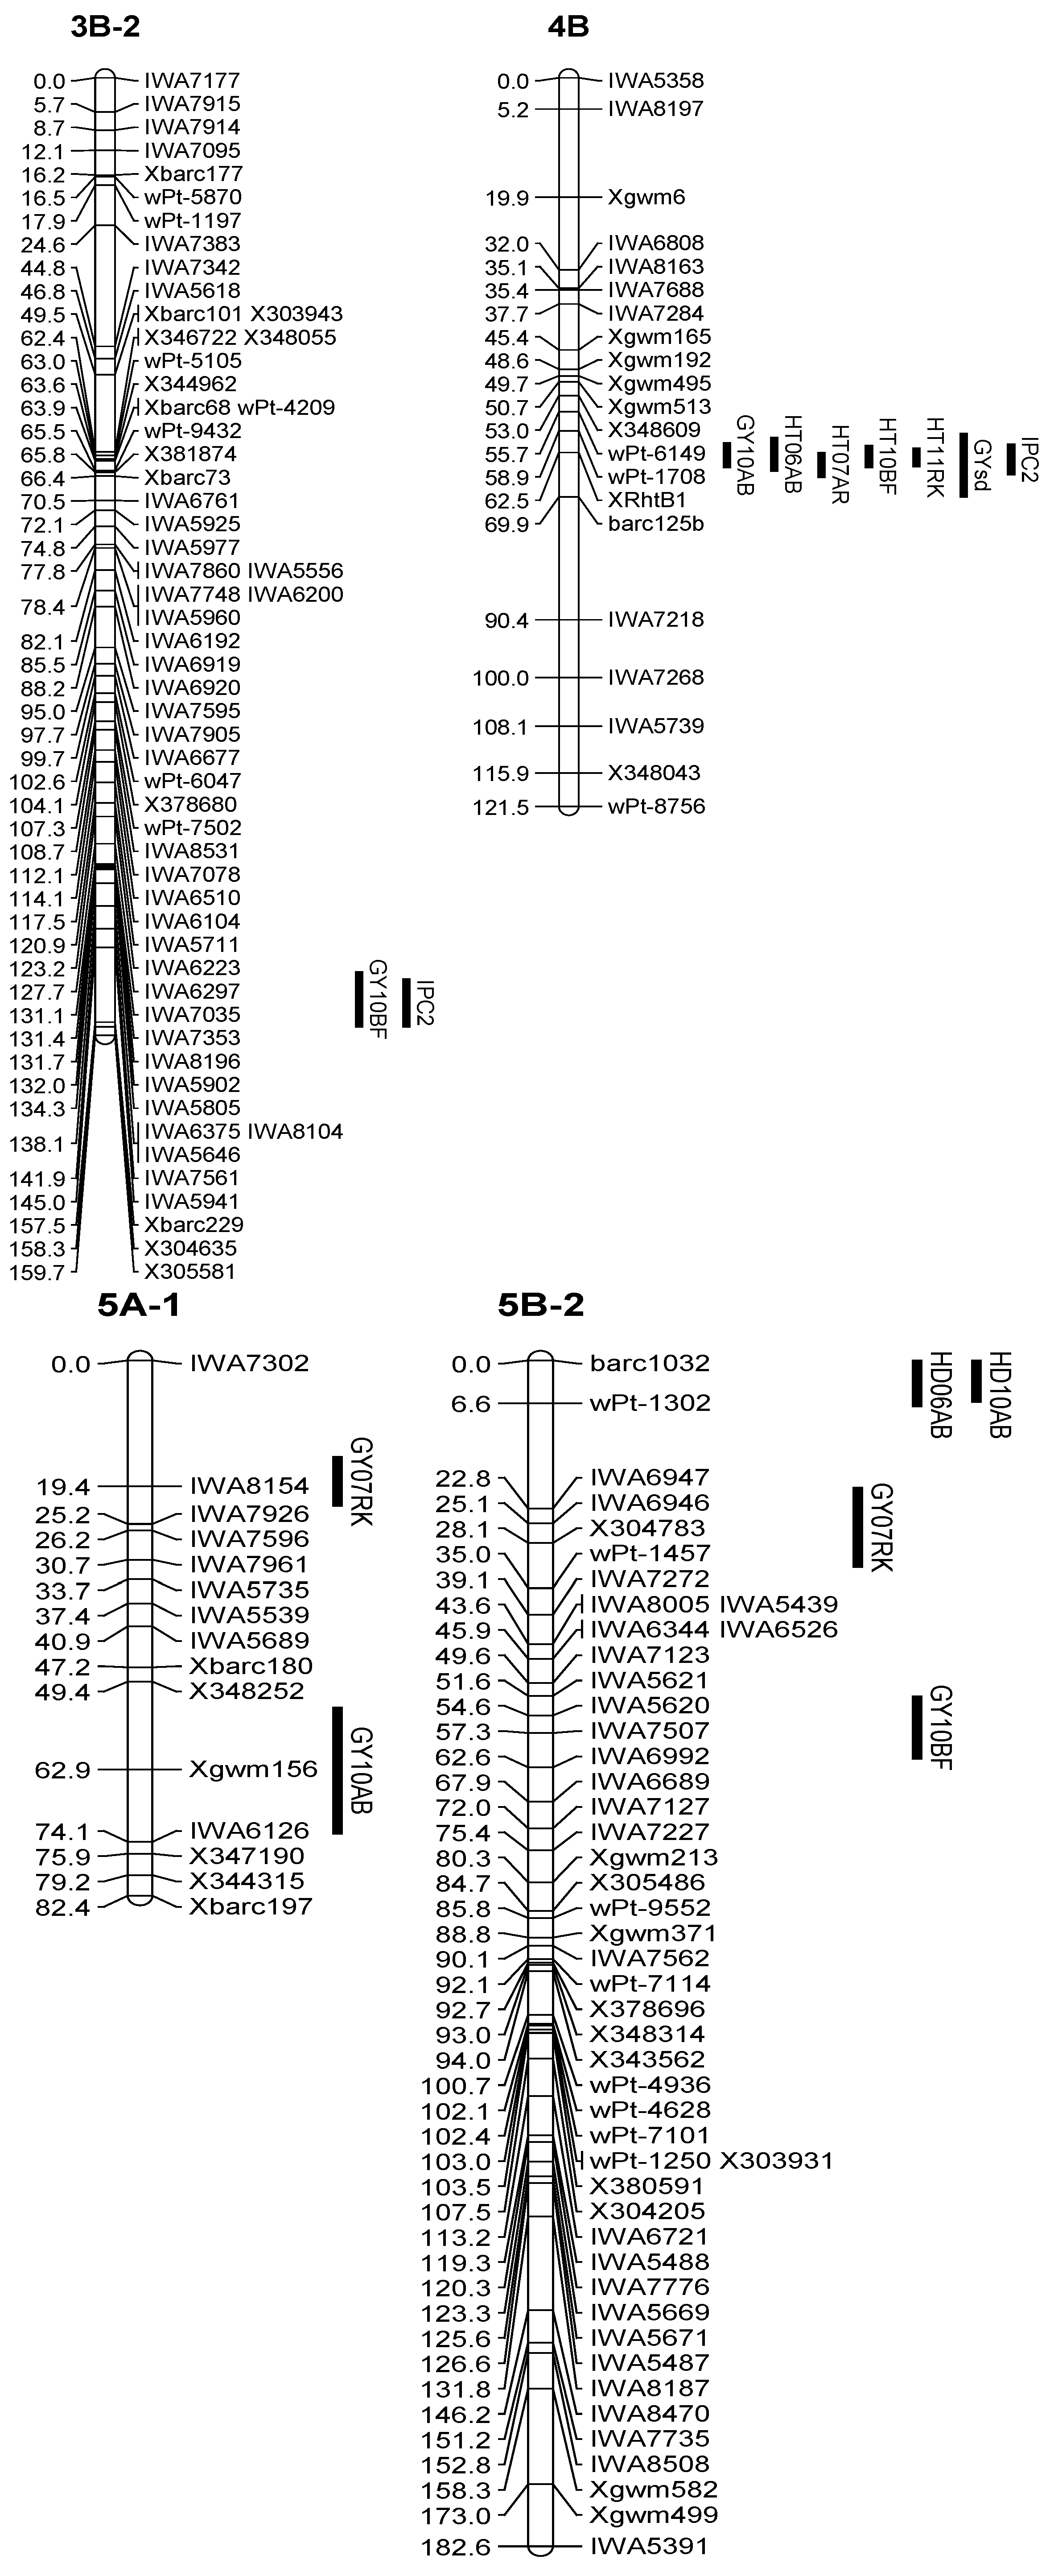
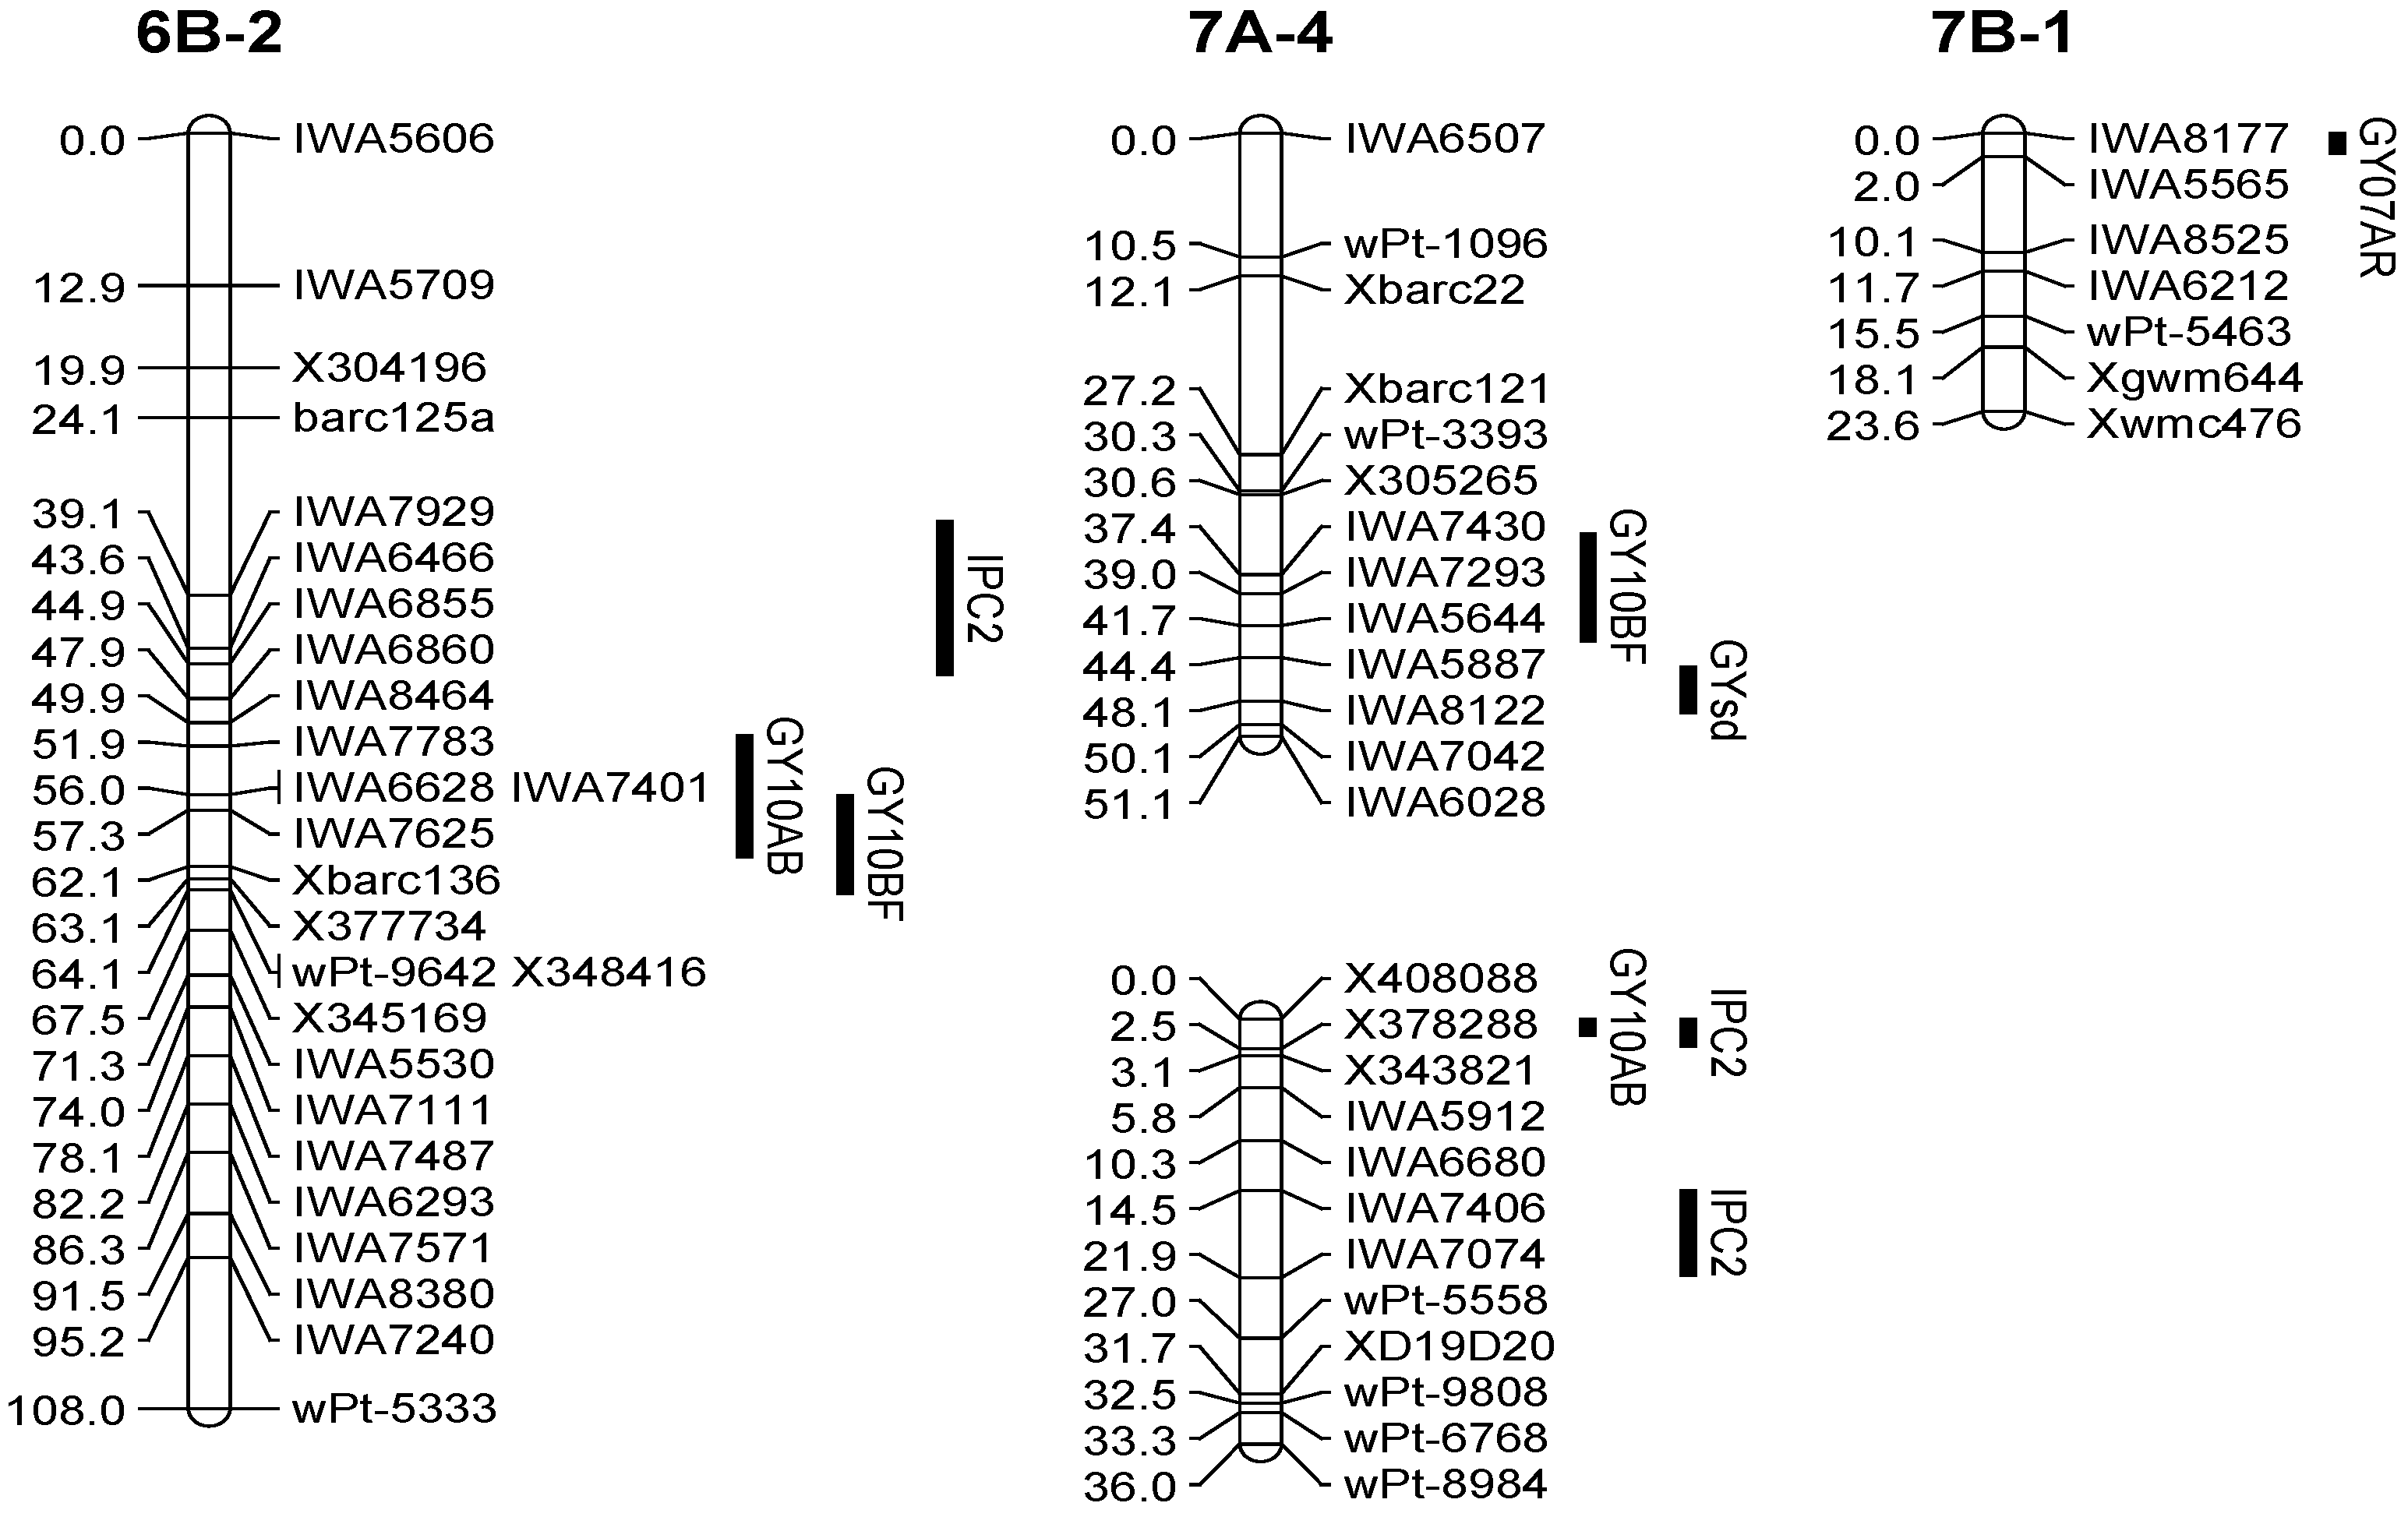
3.3. QTL Associated with the Grain Yield


| QTL | Env. | Chr. | Position | Peak Marker | LOD | Add a | R2 (%) |
|---|---|---|---|---|---|---|---|
| Q.Gy.ui-1A | 10AB | 1A-1 | 71.71 | X115497 | 6.1 | 0.23 | 11 |
| Q.Gy.ui-1B.1 | 11RK | 1B-1 | 77.31 | X304189 | 9.5 | 0.14 | 22 |
| Q.Gy.ui-1B.2 | 11RK | 1B-1 | 85.81 | Xgwm264 | 9.6 | 0.15 | 22 |
| 07RK | 1B-1 | 91.21 | IWA6787 | 3.7 | 0.10 | 8 | |
| 06AB | 1B-1 | 92.21 | IWA6787 | 4.8 | 0.25 | 9 | |
| 10AB | 1B-1 | 92.21 | IWA6787 | 3.2 | 0.17 | 6 | |
| 10BF | 1B-1 | 93.21 | IWA5976 | 3.4 | 0.14 | 7 | |
| 07AR | 1B-1 | 93.91 | IWA5976 | 4.3 | 0.09 | 9 | |
| Q.Gy.ui-2B.1 | 07AR | 2B-1 | 45.71 | X116276 | 3.9 | 0.08 | 8 |
| Q.Gy.ui-2B.2 | 06AB | 2B-2 | 8.31 | IWA6453 | 4.0 | −0.23 | 8 |
| Q.Gy.ui-2D | 07AR | 2D | 74.71 | X119684 | 2.9 | 0.07 | 6 |
| Q.Gy.ui-3B.1 | 06AB | 3B-1 | 10.61 | X116345 | 6.1 | 0.28 | 12 |
| Q.Gy.ui-3B.2 | 10BF | 3B-2 | 156.01 | Xbarc229 | 3.4 | −0.15 | 8 |
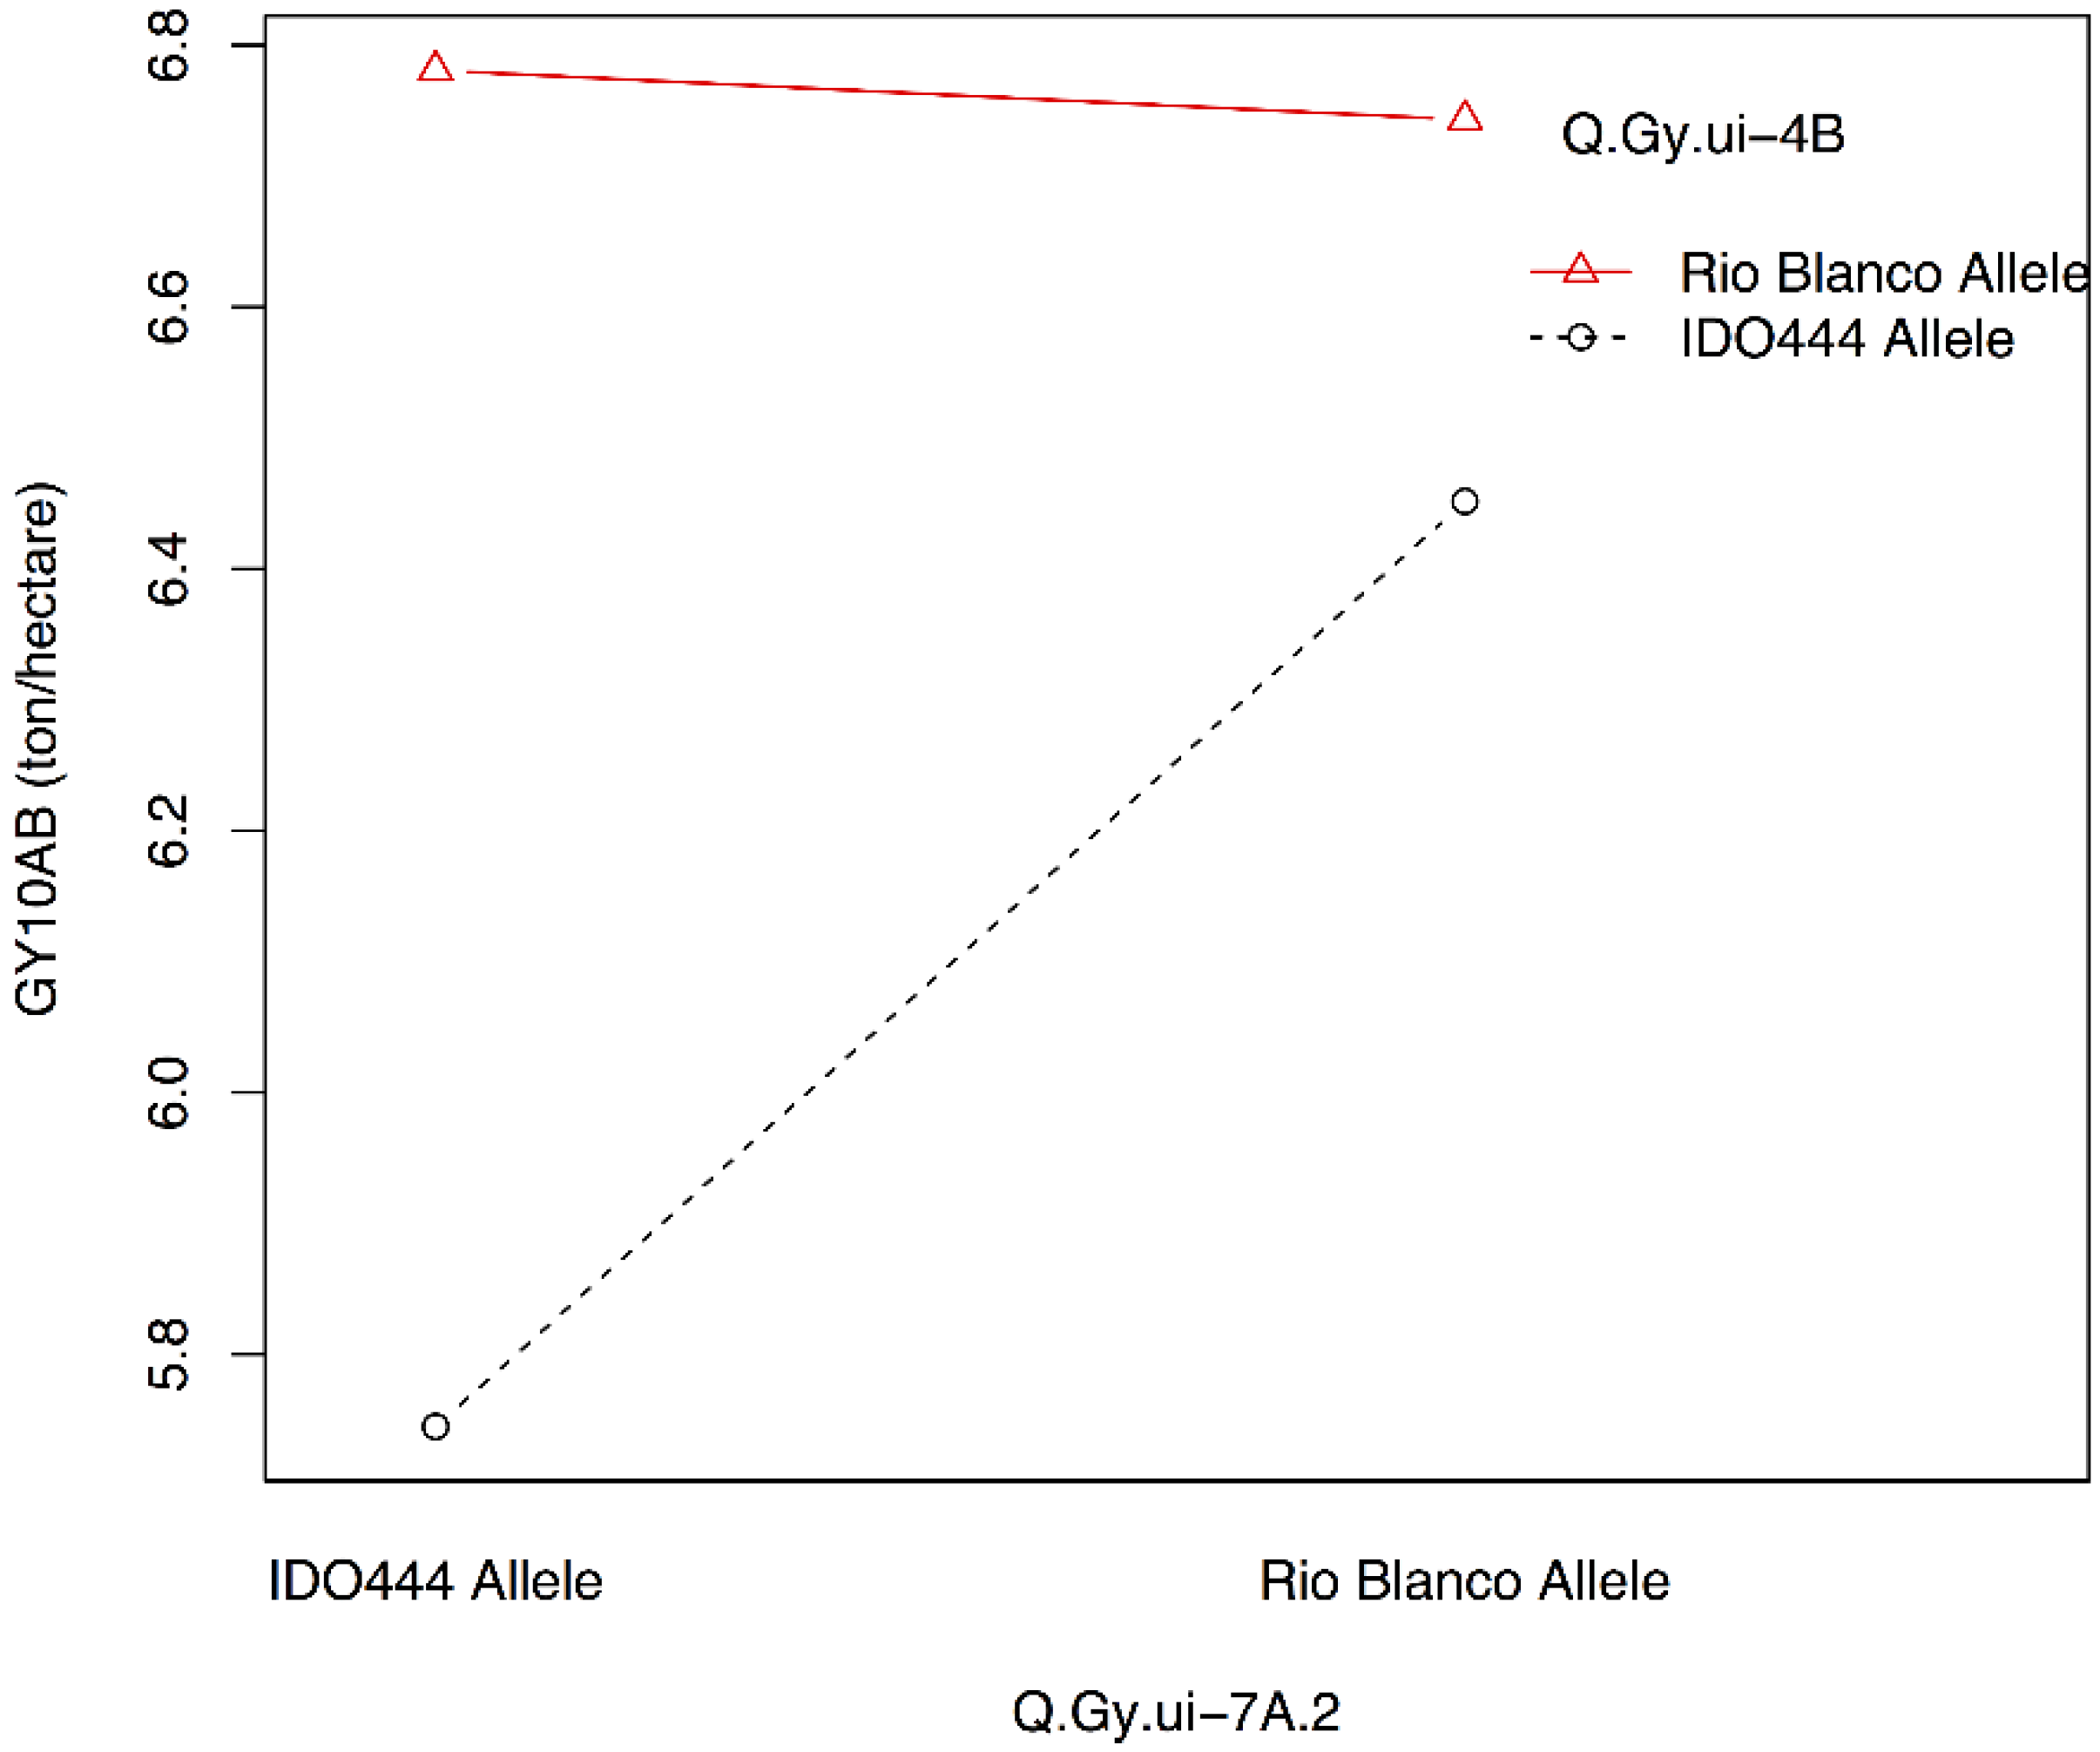
| Q.Gy.ui-4B | 10AB | 4B | 62.51 | XRhtB1 | 8.3 | −0.27 | 16 |
| Q.Gy.ui-5A.1 | 07RK | 5A-1 | 19.41 | IWA8154 | 3.5 | 0.13 | 8 |
| Q.Gy.ui-5A.2 | 10AB | 5A-1 | 65.91 | Xgwm156 | 2.8 | 0.16 | 6 |
| Q.Gy.ui-5B.1 | 07RK | 5B-2 | 25.11 | IWA6946 | 2.8 | −0.08 | 6 |
| Q.Gy.ui-5B.2 | 10BF | 5B-2 | 54.61 | IWA5620 | 4.2 | −0.15 | 8 |
| Q.Gy.ui-6B | 10AB | 6B-2 | 57.01 | IWA7625 | 2.9 | 0.15 | 5 |
| 10BF | 6B-2 | 60.31 | Xbarc136 | 2.6 | 0.12 | 5 | |
| Q.Gy.ui-7A.1 | 10BF | 7A-4 | 37.41 | IWA7430 | 3.6 | −0.14 | 7 |
| Q.Gy.ui-7A.2 | 10AB | 7A-5 | 0.01 | X408088 | 4.3 | −0.20 | 8 |
| Q.Gy.ui-7B | 07AR | 7B-1 | 0.01 | IWA8177 | 5.3 | −0.10 | 11 |
3.4. QTL Related to Genotype × Environment Interaction
| Trait a | QTL | Chr. | Position | Peak Marker | LOD | Add | R2 (%) |
|---|---|---|---|---|---|---|---|
| IPC1 | Q.Gypc1.ui-2B | 2B-2 | 8.31 | IWA6453 | 3.6 | −0.19 | 8 |
| Q.Gypc1.ui-3B | 3B-1 | 10.61 | X116345 | 6.2 | 0.26 | 15 | |
| IPC2 | Q.Gypc2.ui-1A | 1A-1 | 71.71 | X115497 | 5.2 | −0.19 | 9 |
| Q.Gypc2.ui-3B | 3B-2 | 157.51 | Xbarc229 | 2.9 | 0.14 | 5 | |
| Q.Gypc2.ui-4B | 4B | 62.51 | XRhtB1 | 9.2 | 0.26 | 17 | |
| Q.Gypc2.ui-6B | 6B-2 | 39.11 | IWA7929 | 3.0 | −0.14 | 5 | |
| Q.Gypc2.ui-7A.1 | 7A-5 | 0.01 | X408088 | 3.0 | 0.15 | 5 | |
| Q.Gypc2.ui-7A.2 | 7A-5 | 20.51 | IWA7074 | 3.2 | 0.16 | 6 | |
| GYsd | Q.Gysd.ui-1A | 1A-1 | 68.51 | D25AD26A | 2.9 | 0.07 | 6 |
| Q.Gysd.ui-2B | 2B-2 | 3.61 | IWA5414 | 3.5 | −0.07 | 7 | |
| Q.Gysd.ui-3B | 3B-1 | 7.61 | X116345 | 4.8 | 0.10 | 12 | |
| Q.Gysd.ui-4B | 4B | 64.51 | XRhtB1 | 3.5 | −0.08 | 8 | |
| Q.Gysd.ui-7A | 7A-4 | 48.11 | IWA8122 | 2.9 | −0.07 | 6 |
3.5. QTL × QTL Interaction
| Q1 | Q2 | Environment | Interaction Effect a | R2 (%) |
|---|---|---|---|---|
| Q.Gy.ui-1A | Q.Gy.ui-1B.2 | 10AB | 0.46 | 17 |
| Q.Gy.ui-3B.1 | 10AB, 10BF | 0.5 | 12 | |
| Q.Gysd.ui-3B.1 | 10BF, 11RK | 0.45 | 8 | |
| Q.Gy.ui-3B.2 | 11RK | −0.21 | 5 | |
| Q.Gy.ui-4B | 07RK | −0.32 | 9 | |
| Q.Gy.ui-1B.2 | Q.Gy.ui-2B.1 | 07RK | −0.34 | 17 |
| Q.Gy.ui-4B | 07RK | −0.2 | 11 | |
| Q.Gy.ui-5A.1 | 07AR | 0.19 | 8 | |
| Q.Gy.ui-6B | 10BF | 0.32 | 14 | |
| Q.Gy.ui-7A.2 | 06AB | −0.52 | 12 | |
| Q.Gy.ui-3B.1 | Q.Gysd.ui-1A | 07AR, 10AB, 10BF | 0.18 | 6 |
| Q.Gy.ui-2D | 07AR | −0.19 | 10 | |
| Q.Gy.ui-4B | 10BF | −0.38 | 9 | |
| Q.Gy.ui-4B | Q.Gysd.ui-1A | 07RK, 11RK | −0.29 | 8 |
| Q.Gy.ui-7A.1 | 10AB | −0.42 | 22 | |
| Q.Gy.ui-7A.2 | 10AB | −0.74 | 31 | |
| Q.Gy.ui-7B | Q.Gy.ui-2B.2 | 10AB | 0.49 | 5 |
| Q.Gy.ui-2D | 06AB | −0.59 | 6 |
3.6. QTL × Environment Interaction
| Marker | Chr. | Position | QTL | Trait | R2 (%) |
|---|---|---|---|---|---|
| D25AD26A | 1A-1 | 68.51 | Q.Gysd.ui-1A | GYsd | 6 |
| X115497 | 1A-1 | 71.71 | Q.Gy.ui-1A | GY10AB | 11 |
| X304189 | 1B-1 | 77.31 | Q.Gy.ui-1B.1 | GY11RK | 22 |
| Xgwm264 | 1B-1 | 85.81 | Q.Gy.ui-1B.2 | GY11RK | 22 |
| IWA5976 | 1B-1 | 93.91 | Q.Gy.ui-1B.2 | GY07AR, GY10BF | 7–24 |
| IWA5414 | 2B-2 | 3.61 | Q.Gysd.ui-2B | GYsd | 4–7 |
| IWA6453 | 2B-2 | 8.31 | Q.Gy.ui-2B.2, Q.Gypc1.ui-2B | GY06AB, IPC1 | 8 |
| X116345 | 3B-1 | 7.61 | Q.Gysd.ui-3B, Q.Gy.ui-3B.1, Q.Gypc1.ui-3B | GYsd, GY06AB, IPC1 | 6–12 |
| Xbarc229 | 3B-2 | 156.01 | Q.Gy.ui-3B.2, Q.Gypc2.ui-3B | GY10BF, IPC2 | 4–8 |
| XRhtB1 | 4B | 64.51 | Q.Gysd.ui-4B, Q.Gy.ui-4B, Q.Gypc2.ui-4B | GYsd, GY10AB, IPC2 | 5–17 |
| IWA8122 | 7A-4 | 48.11 | Q.Gysd.ui-7A | GYsd | 6 |
| X408088 | 7A-5 | 0.01 | Q.Gy.ui-7A.2, Q.Gypc2.ui-7A.1 | GY10AB, IPC2 | 4–8 |
3.7. QTL × QTL × Environment Interaction of Grain Yield
| Marker-1 | Marker-2 | Identified in a | QTL-1 | QTL-2 |
|---|---|---|---|---|
| IWA6787 | X408088 | AB06 | Q.Gy.ui-1B.2 | Q.Gy.ui-7A.2 |
| IWA6453 | IWA8154 | AB06 | Q.Gy.ui-2B.2 | Q.Gy.ui-5A.1 |
| IWA6453 | IWA8122 | AB06 | Q.Gy.ui-2B.2 | Q.Gysd.ui-7A |
| IWA5620 | IWA5887 | AB06 | Q.Gy.ui-5B.2 | Q.Gy.ui-7A.1 |
| IWA5887 | IWA6453 | AB06 | Q.Gy.ui-7A.1 | Q.Gy.ui-2B.2 |
| IWA7430 | IWA7625 | AB10 | Q.Gy.ui-7A.1 | Q.Gy.ui-6B |
| IWA5887 | IWA7430 | AB10 | Q.Gy.ui-7A.1 | Q.Gy.ui-7A.1 |
| X408088 | XRhtB1 | AB10 | Q.Gy.ui-7A.2 | Q.Gy.ui-4B |
| IWA8177 | X116345 | NA | Q.Gy.ui-7B | Q.Gy.ui-3B.1 |
3.8. The Pyramiding Effect of QTL for Grain Yield in the Six Environments
| Trait | QTL | R2 (%) |
|---|---|---|
| GY06AB | Q.Gy.ui-1B.2, Q.Gy.ui-2B.2, Q.Gy.ui-3B.1 | 31 |
| GY07AR | Q.Gy.ui-1B.2, Q.Gy.ui-2B.1, Q.Gy.ui-2D, Q.Gy.ui-7B | 24 |
| GY07RK | Q.Gy.ui-1B.2, Q.Gy.ui-5A.1, Q.Gy.ui-5B.1 | 18 |
| GY10AB | Q.Gy.ui-1A, Q.Gy.ui-1B.2, Q.Gy.ui-4B, Q.Gy.ui-5A.2, Q.Gy.ui-6B, Q.Gy.ui-7A.2 | 49 |
| GY10BF | Q.Gy.ui-1B.2, Q.Gy.ui-3B.2, Q.Gy.ui-5B.2, Q.Gy.ui-6B, Q.Gy.ui-7A.1 | 36 |
| GY11RK | Q.Gy.ui-1B.1 | 21 |
| Trait | QTL a | R2 (%) |
|---|---|---|
| GY06AB | Q.Gy.ui-1B.2, Q.Gy.ui-3B.1, Q.Gy.ui-1B.1/Q.Gy.ui-7A.2, Q.Gy.ui-2B.2/Q.Gy.ui-5A.1 | 39 |
| GY07AR | Q.Gy.ui-1B.2, Q.Gy.ui-2B.1, Q.Gy.ui-2D, Q.Gy.ui-7B | 24 |
| GY07RK | Q.Gy.ui-5B.1, Q.Gy.ui-1B.2/Q.Gy.ui-2B.1 | 21 |
| GY10AB | Q.Gy.ui-1A, Q.Gy.ui-1B.2, Q.Gy.ui-5A.2, Q.Gy.ui-6B, Q.Gy.ui-4B/Q.Gy.ui-7A.2 | 52 |
| GY10BF | Q.Gy.ui-5B.2, Q.Gy.ui-7A.1, Q.Gy.ui-1B.2/Q.Gy.ui-6B, Q.Gy.ui-3B.2/Q.Gy.ui-7A.2 | 41 |
| GY11RK | Q.Gy.ui-2D, Q.Gy.ui-1B.1/Q.Gy.ui-3B.2 | 24 |
4. Discussion
4.1. Major QTL Associated to Grain Yield
4.2. QTL × Environment Interactions
4.3. QTL × QTL Interactions

4.4. QTL for Genotype × Environment Interactions
4.5. Pleiotropic QTL
5. Conclusions
Acknowledgments
Author Contributions
Conflicts of Interest
References
- Cuthbert, J.L.; Somers, D.J.; Brûlé-Babel, A.L.; Brown, P.D.; Crow, G.H. Molecular mapping of quantitative trait loci for yield and yield components in spring wheat (Triticum aestivum L.). Theor. Appl. Genet. 2008, 117, 595–608. [Google Scholar] [CrossRef]
- Huang, X.Q.; Cloutier, S.; Lycar, L.; Radovanovic, N.; Humphreys, D.G.; Noll, J.S.; Somers, D.J.; Brown, P.D. Molecular detection of QTLs for agronomic and quality traits in a doubled haploid population derived from two Canadian wheats (Triticum aestivum L.). Theor. Appl. Genet. 2006, 113, 753–766. [Google Scholar] [CrossRef] [PubMed]
- Maccaferri, M.; Sanguineti, M.C.; Corneti, S.; Ortega, J.L.A.; Salem, M.B.; Bort, J.; DeAmbrogio, E.; del Moral, L.F.G.; Demontis, A.; El-Ahmed, A.; et al. Quantitative trait loci for grain yield and adaptation of durum wheat (Triticum durum Desf.) across a wide range of water availability. Genetics 2008, 178, 489–511. [Google Scholar] [CrossRef] [PubMed]
- McCartney, C.A.; Somers, D.J.; Humphreys, D.G.; Lukow, O.; Ames, N.; Noll, J.; Cloutier, S.; McCallum, B.D. Mapping quantitative trait loci controlling agronomic traits in the spring wheat cross RL4452x’AC Domain’. Genome Natl. Res. Counc. Can. 2005, 48, 870–883. [Google Scholar]
- McIntyre, C.L.; Mathews, K.L.; Rattey, A.; Chapman, S.C.; Drenth, J.; Ghaderi, M.; Reynolds, M.; Shorter, R. Molecular detection of genomic regions associated with grain yield and yield-related components in an elite bread wheat cross evaluated under irrigated and rainfed conditions. Theor. Appl. Genet. 2010, 120, 527–541. [Google Scholar] [CrossRef] [PubMed]
- Mackay, T.F.C.; Stone, E.A.; Ayroles, J.F. The genetics of quantitative traits: Challenges and prospects. Nat. Rev. Genet. 2009, 10, 565–577. [Google Scholar] [CrossRef] [PubMed]
- Ungerer, M.C.; Halldorsdottir, S.S.; Purugganan, M.D.; Mackay, T.F.C. Genotype-Environment Interactions at Quantitative Trait Loci Affecting Inflorescence Development in Arabidopsis thaliana. Genetics 2003, 165, 353–365. [Google Scholar] [PubMed]
- Campbell, B.T.; Baenziger, P.S.; Eskridge, K.M.; Budak, H.; Streck, N.A.; Weiss, A.; Gill, K.S.; Erayman, M. Using environmental covariates to explain genotype × environment and QTL × environment interactions for agronomic traits on chromosome 3A of wheat. Crop Sci. 2004, 44, 620–627. [Google Scholar] [CrossRef]
- Gauch, H.G. Statistical Analysis of Yield Trials by AMMI and GGE. Crop Sci. 2006, 46, 1488–1500. [Google Scholar] [CrossRef]
- Gauch, H.G.; Rodrigues, P.C.; Munkvold, J.D.; Heffner, E.L.; Sorrells, M. Two new strategies for detecting and understanding QTL × environment interactions. Crop Sci. 2011, 51, 96–113. [Google Scholar] [CrossRef]
- Yan, W.; Kang, M.S. Gge Biplot Analysis: A Graphical Tool for Breeders, Geneticists, and Agronomists; CRC Press: Boca Raton, FL, USA, 2002. [Google Scholar]
- Yin, X.; Struik, P.C.; van Eeuwijk, F.A.; Stam, P.; Tang, J. QTL analysis and QTL-based prediction of flowering phenology in recombinant inbred lines of barley. J. Exp. Bot. 2005, 56, 967–976. [Google Scholar] [CrossRef] [PubMed]
- Erickson, D. Quantitative trait loci: Mapping the future of QTL’s. Heredity 2005, 95, 417–418. [Google Scholar] [CrossRef] [PubMed]
- Cao, G.; Zhu, J.; He, C.; Gao, Y.; Yan, J.; Wu, P. Impact of epistasis and QTL × environment interaction on the developmental behavior of plant height in rice (Oryza sativa L.). Theor. Appl. Genet. 2001, 103, 153–160. [Google Scholar] [CrossRef]
- Wang, Z.; Cheng, J.; Chen, Z.; Huang, J.; Bao, Y.; Wang, J.; Zhang, H. Identification of QTLs with main, epistatic and QTL × environment interaction effects for salt tolerance in rice seedlings under different salinity conditions. Theor. Appl. Genet. 2012, 125, 807–815. [Google Scholar] [CrossRef] [PubMed]
- Ma, X.Q.; Tang, J.H.; Teng, W.T.; Yan, J.B.; Meng, Y.J.; Li, J.S. Epistatic interaction is an important genetic basis of grain yield and its components in maize. Mol. Breed. 2007, 20, 41–51. [Google Scholar] [CrossRef]
- Yan, J.; Tang, H.; Huang, Y.; Zheng, Y.; Li, J. Quantitative trait loci mapping and epistatic analysis for grain yield and yield components using molecular markers with an elite maize hybrid. Euphytica 2006, 149, 121–131. [Google Scholar] [CrossRef]
- Shen, X.; Zhang, T.; Guo, W.; Zhu, X.; Zhang, X. Mapping fiber and yield QTLs with main, epistatic, and QTL × environment interaction effects in recombinant inbred lines of upland cotton. Crop Sci. 2006, 46, 61–66. [Google Scholar] [CrossRef]
- Juenger, T.E.; Sen, S.; Stowe, K.A.; Simms, E.L. Epistasis and genotype-environment interaction for quantitative trait loci affecting flowering time in Arabidopsis thaliana. Genetica 2005, 123, 87–105. [Google Scholar] [CrossRef] [PubMed]
- Rebetzke, G.J.; Ellis, M.H.; Bonnett, D.G.; Richards, R.A. Molecular mapping of genes for Coleoptile growth in bread wheat (Triticum aestivum L.). Theor. Appl. Genet. 2007, 114, 1173–1183. [Google Scholar] [CrossRef] [PubMed]
- Wu, X.; Wang, Z.; Chang, X.; Jing, R. Genetic dissection of the developmental behaviours of plant height in wheat under diverse water regimes. J. Exp. Bot. 2010, 61, 2923–2937. [Google Scholar] [CrossRef] [PubMed]
- Zhang, K.; Tian, J.; Zhao, L.; Wang, S. Mapping QTLs with epistatic effects and QTL × environment interactions for plant height using a doubled haploid population in cultivated wheat. J. Genet. Genomics 2008, 35, 119–127. [Google Scholar] [CrossRef] [PubMed]
- Ma, H.-X.; Bai, G.-H.; Zhang, X.; Lu, W.-Z. Main effects, epistasis, and environmental interactions of quantitative trait loci for Fusarium head blight resistance in a recombinant inbred population. Phytopathology 2006, 96, 534–541. [Google Scholar] [CrossRef] [PubMed]
- Yang, Z.; Gilbert, J.; Fedak, G.; Somers, D.J. Genetic characterization of QTL associated with resistance to Fusarium head blight in a doubled-haploid spring wheat population. Genome 2005, 48, 187–196. [Google Scholar] [CrossRef] [PubMed]
- Zhou, W.; Kolb, F.L.; Bai, G.; Shaner, G.; Domier, L.L. Genetic analysis of scab resistance QTL in wheat with microsatellite and AFLP markers. Genome Natl. Res. Counc. Can. 2002, 45, 719–727. [Google Scholar]
- Ma, W.; Appels, R.; Bekes, F.; Larroque, O.; Morell, M.K.; Gale, K.R. Genetic characterisation of dough rheological properties in a wheat doubled haploid population: Additive genetic effects and epistatic interactions. Theor. Appl. Genet. 2005, 111, 410–422. [Google Scholar] [CrossRef] [PubMed]
- Mann, G.; Diffey, S.; Cullis, B.; Azanza, F.; Martin, D.; Kelly, A.; McIntyre, L.; Schmidt, A.; Ma, W.; Nath, Z.; et al. Genetic control of wheat quality: Interactions between chromosomal regions determining protein content and composition, dough rheology, and sponge and dough baking properties. Theor. Appl. Genet. 2009, 118, 1519–1537. [Google Scholar] [CrossRef] [PubMed]
- Kulwal, P.; Kumar, N.; Kumar, A.; Gupta, R.K.; Balyan, H.S.; Gupta, P.K. Gene networks in hexaploid wheat: Interacting quantitative trait loci for grain protein content. Funct. Integr. Genomics 2005, 5, 254–259. [Google Scholar] [CrossRef] [PubMed]
- Kulwal, P.L.; Singh, R.; Balyan, H.S.; Gupta, P.K. Genetic basis of pre-harvest sprouting tolerance using single-locus and two-locus QTL analyses in bread wheat. Funct. Integr. Genomics 2004, 4, 94–101. [Google Scholar] [CrossRef] [PubMed]
- Mohan, A.; Kulwal, P.; Singh, R.; Kumar, V.; Mir, R.R.; Kumar, J.; Prasad, M.; Balyan, H.S.; Gupta, P.K. Genome-wide QTL analysis for pre-harvest sprouting tolerance in bread wheat. Euphytica 2009, 168, 319–329. [Google Scholar] [CrossRef]
- Yang, D.-L.; Jing, R.-L.; Chang, X.-P.; Li, W. Identification of quantitative trait loci and environmental interactions for accumulation and remobilization of water-soluble carbohydrates in wheat (Triticum aestivum L.) stems. Genetics 2007, 176, 571–584. [Google Scholar] [CrossRef] [PubMed]
- Kumar, N.; Kulwal, P.L.; Balyan, H.S.; Gupta, P.K. QTL mapping for yield and yield contributing traits in two mapping populations of bread wheat. Mol. Breed. 2007, 19, 163–177. [Google Scholar] [CrossRef]
- Wu, X.; Chang, X.; Jing, R. Genetic insight into yield-associated traits of wheat grown in multiple rain-fed environments. PLoS One 2012, 7. [Google Scholar] [CrossRef] [PubMed]
- Chen, J.; Chu, C.; Souza, E.J.; Guttieri, M.J.; Chen, X.; Xu, S.; Hole, D.; Zemetra, R. Genome-wide identification of QTL conferring high-temperature adult-plant (HTAP) resistance to stripe rust (Puccinia striiformis f. sp. tritici) in wheat. Mol. Breed. 2012, 29, 791–800. [Google Scholar] [CrossRef]
- Wu, J.; Carver, B.F. Sprout damage and preharvest sprout resistance in hard white winter wheat. Crop Sci. 1999, 39, 441–447. [Google Scholar] [CrossRef]
- Carver, B.F.; Krenzer, E.G.; Hunger, R.M.; Martin, T.J.; Klatt, A.R.; Porter, D.R.; Verchot, J.; Rayas-Duarte, P.; Guenzi, A.C.; Martin, B.C.; Bai, G. Registration of “Intrada” wheat. Crop Sci. 2003, 43, 1135–1136. [Google Scholar] [CrossRef]
- Haley, S.D.; Quick, J.S.; Martin, T.J.; Johnson, J.J.; Peairs, F.B.; Stromberger, J.A.; Clayshulte, S.R.; Clifford, B.L.; Rudolph, J.B. Registration of “Avalanche” wheat. Crop Sci. 2003, 43, 432–432. [Google Scholar] [CrossRef]
- Martin, T.J.; Sears, R.G.; Seifers, D.L.; Harvey, T.L.; Witt, M.D.; Schlegel, A.J.; McCluskey, P.J.; Hatchett, J.H. Registration of “Trego” Wheat. Crop Sci. 2001, 41, 929–930. [Google Scholar] [CrossRef]
- Windes, J.M.; Souza, E.; Sunderman, D.W.; Goates, B. Registration of four dwarf bunt resistant wheat germplasm: Idaho 352, Idaho 364, Idaho 443, and Idaho 444. Crop Sci 1995, 35, 1239–1240. [Google Scholar] [CrossRef]
- National Climate Data Center. Avaliable online: http://www.ncdc.noaa.gov/IPS/coop/coop.html (accessed on 2 December 2014).
- Butler, D.; Cullis, B.R.; Gilmour, A.R.; Gogel, B.J. ASReml-R Reference Manual; Queensland Department of Primary Industries and Fisheries: Brisbane, Australia, 2009. [Google Scholar]
- R Core Team. R: A Language and Environment for Statistical Computing; R Foundation for Statistical Computing: Vienna, Austria, 2012. [Google Scholar]
- Cavanagh, C.R.; Chao, S.; Wang, S.; Huang, B.E.; Stephen, S.; Kiani, S.; Forrest, K.; Saintenac, C.; Brown-Guedira, G.L.; Akhunova, A.; et al. Genome-wide comparative diversity uncovers multiple targets of selection for improvement in hexaploid wheat landraces and cultivars. Proc. Natl. Acad. Sci. USA 2013, 110, 8057–8062. [Google Scholar] [CrossRef] [PubMed]
- Wu, Y.; Bhat, P.R.; Close, T.J.; Lonardi, S. Efficient and accurate construction of genetic linkage maps from the minimum spanning tree of a graph. PLoS Genet. 2008, 4. [Google Scholar] [CrossRef] [PubMed]
- Lander, E.S.; Green, P.; Abrahamson, J.; Barlow, A.; Daly, M.J.; Lincoln, S.E.; Newburg, L. MAPMAKER: An interactive computer package for constructing primary genetic linkage maps of experimental and natural populations. Genomics 1987, 1, 174–181. [Google Scholar] [CrossRef] [PubMed]
- Windows QTL Cartographer, Version 2.5_011; North Carolina State University: Department of Statistics; North Carolina State University: Raleigh, NC, USA, 2012.
- Lander, E.S.; Botstein, D. Mapping mendelian factors underlying quantitative traits using RFLP linkage maps. Genetics 1989, 121, 185–199. [Google Scholar] [PubMed]
- Huang, X.Q.; Cöster, H.; Ganal, M.W.; Röder, M.S. Advanced backcross QTL analysis for the identification of quantitative trait loci alleles from wild relatives of wheat (Triticum aestivum L.). Theor. Appl. Genet. 2003, 106, 1379–1389. [Google Scholar] [PubMed]
- Kuchel, H.; Williams, K.J.; Langridge, P.; Eagles, H.A.; Jefferies, S.P. Genetic dissection of grain yield in bread wheat. I. QTL analysis. Theor. Appl. Genet. 2007, 115, 1029–1041. [Google Scholar] [CrossRef] [PubMed]
- Mathews, K.L.; Malosetti, M.; Chapman, S.; McIntyre, L.; Reynolds, M.; Shorter, R.; van Eeuwijk, F. Multi-environment QTL mixed models for drought stress adaptation in wheat. Theor. Appl. Genet. 2008, 117, 1077–1091. [Google Scholar] [CrossRef] [PubMed]
- Pinto, R.S.; Reynolds, M.P.; Mathews, K.L.; McIntyre, C.L.; Olivares-Villegas, J.-J.; Chapman, S.C. Heat and drought adaptive QTL in a wheat population designed to minimize confounding agronomic effects. Theor. Appl. Genet. 2010, 121, 1001–1021. [Google Scholar] [CrossRef] [PubMed]
- Quarrie, S.A.; Steed, A.; Calestani, C.; Semikhodskii, A.; Lebreton, C.; Chinoy, C.; Steele, N.; Pljevljakusić, D.; Waterman, E.; Weyen, J.; et al. A high-density genetic map of hexaploid wheat (Triticum aestivum L.) from the cross Chinese Spring × SQ1 and its use to compare QTLs for grain yield across a range of environments. Theor. Appl. Genet. 2005, 110, 865–880. [Google Scholar] [CrossRef] [PubMed]
- Wang, J.; Liu, W.; Wang, H.; Li, L.; Wu, J.; Yang, X.; Li, X.; Gao, A. QTL mapping of yield-related traits in the wheat germplasm 3228. Euphytica 2011, 177, 277–292. [Google Scholar] [CrossRef]
- Bennett, D.; Reynolds, M.; Mullan, D.; Izanloo, A.; Kuchel, H.; Langridge, P.; Schnurbusch, T. Detection of two major grain yield QTL in bread wheat (Triticum aestivum L.) under heat, drought and high yield potential environments. Theor. Appl. Genet. 2012, 125, 1473–1485. [Google Scholar] [CrossRef] [PubMed]
- Bennett, D.; Izanloo, A.; Reynolds, M.; Kuchel, H.; Langridge, P.; Schnurbusch, T. Genetic dissection of grain yield and physical grain quality in bread wheat (Triticum aestivum L.) under water-limited environments. Theor. Appl. Genet. 2012, 125, 255–271. [Google Scholar] [CrossRef] [PubMed]
- Huang, X.Q.; Kempf, H.; Ganal, M.W.; Röder, M.S. Advanced backcross QTL analysis in progenies derived from a cross between a German elite winter wheat variety and a synthetic wheat (Triticum aestivum L.). Theor. Appl. Genet. 2004, 109, 933–943. [Google Scholar] [CrossRef] [PubMed]
- Kato, K.; Miura, H.; Sawada, S. Mapping QTLs controlling grain yield and its components on chromosome 5A of wheat. Theor. Appl. Genet. 2000, 101, 1114–1121. [Google Scholar] [CrossRef]
- Kirigwi, F.M.; Ginkel, M.V.; Brown-Guedira, G.; Gill, B.S.; Paulsen, G.M.; Fritz, A.K. Markers associated with a QTL for grain yield in wheat under drought. Mol. Breed. 2007, 20, 401–413. [Google Scholar] [CrossRef]
- Li, S.; Jia, J.; Wei, X.; Zhang, X.; Li, L.; Chen, H.; Fan, Y.; Sun, H.; Zhao, X.; Lei, T.; Xu, Y.; et al. A intervarietal genetic map and QTL analysis for yield traits in wheat. Mol. Breed. 2007, 20, 167–178. [Google Scholar] [CrossRef]
- Marza, F.; Bai, G.-H.; Carver, B.F.; Zhou, W.-C. Quantitative trait loci for yield and related traits in the wheat population Ning7840 × Clark. Theor. Appl. Genet. 2006, 112, 688–698. [Google Scholar] [CrossRef] [PubMed]
- Narasimhamoorthy, B.; Gill, B.S.; Fritz, A.K.; Nelson, J.C.; Brown-Guedira, G.L. Advanced backcross QTL analysis of a hard winter wheat × synthetic wheat population. Theor. Appl. Genet. 2006, 112, 787–796. [Google Scholar] [CrossRef] [PubMed]
- Via, S.; Gomulkiewicz, R.; de Jong, G.; Scheiner, S.M.; Schlichting, C.D.; van Tienderen, P.H. Adaptive phenotypic plasticity: Consensus and controversy. Trends Ecol. Evol. 1995, 10, 212–217. [Google Scholar] [CrossRef] [PubMed]
© 2014 by the authors; licensee MDPI, Basel, Switzerland. This article is an open access article distributed under the terms and conditions of the Creative Commons Attribution license (http://creativecommons.org/licenses/by/4.0/).
Share and Cite
Zhang, J.; Chen, J.; Chu, C.; Zhao, W.; Wheeler, J.; Souza, E.J.; Zemetra, R.S. Genetic Dissection of QTL Associated with Grain Yield in Diverse Environments. Agronomy 2014, 4, 556-578. https://doi.org/10.3390/agronomy4040556
Zhang J, Chen J, Chu C, Zhao W, Wheeler J, Souza EJ, Zemetra RS. Genetic Dissection of QTL Associated with Grain Yield in Diverse Environments. Agronomy. 2014; 4(4):556-578. https://doi.org/10.3390/agronomy4040556
Chicago/Turabian StyleZhang, Junli, Jianli Chen, Chenggen Chu, Weidong Zhao, Justin Wheeler, Edward J. Souza, and Robert S. Zemetra. 2014. "Genetic Dissection of QTL Associated with Grain Yield in Diverse Environments" Agronomy 4, no. 4: 556-578. https://doi.org/10.3390/agronomy4040556