Article

Nitrogen Fertilizer Sources and Application Timing Affects Wheat and Inter-Seeded Red Clover Yields on Claypan Soils

by
Kelly A. Nelson
1,*,
Peter P. Motavalli
2,† and
Manjula Nathan
3,†
1
Division of Plant Sciences, University of Missouri, Novelty, MO 63460, USA
2
Department of Soil, Environmental and Atmospheric Sciences, University of Missouri, Columbia, MO 65211, USA
3
Division of Plant Sciences, University of Missouri, Columbia, MO 65211, USA
*
Author to whom correspondence should be addressed.
These authors contributed equally to this work.
Agronomy 2014, 4(4), 497-513; https://doi.org/10.3390/agronomy4040497
Submission received: 7 October 2014 / Revised: 21 October 2014 / Accepted: 31 October 2014 / Published: 11 November 2014

Abstract

:
Controlled-release N fertilizer, such as polymer-coated urea (PCU), may be a fall N management option for wheat (Triticum aestivum L.) grown in poorly-drained claypan soils. Field research evaluated (1) urea release from fall-applied PCU in 2006 and 2007; (2) broadcast fall-spring split (25%:75%) of N sources; and (3) a single fall (100%) application of PCU, urea, urea plus NBPT (N-(n-butyl) thiophosphoric triamide] (U + NBPT), ammonium nitrate (AN), or urea ammonium nitrate (UAN) at 0, 56, 84, and 112 kg·N·ha−1 on wheat yield, wheat biomass, N uptake by wheat, and frost-seeded red clover (FSC) (Trifolium pratense L.) forage yield (2004–2007). PCU applied in fall released less than 30% urea by February. Urea released from PCU by harvest was 60% and 85% in 2006 and 2007, respectively. In poorly-drained soils, wheat yields ranked PCU > AN > U + NBPT > urea ≥ UAN over the rates evaluated for fall-only application. PCU was a viable fall-applied N source, with yields similar to or greater than urea or U + NBPT split-applied. Split-N applications of AN, urea, UAN, and U + NBPT generally resulted in greater wheat yields than a fall application. Enhanced efficiency fertilizers provide farmers with flexible options for maintaining high yielding production systems.

1. Introduction

The United States is a leading wheat (Triticum aestivum L.) producer, averaging 20 million ha in the past decade, and trails only India, China and the European Union [1]. USA wheat hectares have decreased nearly 30% since the 1980s due to greater crop planting options. Average yields in the U.S. have been slightly greater than 2.90 Mg ha−1 during the past decade [2]. Farmers with highly erodible claypan soils commonly grow no-till wheat to reduce surface water runoff and soil loss, thereby maintaining conservation compliance [3]. The clay subsoil has poor internal drainage and increases the risk of gaseous N fertilizer loss which may be greater than 30% [4,5,6]. Wheat must be profitable to maintain it as part of the crop rotation. Loss of N decreases economic returns and could potentially harm the environment. Improved N management internationally could reduce gaseous N emissions in poorly drained soils.
Enhanced-efficiency N sources may increase wheat profitability and encourage its use in crop rotations. Enhanced-efficiency urea-based fertilizers such as polymer coated urea (PCU) or N-(n-butyl) thiophosphoric triamide (NBPT) treated urea increase fertilizer uptake and reduce environmental loss of fertilizers through gaseous, leaching, and/or runoff mechanisms when compared to a reference product, such as urea [7]. Polymer-coated urea is a controlled-release enhanced efficiency fertilizer product that encases urea in a polymer coat. After urea dissolves within the prill, it diffuses out at varying rates depending on soil temperature [8,9]. NBPT can enhance the efficiency of a urea application and avoid ammonia volatilization losses due to reduced activity of the urease enzyme [10]. The reduced enzyme activity provides additional time until sufficient rainfall moves N from the fertilizer into the soil.
Polymer-coated urea and NBPT have enhanced urea N use efficiency by reducing gaseous N loss under several cropping systems [11,12]. Research with PCU has indicated a delay in urea release compared to other enhanced efficiency N sources [13]. However, soluble N sources, such as ammonium nitrate, urea ammonium nitrate (UAN), or urea in the presence or absence of NBPT, may be susceptible to nitrate leaching on better-drained soils. Nitrate leaching is a greater risk when these N sources are applied in the fall. Several studies have evaluated response to enhanced-efficiency N fertilizer in wheat [13,14,15,16], canola (Brassica napus L.) [17,18], and barley (Hordeum vulgare L.) [19]. Wheat yield response varied based on management, application timing, application rate, and environmental conditions. Studies of small grains show that, in addition to yield impacts, protein concentration with PCU was similar or increased compared to urea [15,19]. It is critical to understand the possible utility of enhanced efficiency fertilizer sources in order to properly integrate this technology into Midwestern wheat production systems.
Although using controlled-release urea fertilizer sources can reduce N leaching loss potential [20,21], its agronomic performance and cost-effectiveness are not well-established. For wheat, using controlled-release N fertilizer may be a cost-effective management practice that improves crop performance and possibly allows custom applicators to apply fertilizer once in the fall. Studies conducted in the dry climates of Canada have examined wheat’s agronomic performance in response to fall-applied PCU or urea plus a urease inhibitor [14]. Wheat grain yields were greater when PCU was fall-applied compared to urea [14]. The combination of wet conditions in the spring and poorly drained soils may delay N applications on wheat, and these applications may occur when soil conditions favor denitrification loss. However, no study has evaluated fall-applied N compared to spring-applied N for winter wheat management on poorly drained claypan soils.
Split-N applications can integrate frost-seeded clover (Trifolium pratense L.) cover crop into the wheat production system to help offset the cost of a second fertilizer application. A red clover cover crop is typically frost- or inter-seeded into wheat during February, and it may serve as a forage crop for cattle (Bos taurus). Such cover crops can help increase soil organic matter, suppress weeds, reduce soil erosion, serve as a N trap crop, and may reduce N inputs by contributing N to the soil [22,23,24]. Although red clover inter-seeding in wheat is common when corn (Zea mays L.) follows wheat, nitrate contributions to corn and yield responses have been variable [22,23,25,26,27,28]; however, small-grain N management practices may influence effective cover crop establishment [23,28]. Limited research has evaluated how enhanced efficiency N sources affect a subsequent crop, such as double-crop soybean (Glycine max) [16], or a cover crop, such as red clover. In addition, little is known about how PCU compares to urea plus NBPT (U + NBPT), or the utility of this technology in a typical split-N application management system in poorly drained claypan soils. The objectives of this research were to: (1) evaluate urea release from PCU; and (2) determine the impact of N source rates (0, 56, 84, and 112 kg·N·ha−1) and (3) application timings (fall vs. split) at 112 kg·N·ha−1 on wheat grain yields, wheat biomass yields, wheat N uptake, and frost-seeded clover forage yields.

2. Materials and Methods

2.1. Experimental Design and Management

Field experiments were conducted from 2004 to 2007 at the University of Missouri’s Greenley Memorial Research Center (40°1′17″ N 92°11′24.9″ W) near Novelty, Missouri (USA). The initial soil characteristics, determined from analysis of soil samples (0–15 cm depth) by the University of Missouri Soil and Plant Testing Lab [29], appear in Table 1. Daily rainfall and soil temperature at 5 cm depth with soybean residue surface cover and precipitation was recorded using an automated weather station (Campbell Scientific, Inc., Logan, UT, USA) [30].
Two concurrent studies were conducted to evaluate wheat and frost-seeded clover response to N fertilizer. The first study evaluated fall applied N sources and rates (Section 2.2), while the second study evaluated N sources and application timings (Section 2.3) with specific treatments outlined below. Research was arranged in a randomized complete block design with four to six replications. Specific plot sizes and number of replications for individual years as well as wheat management practices, fertilizer applications, and harvest dates are reported in Table 1. “Ernie” wheat was no-till seeded (Great Plains Solid Stand 10, Assaria, KS) after soybean in 19-cm wide rows.
Table 1. Soil test values and wheat management practices in 2004, 2005, 2006, and 2007.
Soil test and Management Practices2004200520062007
Soil Type PutnamPutnamKilwinningPutnam
Surface drainagePoorModerateExcellentModerate
Soil test values----
Soil organic matter (g kg−1)28323022
Cation exchange capacity (cmolc kg−1)13.115.217.815.7
pH (0.01 M CaCl2)6.47.05.66.8
Bray I P (kg ha−1)204013127
Exchangeable (1 M NH4AOc)----
K (kg ha−1)198349696255
Ca (kg ha−1)4440593048455970
Mg (kg ha−1)386427586430
Plot size (m)3 by 13.73 by 13.73 by 9.13 by 9.1
Replications4466
Wheat biomass and tissue N sampling4443
Planting date23 October 20038 November 20041 October 20056 October 2006
Seeding rate (kg ha−1)170170160160
Maintenance Fertilizer----
Rate (N-P-K kg ha−1)12-62-560-0-00-0-09-45-56
Fall N application1 November 20033 December 200411 October 20052 November 2006
Wheat height (cm)1–31–331–3
Zadoks Stage [31]Z11Z12Z11Z12
Spring split-N application 19 March4 March28 February23 February
Wheat height (cm)5–101–34–81–3
Zadoks Stage [31]Z22Z20Z21Z21
Wheat biomass harvest date28 June22 June28 June26 June
Wheat grain harvest date2 July29 June1 July30 June
Frost-seeded clover seeding date19 March8 March27 February23 February
Seeding rate (kg ha−1)98.4169
Forage harvest date29 July27 July27 July28 July
Soil types: Kilwinning silt loam (fine, smectitic, mesic, Vertic Epiaqualfs), and a Putnam silt loam (fine, smectitic, mesic, Vertic Albaqualfs); Split-N application had 28 kg N ha−1 applied in the fall and 84 kg N ha−1 applied in the spring.

2.2. Fall-Applied N Sources and N Rates

Polymer-coated urea (ESN®, Agrium Advanced Technology, Denver, CO, USA), non-coated urea, urea plus NBPT (U + NBPT) (Koch Agronomic Services, Wichita, KS, USA), ammonium nitrate (AN), and urea ammonium nitrate (UAN) were surface-applied in the fall and all sources were applied at 0, 56, 84 and 112 kg N ha−1. Fertilizers were applied with a hand broadcast spreader (EarthWay, Bristol, IN, USA) for uniform distribution. Care was taken to maintain the polymer coating integrity since damage to this coating reduces the effectiveness of this product as a controlled-release fertilizer [32]. Red clover (variety not stated) was frost-seeded from late February to mid-March at 8 to 16 kg ha−1 to coincide with the split-N application when wheat was Z20 to Z22 [31] in order to reduce the number of trips over the field. When wheat reached physiological maturity, plants from two quadrats (30 by 76 cm) were harvested, dried, weighed, and analyzed for N content to determine total N uptake. Wheat plant samples were dried at 65 °C, ground in a Wiley-Mill to pass a 1-mm sieve [33], and analyzed for total N concentration by combustion using a total carbon:nitrogen analyzer (LECO, TruSpec CN Analyzer, St. Joseph, MI, USA). Approximately four weeks after wheat harvest, two quadrats (30 by 76 cm) of red clover forage from each plot were harvested, dried, and weighed, similar to other research [27]. Wheat grain yields were determined by harvesting with a small-plot combine (Massey Ferguson 10, Kincaid Equipment Manufacturing, Haven, KS, USA) and adjusted to 130 g kg−1 moisture content prior to statistical analysis.

2.3. N Sources and Timing

A second study evaluated N sources and fall- versus split-applications. Fall applications of PCU, non-coated urea, U + NBPT, AN, and UAN were surface-applied at 112 kg N ha−1 and followed the same procedures as previously discussed. The split-application of N fertilizers (PCU, non-coated urea, U + NBPT, AN, and UAN) were fall-applied at 28 kg N ha−1 and in the spring at 84 kg N ha−1 for a total of 112 kg N ha−1. A split application of N is standard for wheat production in the region [34]. Ammonium nitrate is a common regional N source, but availability of AN has decreased due to increased regulations. Wheat cultivar, seeding dates, and harvest methods followed the same procedures as previously discussed. Red clover seeding and harvest also followed the same procedures as previously discussed.

2.4. Data Analysis

ANOVA was conducted using the SAS v9.3 statistical program using PROC GLM [35] to detect any significant treatment effects. Fischer’s Protected LSD was used to separate means (p = 0.05). Quadratic and linear regression analyses were performed for yield responses to N rates using best-fit analysis determined with SigmaPlot (Vers. 8.02, SPSS Inc., Chicago, IL, USA). The soils in 2004, 2005, and 2007 were Putnam silt loam and the field area had relatively flat topography with poor to moderate surface drainage (Table 1). Wheat grain yield data were combined over years because no 3-way interactions (year * N source * rate) were observed for the fall-applied N source and rate experiment or (year * N source * N timing) for the fall vs. split-applied N source experiment. We expected N loss to be higher than normal for 2004, 2005, and 2007 because the topography was relatively flat [6] with poor to moderate surface drainage (visual observation), and overall yields were generally lower than average (3.40 Mg ha−1) [2]. In 2006, the earliest application of N sources occurred, and this was the highest yielding year (nearly doubling the others) with the best surface drainage (Kilwining silt loam); therefore, yield data were presented separately for 2006 and were pooled for 2004, 2005, and 2007. In the absence of a significant three-way interaction, wheat plant biomass, grain moisture, N uptake, tissue N, and clover biomass were either pooled over years or two-way main effect interactions were presented.

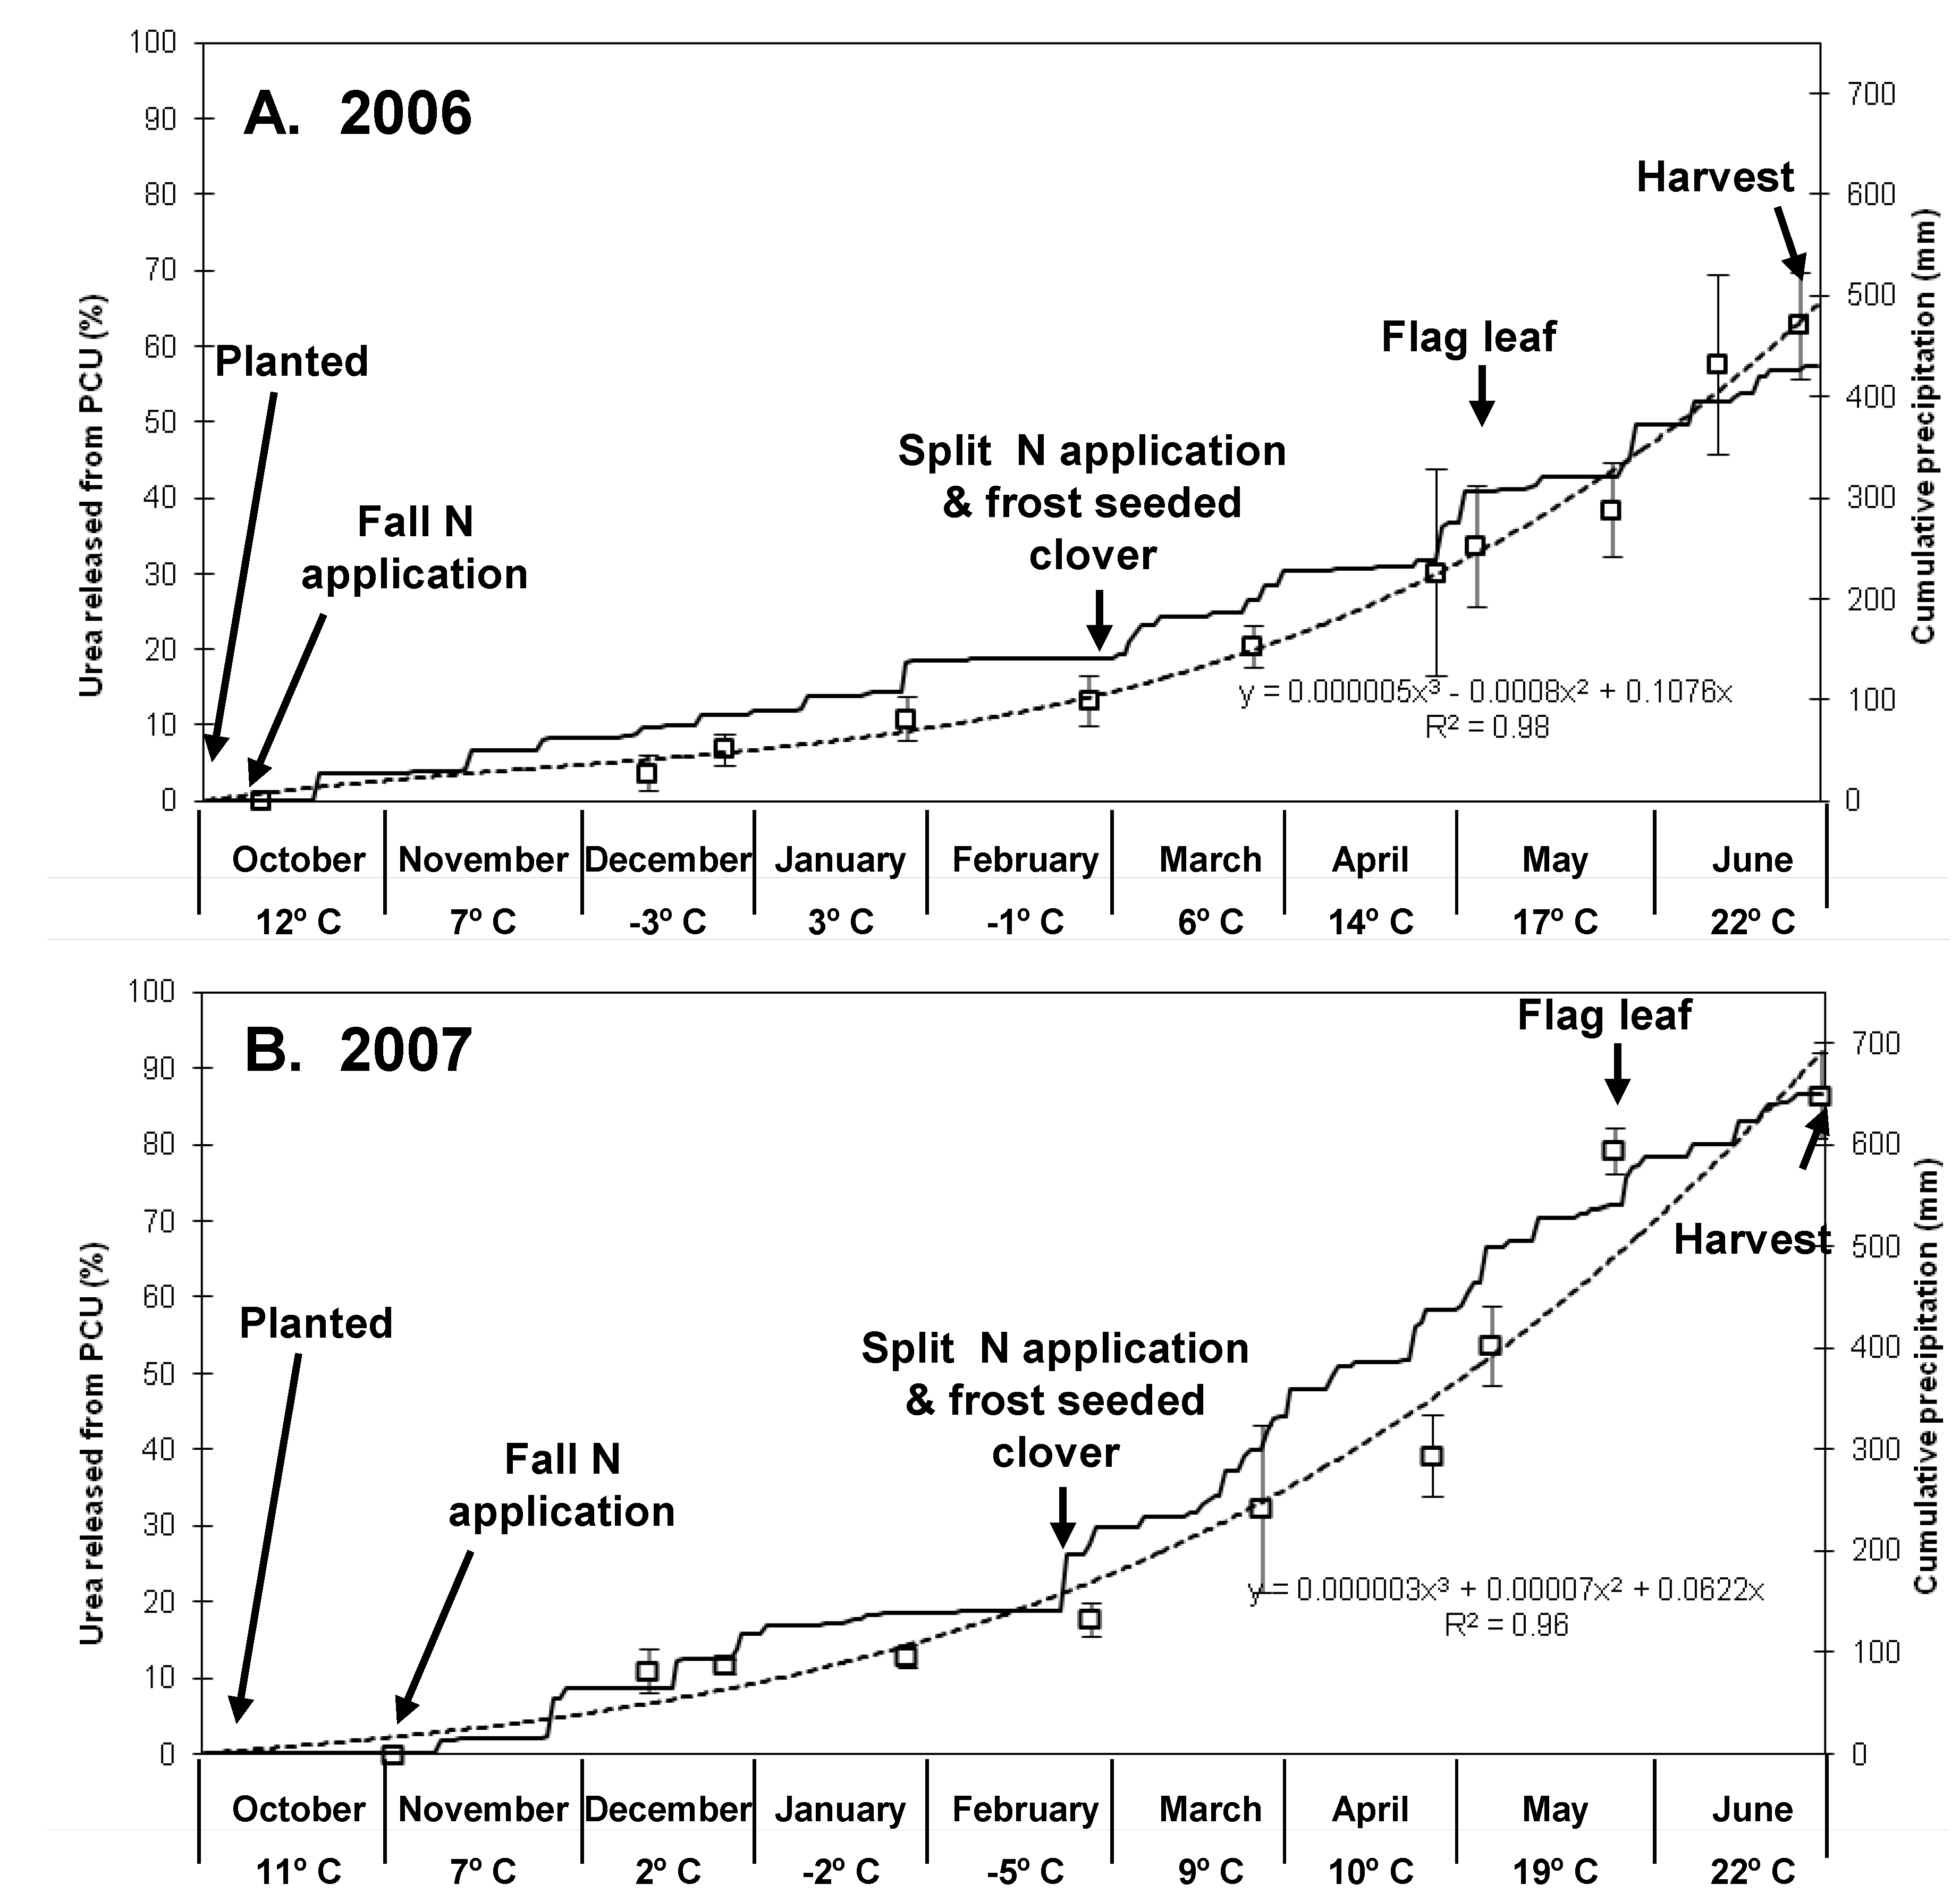
2.5. Urea Released from PCU

Urea release from PCU was evaluated in 2006 and 2007 using a weight-loss method [16,21]. The method involved placing known weights (approximately 10 g each) of PCU in heat-sealed standard mesh, fiberglass insect screens (Phifer Wire Products Inc., Tuscaloosa, Alabama) at the borders of each non-fertilized control in four of the replications. Bags were deployed on the soil surface and covered with soybean residue to simulate a surface, broadcast application when fall fertilizer was applied. One bag per replication was removed on a monthly basis from fall until before harvest, washed in ice water, dried, and weighed to determine the percent of urea release (Figure 1). It was necessary to wash the bags before drying to remove sediment and released urea that may re-solidify on the outside of the prill. Standard deviations were calculated for each packet removal date and reported for each year separately due to environmental condition differences between 2006 and 2007.
Figure 1. Urea released from polymer-coated urea (PCU) each month (squares with standard deviation whiskers), release curve (dash line), average monthly soil temperature (horizontal axis), and cumulative precipitation (solid line) until harvest in 2006 (A) and 2007 (B).
Agronomy 04 00497 g001

3. Results and Discussion

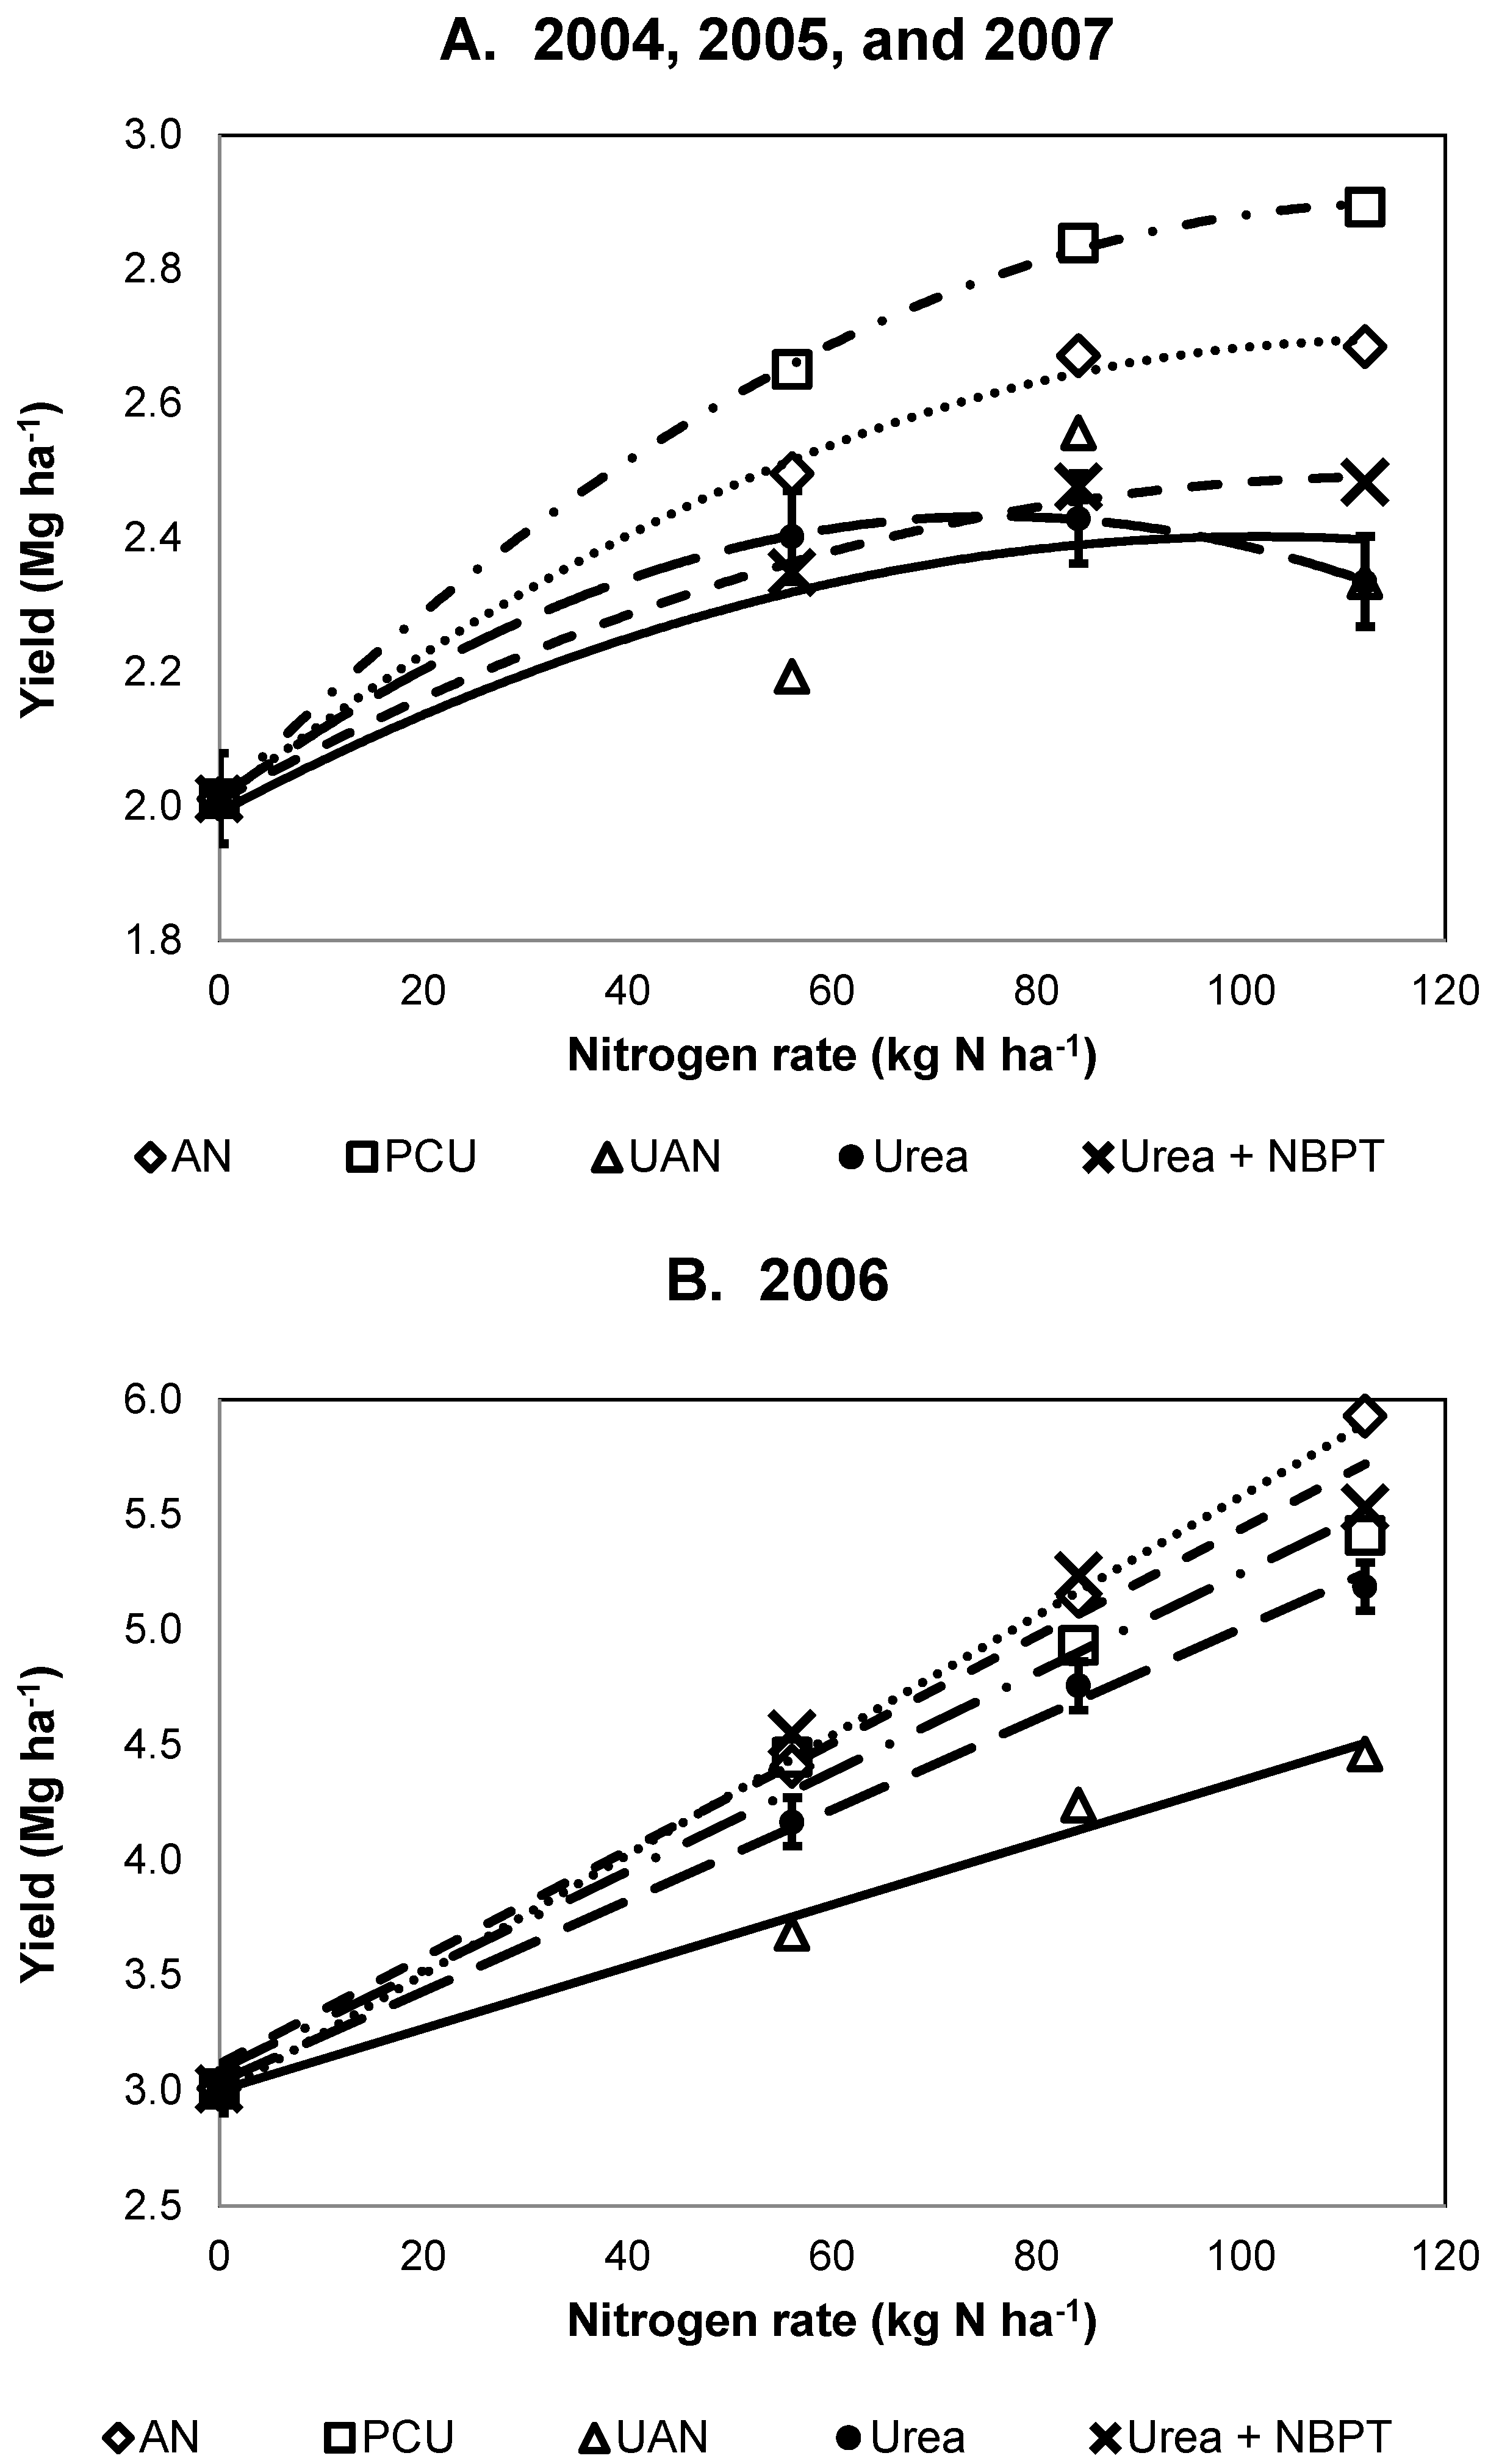
3.1. Fall-Applied N Sources and N Rates

Wheat yield response for fall-applied N sources and N rate main effects are reported separately due to a lack of interaction between factors. Wheat grain yield for fall-applied N sources at four rates is reported in Figure 2A,B. Wheat grain yield response to fall-applied N sources during years (2004, 2005, and 2007) with medium- to poorly-drained soils ranked PCU > AN > U + NBPT > urea ≥ UAN (Figure 2A). All N sources increased yield as N rate increased, similar to other research [15,36], but wheat yield was unlikely to increase when inorganic soil test N exceeded 120 kg N ha−1 [37]. PCU increased grain yield 0.25 to 0.41 Mg ha−1 over urea alone for N rates from 56 to 112 kg ha−1; however, research in drier soils in Canada with fall-applied PCU increased yield slightly (<0.1 Mg ha−1) compared to non-coated urea [14]. Urea plus NBPT at 112 kg N ha−1 increased yield 0.15 Mg ha−1 compared to urea alone, which indicated that a urease inhibitor was beneficial in claypan soils. In 2006 (well-drained soil), wheat grain yield was ranked AN > U + NBPT, PCU, urea, and UAN (Figure 2B). All N sources increased yield over a broadcast application of urea or UAN. Ammonium nitrate at 112 kg ha−1 increased yield over 0.39 Mg ha−1 compared to the other N sources. Urea plus NBPT increased yield 0.34 to 0.47 Mg ha−1 compared to non-treated urea, while PCU increased yield to a lesser extent. The difference in urea release with PCU between 2006 and 2007 (Figure 1) may have contributed to differences in yield response in 2006 (high yielding year) compared to the other years (2004, 2005, and 2007), which were below average for the region [2]. Differences in yield responses to enhanced-efficiency fertilizers have been observed in canola [18], barley [19], wheat [13,14], and corn [13,38,39].
Wheat plant biomass yield averages were: 4.12, 8.17, 8.94, and 6.91 Mg ha−1 in 2004, 2005, 2006, and 2007, respectively (Table 2). Among N sources, PCU resulted in the greatest wheat biomass in 2004, 2005, and 2007 at 4.74, 9.79, and 7.15 Mg ha−1, respectively. However, biomass was greatest with AN in 2006 (9.71 Mg ha−1) (Table 2), which corresponds well with the highest yielding treatments (Figure 2). There was no significant difference in wheat biomass among N sources in 2004 and 2007, but wheat biomass was ranked PCU > AN = UAN = U + NBPT > urea in 2005 (Table 2). In Minnesota, PCU had no effect on wheat biomass in spring wheat [15], while in North Carolina lower wheat biomass was observed with PCU compared to other N sources [13]. No differences were found among fall-applied N sources on wheat grain moisture or plant tissue N concentration. Wheat plant N uptake was similar across N sources in 2004 and 2006. PCU resulted in the greatest N uptake in 2005, probably due to greater overall biomass production with this treatment. Ammonium nitrate resulted in the greatest N uptake in 2007. The red clover cover crop biomass was generally greater following UAN in 2005 (2.45 Mg ha−1), 2006 (2.81 Mg ha−1), and 2007 (3.2 Mg ha−1). However, red clover biomass (1.94 Mg ha−1) was greatest following PCU in 2004. This could have been due to the delay that year in N available to the wheat plants, which allowed better red clover establishment. More red clover growth could also be attributed to poorer wheat canopy development (visual observation) with UAN, which allowed better establishment of the red clover cover crop. In general, red clover production was reduced in 2006, a year that high yielding wheat and more wheat interference occurred, which has resulted in reduced red clover stands elsewhere [28]. In Canada, Queen et al. [28] reported that high N rates reduced light penetration and red clover dry weights were positively correlated with light penetration; however, Vyn et al. [26] reported no effect of small-grain N rate on biomass yields of red clover.
Figure 2. Wheat grain yield response to fall applied nitrogen sources (AN (y = −0.0521x2 + 11.961x + 2008.6, R² = 0.99), ammonium nitrate; PCU (y = −0.0652x2 + 15.215x + 2010.5, R² = 0.99), polymer-coated urea; UAN (y = −0.0397x2 + 8.0771x + 1990.8, R² = 0.70), urea ammonium nitrate; urea (y = −0.0732x2 + 11.092x + 2011.5, R² = 0.99); and urea plus NBPT (N-(n-butyl) thiophosphoric triamide) (y = −0.0362x2 + 8.3498x + 2009.2, R² = 0.99)) and rates in 2004, 2005, and 2007 (top), and (AN (y = 25.947x + 2985.6, R² = 0.99), PCU (y = 21.552x + 3089.6, R² = 0.98), UAN (y = 13.447x + 2998.7, R² = 0.98), urea (y = 19.721x + 3035.2, R² = 0.99), and urea plus NBPT (y = 23.239x + 3114.4, R² = 0.97)) in 2006 (bottom); vertical bars on the urea only treatment represent the standard error.
Agronomy 04 00497 g002
Table 2. Effect of fall-applied N sources on wheat plant biomass dry matter, grain moisture, tissue N, wheat N uptake, and frost-seeded red clover biomass dry matter; nitrogen sources included AN, ammonium nitrate; PCU, polymer-coated urea; UAN, urea ammonium nitrate; urea; and urea plus NBPT; data were averaged over N rates (0, 56, 84, and 112 kg N ha−1) and years in the absence of a significant interaction.
Fall appliedWheat BiomassWheat GrainWheatWheat N UptakeRed Clover Biomass
N source2004200520062007MoistureTissue N20042005200620072004200520062007
(Mg ha−1)(g kg−1)(g kg−1)(kg ha−1)(Mg ha−1)
AN4.018.449.717.011418.940.074.948.087.11.912.441.903.01
PCU4.749.798.457.151419.249.695.745.179.71.942.442.392.85
UAN3.958.118.536.341428.941.475.942.472.21.842.452.813.20
Urea4.037.029.247.031428.842.261.545.183.41.932.452.172.92
Urea + NBPT3.887.508.797.001429.039.964.748.381.51.852.451.882.80
LSD (p = 0.05) 1.04NSNS12.00.39
Fishers protected least significant difference at p = 0.05; Not significant.
As N rates increased, wheat biomass production increased from 0.96 to 4.01 Mg ha−1 depending on the N rate and year (Table 3). Predictably, wheat tissue N concentration and N uptake increased as N rates increased. Nitrogen rate appeared to have no significant effect on red clover forage yields in 2004, 2005, and 2006. However, biomass decreased 0.37 to 0.51 Mg ha−1 in 2007 as N rate increased to 84 and 112 kg N ha−1 when compared to the non-treated control. This indicated more interference from increased wheat growth at higher N rates. In other research, increasing N rates in barley or wheat either had no effect or decreased red clover biomass [26,28]. Queen et al. [28] observed the greatest red clover dry weights when N rates were reduced and wheat stands were thin. Wheat canopy development can be affected when N supply to the crop is limited and subsequently affects interseeded red clover production.
Table 3. Fall-applied nitrogen rate main effects for wheat plant biomass dry matter, grain moisture, wheat tissue N concentration, wheat N uptake, and frost-seeded red clover biomass dry matter; data were averaged over N source (AN, ammonium nitrate; PCU, polymer-coated urea; UAN, urea ammonium nitrate; urea; and urea plus NBPT and years in the absence of a significant interaction.
Fall appliedWheat BiomassWheat GrainWheatWheatRed Clover Biomass
N Rates2004200520062007MoistureTissue NN Uptake2004200520062007
(kg N ha−1)(Mg ha−1)(g kg−1)(g kg−1)(kg ha−1)(Mg ha−1)
03.496.376.234.721428.440.51.782.452.573.20
564.258.649.217.101428.758.61.932.452.563.11
844.458.8110.247.851409.265.61.952.452.292.69
1124.308.8810.107.961429.770.41.932.442.632.83
LSD (p = 0.05) 0.93NS 0.54.80.35
Fishers protected least significant difference at p = 0.05; Not significant.

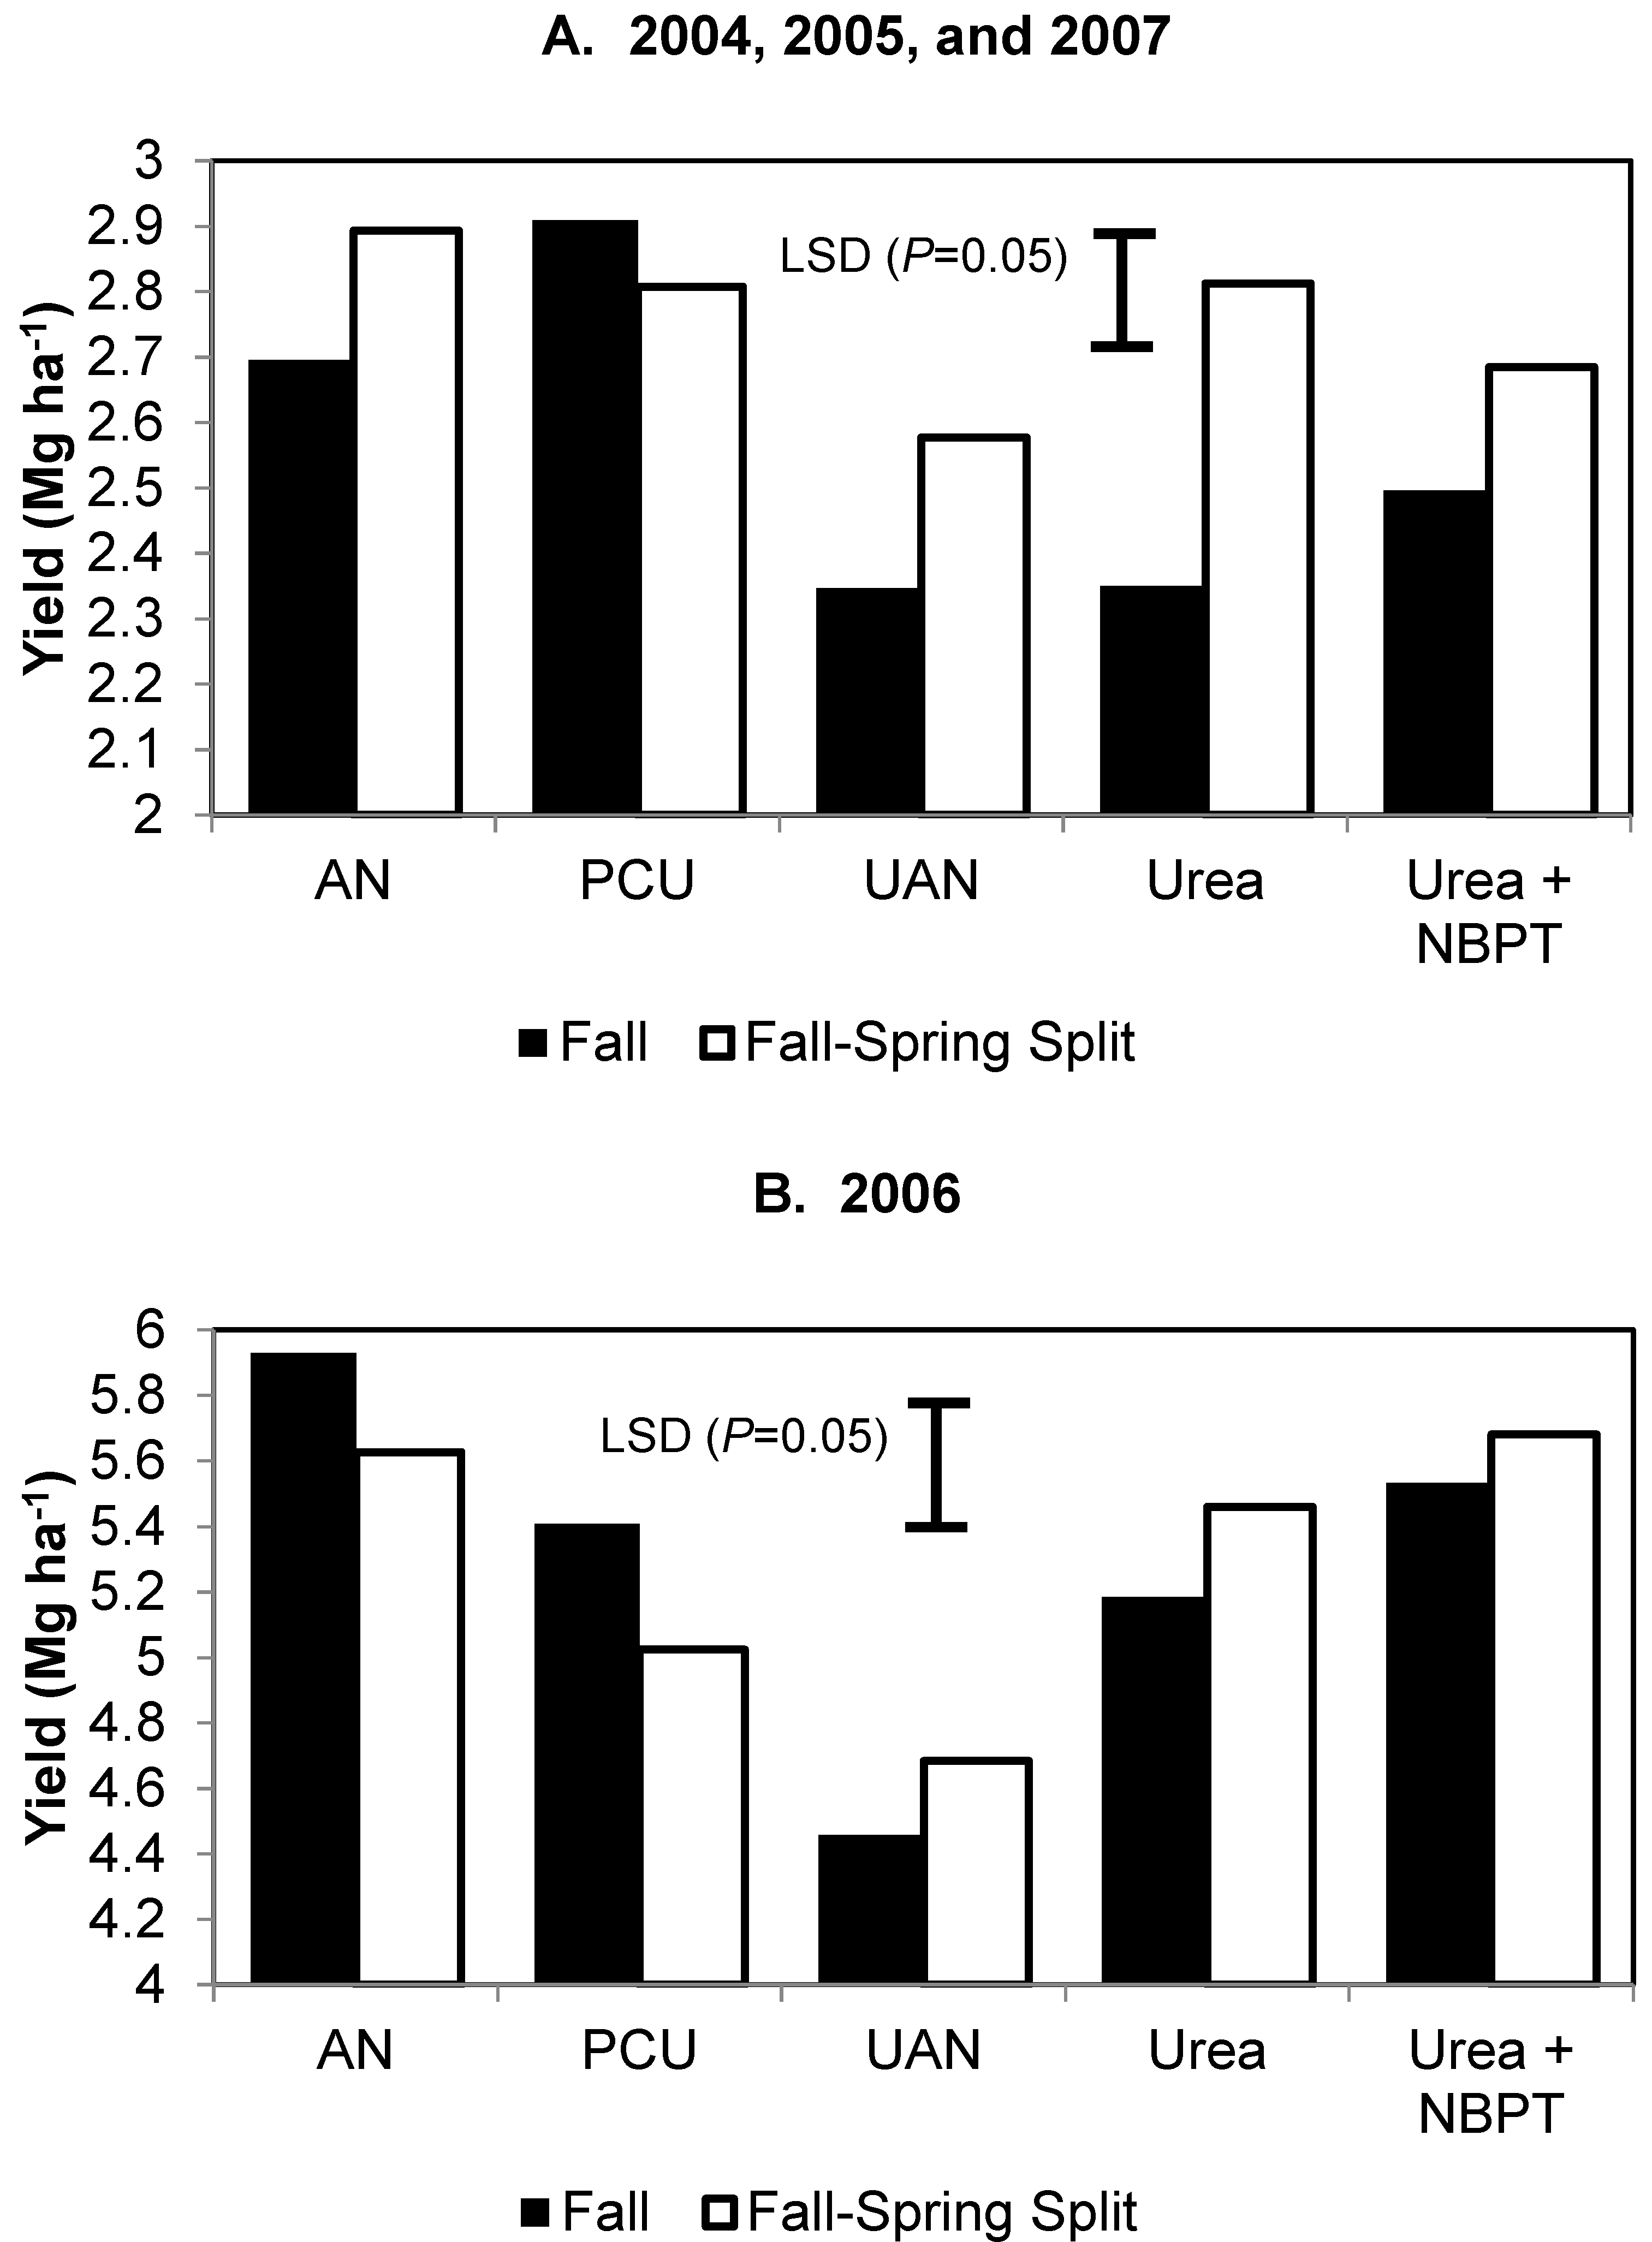
3.2. N Sources and Timing

Fall- and split-N applications for all N sources increased grain yield compared to the non-treated control (data not presented). There was an interaction between N source and application timing on wheat yield (Figure 3). In a poorly drained soil (2004, 2005, and 2007), fall-applied PCU was the highest yielding treatment (2.91 Mg ha−1) and was similar to AN, PCU, and urea split-applied (Figure 3A). The spring application of PCU was expected to result in lower wheat yields [14,15]; however, spring applied PCU was relatively early which allowed more time for N release and greater overall yields. Otherwise, the recommended blend ratio of PCU to a fast-release N source should decrease to a 75:25 or 50:50 ratio lest wheat yields decrease [16]. Fall-applied U + NBPT increased wheat yields 0.35 Mg ha−1 compared to urea alone, but grain yields were similar for split-applied urea and U + NBPT. Wheat yields were reduced with a broadcast application of UAN fall- or split-applied on poorly drained soils.
Figure 3. Wheat grain yield response to fall (112 kg N ha−1) and fall-spring (28 kg N ha−1 in the fall and 84 kg N ha−1 in the spring) split applied nitrogen sources (AN, ammonium nitrate; PCU, polymer-coated urea; UAN, urea ammonium nitrate; urea; and urea plus NBPT in 2004, 2005, and 2007 (top) and 2006 (bottom). LSD (p = 0.05) is 0.19 Mg ha−1 for the top figure A (data were combined over 2004, 2005, and 2007) and 0.39 Mg ha−1 for the bottom figure B (2006).
Agronomy 04 00497 g003
In a well-drained soil (2006), fall applied AN resulted in the greatest overall yield of 5.93 Mg ha−1 (Figure 3B). This was 0.40 to 1.47 Mg ha−1 greater than the other fall-applied N sources, but similar to a split application of AN. A split application of U + NBPT yielded 5.68 Mg ha−1, which was 0.66 and 1.0 Mg ha−1 greater than PCU and UAN, respectively. In a well-drained field, split-applications of PCU reduced yields 0.4 Mg ha−1 compared with fall-applied PCU. The slower urea release from PCU in 2006 compared to 2007 (Figure 1) may have contributed to differences in yield response with PCU compared to other N sources (Figure 3B). In North Carolina [13], Minnesota [15], and southern Alberta [14], wheat yield response differences among N sources and enhanced efficiency fertilizers such as PCU have been attributed to urea release differences between PCU and the other N sources.
No significant two- (N source * N timing) or three- (N source * N timing * year) way interactions appeared for wheat biomass, grain moisture, tissue N concentration, wheat N uptake, or red clover biomass between fall- and split-applied N. Therefore, data were pooled over main effects, and main effect * year interactions were presented when appropriate (Table 4 and Table 5). There was no difference in wheat biomass or grain moisture among N sources (Table 4). Tissue N concentration and N uptake was greatest with PCU compared to UAN, urea, or U + NBPT when combined over the four years, but was similar to AN, which has been a standard N source in the region. This differed from Canadian studies, in which canola [18] and barley [19] N concentration was generally lower with PCU compared to urea. Tissue N and plant N uptake was similar for UAN, urea, and U + NBPT. Red clover cover crop yields were greatest following urea in 2004 (2.01 Mg ha−1) and 2005 (2.44 Mg ha−1), which was similar to the other N sources. Nitrogen treatments had an effect on red clover biomass yields and appeared to be confounded with wheat yields. In 2006, the highest wheat-yielding treatments (Figure 3B) had lower red cover biomass production (Table 4), which indicated greater wheat interference with the red clover. Red clover biomass yields were typical for the Midwestern USA [27] and were greatest following UAN in 2006 (2.64 Mg ha−1) and 2007 (3.24 Mg ha−1), but no differences between sources were observed in 2007. A split-N application resulted in greater wheat biomass (2.77 Mg ha−1) and greater N uptake (28.5 kg ha−1) than fall-applied N in 2005, but no differences among N timings were observed in the other years (Table 5). There was no difference in wheat grain moisture among application timings. In 2004, split-applied N resulted in greater wheat tissue N concentration, but no differences among N timings were observed in the other years. Nitrogen application timing had no effect on red clover biomass.

3.3. Urea Released from PCU

In 2006 and 2007, urea release from PCU followed rainfall patterns and increased along with soil temperature during the growing season (Figure 1). Although fall and winter (mid-February) precipitation was similar in 2006 and 2007, total precipitation was 200 mm greater in 2007 than 2006. A combination of rainfall and temperature affects the release of urea from the polymer coating [16]. Release of urea from PCU was less than 30% by late February in 2006 and 2007 when the split application of N was applied and red clover seed was broadcast. The release of urea from PCU was similar to other research evaluating application timings of ratios of PCU to non-coated urea [16]. Only 35% of urea was released by the time the flag leaf was observed in May 2006, but nearly 80% release was observed in 2007. Total urea released at harvest was 60% in 2006 and 85% in 2007. Since the bag size was approximately 10 by 20 cm, the amount of urea (approximately 10 g) in each bag could affect total release due to a concentration of urea which is greater than a typical field application. Total urea release from PCU in 2006 was similar to other research in a high yielding year when release was only 55%, but in average yielding years it reached 80% to 95% by mid-June [16]. Nonetheless, this method provides a good indicator of urea released due to the physical barrier of the polymer coating which may help to explain N uptake and yield differences among N treatments.
Table 4. Effect of fall- and split-applied nitrogen sources on wheat plant biomass, grain moisture, tissue N, wheat N uptake, and red clover biomass dry matter; nitrogen sources were applied at 112 kg N ha−1 and included AN, ammonium nitrate; PCU, polymer-coated urea; UAN, urea ammonium nitrate; urea; and urea plus NBPT. Data were averaged over N application timing (fall and split) and years in the absence of a significant interaction.
N SourcesWheatWheat GrainWheatWheatRed Clover Biomass
BiomassMoistureTissue NN Uptake2004200520062007
(Mg ha−1)(g kg−1)(g kg−1)(kg ha−1)(Mg ha−1)
AN8.931409.979.51.952.411.222.93
PCU8.4714110.586.31.962.391.812.44
UAN8.081429.869.71.902.432.643.24
Urea8.501419.266.02.012.441.332.96
Urea + NBPT8.701419.472.21.882.421.042.76
LSD (p = 0.05) NS NS0.710.50.54
Fishers protected least significant difference at P = 0.05; Not significant.
Table 5. Effect of nitrogen application timing on wheat biomass, grain moisture, wheat tissue N, wheat N uptake, and red clover biomass dry matter; data were averaged over N sources (AN, ammonium nitrate; PCU, polymer-coated urea; UAN, urea ammonium nitrate; urea; and urea plus NBPT and years in the absence of a significant interaction.
N ApplicationWheat BiomassWheat GrainWheat Tissue NWheat N UptakeRed Clover
Timing2004200520062007Moisture20042005200620072004200520062007Biomass
(Mg ha−1)(g kg−1)(g kg−1)(kg ha−1)(Mg ha−1)
Fall (112 kg N ha−1)4.578.8810.047.9314211.39.46.113.046.387.160.7102.02.18
Split (28:84 kg N ha−1)4.8311.6511.087.5514112.69.75.612.753.8115.658.2100.62.27
LSD (p = 0.05) 1.12NS §0.711.4NS
Nitrogen was applied at 28 kg N ha−1 in the fall followed by 84 kg N ha−1 in the spring; Fishers protected least significant difference at p = 0.05; § Not significant.4. Conclusions
Urea released from a fall-application of PCU was less than 30% of total urea by February, and 60 to 85% by the end of the wheat growing season. Split-N applications of N (25%:75% fall:spring) as AN, urea, UAN, and U + NBPT generally resulted in greater wheat yields in poorly drained fields, than a single fall application of these N sources. However, wheat yields were generally greater when PCU was fall-applied compared to split-applied. In soils that were poorly drained (2004, 2005, and 2007), wheat grain yields were ranked PCU > AN > U + NBPT > urea ≥ UAN over the rates evaluated for fall-only application. In poorly drained claypan soils, fall-applied PCU resulted in wheat grain yields that were similar or greater than split applications of PCU, urea, or U + NBPT. Polymer-coated urea is a viable option for fall application to wheat in poorly drained soils. In a well-drained soil (2006), fall-applied AN resulted in greater wheat yields than other fall-applied N sources. Broadcast fall- or split-applications of UAN are not recommended for wheat in this region at the application timings evaluated in this research. Red clover cover crop biomass was affected by N management and source, but this response was dependent on the year. Farmers should not only consider the impact of N management decisions on wheat response, but also the impact on inter-seeded crop response such as red clover. Future research needs to build on the utility of fall-applied N sources such as PCU with soils that are prone to leaching and drier climates as well as the impact of precipitation, soil moisture, and soil temperature on the release of urea from PCU.

Acknowledgments

The authors would like to thank Clinton Meinhardt and Randall Smoot for their technical assistance with this research, and the Missouri Fertilizer and Agriculture Lime Board for funding this research.

Author Contributions

Kelly Nelson was responsible for planning, design, site selection, analysis, interpretation of results, and writing the manuscript. Peter Motavalli participated in the planning, design, interpretation of results, and manuscript preparation. Manjula Nathan analyzed tissue for N concentration and was a collaborator in the manuscript.

Conflicts of Interest

The authors declare no conflict of interest.

References

  1. USDA-ERS. Wheat overview. Available online: http://www.ers.usda.gov/topics/crops/wheat.aspx (accessed on 6 March 2013).
  2. USDA-ERS. Wheat statistics. Available online: http://quickstats.nass.usda.gov/ (accessed on 6 March 2013).
  3. Ghidey, F.; Alberts, E.E. Runoff and soil losses as affected by corn and soybean tillage systems. J. Soil Water Conserv. 1998, 53, 64–70. [Google Scholar]
  4. Blevins, D.W.; Wilkison, D.H.; Kelly, B.P.; Silva, S.R. Movement of nitrate fertilizer to glacial till and runoff from a claypan soil. J. Environ. Qual. 1996, 25, 584–593. [Google Scholar] [CrossRef]
  5. Wilkison, D.H.; Blevins, D.W.; Silva, S.R. Use of isotopically labeled fertilizer to trace nitrogen fertilizer contributions to surface, soil, and ground water. J. Environ. Hydrol. 2000, 8, 1–16. [Google Scholar]
  6. Nash, P.R.; Motavalli, P.P.; Nelson, K.A. Nitrous oxide emissions from claypan soils due to nitrogen fertilizer source and tillage/fertilizer placement practices. Soil Sci. Soc. Am. J. 2012, 76, 983–993. [Google Scholar] [CrossRef]
  7. Motavalli, P.P.; Goyne, K.W.; Udawatta, R.P. Environmental impacts of enhanced-efficiency nitrogen fertilizers. Crop Manag. 2008, 7. [Google Scholar] [CrossRef]
  8. Blaylock, A. Controlled Release Fertilizer: Research Summary 2000–2002; Agrium U.S. Inc.: Denver, CO, USA, 2003. [Google Scholar]
  9. Fujinuma, R.; Balster, N.J.; Norman, J.M. An improved model of nitrogen release for surface-applied controlled-release fertilizer. Soil Sci. Soc. Am. J. 2009, 73, 2043–2050. [Google Scholar] [CrossRef]
  10. Hendrickson, L.L. Corn yield response to the urease inhibitor NBPT: Five-year summary. J. Prod. Agric. 1992, 5, 131–137. [Google Scholar] [CrossRef]
  11. Halvorson, A.D.; del Grosso, S.J. Nitrogen source and placement effects on soil nitrous oxide emissions from no-till corn. J. Environ. Qual. 2012, 41, 1349–1360. [Google Scholar] [CrossRef] [PubMed]
  12. Jantalia, C.P.; Halvorson, A.D.; Follett, R.F.; Alves, B.J.R.; Polidoro, J.C.; Urquiaga, S. Nitrogen source effects on ammonia volatilization as measured with semi-static chambers. Agron. J. 2012, 104, 1595–1603. [Google Scholar] [CrossRef]
  13. Cahill, S.; Osmond, D.; Weisz, R.; Heiniger, R. Evaluation of alternative nitrogen fertilizers for corn and winter wheat production. Agron. J. 2010, 102, 1226–1236. [Google Scholar] [CrossRef]
  14. McKenzie, R.H.; Middleton, A.B.; Pfiffner, P.G.; Bremer, E. Evaluation of polymer-coated urea and urease inhibitor for winter wheat in southern Alberta. Agron. J. 2010, 102, 1210–1216. [Google Scholar] [CrossRef]
  15. Farmaha, B.S.; Sims, A.L. Yield and protein response of wheat cultivars to polymer-coated urea and urea. Agron. J. 2013, 105, 229–236. [Google Scholar] [CrossRef]
  16. Nash, P.R.; Nelson, K.A.; Motavalli, P.P.; Meinhardt, C.G. Effects of polymer-coated urea application ratios and dates on wheat and subsequent double-crop soybean. Agron. J. 2012, 104, 1074–1084. [Google Scholar] [CrossRef]
  17. Grant, C.A.; Derksen, D.A.; McLaren, D.; Irvine, R.B. Nitrogen fertilizer and urease inhibitor effects on canola emergence and yield in a one-pass seeding and fertilizing system. Agron. J. 2010, 102, 875–884. [Google Scholar] [CrossRef]
  18. Blackshaw, R.E.; Hao, X.; Brandt, R.N.; Clayton, G.W.; Harker, K.N.; O’Donovan, J.T.; Johnson, E.N.; Vera, C.L. Canola response to ESN and urea in a four-year no-till cropping system. Agron. J. 2011, 103, 92–99. [Google Scholar] [CrossRef]
  19. Blackshaw, R.E.; Hao, X.; Harker, K.N.; O’Donovan, J.T.; Johnson, E.N.; Vera, C.L. Barley productivity response to polymer-coated urea in a no-till production system. Agron. J. 2011, 103, 1100–1105. [Google Scholar] [CrossRef]
  20. Nelson, K.A.; Paniagua, S.M.; Motavalli, P.P. Effect of polymer coated urea, irrigation, and drainage on nitrogen utilization and yield of corn in a claypan soil. Agron. J. 2009, 101, 681–687. [Google Scholar] [CrossRef]
  21. Wilson, M.L.; Rosen, C.J.; Moncrief, J.F. Effects of polymer-coated urea on nitrate leaching and nitrogen uptake by potato. J. Environ. Qual. 2010, 39, 492–499. [Google Scholar] [CrossRef]
  22. Dou, Z.; Fox, R.H.; Toth, J.D. Seasonal soil nitrate dynamics in corn as affected by tillage and nitrogen source. Soil Sci. Soc. Am. J. 1995, 59, 858–864. [Google Scholar] [CrossRef]
  23. Vyn, T.J.; Faver, J.G.; Janovicek, K.J.; Beauchamp, E.G. Cover crop effects on nitrogen availability to corn following wheat. Agron. J. 2000, 92, 915–924. [Google Scholar] [CrossRef]
  24. Fisk, J.W.; Hesterman, O.B.; Shrestha, A.; Kells, J.J.; Harwood, R.R.; Squire, J.M.; Sheaffer, C.C. Weed suppression by annual legume cover crops in no-tillage corn. Agron. J. 2001, 93, 319–325. [Google Scholar] [CrossRef]
  25. Drury, C.F.; Tan, C.S.; Welacky, T.W.; Oloya, T.O.; Hamill, A.S.; Weaver, S.E. Red clover and tillage influence on soil temperature, water content and corn emergence. Agron. J. 1999, 91, 101–108. [Google Scholar] [CrossRef]
  26. Vyn, T.J.; Janovicek, K.J.; Miller, M.H.; Beauchamp, E.G. Soil nitrate accumulation and corn response to preceding small-grain fertilization and cover crops. Agron. J. 1999, 91, 17–24. [Google Scholar] [CrossRef]
  27. Henry, D.C.; Mullen, R.W.; Dygert, C.E.; Diedrick, K.A.; Sundermeier, A. Nitrogen contribution from red clover for corn following wheat in western Ohio. Agron. J. 2010, 102, 210–215. [Google Scholar] [CrossRef]
  28. Queen, A.; Earl, H.; Deen, W. Light and moisture competition effects on biomass of red clover underseeded to winter wheat. Agron. J. 2009, 101, 1511–1521. [Google Scholar] [CrossRef]
  29. Nathan, M.V.; Stecker, J.A.; Sun, Y. Soil Testing in Missouri. A Guide for Conducting Soil Tests in Missouri. Univ. Mo. Ext. Publ. 2011, EC23, 7–25. [Google Scholar]
  30. University of Missouri Extension. Missouri Historical Agricultural Weather Database. University of Missouri Extension: Columbia. Available online: http://agebb.missouri.edu/weather/history/index.asp?station_prefix=nov (accessed on 6 March 2013).
  31. Zadoks, J.C.; Chang, T.T.; Konzak, C.F. A decimal code for the growth stages of cereals. Weed Res. 1974, 14, 415–421. [Google Scholar] [CrossRef]
  32. Beres, B.L.; McKenzie, R.H.; Dowbenko, R.E.; Badea, C.V.; Spaner, D.M. Does handing physically alter the coating integrity of ESN urea fertilizer? Agron. J. 2012, 104, 1149–1159. [Google Scholar] [CrossRef]
  33. Isaac, R.A.; Jones, J.B., Jr. Effects of various dry ashing temperatures on the determination of 13 nutrient elements in five plant tissues. Commun. Soil Sci. Plant Anal. 1972, 3, 261–269. [Google Scholar] [CrossRef]
  34. Scharf, P.C.; Lory, J.A. Best management practices for nitrogen fertilizer in Missouri. University of Missouri Extension. Available online: http://plantsci.missouri.edu/nutrientmanagement/nitrogen/practices.htm (accessed on 6 March 2013).
  35. SAS Institute. SAS User’s Guide, Version 9.3; SAS Institute: Cary, NC, USA, 2013.
  36. Halvorson, A.D.; Nielsen, D.C.; Reule, C.A. Nitrogen fertilization and rotation effects on no-till dryland wheat production. Agron. J. 2004, 96, 1196–1201. [Google Scholar] [CrossRef]
  37. Olson, R.; Frank, K.; Diebert, E.; Drier, A.; Sander, D.; Johnson, V. Impact of residual mineral N in soil on grain protein yields of winter wheat and corn. Agron. J. 1976, 68, 769–772. [Google Scholar] [CrossRef]
  38. Noellsch, A.J.; Motavalli, P.P.; Nelson, K.A.; Kitchen, N.R. Corn response to conventional and slow-release nitrogen fertilizers across a claypan landscape. Agron. J. 2009, 101, 607–614. [Google Scholar] [CrossRef]
  39. Motavalli, P.P.; Nelson, K.A.; Bardhan, S. Development of a variable-source N fertilizer management strategy using enhanced-efficiency N fertilizers. Soil Sci. 2012, 177, 708–718. [Google Scholar] [CrossRef]

