Article

Assessing Microbial Contributions to N2O Impacts Following Biochar Additions

1
Guangdong Environmental Monitoring Center, Guangzhou, Guangdong 510030, China
2
School of Environmental Science and Engineering, Laboratory of Environmental Pollution Control and Remediation Technology, Sun Yat-sen University, Guangzhou, Guangdong 510275, China
3
United States Department of Agriculture-Agricultural Research Service (USDA-ARS), Soil and Water Management Unit, St. Paul, MN 55108, USA
4
Department of Soil, Water and Climate, University of Minnesota, St. Paul, MN 55108, USA
*
Author to whom correspondence should be addressed.
Agronomy 2014, 4(4), 478-496; https://doi.org/10.3390/agronomy4040478
Submission received: 12 June 2014 / Revised: 18 October 2014 / Accepted: 22 October 2014 / Published: 7 November 2014

Abstract

:
Varying degrees of soil nitrous oxide (N2O) mitigation have been observed following biochar applications. Laboratory incubation experiments were conducted using soils from agriculture, forest, prairie, and a sterilized sand to examine the relative contributions of bacteria and fungi to this N2O alteration. Selective chemical inhibitors were used to distinguish the relative contributions of fungal and bacterial groups to N2O production/suppression in each soil type following a fast-pyrolysis macadamia nut shell biochar (10% w/w) addition. Overall, suppressed production of N2O was initially observed between the agricultural and prairie soils following biochar addition and stimulation of N2O production was observed in the biochar amended forest soil. However, if the N2O production that was observed in the biochar control (sterile sand and biochar = 4.2 ± 0.7 ng-N g−1 day−1) was subtracted from all treatments, N2O production following biochar addition was consistently lower in all soils following biochar additions. In terms of the microbial contributions, there were no significant differences in N2O production between the microbial inhibitor treatments, despite CO2 production rate differences. Therefore, the response in the N2O production to biochar could not be directly attributed to a particular microbial group (fungi or bacteria). These results suggest the presence of abiotic production or consumption routes for nitrogen species in biochar amended soils.

1. Introduction

Biochar, the product of biomass pyrolysis in the absence of oxygen, has been praised for its combined use as a carbon sequestration agent and as a soil amendment that enhances soil quality [1,2,3]. The potential benefits to soil quality from biochar application include reducing soil N-nutrient leaching, aluminum availability, and potentially toxic heavy metal concentrations, increasing cation exchange capacity (CEC), water holding capacity, nutrient retention, symbiotic microorganism growth, and altering soil pH [4,5,6,7]. Biochar application can reduce net soil greenhouse gas (GHG) emissions [8,9,10,11,12]. However, the impact of biochar on soil N2O production varies with biochar and soil characteristics [13,14,15,16,17]. For example, differing impacts have been observed as a function of soil moisture, typically with biochar additions at soil water contents lower than 78% (v/v) suppressing soil N2O emission [15,18]. Biochar has also been observed to directly interact with nitrogen species [19,20,21]. On the other hand, biochar with high inorganic N contents stimulate soil N2O emissions [12,22]. Reductions in the suppression of N2O emissions have been observed following field aging (weathering) of biochar [13]. Therefore, the feasibility of biochar application as a long term soil N2O mitigation strategy is still questionable and the exact mechanism(s) of the reduction is still uncertain [15].
Alteration of soil N2O emissions is attributed to the change of direct and indirect factors that are influenced by biochar, resulting from possibly intermingled biotic and abiotic pathways. Biochar does alter the soil environment following application. Biochar alteration of soil pH, soil moisture potential relationships, cation exchange capacity (CEC), aeration status, and potassium availability may lead to reduced direct and indirect N2O emissions [23,24,25]. In addition, chemical compounds sorbed on biochar can induce plant and microbial signaling [26,27,28]. Specifically, the presence of nitrifier inhibiting chemical compounds sorbed to the biochar has been implicated as a potential suppression of nitrification reactions and thus N2O formation [2,29,30,31]. Due to the potential for large surface areas, biochar has the potential of sorbing ammonia [32,33], resulting in hypothesized suppressed microbial nitrifier activity due to reduced substrate availability. This has already been observed when biochar was used for examining alleopathic effects, since plant nutrient deficiencies were observed following biochar additions [34,35]. Incidentally, there was the suggestion at the time of adding additional fertilizer to the biochar (charcoal) treatments to compensate for this effect [36]. In addition, since biochar refers to a spectrum of different chemical species, some types of biochar can also sorb N2O gas directly, thus resulting in lower apparent surface emissions or production rates [19]. However, these abiotic mechanisms typically are speculated to not solely be responsible for biochar’s N2O mitigation activity [15,24].
In addition to the chemical alteration of the soil environment, biochar can also alter soil’s biotic component. Studies have demonstrated that certain types of biochar can alter the soil microbial community structure, assessed through direct DNA or phospholipid-derived fatty acids (PLFA) extractions) [37,38]. Due to the suppression in the observed N2O production following biochar addition, there has been a particular emphasis on microbial nitrifier and denitrifier community structure and dynamics [39,40,41]. Biochar addition to soil may alter the abundance or activity of bacterial groups that regulate N2O production [38,40,42,43,44], as it is assumed that the increased presence of denitrification genes (i.e., NosZ) correlates to higher microbial denitrification rates. However, operator variability, deficiencies in normalization standards, and lack of correlation between RNA presence and cell activities are hurdles to this direct linkage of soil function with genetic data [45]. Therefore, the functional contribution of bacteria and fungi to N2O dynamics as well as the fundamental drivers of these biochar alterations in N2O emissions are still unknown. The objectives of this study were to investigate the biotic and abiotic mechanisms behind the effects of biochar mitigation on N2O production by investigating the relative contribution of bacteria and fungi to N2O dynamics by the use of chemical inhibitors following the addition of a known N2O production lowering biochar (fast-pyrolysis macadamia nut shell).

2. Results

2.1. Soil and Biochar Characterization

The various chemical properties evaluated on the soils and biochar are shown in Table 1.
Table 1. Properties of the soils and biochar used in the experiments.
PropertyPrairie SoilAgricultural SoilForest SoilSterilized SandBiochar
Organic Matter (%)4.94.43.30.171.63
Total Nitrogen (%)0.2<0.1<0.1<0.10.88
Cation Exchange Capacity (%)23.515.1416.1-
pH (1:5 distilled H2O)7.26.54.79.56.2
Potassium (ppm)1801456316<0.10
Calcium (ppm)4250243335838400.15
Magnesium (ppm)1100527531020.07
Iron (ppm)75190252104353
Nitrate (NO3, ppm)3.415.40.90.2<0.1
Nitrite (NO2, ppm)0.3<0.1<0.1<0.1<0.1
Ammonium (NH4, ppm)9.12.81.1<0.1<0.1

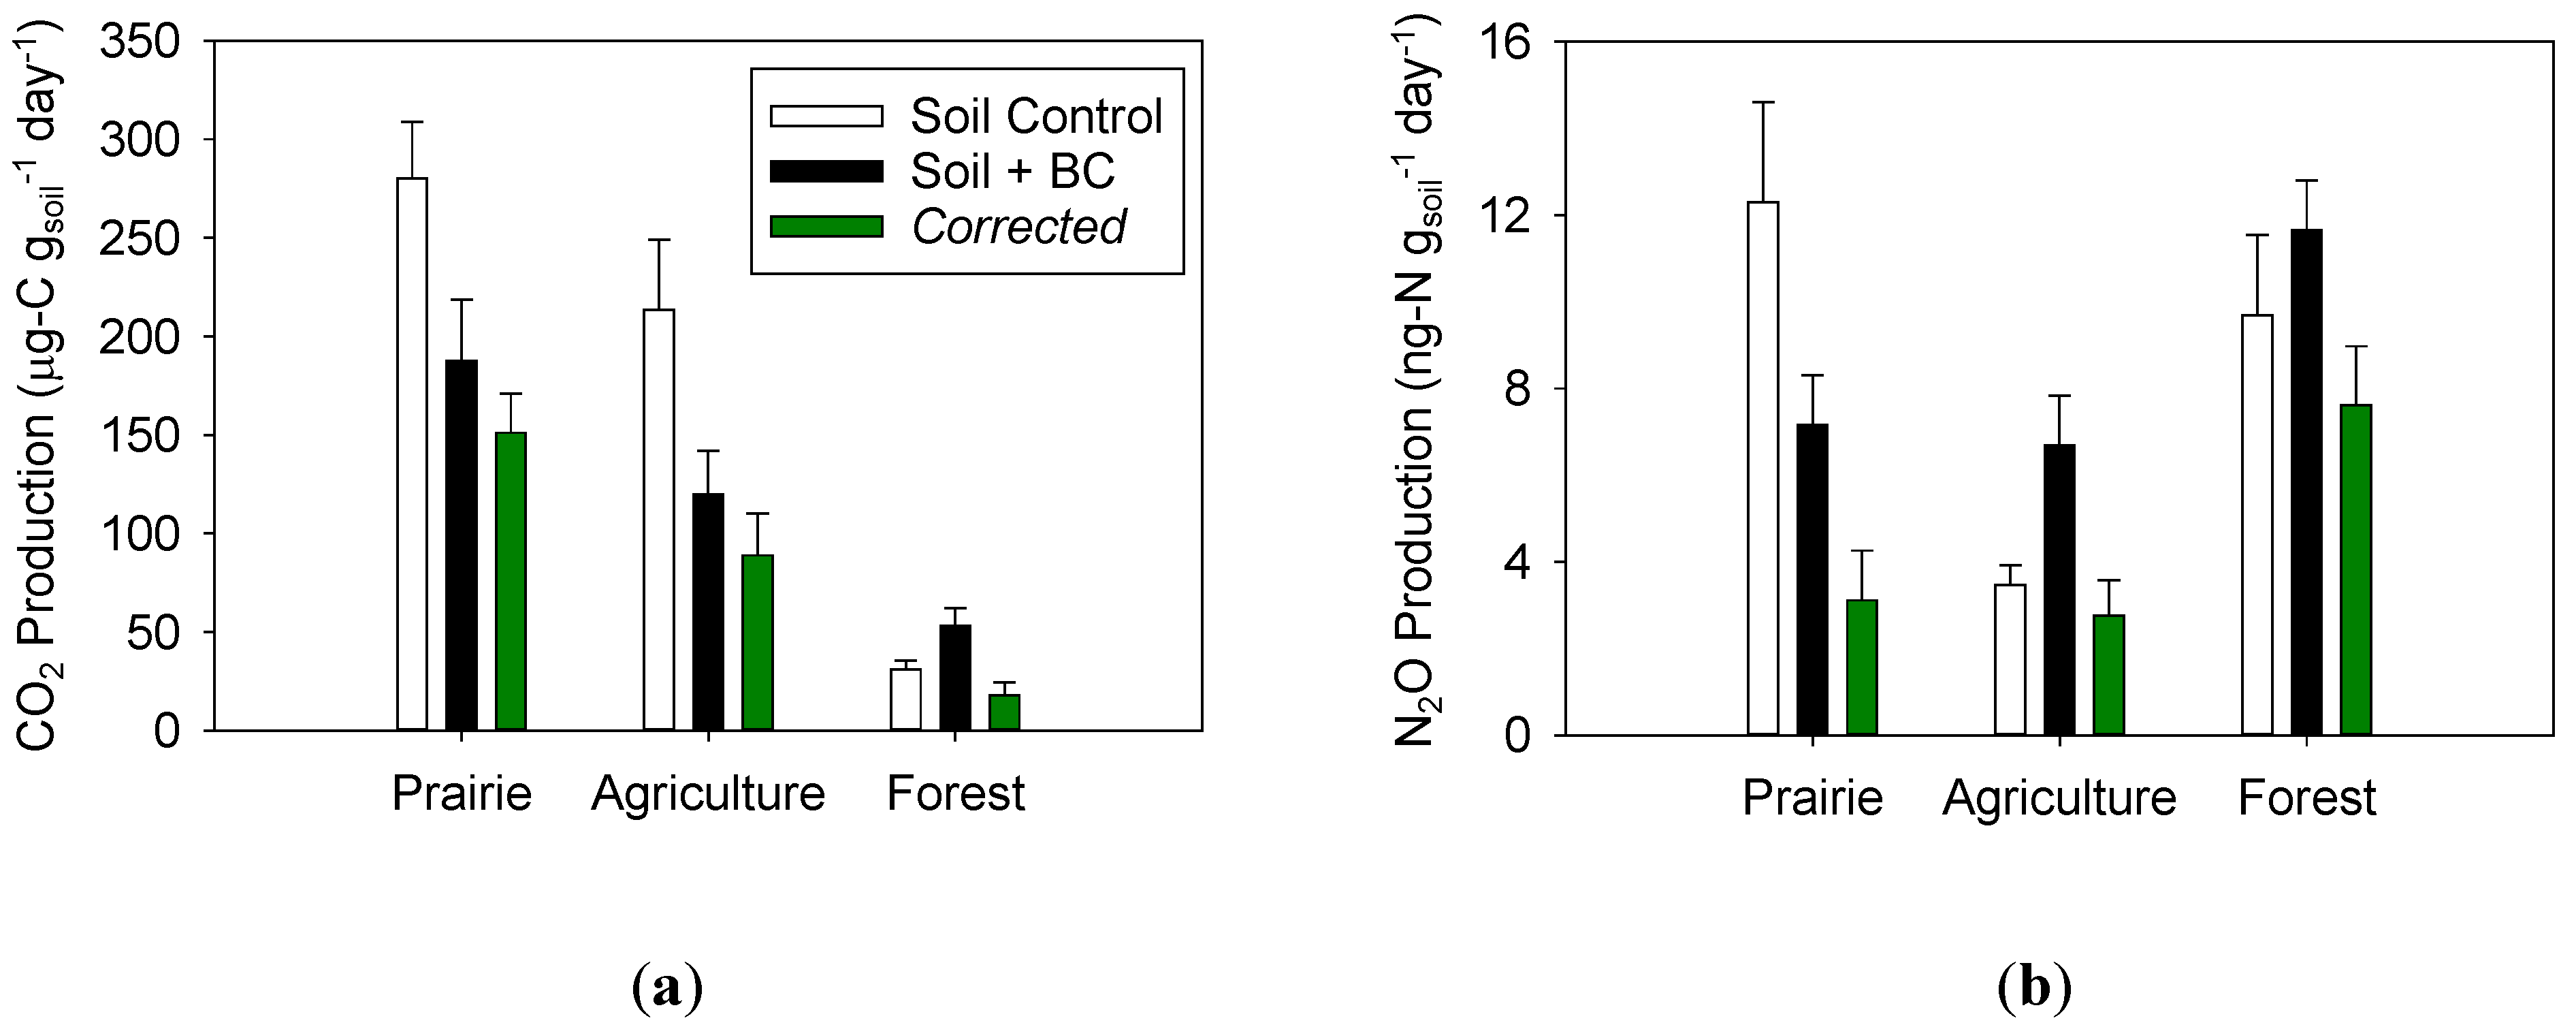
2.2. Impact of Biochar on Soil CO2 Production

CO2 production rates of the three soils with the biochar additions are shown in Figure 1. The CO2 production rate was the highest in the control prairie soil (280 μg-C g−1 day−1), which was followed by the agricultural (213 μg-C g−1 day−1) then the forest soil (31 μg-C g−1 day−1). This basal carbon mineralization rate was correlated to the soil microbial biomass, although not significantly with the limited number of soils (R = 0.92; p = 0.25). Sterilized sand controls possessed low CO2 (0.3 ± 0.05 μg-C g−1 day−1) and N2O (0.4 ± 0.3 ng-N g−1 day−1) production rates, consistent with an effective sterilization.
Compared to the control treatments (soils without biochar), biochar addition by itself reduced the net CO2 production rate in the two high microbial biomass soils by 33% in the agricultural soil (120 μg-C g−1 day−1 with BC) and 42% in the prairie soil (187 μg-C g−1 day−1). On the other hand, the biochar addition initially appeared to increase CO2 production by 67% in the forest soil (53 μg-C g−1 day−1). However, by subtracting the CO2 production of a sterilized sand + BC treatment (31 μg-C g−1 day−1) from the production rate of each soil + BC treatment to account for the abiotic production of CO2 for the biochar addition [3,46,47] (Figure 1; corrected data series), suppression was then observed universally in CO2 production following biochar addition in all soil types. The result after this correction was the reduction in CO2 production averaged 49% ± 9% for all three soils (green bars in Figure 1). Incidentally, this 31 μg-C g−1 day−1 production observed in the BC control (sterile sand + BC), is similar to the calculated intercept for the plot of soil CO2 vs. soil + biochar CO2 production rates (intercept = 32.4 μg-C g−1 day−1).
Figure 1. Average (a) CO2 and (b) N2O production rates observed from the control soils, biochar amended soils, and the mathematically corrected production rates over the entire 30 day incubation period. Rates were calculated from the slope of the change in headspace concentration with time from gas samples taken at various times during the incubation (Section 4.3). The error bars represent one standard deviation.
Agronomy 04 00478 g001

2.3. Impact of Biochar on Soil N2O Production

Observed average N2O production from the 3 soils for the 30 day period is presented in Figure 1. Initially, the biochar addition appeared to decrease N2O production in the prairie soil (42% decrease), but increase production in the forest (20% increase) and agricultural soils (94% increase). However, the sterile sand control did possess a production rate of 4.2 ± 0.7 ng-N g−1 day−1. This value for N2O production is intriguing, since the CO2 production from the same incubations was indicative of negligible microbial activity (0.3 ± 0.05 μg-C g−1 day−1). These data suggest the presence of an abiotic pathway (chemodenitrification or extracellular enzyme pathway) for N2O production with the presence of biochar. After subtracting this biochar control value from each of the soil types, biochar additions reduced N2O production rates across all soils compared to the soil control (Figure 1). However, suppression of N2O production rates in the forest soil by biochar was not statistically significant (p > 0.05). The suppression in N2O production ranged from 20% to 75%, with the greatest suppression in the prairie soil. Unlike the suppression in CO2 production which was very similar across the 3 soils following biochar addition, the inhibition of the N2O production was more variable.

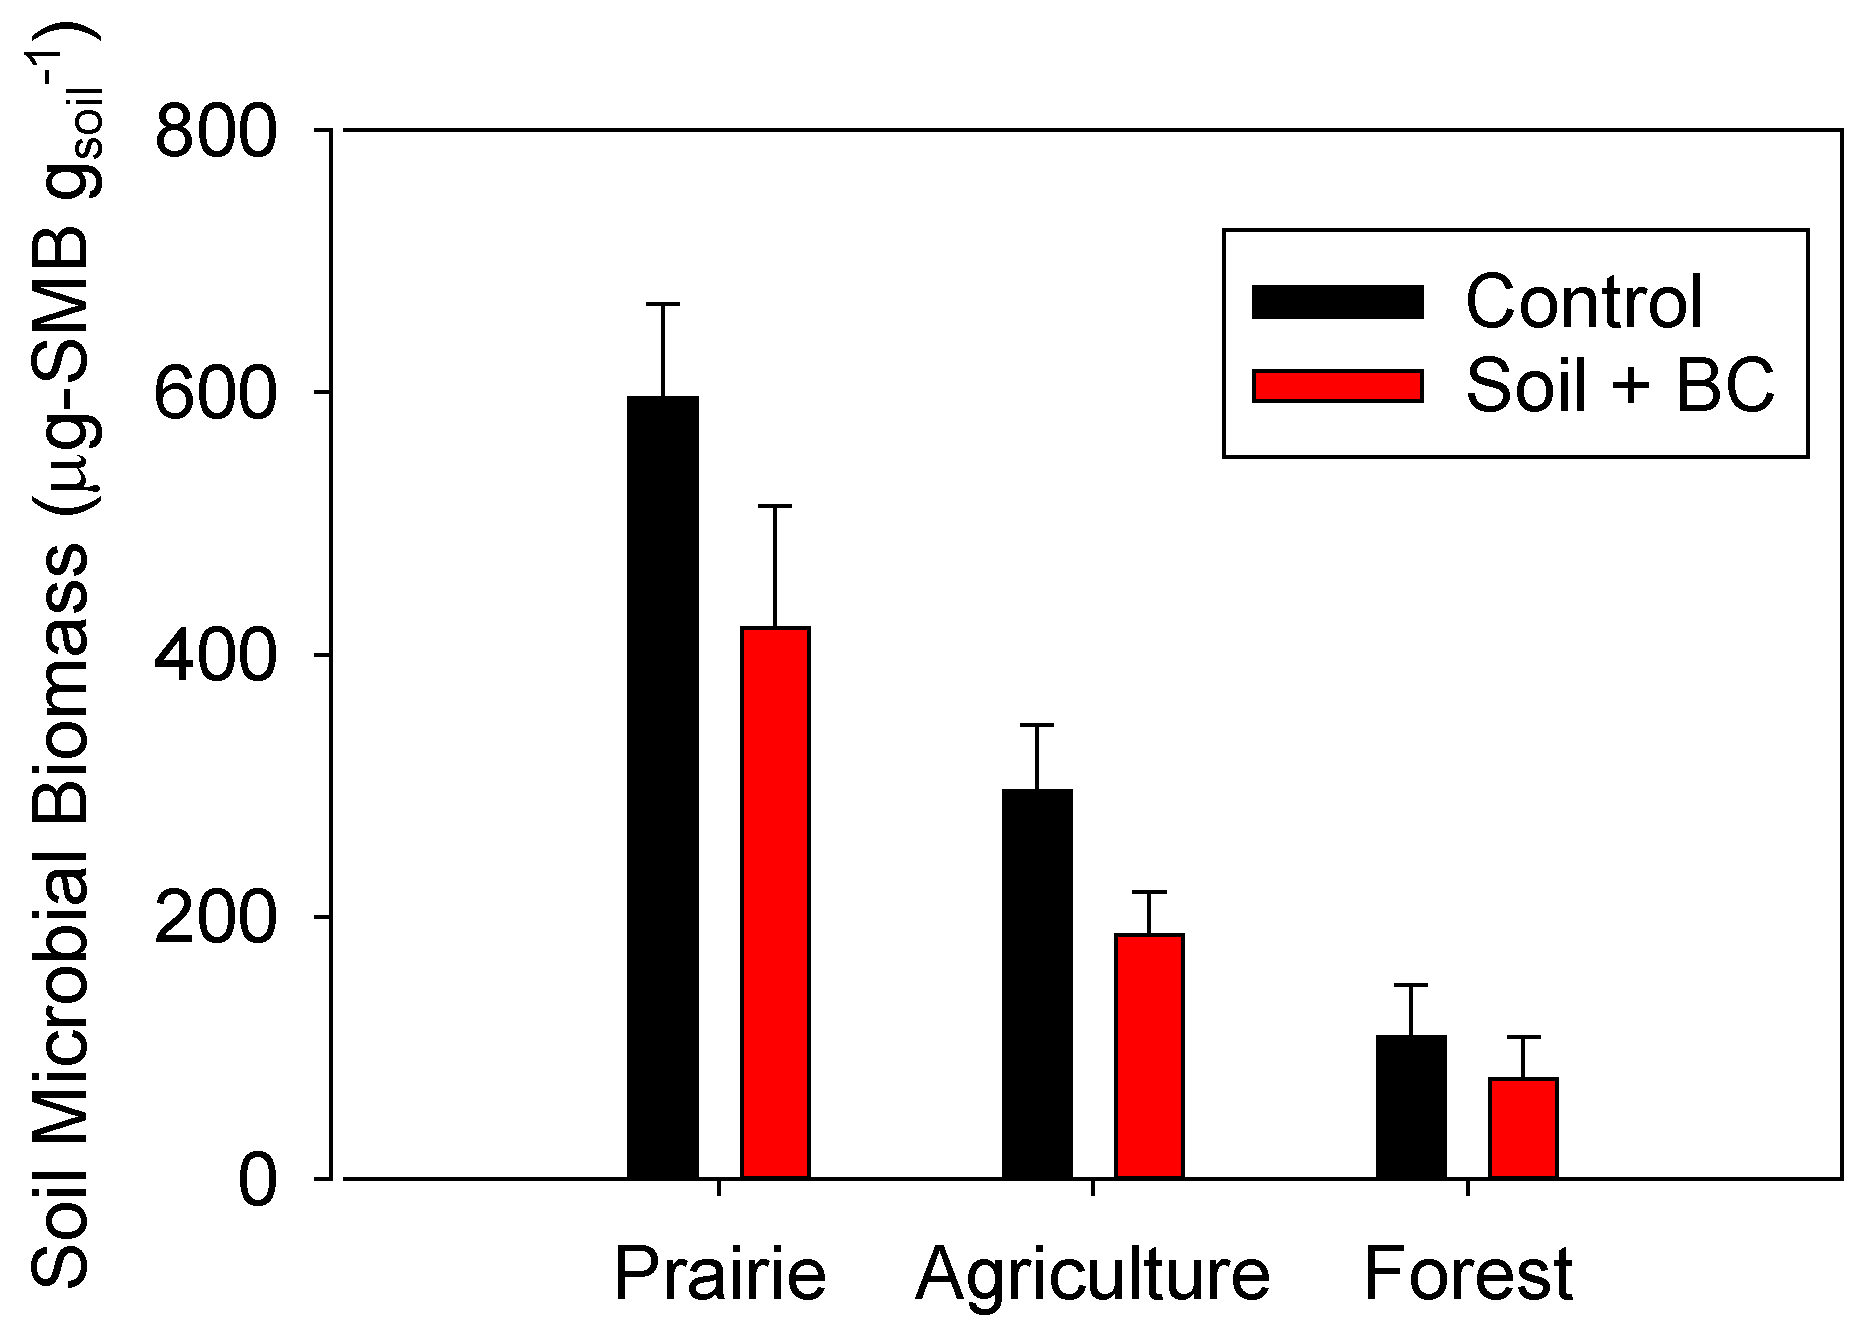
2.4. Impacts of Biochar Addition on Soil Microbial Biomass

There were different observations for the impact of biochar addition on the soil microbial biomass, which was a function of the original soil (Figure 2). Reductions were observed in soil microbial biomass as a result of the biochar addition across all three soil types. The magnitude of the reductions varied ranging from 30% to 37% (Figure 2), with the differences in the prairie and agricultural soils being statistically significant (p < 0.05). It is interesting to note that this suppression was not as great as the reductions in CO2 (49%) and N2O (20%–75%) production rates following biochar addition.
Figure 2. Observed impacts on soil microbial biomass (SMB) as a function of biochar addition across the three soils. The error bars represent one standard deviation of the triplicate assessments. The asterisk indicates a statistically significant difference between the control and biochar addition with a t-test at the 95% confidence level (p < 0.05) grouped by soil type.
Agronomy 04 00478 g002

2.5. Microbial Group Functional Assessment of N2O and CO2 Production

The results of the microbial inhibitors for the three soils are shown in Table 1, Table 2 and Table 3. Overall, the control soil inhibitor additive ratio (IAR) was between 1.28 and 1.52 and the biochar amended IAR was between 0.4 and 1.5. These values suggest addition antagonist effects of the biochar in the action of the antimicrobial agents. The inhibitors were effective in the non-amended soils, inhibiting between 58% to 68% of the CO2 activity and 45% to 62% of the N2O production.
Table 2. Selective inhibitor incubation results for the prairie soil.
TreatmentsCO2N2O
ControlBiocharControlBiochar
μg-C g−1 h−1μg-C g−1 h−1ng-N g−1 h−1ng-N g−1 h−1
Glucose Addition26.9 (3.2) a18.90 (4.20) a32.5 (2.2) a22.70 (4.10) a
Streptomycin + Glucose19.9 (2.3) b16.58 (5.10) a22.6 (3.4) b18.85 (2.00) a
Cyclohexamide + Glucose8.4 (3.7) c9.50 (4.20) b16.9 (4.5) c14.55 (3.10) b
Both inhibitors + Glucose9.4 (3.4) c10.00 (3.50) b12.8 (3.6) c16.52 (4.20) b
Calculations
Net Microbial Inhibition (%)64.8447.0960.8227.22
Bacterial Contribution (%)26.0712.28 *30.7016.96 *
Fungal (%)68.5749.74 *48.2235.90
IAR1.461.321.301.94
Fungal: Bacterial2.64.1 *1.62.1 *
Similar letters indicate production rates that are statistically equal (p < 0.05) within a given treatment as indicated through one-way ANOVAs separated by gas type and control/biochar groupings followed with post-hoc Tukey’s test. The asterisk (*) indicates a statistically significant difference between the control and biochar amended soil through a t-test comparing the control and biochar treatments separately for each gas at the p < 0.05 level for inhibition percentages, bacterial and fungal contributions, IAR and Fungal: Bacterial ratio. IAR is the “inhibitor additive ratio”, see Section 4.2 for description.
Table 3. Selective inhibitor incubation results for the agricultural soil.
TreatmentsControl BiocharControl Biochar
CO2CO2N2ON2O
μg-C-CO2 g−1 h−1μg-C-CO2 g−1 h−1ng-N-N2O g−1 h−1ng-N-N2O g−1 h−1
Glucose Addition13.3 (1.2) a8.4 (1.5) a27.7 (2.0) a10.1 (2.0) a
Streptomycin + Glucose7.8 (1.3) b6.9 (1.1) a18.5 (1.8) b9.5 (0.6) a
Cyclohexamide + Glucose5.4 (0.6) c3.2 (0.7) b14.8 (2.2) b9.0 (0.8) a
Both inhibitors + Glucose4.3 (1.4) c3.0 (1.1) b10.4 (3.4) c8.5 (0.9) a
Calculations
Net Microbial Inhibition (%)68.0964.3562.4515.84 *
Bacterial Contribution (%)41.2518.06 *33.395.94 *
Fungal (%)59.2062.3246.6810.89 *
IAR1.481.251.281.06
Fungal: Bacterial1.43.5 *1.41.8 *
Similar letters indicate production rates that are statistically equal (p < 0.05) within a given treatment as indicated through one-way ANOVAs separated by gas type and control/biochar groupings followed with post-hoc Tukey’s test. The asterisk (*) indicates a statistically significant difference between the control and biochar amended soil through a t-test comparing the control and biochar treatments separately for each gas at the p < 0.05 level for inhibition percentages, bacterial and fungal contributions, IAR and Fungal: Bacterial ratio. IAR is the “inhibitor additive ratio”, see Section 4.2 for description.
After the biochar addition, the inhibitors suppressed 27% to 64% for CO2, but only 7% to 27% of the production for N2O (Table 1, Table 2 and Table 3). Since these incubations were conducted simultaneously for CO2 and N2O production, despite antagonism in the performance of the inhibitors with the presence of the biochar (IAR = 0.4 to 1.4), we do believe the data is still valid due to the separating the activity of the microbial groups as assessed through the CO2 production was still reasonable for the forest soil. However, the strength of the relationships from the forest soil will be considered with caution in light of this observation.
All soils after biochar amendment possessed a lower estimated bacterial contribution to N2O and CO2 production, compared to the original soils (Table 2, Table 3 and Table 4). The soils thereby shifted to a higher fungal dominated respiration activity after biochar addition. The fungal: bacterial activity for N2O production for the prairie (Table 2) and agricultural (Table 3) soils were higher following biochar additions, but equal for the forest soils (Table 4). However, attributing the suppression in N2O to a particular microbial group (bacteria or fungi) was not possible, since there was a lack of statistical differences in the N2O production between the control and the various inhibitors in biochar amended soils (Table 2, Table 3 and Table 4).
Table 4. Selective inhibitor incubation results for the forest soil.
TreatmentsControlSoil + BiocharControlSoil + Biochar
CO2CO2N2ON2O
µg-C-CO2 g−1 h−1µg-C-CO2 g−1 h−1ng-N-N2O g−1 h−1ng-N-N2O g−1 h−1
Glucose Addition4.9 (1.0) a3.44 (0.80) a3.6 (1.0) a2.70 (0.50) a
Streptomycin + Glucose1.9 (0.9) b3.30 (0.90) a1.9 (0.9) a2.50 (0.90) a
Cyclohexamide + Glucose3.6 (0.6) a3.20 (1.00) a2.8 (0.8) a2.60 (0.40) a
Both inhibitors + Glucose2.1 (0.5) b2.50 (0.90) a2.0 (0.8) a2.50 (0.56) a
Calculations
Net Microbial Inhibition (%)57.7327.33 *45.077.41 *
Bacterial Contribution (%)60.824.07 *46.487.41 *
Fungal (%)26.806.98 *21.973.70 *
IAR1.520.401.521.50
Fungal: Bacterial0.41.7 *0.50.5
Similar letters indicate production rates that are statistically equal (p < 0.05) within a given treatment as indicated through one-way ANOVAs separated by gas type and control/biochar groupings followed with post-hoc Tukey’s test. The asterisk (*) indicates a statistically significant difference between the control and biochar amended soil through a t-test comparing the control and biochar treatments separately for each gas at the p < 0.05 level for inhibition percentages, bacterial and fungal contributions, IAR and Fungal: Bacterial ratio. IAR is the “inhibitor additive ratio”, see Section 4.2 for description.

3. Discussion

The biochar amendment increased pH values from 5.5 to 6.1 for the agricultural soil, from 4.5 to 4.7 for the forest soil, and 7.2 to 7.5 for the prairie soil. However, these changes in the soil pH values were all in the direction of making the biochar amended soil more alkaline. Typically, increasing soil pH also increases the production rate of N2O [48]. Therefore, the decrease in the N2O production observed in these incubations could not be directly linked to these observed pH increases, which has also been concluded by others e.g., [15].
Nitrification rates are inhibited when soil pH drops below 6.0 [49,50]. With pH values of the forest soil (4.7) and the agricultural soil (6.5), the original N2O production in the soils potentially were not attributable to microbial nitrification [51,52,53]. It has been observed that fungi produced N2O instead of N2 through codenitrification in the presence of other nitrogen compounds, such as azide, salicylhydroxamic acid, nitrite and ammonium [54,55]. Since biochar can contain acyl azide as well as other N compounds [56], biochar additions could enhance these fungal codenitrification processes. Fungi could also be indirectly involved in the abiotic N2O production with the amino acid metabolism by fungal extracellular enzymes, such as amino peptidase, glycosidic and proteolytic enzymes [57]. Amino acids are the most common forms of organic N in soils [58]. McLain and Martens [59] speculated that fungal mineralization of amino acids could be a principal N2O source, which is also supported by other studies [60]. This hypothesis could be supported by the fact that after biochar addition, the B:F ratio in the amended soils did decrease, indicating that fungi were contributing more to the CO2 production post biochar addition. However, the fact that there was no significant alteration in N2O production with the fungal inhibitor casts doubt on N2O production being related to fungal codenitrification in these incubations.
Besides microbial processes of nitrification and denitrification, biochar amendments could influence the abiotic processes, which include chemodenitrification reactions. Chemodenitrification refers to a broad class of chemical reactions occurring in soils that can reduce nitrate/nitrite to N2O and N2, which may involve organic nitrogen compounds (e.g., amines, amides) and reduced metals (e.g., Fe2+) [61,62,63,64]. Previous research has demonstrated that the abiotic reaction of nitrate and nitrite with iron can have significant impacts on N2O production [65,66,67], which is slowly gaining more attention in recent studies [68]. Iron can reduce nitrate under acidic conditions (pH range 2 to 7) [69]. Additionally, N2O is stable in the presence of Fe2+ at near neutral conditions (pH = 6); however, 84% of N2O was rapidly reduced to N2 in alkaline conditions (pH = 8) by Fe2+ [63]. Furthermore, biochar can be a catalyst for these reactions with nitrogen compounds, which includes the abiotic conversion of N2O to N2 at elevated temperatures [70]. Since biochar is typically alkaline and possesses higher concentrations of inorganic constituents (e.g., Fe) than the original biomass [22,71,72] or soils (Table 1), these chemical reactions could be an important set of mechanisms in biochar amended soils.
The addition of biochar did change the routes of N2O production in the soils examined here. This hypothesis is supported by the selective inhibitor incubations. Even though we did not inhibit 100% of the microbial activity (Table 1, Table 2 and Table 3), these suppression levels (~65% in the gas production) has been used as an estimate for the CO2 and N2O activity levels of the respective microbial groups [60]. For instance, Bailey et al. [73] observed a range in suppression between 39%–60%, which was also observed in the studies of Semenov et al. [74] and Ananyeva et al. [75]. In our study, the production of N2O was not significantly different in the biochar amended soils following the addition of the inhibitors, indicating that there was minor involvement of the soil microbial community in the production or consumption of N2O in these biochar-amended soils. In fact, the addition of inhibitors suppressed between 7% to 27% of the N2O production in biochar amended soils, compared to 47% to 64% suppression of the N2O production by inhibitors without biochar. One hypothesis could be that biochar interferes with the action of the chemical inhibitors. However, due to the differences observed in the CO2 production in the biochar amended soils (Table 1, Table 2 and Table 3), the inhibitors still were able to function in a biochar amended soil.
Another explanation of abiotic N2O/N2 production could be through the interaction of iron in the biochar, and the potential reduction of nitrate/nitrite/N2O to N2 catalyzed by ferric ion and charcoal. Ferric iron-reducing bacteria generate ferrous iron, which reacts chemically with nitrite to produce N2O and N2 by chemodenitrification [76,77,78]. Sang et al. [79] reported that Fe in zeolites could be catalytically activated for N2O decomposition. Lehmann and Joseph (2009) mentioned that high mineral-ash biochar had the similar properties to zeolites, thus iron from biochar could catalyze N2O reduction. High hydroxyl ion availability leads to carboxyl groups on the biochar losing a proton to form a carboxyl anion [33,80]. Hydroxyl groups on the biochar can form an ionic bond when alkaline and correspondingly react with nitrate/nitrite, which could happen due to potential alkaline microsites within the biochar [21,81,82]. Therefore, the hypothesis here is that after addition of this particular biochar to soil, biochar aided chemodenirification reactions (abiotic) resulting in the alteration of availability of nitrate and nitrite, as well as reduced microbial routes of N2O production. The contribution of iron in biochar to catalyze N2O→N2 production mechanisms requires further study [68], but could be a vital pathway in biochar amended soils.

4. Experimental Section

4.1. Soils and Biochar

Four soils (MN agricultural soil, northern MN forest soil, IL prairie soil, and sterilized sand) were used in a series of incubation experiments to assess the impact of biochar addition on N2O production and inorganic-N availability. The agricultural soil was collected from the University of Minnesota’s Research and Outreach Station in Rosemount, MN (44°45′ N, 93°04′ W). Agricultural soil at the site is a Waukegan silt loam (fine-silt over skeletal mixed, super active, mesic typic Hapludoll), with approximately 22% sand, 55% silt, 23% clay, and a slope < 2%. The forest soil was collected from Cloquet experimental forest (University of Minnesota) in northeastern MN (46°43′ N, 90°29′ W). Surface forest soil (0–5 cm) samples were collected from a glacial outwash and the soil was a Cloquet fine sandy loam (sandy mixed, frigid, Typic Dystrochrept). There is typically a 5 cm O-horizon (organic horizons; Oi and Oe) which was removed prior to sampling the top 0–5 cm of the mineral soil. The forest is dominated by Pinus banksiana. The last fire activity in this area is known to be in 1910. The prairie soil was sampled from a freshly burned (<1 year prior to sampling) tall grass prairie restoration site at Fermi National Accelerator Laboratory (FermiLab, Batavia, IL, USA), approximately 48 km west of Chicago, Illinois (41.50° N, 88.2° W) [83]. The sand was a commercial mix of a high purity washed and kiln dried silica sand with a particle size distribution of 0.6 to 1.7 mm (QUIKCRETE Company, Atlanta, GA, USA). The sand was steam autoclaved (135 °C, 1 h) 1 day prior to establishment of the soil incubations. All of the other soils were air dried and sieved to <2 mm prior to the establishment of the incubations. These soils represent a range of initial N2O production potentials. The chemical properties for these soils are given in Table 1.
The biochar utilized in our experiments was made of macadamia nut shell biochar created by fast pyrolysis at 500–550 °C. The biochar was mechanically ground and sieved (<0.5 mm) prior to incubations. The biochar was characterized by proximate (ASTM D5142) and ultimate analyses (ASTM ASTM D3176-09) by a commercial laboratory (Hazen Research, Inc.; Golden, CO, USA). The chemical and physical properties of the biochar are presented in Table 1.

4.2. Incubations

To analyze the effects of biochar on soil N2O and CO2 production, an experiment was designed as follows. Quadruplicate incubations were established for the various treatments for each soil, which included a control (5 g soil) and a 10% (w/w) addition of biochar (BC: 5 g soil + 0.5 g biochar). For each treatment, the soil and biochar were manually mixed in a 125 mL serum bottle (Wheaton Glass, Millville, NJ, USA), prior to soil moisture adjustment. Distilled water was added to bring each soil up to the target soil moisture potential (−33 kPa; typically 40%–80% total water holding capacity) and then sealed with a red butyl rubber septa (Grace, Deerfield, IL, USA) and aluminum crimp. This particular biochar addition did not statistically alter the field capacity moisture content (Ψ = −33 kPa soil moisture potential) for any soil + biochar mixtures compared to the original soil in this experiment. This could be a result of the grinding of the biochar, which produced a very fine powder (<0.5 mm) [84,85]. Therefore, the moisture additions were equal for the soil and soil + biochar treatments for each soil type. These incubations were pre-incubated for 7 days to allow recovery of the microbial communities, and reduce the artifacts on GHG production arising from re-wetting of dry soil [86,87]. After these 7 days, the septa were removed and the incubations were vented and then resealed. These incubations were monitored for an additional 30 days to assess CO2 and N2O production as a function of soil type and biochar addition.
An additional set of incubations were established for the selective inhibitor respiration method to assess the contribution of microbial groups (bacteria or fungi) to CO2 and N2O production [88]. For the selective inhibitor incubations, each soil type was pre-incubated as outlined above (7 days); with and without biochar (12 replicates for each). In addition, there were 3 lab air control vials included in each set to capture the lab air concentration at the start of the incubation. After venting, both the soil and soil + biochar incubations received the following chemical inhibitors and glucose additions in triplicate and then resealed. The four treatments were: (A) No addition of antibiotics, (B) Treated with cyclohexamide (fungicide; 2 mg g−1), (C) Treated with streptomycin (bactericide; 5 mg g−1), and (D) Treated with both inhibitors. The inhibitors were added dry in a mixture of talc to easy measuring and dispersal. All four of these treatments received a glucose addition (5 mg g−1) and the water holding content was then adjusted to field capacity (Ψ = −33kPa) (40%–60% WHC) for all three soils [89]. Preliminary data showed that the addition of 5.0 mg g−1 glucose provided maximal respiration activity across for all the soils (data not shown). Changes in gas production rates following cycloheximide additions were interpreted to be due to the absence of fungi, and changes in rates following streptomycin additions were attributed to the absence of bacteria.
The incubations were immediately sealed and then the headspace gas was analyzed after 6 h to assess microbial contribution to GHG production. Simultaneous determination of the respiration of CO2 and N2O following the inhibitor additions was accomplished through analyzing the headspace by gas chromatography (GC). These samples were incubated at laboratory temperature (20.5 ± 0.3 °C). Longer incubation periods (>6 h) caused confounding inhibitor effects, where the inhibitor incubation possessed higher production rates than the controls. This increase in GHG production has been linked to mineralization of the inhibitor chemicals [90,91,92].
The bacterial:fungal ratio (BFR) and inhibitor additive ratio (IAR) were calculated according to the formulas given in Bailey et al. [73], where:
Agronomy 04 00478 i001
and:
Agronomy 04 00478 i002
where the letters A–D are defined by the four treatments: (A) No addition of antibiotics; (B) Soil treated with cyclohexamide (fungicide); (C) Soil treated with streptomycin (bactericide); and (D) Soil treated with both inhibitors. The IAR provides an indication of the amount which the antimicrobial activities of the two antibiotics overlap [73]. An IAR > 1.0 indicates an overlap in the inhibitor activities and an antagonistic effect is possible when the IAR < 1.0, a value of 1.0 indicates ideal inhibitor conditions [73].
We also utilized treatment (A) as a substrate induced respiration assessment of soil microbial biomass (SMB), by utilizing the relationship of:
μg soil microbial biomass (SMB) g−1 = (40.04φ) + 0.37
where φ is the rate of CO2 production (μL CO2 gsoil−1 h−1) following a glucose addition [93]. The value for φ (μL CO2 gsoil−1 h−1) was calculated from the headspace concentration increase that occurred after 6 h with the following formula:
φ = ( G C   r e s u l t   i n c u b a t i o n     L a b   A i r   C o n t r o l )   ×   0.120   L ( 6   h )   ( 5   g s o i l )
where the GC result incubation has been corrected for the 5 mL dilution during sampling (see Section 4.3), Lab Air Control is the starting lab CO2 concentration (also corrected), and the 0.120 L is the headspace of the serum bottle (120 mL). The GC results will have the units of ppmv or   [ μ L L ] .

4.3. Measurements and Analysis

At the designated sampling time, 5 mL of laboratory air [94] was injected into the sealed vials with a syringe, and the syringe was flushed 3 times with lab air to mix the serum bottle headspace gas, then 5 mL of headspace mixed gas was pulled back to the syringe and injected into auto-sampler vial that had been flushed with helium for analysis. The samples were analyzed on a gas chromatograph (GC) system for concentrations of CO2 and N2O [46]. The electronic data values from the GC systems (CGC Reported Value) are collected through an R script in which the GC values are initially corrected for the dilution of lab air (CLab Air) by the following relationship for each gas for interest:
C Corrected = [ 125   m L   ×   C G C   R e p o r t e d   V a l u e     ( 5 m L   ×   C L a b   A i r ) ] ( 120   m L )
These corrected concentrations (CCorrected) are then used to determine the average rate (slope) of gas production over the entire incubation (Figure 3). For the soil GHG production incubations, headspace gas samples of the experiments were typically taken after 1, 3, 5, 7, 14, 21, and 30 days. For all incubations the R2 for the linear fit between headspace concentrations and time ranged from 0.94 to 0.99. The calculation of mass based gas production rates (P) (μg-C g−1 day−1 or ng-N g−1 day−1) was estimated as follows:
Agronomy 04 00478 i003
where slope is the linear change in incubation headspace concentration versus time (Figure 3) (ppmv (μL L−1) day−1 for CO2 and ppbv (nL L−1) day−1 for N2O), 22.47 is the volume in L for 1 mole of an ideal gas at normal temperature and pressure (NTP) conditions (1 atm pressure and 25 °C), M is the molecular weight of the gas (44 g CO2 or N2O mole−1), χ is the ratio of the molar mass of C or N to molecular weight of the gas (i.e., 12/44 for C in CO2, 28/44 for N in N2O), V is the headspace volume of the serum bottle (0.120 L), and Sg is the dry soil weight used (5 g). Thereby, the resulting units for CO2 production rate are μg-C g−1 day−1 and ng-N g−1 day−1 for N2O.
Figure 3. Example of the CO2 accumulation in the headspace of a sample vial over the 30 day incubation period. The slope calculation is shown on the figure, which corresponds to a rate of 792.6 ppmv CO2 day−1 and by using Equation (6) a mass based production rate of 10.2 μg-C g−1 day−1.
Agronomy 04 00478 g003
Arithmetic means of CO2 and N2O concentrations were calculated based on the four replicate samples. Greenhouse gas (CO2 and N2O) production rates were determined from the linear increase or decrease in concentrations over time of the incubation. The net production/consumption rates of the biochar addition were also corrected for abiotic production by subtracting a sterilized sand + biochar control from the soil + biochar production data:
RateBC Corrected = Ratesoil + BC - RateSterile sand + BC
Despite the fact that there are differences in the chemical composition, the sterile sand + biochar control was assumed to represent the production potential of the biochar itself, without any additional soil constituents.

4.4. Statistics

Average CO2 and N2O gas production rates following biochar additions were analyzed separately by soil type with a Student’s t-test at the 95% confidence level (p < 0.05) using R. Additionally, we analyzed each soil type separately using one-way ANOVAs with post-hoc Tukey’s test to analyze for significant differences among the antibiotics for each gas type within each treatment (control or biochar). The assumption of normality was verified with the Kolmogorov–Smirnov test and homogeneity of variance was confirmed with the Bartlett test. Correlation analyses were used to explore relationships among variables. Significance was defined as p ≤ 0.05, unless otherwise indicated. R statistical software was used for all analyses.

5. Conclusions

Our experimental results showed that biochar universally stimulated fungal activity and suppressed CO2 and N2O production across all three soil types. From the data presented here, biochar appears to react with various N forms (nitrate, nitrite, or N2O), with the potential catalytic involvement of iron. The conclusion drawn here is the impact of biochar on N2O production in these soils was through abiotic (chemodenitrification) mechanisms, as confirmed with the selective inhibitor data. Since biochars are highly heterogeneous, these results are specific to this particular biochar and should not be extrapolated to other biochar types. We hypothesize that iron-rich biochar can stimulate the abiotic transformation of nitrate/nitrite/N2O to N2. The results from this study provide additional insights into the understanding of biochar effects on N2O production through chemodenitrification mechanisms. These abiotic biochar impacts could be very important when using biochar as an amendment, especially in low-microbial activity soils.

Acknowledgments

This work was partly supported by grants from the Chinese National Natural Science Foundation (Nos. 51039007, and 51179212), Chinese Scholarship Council Research Program (Nos. 2011638053). Comments from two anonymous reviewers also assisted in improving the impact of the manuscript. In addition, support from the Minnesota Corn Research and Promotion Council and the Agricultural Utilization Research Institute (AURI) are also recognized.

Author Contributions

All authors contributed equally to this work.

Conflicts of Interest

The authors declare no conflict of interest.

References and Note

  1. Lehmann, J. A handful of carbon. Nature 2007, 447, 143–144. [Google Scholar] [PubMed]
  2. Clough, T.; Condron, L.; Kammann, C.; Müller, C. A review of biochar and soil nitrogen dynamics. Agronomy 2013, 3, 275–293. [Google Scholar] [CrossRef]
  3. Ameloot, N.; Graber, E.R.; Verheijen, F.G.A.; De Neve, S. Interactions between biochar stability and soil organisms: Review and research needs. Eur. J. Soil Sci. 2013, 64, 379–390. [Google Scholar] [CrossRef]
  4. Gaskin, J.W.; Steiner, C.; Harris, K.; Das, K.C.; Bibens, B. Effect of low-temperature pyrolysis conditions on biochar for agriculutral use. Trans. ASABE 2008, 51, 2061–2069. [Google Scholar] [CrossRef]
  5. Steiner, C.; Das, K.C.; Garcia, M.; Förster, B.; Zech, W. Charcoal and smoke extract stimulate the soil microbial community in a highly weathered xanthic Ferralsol. Pedobiologia 2008, 51, 359–366. [Google Scholar] [CrossRef]
  6. Van Zwieten, L.; Singh, B.P.; Kimber, S.W.L.; Murphy, D.V.; Macdonald, L.M.; Rust, J.; Morris, S. An incubation study investigating the mechanisms that impact N2O flux from soil following biochar application. Agric. Ecosyst. Environ. 2014, 191, 53–62. [Google Scholar] [CrossRef]
  7. Martin, S.M.; Kookana, R.S.; Van Zwieten, L.; Krull, E. Marked changes in herbicide sorption–desorption upon ageing of biochars in soil. J. Hazard. Mater. 2012, 231–232, 70–78. [Google Scholar] [CrossRef] [PubMed]
  8. Gurwick, N.P.; Moore, L.A.; Kelly, C.; Elias, P. A systematic review of biochar research, with a focus on its stability in situ and its promise as a climate mitigation strategy. PLoS One 2013, 8, e75932. [Google Scholar] [CrossRef] [PubMed]
  9. Zhang, A.; Bian, R.; Pan, G.; Cui, L.; Hussain, Q.; Li, L.; Zheng, J.; Zheng, J.; Zhang, X.; Han, X.; et al. Effects of biochar amendment on soil quality, crop yield and greenhouse gas emission in a Chinese rice paddy: A field study of 2 consecutive rice growing cycles. Field Crops Res. 2012, 127, 153–160. [Google Scholar]
  10. Cayuela, M.L.; Oenema, O.; Kuikman, P.J.; Bakker, R.R.; Van Groenigen, J.W. Bioenergy by-products as soil amendments? Implications for carbon sequestration and greenhouse gas emissions. GCB Bioenergy 2010, 2, 201–213. [Google Scholar]
  11. Zhang, A.; Cui, L.; Pan, G.; Li, L.; Hussain, Q.; Zhang, X.; Zheng, J.; Crowley, D. Effect of biochar amendment on yield and methane and nitrous oxide emissions from a rice paddy from Tai Lake plain, China. Agric. Ecosyst. Environ. 2010, 139, 469–475. [Google Scholar] [CrossRef]
  12. Spokas, K.; Reicosky, D. Impacts of sixteen different biochars on soil greenhouse gas production. Ann. Environ. Sci. 2009, 3, 179–193. [Google Scholar]
  13. Spokas, K.A. Impact of biochar field aging on laboratory greenhouse gas production potentials. GCB Bioenergy 2013, 5, 165–176. [Google Scholar] [CrossRef]
  14. Mills, R.T.E.; Dewhirst, N.; Sowerby, A.; Emmett, B.A.; Jones, D.L. Interactive effects of depth and temperature on CH4 and N2O flux in a shallow podzol. Soil Biol. Biochem. 2013, 62, 1–4. [Google Scholar] [CrossRef]
  15. Cayuela, M.L.; Sánchez-Monedero, M.A.; Roig, A.; Hanley, K.; Enders, A.; Lehmann, J. Biochar and denitrification in soils: When, how much and why does biochar reduce N2O emissions? Sci. Rep. 2013, 3, 1732. [Google Scholar]
  16. Angst, T.E.; Patterson, C.J.; Reay, D.S.; Anderson, P.; Peshkur, T.A.; Sohi, S.P. Biochar diminishes nitrous oxide and nitrate leaching from diverse nutrient sources. J. Environ. Qual. 2013, 42, 672–682. [Google Scholar] [CrossRef] [PubMed]
  17. Thomson, A.J.; Giannopoulos, G.; Pretty, J.; Baggs, E.M.; Richardson, D.J. Biological sources and sinks of nitrous oxide and strategies to mitigate emissions. Philos. Trans. R. Soc. B 2012, 367, 1157–1168. [Google Scholar] [CrossRef] [Green Version]
  18. Yanai, Y.; Toyota, K.; Okazaki, M. Effects of charcoal addition on N2O emissions from soil resulting from rewetting air-dried soil in short-term laboratory experiments. Soil Sci. Plant Nutr. 2007, 53, 181–188. [Google Scholar] [CrossRef]
  19. Cornelissen, G.; Rutherford, D.; Arp, H.P.H.; Doersch, P.; Kelly, C.N.; Rostad, C.E. Sorption of pure N2O to biochars and other organic and inorganic materials under anhydrous conditions. Environ. Sci. Technol. 2013, 47, 7704–7712. [Google Scholar] [CrossRef] [PubMed]
  20. Hanono, F.; Lerner, E. Adsorption of NO and N2O on charcoal between 195 and 300 K. J. Catal. 1978, 51, 398–405. [Google Scholar] [CrossRef]
  21. Seredych, M.; Bandosz, T.J. Mechanism of ammonia retention on graphite oxides: Role of surface chemistry and structure. J. Phys. Chem. C 2007, 111, 15596–15604. [Google Scholar] [CrossRef]
  22. Singh, B.; Singh, B.P.; Cowie, A.L. Characterisation and evaluation of biochars for their application as a soil amendment. Soil Res. 2010, 48, 516–525. [Google Scholar] [CrossRef]
  23. Cheng, C.H.; Lehmann, J.; Thies, J.E.; Burton, S.D.; Engelhard, M.H. Oxidation of black carbon by biotic and abiotic processes. Org. Geochem. 2006, 37, 1477–1488. [Google Scholar] [CrossRef]
  24. Case, S.D.C.; McNamara, N.P.; Reay, D.S.; Whitaker, J. The effect of biochar addition on N2O and CO2 emissions from a sandy loam soil—The role of soil aeration. Soil Biol. Biochem. 2012, 51, 125–134. [Google Scholar] [CrossRef]
  25. Novak, J.M.; Busscher, W.J.; Laird, D.L.; Ahmedna, M.; Watts, D.W.; Niandou, M.A.S. Impact of biochar amendment on fertility of a Southeastern coastal plain soil. Soil Sci. 2009, 174, 105–112. [Google Scholar] [CrossRef]
  26. Deenik, J.L.; McClellan, T.; Uehara, G.; Antal, M.J.; Campbell, S. Charcoal volatile matter content influences plant growth and soil nitrogen transformations. Soil Sci. Soc. Am. J. 2010, 74, 1259–1270. [Google Scholar] [CrossRef]
  27. Meller Harel, Y.; Elad, Y.; Rav-David, D.; Borenstein, M.; Shulchani, R.; Lew, B.; Graber, E. Biochar mediates systemic response of strawberry to foliar fungal pathogens. Plant Soil 2012, 357, 245–257. [Google Scholar]
  28. Nelson, D.C.; Flematti, G.R.; Ghisalberti, E.L.; Dixon, K.W.; Smith, S.M. Regulation of seed germination and seedling growth by chemical signals from burning vegetation. Plant Biol. 2012, 63, 107–130. [Google Scholar] [CrossRef]
  29. Clough, T.J.; Bertram, J.E.; Ray, J.L.; Condron, L.M.; O’Callaghan, M.; Sherlock, R.R.; Wells, N.S. Unweathered wood biochar impact on nitrous oxide emissions from a bovine-urine-amended pasture soil. Soil Sci. Soc. Am. J. 2010, 74, 852–860. [Google Scholar] [CrossRef]
  30. Spokas, K.A.; Novak, J.M.; Stewart, C.E.; Cantrell, K.B.; Uchimiya, M.; duSaire, M.G.; Ro, K.S. Qualitative analysis of volatile organic compounds on biochar. Chemosphere 2011, 85, 869–882. [Google Scholar] [CrossRef] [PubMed]
  31. Spokas, K.A.; Baker, J.M.; Reicosky, D.C. Ethylene: Potential key for biochar amendment impacts. Plant Soil 2010, 333, 443–452. [Google Scholar] [CrossRef]
  32. Spokas, K.; Novak, J.; Venterea, R. Biochar’s role as an alternative N-fertilizer: Ammonia capture. Plant Soil 2012, 350, 35–42. [Google Scholar] [CrossRef]
  33. Taghizadeh-Toosi, A.; Clough, T.; Sherlock, R.; Condron, L. Biochar adsorbed ammonia is bioavailable. Plant Soil 2012, 350, 57–69. [Google Scholar]
  34. Keeley, J.E.; Morton, B.A.; Pedrosa, A.; Trotter, P. Role of allelopathy, heat and charred wood in the germination of chaparral herbs and suffrutescents. J. Ecol. 1985, 73, 445–458. [Google Scholar] [CrossRef]
  35. Inderjit; Callaway, R.M. Experimental designs for the study of allelopathy. Plant Soil 2003, 256, 1–11. [Google Scholar]
  36. Putnam, A.R.; Duke, W.B. Allelopathy in agroecosystems. Annu. Rev. Phytopathol. 1978, 16, 431–451. [Google Scholar] [CrossRef]
  37. Chen, J.; Liu, X.; Zheng, J.; Zhang, B.; Lu, H.; Chi, Z.; Pan, G.; Li, L.; Zheng, J.; Zhang, X.; et al. Biochar soil amendment increased bacterial but decreased fungal gene abundance with shifts in community structure in a slightly acid rice paddy from Southwest China. Appl. Soil Ecol. 2013, 71, 33–44. [Google Scholar] [CrossRef]
  38. Harter, J.; Krause, H.-M.; Schuettler, S.; Ruser, R.; Fromme, M.; Scholten, T.; Kappler, A.; Behrens, S. Linking N2O emissions from biochar-amended soil to the structure and function of the N-cycling microbial community. ISME J 2014, 8, 660–674. [Google Scholar] [CrossRef] [PubMed]
  39. Bruun, E.W.; Ambus, P.; Egsgaard, H.; Hauggaard-Nielsen, H. Effects of slow and fast pyrolysis biochar on soil C and N turnover dynamics. Soil Biol. Biochem. 2012, 46, 73–79. [Google Scholar]
  40. Feng, Y.; Xu, Y.; Yu, Y.; Xie, Z.; Lin, X. Mechanisms of biochar decreasing methane emission from Chinese paddy soils. Soil Biol. Biochem. 2012, 46, 80–88. [Google Scholar] [CrossRef]
  41. Castaldi, S.; Riondino, M.; Baronti, S.; Esposito, F.R.; Marzaioli, R.; Rutigliano, F.A.; Vaccari, F.P.; Miglietta, F. Impact of biochar application to a Mediterranean wheat crop on soil microbial activity and greenhouse gas fluxes. Chemosphere 2011, 85, 1464–1471. [Google Scholar] [CrossRef] [PubMed]
  42. Lehmann, J.; Rillig, M.; Thies, J.; Masiello, C.A.; Hockaday, W.C.; Crowley, D. Biochar effects on soil biota—A review. Soil Biol. Biochem. 2011, 43, 1812–1836. [Google Scholar] [CrossRef]
  43. Bailey, V.L.; Fansler, S.J.; Smith, J.L.; Bolton, H., Jr. Reconciling apparent variability in effects of biochar amendment on soil enzyme activities by assay optimization. Soil Biol. Biochem. 2011, 43, 296–301. [Google Scholar] [CrossRef]
  44. Ducey, T.F.; Ippolito, J.A.; Cantrell, K.B.; Novak, J.M.; Lentz, R.D. Addition of activated switchgrass biochar to an aridic subsoil increases microbial nitrogen cycling gene abundances. Appl. Soil Ecol. 2013, 65, 65–72. [Google Scholar] [CrossRef]
  45. Bustin, S. Quantification of mRNA using real-time reverse transcription PCR (RT-PCR): Trends and problems. J. Mol. Endocrinol. 2002, 29, 23–39. [Google Scholar] [CrossRef] [PubMed]
  46. Spokas, K.A.; Koskinen, W.C.; Baker, J.M.; Reicosky, D.C. Impacts of woodchip biochar additions on greenhouse gas production and sorption/degradation of two herbicides in a Minnesota soil. Chemosphere 2009, 77, 574–581. [Google Scholar] [CrossRef] [PubMed]
  47. Jones, D.L.; Murphy, D.V.; Khalid, M.; Ahmad, W.; Edwards-Jones, G.; DeLuca, T.H. Short-term biochar-induced increase in soil CO2 release is both biotically and abiotically mediated. Soil Biol. Biochem. 2011, 43, 1723–1731. [Google Scholar] [CrossRef]
  48. Baggs, E.M.; Smales, C.L.; Bateman, E.J. Changing pH shifts the microbial sourceas well as the magnitude of N2O emission from soil. Biol. Fertility Soils 2010, 46, 793–805. [Google Scholar] [CrossRef]
  49. Lu, X.; Yan, Y.; Fan, J.; Wang, X. Gross nitrification and denitrification in alpine grassland ecosystems on the Tibetan Plateau. Arct. Antarct. Alp. Res. 2012, 44, 188–196. [Google Scholar] [CrossRef]
  50. Gubry-Rangin, C.; Nicol, G.W.; Prosser, J.I. Archaea rather than bacteria control nitrification in two agricultural acidic soils. FEMS Microbiol. Ecol. 2010, 74, 566–574. [Google Scholar] [CrossRef] [PubMed]
  51. Dancer, W.; Peterson, L.; Chesters, G. Ammonification and nitrification of N as influenced by soil pH and previous N treatments. Soil Sci. Soc. Am. J. 1973, 37, 67–69. [Google Scholar] [CrossRef]
  52. Durán, U.; Val del Río, A.; Campos, J.; Mosquera-Corral, A.; Méndez, R. Enhanced ammonia removal at room temperature by pH controlled partial nitrification and subsequent anaerobic ammonium oxidation. Environ. Technol. 2014, 35, 383–390. [Google Scholar] [CrossRef] [PubMed]
  53. Sutka, R.L.; Ostrom, N.; Ostrom, P.; Breznak, J.; Gandhi, H.; Pitt, A.; Li, F. Distinguishing nitrous oxide production from nitrification and denitrification on the basis of isotopomer abundances. Appl. Environ. Microbiol. 2006, 72, 638–644. [Google Scholar] [CrossRef] [PubMed]
  54. Liiri, M.; Ilmarinen, K.; Setälä, H. The significance of Cognettia sphagnetorum (Enchytraeidae) on nitrogen availability and plant growth in wood ash-treated humus soil. Plant Soil 2002, 246, 31–39. [Google Scholar] [CrossRef]
  55. Prendergast-Miller, M.T.; Baggs, E.M.; Johnson, D. Nitrous oxide production by the ectomycorrhizal fungi Paxillus involutus and Tylospora fibrillosa. FEMS Microbiol. Lett. 2011, 316, 31–35. [Google Scholar] [CrossRef] [PubMed]
  56. Chia, C.H.; Gong, B.; Joseph, S.D.; Marjo, C.E.; Munroe, P.; Rich, A.M. Imaging of mineral-enriched biochar by FTIR, Raman and SEM–EDX. Vib. Spectrosc 2012, 62, 248–257. [Google Scholar] [CrossRef]
  57. Crenshaw, C.; Lauber, C.; Sinsabaugh, R.; Stavely, L. Fungal control of nitrous oxide production in semiarid grassland. Biogeochemistry 2008, 87, 17–27. [Google Scholar] [CrossRef]
  58. Martens, D.A.; Loeffelmann, K.L. Soil amino acid composition quantified by acid hydrolysis and anion chromatography-pulsed amperometry. J. Agric. Food Chem. 2003, 51, 6521–6529. [Google Scholar] [CrossRef]
  59. McLain, J.E.; Martens, D.A. N2O production by heterotrophic N transformations in a semiarid soil. Appl. Soil Ecol. 2006, 32, 253–263. [Google Scholar] [CrossRef]
  60. Laughlin, R.J.; Stevens, R.J. Evidence for fungal dominance of denitrification and codenitrification in a grassland soil. Soil Sci. Soc. Am. J. 2002, 66, 1540–1548. [Google Scholar] [CrossRef]
  61. Chalk, P.M.; Smith, C.J. Chemodenitrification. In Gaseous Loss of Nitrogen from Plant-Soil Systems; Freney, J.R., Simpson, J.R., Eds.; Springer Press: Amsterdam, Netherlands, 1983; Volume 9, pp. 65–89. [Google Scholar]
  62. Hansen, H.C.B.; Koch, C.B.; Nancke-Krogh, H.; Borggaard, O.K.; Sørensen, J. Abiotic nitrate reduction to ammonium:  Key role of green rust. Environ. Sci. Technol. 1996, 30, 2053–2056. [Google Scholar] [CrossRef]
  63. Moraghan, J.T.; Buresh, R.J. Chemical reduction of nitrite and nitrous oxide by ferrous iron. Soil Sci. Soc. Am. J. 1977, 41, 47–50. [Google Scholar] [CrossRef]
  64. Chao, T.-T.; Kroontje, W. Inorganic nitrogen transformations through the oxidation and reduction of iron. Soil Sci. Soc. Am. J. 1966, 30, 193–196. [Google Scholar] [CrossRef]
  65. Van Cleemput, O.; Baert, L. Nitrite stability influenced by iron compounds. Soil Biol. Biochem. 1983, 15, 137–140. [Google Scholar]
  66. Sorensen, J. Nitrate reduction in marine sediment: Pathways and interactions with iron and sulfur cycling. Geomicrobiol. J. 1987, 5, 401–421. [Google Scholar]
  67. Samarkin, V.A.; Madigan, M.T.; Bowles, M.W.; Casciotti, K.L.; Priscu, J.C.; McKay, C.P.; Joye, S.B. Abiotic nitrous oxide emission from the hypersaline Don Juan Pond in Antarctica. Nat. Geosci. 2010, 3, 341–344. [Google Scholar] [CrossRef]
  68. Zhu, X.; Silva, L.C.R.; Doane, T.A.; Horwath, W.R. Iron: The forgotten driver of nitrous oxide production in agricultural soil. PLoS ONE 2013, 8, e60146. [Google Scholar] [CrossRef] [PubMed]
  69. Postma, D. Kinetics of nitrate reduction by detrital Fe(II)-silicates. Geochim. Cosmochim. Acta 1990, 54, 903–908. [Google Scholar] [CrossRef]
  70. Noda, K.; Chambrion, P.; Kyotani, T.; Tomita, A. A study of the N2 formation mechanism in carbon–N2O reaction by using isotope gases. Energy Fuel. 1999, 13, 941–946. [Google Scholar] [CrossRef]
  71. Brewer, C.E.; Schmidt-Rohr, K.; Satrio, J.A.; Brown, R.C. Characterization of biochar from fast pyrolysis and gasification systems. Environ. Prog. Sust. Energy 2009, 28, 386–396. [Google Scholar] [CrossRef]
  72. Atkinson, C.; Fitzgerald, J.; Hipps, N. Potential mechanisms for achieving agricultural benefits from biochar application to temperate soils: A review. Plant Soil 2010, 337, 1–18. [Google Scholar] [CrossRef]
  73. Bailey, V.; Smith, J.; Bolton, H. Novel antibiotics as inhibitors for the selective respiratory inhibition method of measuring fungal: Bacterial ratios in soil. Biol. Fertility Soils 2003, 38, 154–160. [Google Scholar] [CrossRef]
  74. Semenov, M.V.; Stolnikova, E.V.; Ananyeva, N.D.; Ivashchenko, K.V. Structure of the microbial community in soil catena of the right bank of the Oka River. Biol. Bull. 2013, 40, 266–274. [Google Scholar] [CrossRef]
  75. Ananyeva, N.D.; Castaldi, S.; Stolnikova, E.V.; Kudeyarov, V.N.; Valentini, R. Fungi-to-bacteria ratio in soils of European Russia. Arch. Agron. Soil Sci. 2014, in press. [Google Scholar]
  76. Cooper, D.C.; Picardal, F.F.; Coby, A.J. Interactions between microbial iron reduction and metal geochemistry: Effect of redox cycling on transition metal speciation in iron bearing sediments. Environ. Sci. Technol. 2006, 40, 1884–1891. [Google Scholar] [CrossRef] [PubMed]
  77. Coby, A.J.; Picardal, F.W. Inhibition of NO3 and NO2 reduction by microbial Fe (III) reduction: Evidence of a reaction between NO2 and cell surface-bound Fe2+. Appl. Environ. Microbiol. 2005, 71, 5267–5274. [Google Scholar] [CrossRef] [PubMed]
  78. Rakshit, S.; Uchimiya, M.; Sposito, G. Iron (III) bioreduction in soil in the presence of added humic substances. Soil Sci. Soc. Am. J. 2009, 73, 65–71. [Google Scholar] [CrossRef]
  79. Sang, C.; Kim, B.H.; Lund, C.R. Effect of NO upon N2O decomposition over Fe/ZSM-5 with low iron loading. J. Phys. Chem. B 2005, 109, 2295–2301. [Google Scholar] [CrossRef] [PubMed]
  80. March, J. Advanced Organic Chemistry, 4th ed.; John Wiley & Sons, Inc.: New York, NY, USA, 1992. [Google Scholar]
  81. Petit, C.; Bandosz, T.J. Role of aluminum oxycations in retention of ammonia on modified activated carbons. J. Phys. Chem. C. 2007, 111, 16445–16452. [Google Scholar] [CrossRef]
  82. Huang, C.-C.; Li, H.-S.; Chen, C.-H. Effect of surface acidic oxides of activated carbon on adsorption of ammonia. J. Hazard. Mater. 2008, 159, 523–527. [Google Scholar] [CrossRef] [PubMed]
  83. Jastrow, J. Changes in soil aggregation associated with tallgrass prairie restoration. Am. J. Bot. 1987, 74, 1656–1664. [Google Scholar] [CrossRef]
  84. Chang, A.C.; Lund, L.J.; Page, A.L.; Warneke, J.E. Physical properties of fly ash-amended soils. J. Environ. Qual. 1977, 6, 267–270. [Google Scholar] [CrossRef]
  85. Huang, Z.T.; Petrovic, A.M. Physical properties of sand as affected by clinoptilolite zeolite particle size and quantity. J. Turfgrass Manag. 1994, 1, 1–15. [Google Scholar] [CrossRef]
  86. Groffman, P.M.; Tiedje, J.M. Denitrification hysteresis during wetting and drying cycles in soil. Soil Sci. Soc. Am. J. 1988, 52, 1626–1629. [Google Scholar] [CrossRef]
  87. Fierer, N.; Schimel, J.P. A proposed mechanism for the pulse in carbon dioxide production commonly observed following the rapid rewetting of a dry soil. Soil Sci. Soc. Am. J. 2003, 67, 798–805. [Google Scholar] [CrossRef]
  88. Tortoso, A.C.; Hutchinson, G. Contributions of autotrophic and heterotrophic nitrifiers to soil NO and N2O emissions. Appl. Environ. Microbiol. 1990, 56, 1799–1805. [Google Scholar] [PubMed]
  89. Soil quality—Determination of soil microbial biomass—Part 1: Substrate-induced respiration method, ISO Standard 14240.1997. Available online: http://www.iso.org/iso/catalogue_detail.htm?csnumber=21530 (accessed on 30 October 2014).
  90. Klemedtsson, L.; Svensson, B.H.; Rosswall, T. Relationships between soil moisture content and nitrous oxide production during nitrification and denitrification. Biol. Fertility Soils 1988, 6, 106–111. [Google Scholar]
  91. Klemedtsson, L.; Svensson, B.H.; Rosswall, T. A method of selective inhibition to distinguish between nitrification and denitrification as sources of nitrous oxide in soil. Biol. Fertility Soils 1988, 6, 112–119. [Google Scholar]
  92. Marusenko, Y.; Huber, D.P.; Hall, S.J. Fungi mediate nitrous oxide production but not ammonia oxidation in aridland soils of the southwestern US. Soil Biol. Biochem. 2013, 63, 24–36. [Google Scholar] [CrossRef]
  93. Anderson, J.P.E.; Domsch, K.H. A physiological method for the quantitative measurement of microbial biomass in soils. Soil Biol. Biochem. 1978, 10, 215–221. [Google Scholar] [CrossRef]
  94. A fan is used to ensure that ambient laboratory air is mixed and properly sampled, particularly avoiding the impact of laboratory personnel exhaling and influencing the air sample, 2000

