Article

Effect of Ecological Factors on Nutritional Quality of Foxtail Millet (Setaria italica L.)

1
College of Agriculture, Shanxi Agricultural University, Taiyuan 030801, China
2
College of Agriculture, China Agricultural University, Beijing 100089, China
3
Institute of Crop Science, Chinese Academy of Agricultural Sciences, Beijing 100081, China
*
Author to whom correspondence should be addressed.
These authors contributed equally to this work.
Agronomy 2024, 14(2), 387; https://doi.org/10.3390/agronomy14020387
Submission received: 22 December 2023 / Revised: 28 January 2024 / Accepted: 8 February 2024 / Published: 17 February 2024

Abstract

:
Foxtail millet (Setaria italica [L.] P. Beauv.) is a climate-change-ready crop, and it is crucial for predicting the impact of ecological factors on grain quality. In this study, multivariate statistical analysis was used to explore the relationship between ecological factors and the key nutritional quality of Jingu 21 from twelve production areas. The results showed that the crude fat and amylopectin content of foxtail millets showed a downward trend from south to north. The nutritional quality was significantly affected by geographical, climatic, and soil factors, and the foxtail millet produced in geographically close areas was extremely similar in nutritional quality. Most nutritional quality indicators of Jingu 21 had a strong correlation with the latitude and climatic factors such as average temperature, diurnal temperature range, and average precipitation, while the content of mineral elements was greatly affected by soil factors. Moreover, higher average precipitation in the jointing, booting–heading, and heading stages, a higher average temperature, and a lower diurnal temperature range in the heading and grain-filling stages are conducive to the establishment of nutritional quality. The findings could facilitate the rational distribution of high-quality foxtail millets under global climate change.

1. Introduction

In recent years, extreme weather disasters have occurred frequently worldwide, which have strongly impacted plant growth and agricultural production [1,2]. Many studies have observed that the changing climate will affect the biological, chemical, and physical characteristics of soil [3,4], inhibit photosynthesis, respiration, carbon metabolism, and productivity of plants [5,6], and impact the yield and quality of crops [7,8]. However, the quality of crops directly determines their economic value, which is very important for farmers [9].
The World Food Programme (WFP) has been advocating the “Reject Hidden Hunger” healthy eating initiative for many years to eliminate hunger and all forms of malnutrition by 2030. Foxtail millet (Setaria italica L. Beauv.) originated in China and is popular for its medicinal and edible properties [10,11]. It is rich in resistant starch [12], high-quality fatty acids [13,14], carotenoids [15], and antioxidants [16,17]. These substances have important physiological functions in the human body and can be used to supplement the treatment of metabolic diseases such as diabetes, obesity, and cardiovascular disease [10,18]. Starch plays a very important role in the quality of foxtail millet. Foxtail millet starch can be divided into amylose and amylopectin. Foxtail millet with high amylose/amylopectin (ACC/AP) can slow down the rapid increase in blood glucose, while with low ACC/AP, it has a better taste [19]. After foxtail millet boiling, the more oil floating on the surface of the soup, the more it is favored by consumers. In addition, mineral element content is an important quality index of foxtail millet, which cannot be synthesized in the human body and must be ingested through food [20]. The absence of an energy-deficit diet can lead to multiple micronutrient deficiencies, which is often referred to as “hidden hunger” [21]. Micronutrient deficiency causes about two billion people worldwide to suffer from “hidden hunger” [22], and food fortification and increasing dietary diversity are important methods to combat “hidden hunger” [23]. Foxtail millet is rich in calcium (Ca), magnesium (Mg), zinc (Zn), selenium (Se), copper (Cu), iron (Fe), phosphorus (P), and other elements, which is a good dietary supplement [24]. Meanwhile, foxtail millet is a climate-change-ready crop, which is more resilient to extreme climatic events, abiotic stress, and infertile soils [25]. Therefore, it is regarded as a key strategy crop for developing climate-resilient agriculture, which has enormous potential for yielding higher economic returns in the case of climate change [26].
According to Zhang et al. [27], there were significant differences in the grain color, nutritional content, and culinary value of foxtail millet grown in various ecological areas. Ning et al. [28] found that altitude and precipitation showed a significant positive effect on the grain quality of foxtail millet, whereas a ≥20 °C accumulated temperature exhibited a significant negative impact. However, their definition of quality is general, and there is no subdivision of nutritional and commodity quality and no analysis of changes in mineral elements. Liang et al. [29] analyzed the quality differences of foxtail millet under conventional and organic cultivation and found that improved soil conditions may encourage some carbohydrates, such as fructose and glucose, to build up in the grains of the foxtail millet. In addition, the application of soil amendment bentonite also increased the protein, fat, and fiber content of the foxtail millet [30]. The quality of foxtail millet is affected by both climatic and soil factors. However, the above reports only studied the effects of single climatic factors or soil factors on quality without a comprehensive analysis. We previously studied the relationship between ecological factors and foxtail millet commercial quality and discovered that a high diurnal temperature range and high soil nutrients are advantageous to culinary production, while a high average temperature and precipitation throughout the growing period are conducive to a good appearance quality and the accumulation of functional substances [31]. In contrast, the influence of climatic factors such as temperature and rainfall at different growth stages on nutritional quality is unknown. In this study, the excellent-in-variety Jingu21 was cultivated in 12 different production areas to obtain different ecological factors, and then the relationship between ecological factors, especially climatic factors, and key nutritional quality of foxtail millet was studied through a multivariate statistical analysis.
Therefore, the main objectives of this study were to clarify the relationship between ecological factors and crop quality in order to predict the quality performance of different years and different areas in the context of climate change and provide reasonable suggestions for high-yield and high-quality crop cultivation under different climatic conditions.

2. Materials and Methods

2.1. Plant Material

The elite foxtail millet variety “Jingu 21” was obtained from Millet Research Institute, Shanxi Agricultural University/Shanxi Academy of Agricultural Sciences (Changzhi, Shanxi Province, China). The crude protein content of Jingu 21 is about 15.12%, the crude fat content is about 5.76%, and the total starch content is about 73.84%. Jingu 21 has been popularized since its approval in 1991 and has been considered a benchmark for high-quality foxtail millet. Since the variety was bred, the cultivated area of Jingu 21 in China has exceeded 6.7 million hectares. At the same time, it has also become a research material recognized by researchers and a high-quality foxtail millet recognized by consumers.

2.2. Growth Conditions

Jingu 21 was grown in twelve production areas in Shanxi Province, from spring-seeding and early-maturing regions to summer-sowing regions, in 2020. The geographical coordinates, average temperature, and average precipitation of twelve production areas are shown in Figure 1. The soil nutrient information of each pilot is shown in Supplementary Table S1. Climate information during the whole growth period of foxtail millet was obtained from the Shanxi Meteorological Bureau (Taiyuan, Shanxi Province, China).

2.3. Experimental Design

The field experiments followed a three-replicate randomized complete block design. Before sowing, the ground was prepared, and all fertilizers were applied as a base fertilizer at once. Foxtail millet was sown from May to June and harvested from September to October in twelve production areas. The seed density was 3.75 × 10⁵ per hectare with a spacing of 50 cm. Weeds, diseases, and insect pests were effectively managed at all experimental sites.

2.4. Measurements

The foxtail millet was harvested and threshed when mature. The grains were air-dried and stored at room temperature (25 °C) for three months before nutrition quality determination. Afterward, they were shelled using a paddy huller, pulverized with ultra-centrifugal grinding, and sieved using a 74 μm mesh screen. The grains and flour were packaged in self-sealing plastic bags and stored at −20 °C.

2.4.1. Water Content

Water content was measured according to the Chinese National Standard method (GB/T 5009.3-2016) [32]. Exactly 5.0000 g of foxtail millet grain was placed in aluminum boxes (m3), and the weight of the foxtail millet and the aluminum box (m1) was accurately weighed. Subsequently, the samples were dried at 105 °C until they reached a constant weight (m2). The water content was calculated using the following equation:
W a t e r   c o n t e n t   ( % ) = m 1 m 2 m 1 m 3 × 100

2.4.2. Crude Fat Content

Crude fat content was determined using a soxhlet extractor according to the Chinese National Standard method (GB/T 5009.6-2016) [33]. The 3.000 g (m2) foxtail millet powder was precisely weighed and placed into the filter paper tube. The tube was then inserted into the extraction tube of the Soxhlet extractor and connected to a receiving bottle (m0) that had been dried to a constant weight. Petroleum ether was added to the upper end of the condenser tube of the extractor to 2/3 of the volume of the bottle. The petroleum ether was continuously refluxed and extracted for 8 h by water bath heating. The receiving bottle was removed, and the petroleum ether was reclaimed. When the solvent remaining in the receiving bottle was 1–2 mL, it was evaporated into the water bath, then dried at 105 °C for 1 h, and cooled in the dryer for 0.5 h and weighed (m1). The water content was calculated using the following equation:
C r u d e   f a t   c o n t e n t   ( % ) = m 1 m 0 m 2 × 100

2.4.3. Amylose and Amylopectin Content

Amylose and amylopectin content were tested based on a colorimetric method described by Li [34]. A total of 100 mg of defatted and deproteinized screened flour was transferred into a 50 mL measuring flask, and then we added 5 mL of 0.5 mol L−1 NaOH. The mixture was shaken gently and dissolved in a water bath at 75 °C for 10 min. After cooling, the starch solution was diluted to 50 mL with distilled water. Then, 2.5 mL starch solution was pipetted into a new 50 mL measuring flask, and the pH was adjusted to around 3.5 using 0.1 mol L−1 HCl. A total of 0.5 mL I2 (0.2%)/KI (2%) was added to the measuring flask, and the starch solution was diluted to 50 mL. Absorbance value in λ420, λ535, λ615, and λ745 was measured after standing at room temperature for 20 min. Absorbance value of amylose = A (λ615) − A (λ420), absorbance value of amylopectin = A (λ535) − A (λ745). To calculate the amylose and amylopectin content of each sample, the standard curves were made, and the regression equations were Y = 0.0178X + 0.0019 (R2 = 0.999) and Y = 0.0015X + 0.0167 (R2 = 0.994), respectively.

2.4.4. Element Concentration

A total of 0.5000 g screened foxtail millet flour was accurately weighed and placed into a 50 mL digestion tube. Then, 3.5 mL of concentrated nitric acid (Guarantee Reagent) and 1 mL of 30% H2O2 (Analytical Reagent) were added. The tubes were subjected to microwave digestion in a Microwave Digestion System (CEM Mars6 Xpress), and the digestion program for microwave is as follows. The temperature was ramped to 12 °C over 5 min and kept at 120 °C for 5 min, then continuously ramped to 150 °C over 5 min and maintained at 150 °C for 10 min, and then ramped to 190 °C over 5 min and maintained for 20 min. After the digestion, the digestion tubes were placed in a fume hood until cooling. Then, we slowly opened the cover to the exhaust and put it into the acid catcher at 170 °C for 40 min until the residual digestion solution was less than 1 mL. Each sample was diluted to 10 mL with ultrapure water and then transferred to a 10 mL EP tube with a filter (0.22 μm water film). The element concentrations (V, Cr, Mn, Fe, Co, Ni, Cu, Zn, Se, Sr, Mo, and Sn) in each sample were analyzed using inductively coupled plasma mass spectrometry ((SQ) ICP-MS, Thermo Scientific, Waltham, MA, USA).
Selection of standard liquid and internal target: Mixed standard liquid of Al, As, B, Ba, Ca, Cd, Co, Cr, Cu, Fe, Hg, K, Mg, Mn, Na, Ni, Pb, Se, Sr, Tl, V, and Zn was selected as the standard liquid for ICP-MS (purchased from the National Nonferrous Metal and Electronic Materials Analysis and Test Center); Bi, Ge, In, Lu, Rh, Sc, Tb, and Y multi-element standard solution is selected as the internal standard solution (purchased from the National Nonferrous Metals and Electronic Materials Analysis and Testing Center). The calibration curve was drawn with mass concentration as the horizontal coordinate and the corresponding signal value as the vertical coordinate under the best instrument conditions. The dynamic range of ICP-MS was very wide, up to 9 orders of magnitude. Therefore, the standard curve was drawn with the appropriate concentration range combined with the content of various elements in millet, and the linear correlation coefficient r is greater than 0.9995. High-purity Ar gas (purity 99.9995%), high-purity helium (purity greater than 99.999%), circulating water, and exhaust air are normal. Preheat the fire for 30 min, check the stability of the signal, and set the program to test the sample.

2.5. Statistical Analysis

Statistical analysis was performed using DPS 7.05 and SPSS 23, while mapping was carried out with ArcGIS 10.7 and Origin 2021. The experiments were conducted four times, and the results were expressed as “mean values ± standard deviation”. To determine the significant differences in quality indicators of foxtail millet among the twelve production areas, Duncan’s test was used at a significance level of p ≤ 0.05. For correlation analysis, the Pearson correlation analysis was performed for each nutritional quality index of foxtail millet. For principal component analysis (PCA), the nutritional quality traits of foxtail millet were normalized to create a correlation matrix. The matrix was then used to determine the eigenvalues and relative contribution rates and calculate the factor scores of the principal components for each sample. For cluster analysis, we used the Euclidean distance as the distance measure between the nutritional quality traits of foxtail millet and the Pearson method as the clustering algorithm to create a clustering tree diagram.

3. Results

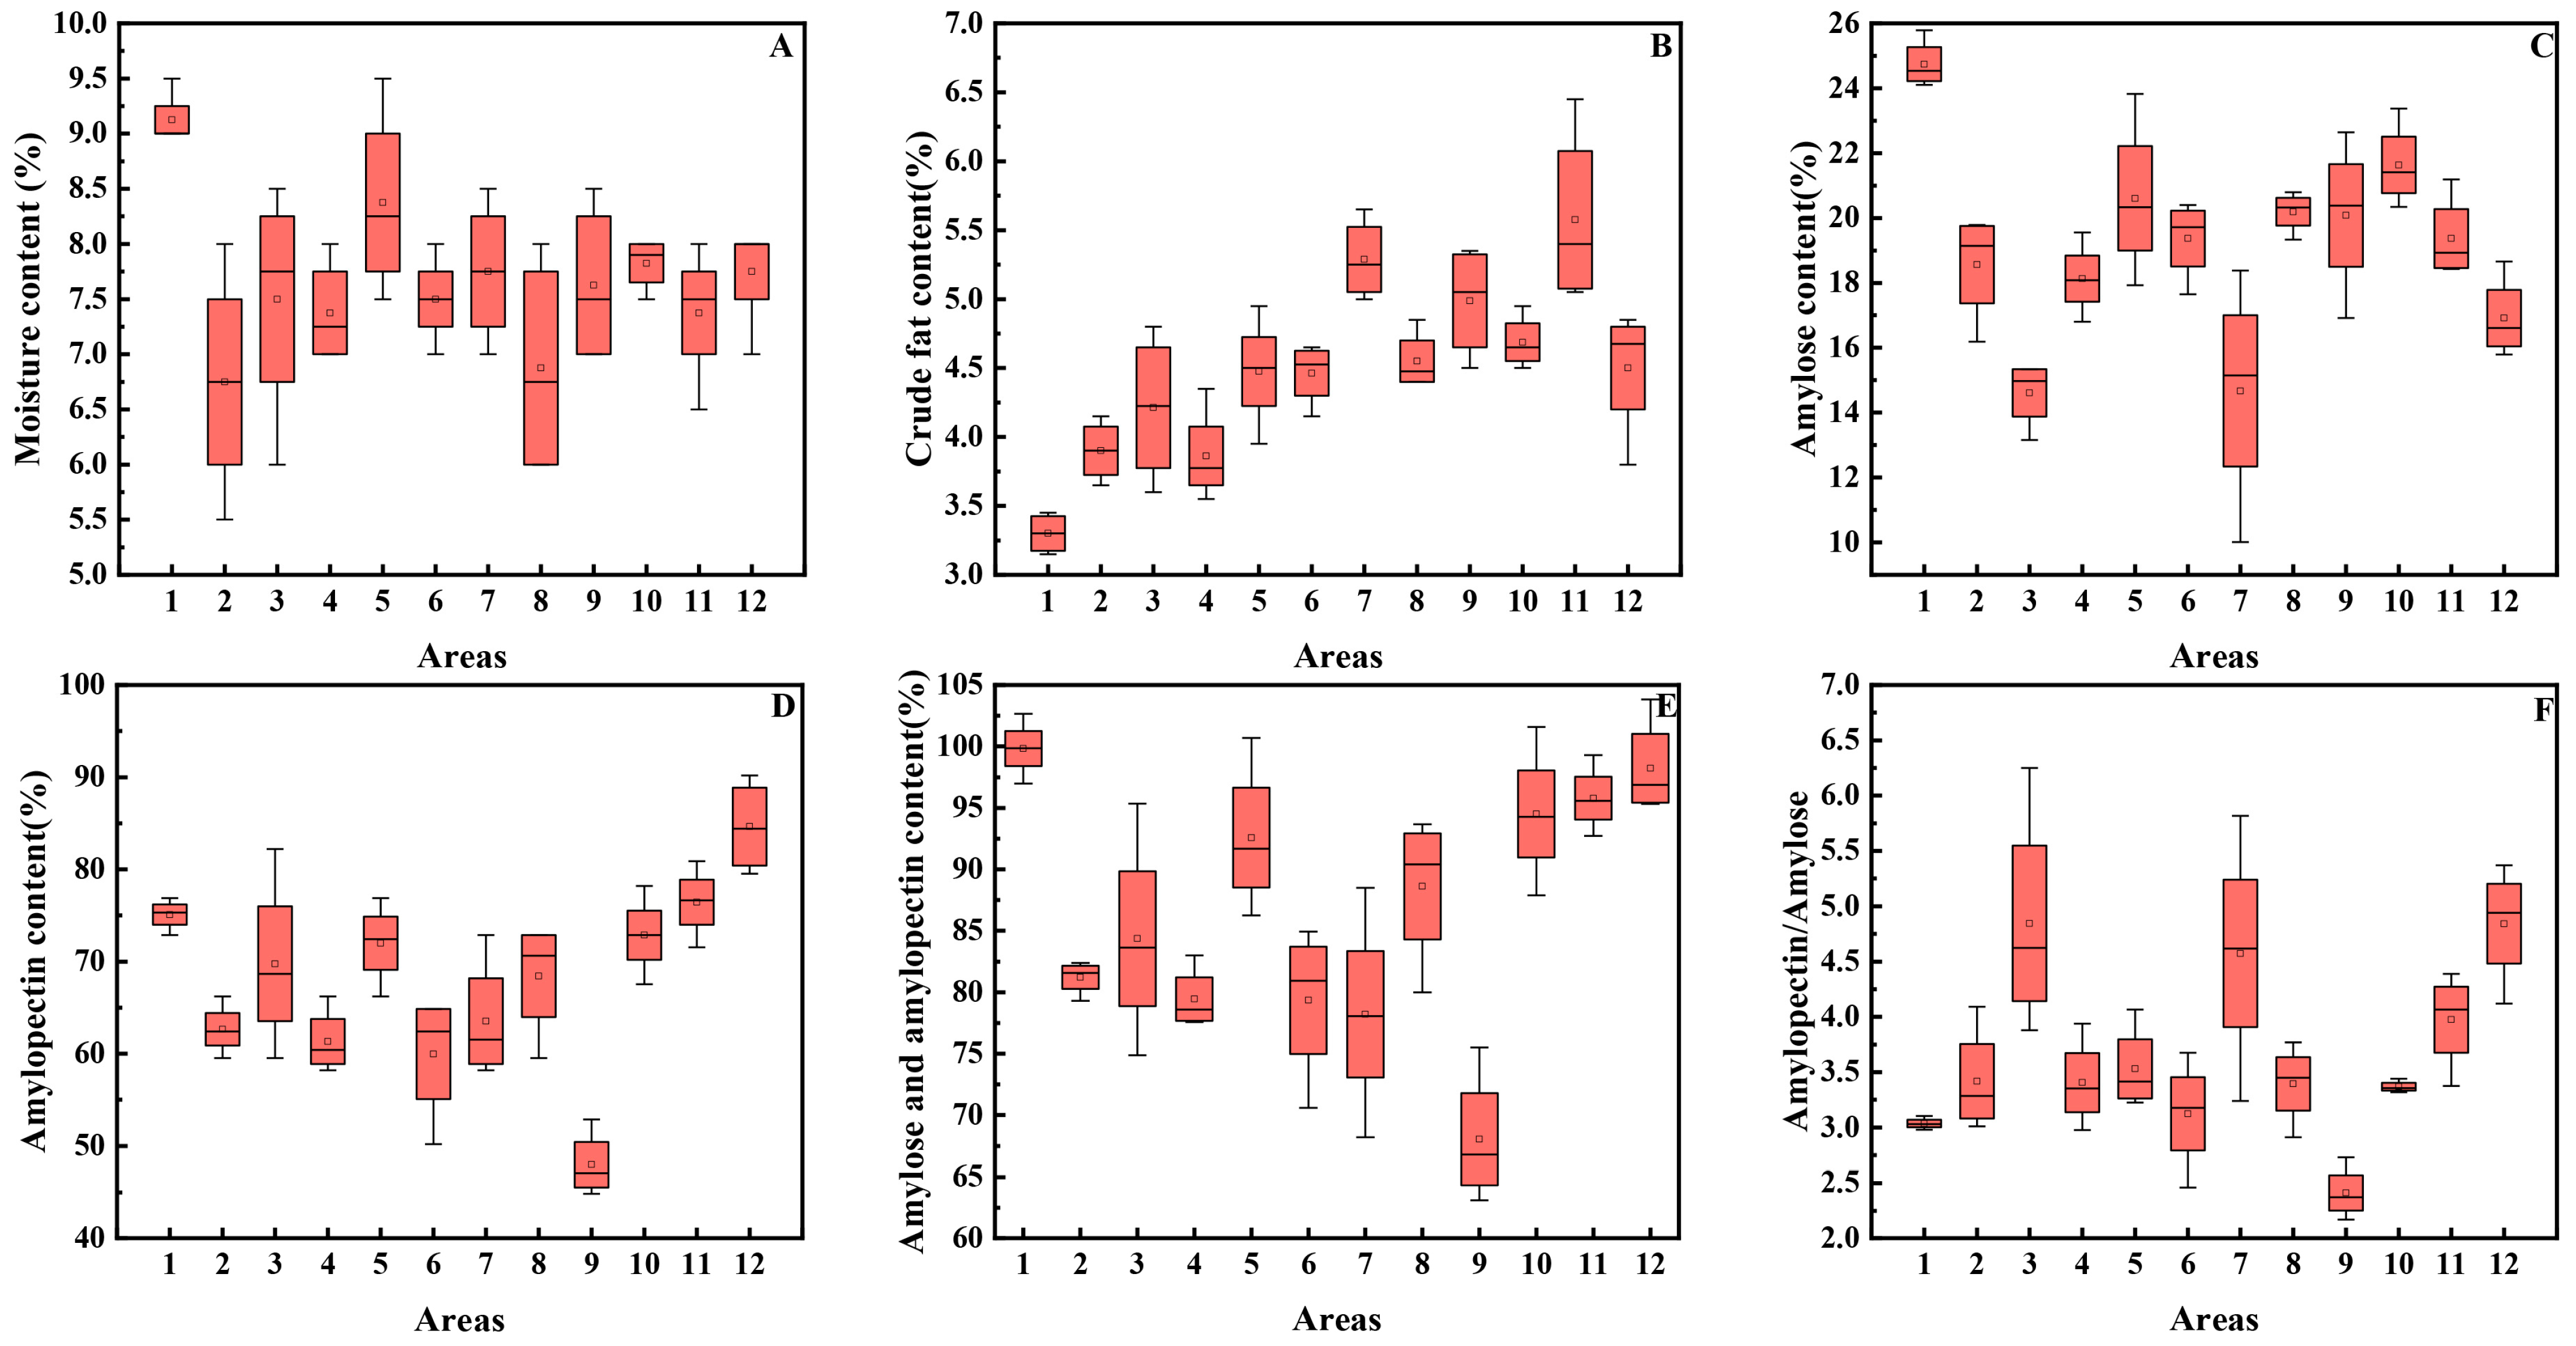
3.1. Nutrient Components of Foxtail Millet in Different Production Areas

The nutrient components of foxtail millet were significantly different in different production areas (Figure 2A–F), and the coefficient of variation (CV) was from large to small in the order of Amylose/Amylopectin > amylose content > crude fat content > amylopectin content > moisture content (Supplementary Table S2). The variation range of foxtail millet moisture content in different production areas was 6.75–9.13%, and there was no significant difference among other treatments, except for Hunyuan and Yangqu. Therefore, it can be considered that the determination of other quality indicators was not affected by the grain moisture content. The crude fat content of the foxtail millet increased from the north to the south; the highest crude fat content was observed in Zezhou (5.58%), whereas the lowest was in Hunyuan (3.30%), which was significantly lower than the other 11 areas. The amylose content, amylopectin content, and amylose/amylopectin ranged from 14.61 to 24.74%, 47.98 to 81.31%, and 2.41 to 4.84, respectively. Hunyuan had the highest amylose content, which was 69.34% higher than Dingxiang (the lowest amylose content); the highest amylopectin content was found in Yangcheng, which was 69.47% higher than Qinxian (the lowest amylopectin content).

3.2. Element Concentration of Foxtail Millet in Different Production Areas

On the whole, there are significant differences in the mineral element concentration of foxtail millet in different production areas (Table 1). The CV of Se was the maximum, which may be related to spraying selenium fertilizer in the process of cultivation and the management in Qinxian and Yangqu; the CV of Sr was 61.80%, and Cr was the lowest (4.61%). Among the 12 production areas, the concentrations of Cr (10.87), Ni (8.40), and Sn (0.44) in Hunyuan were the highest; the contents of V (0.13), Fe (162.59), and Cu (7.37) in Shanyin were the maximum, whereas the Mo (0.43) concentration was the minimum in Xingxian. Yangqu had the highest Mn (25.55) concentration; Taigu had the most Zn (38.34) content, while the concentration of Co (0.17) and Ni (6.28) was the lowest. The Sr (4.54) content of Xixian was the maximum, and Qinxian had the highest Se (0.73) concentration; the content of Co (0.29) was the maximum, while Zn (15.77), Se (0.01), and Sn (0.14) were the minimum in Yuanqu; Yangcheng had the lowest Cr (9.50), Mn (16.45), Fe (139.59), Cu (5.52), and Sr (0.59) content.

3.3. The Correlation Analysis of Foxtail Millet Nutritional Quality

We conducted a correlation analysis among 18 nutritional quality indicators to clarify their inter-relationship (Figure 3A). There are different correlations among the indicators; CFC was negatively correlated with V, Fe, Sn (p ≤ 0.05), and Cr; Ni (p ≤ 0.01) and AP/ACC had a positive correlation with Mo (p ≤ 0.01) but a negative correlation with ACC (p ≤ 0.01). MC had a positive correlation with Sn (p ≤ 0.05), and AP was negatively correlated with Se (p ≤ 0.05). In addition, there are different degrees of correlation among the element concentrations.

3.4. The Principal Component Analysis of Foxtail Millet Nutritional Quality

The principal components analysis (PCA) of foxtail millet from twelve areas was carried out on the nutritional quality (Supplementary Table S3). The first five principal components accounted for 86.12% of the data variance, and their contribution rates were 28.29, 21.14, 17.19, 12.01, and 7.49%, respectively. Therefore, the PCA can be used to accurately reflect differences in the nutritional quality of different samples. The first three principal components explained 66.62% of the variation in the data, and the nutritional quality indicators were separated in the score plot (Figure 3B). The samples located in adjacent positions had similar nutritional quality, such as Yangqu and Xingxian; Xixian, Qinxian, Zezhou, and Yangcheng; Yuci and Dingxiang. In addition, CFC and Se; Zn, Cu, V, Fe, and Cr; AP/ACC and Mo; Co, AP + ACC, MC, Sr, Sn, Ni, Mn, P, and ACC were located in the same direction.

3.5. The Clustering Analysis of Foxtail Millet Nutritional Quality

We conducted the hierarchical clustering analysis of 18 nutritional quality parameters. As Figure 3C shows, the 18 nutritional quality parameters were clustered into five groups at an average distance of 0.8. Group I included Co, AP + ACC, AP, ACC, Sn, and MC. Group II consisted of CFC and Se, and group III consisted of Zn, Mo, and AP/ACC. Group IV included V, Cr, Fe, Cu, Ni, and Mn. The other trait (Sr) fell in group V.

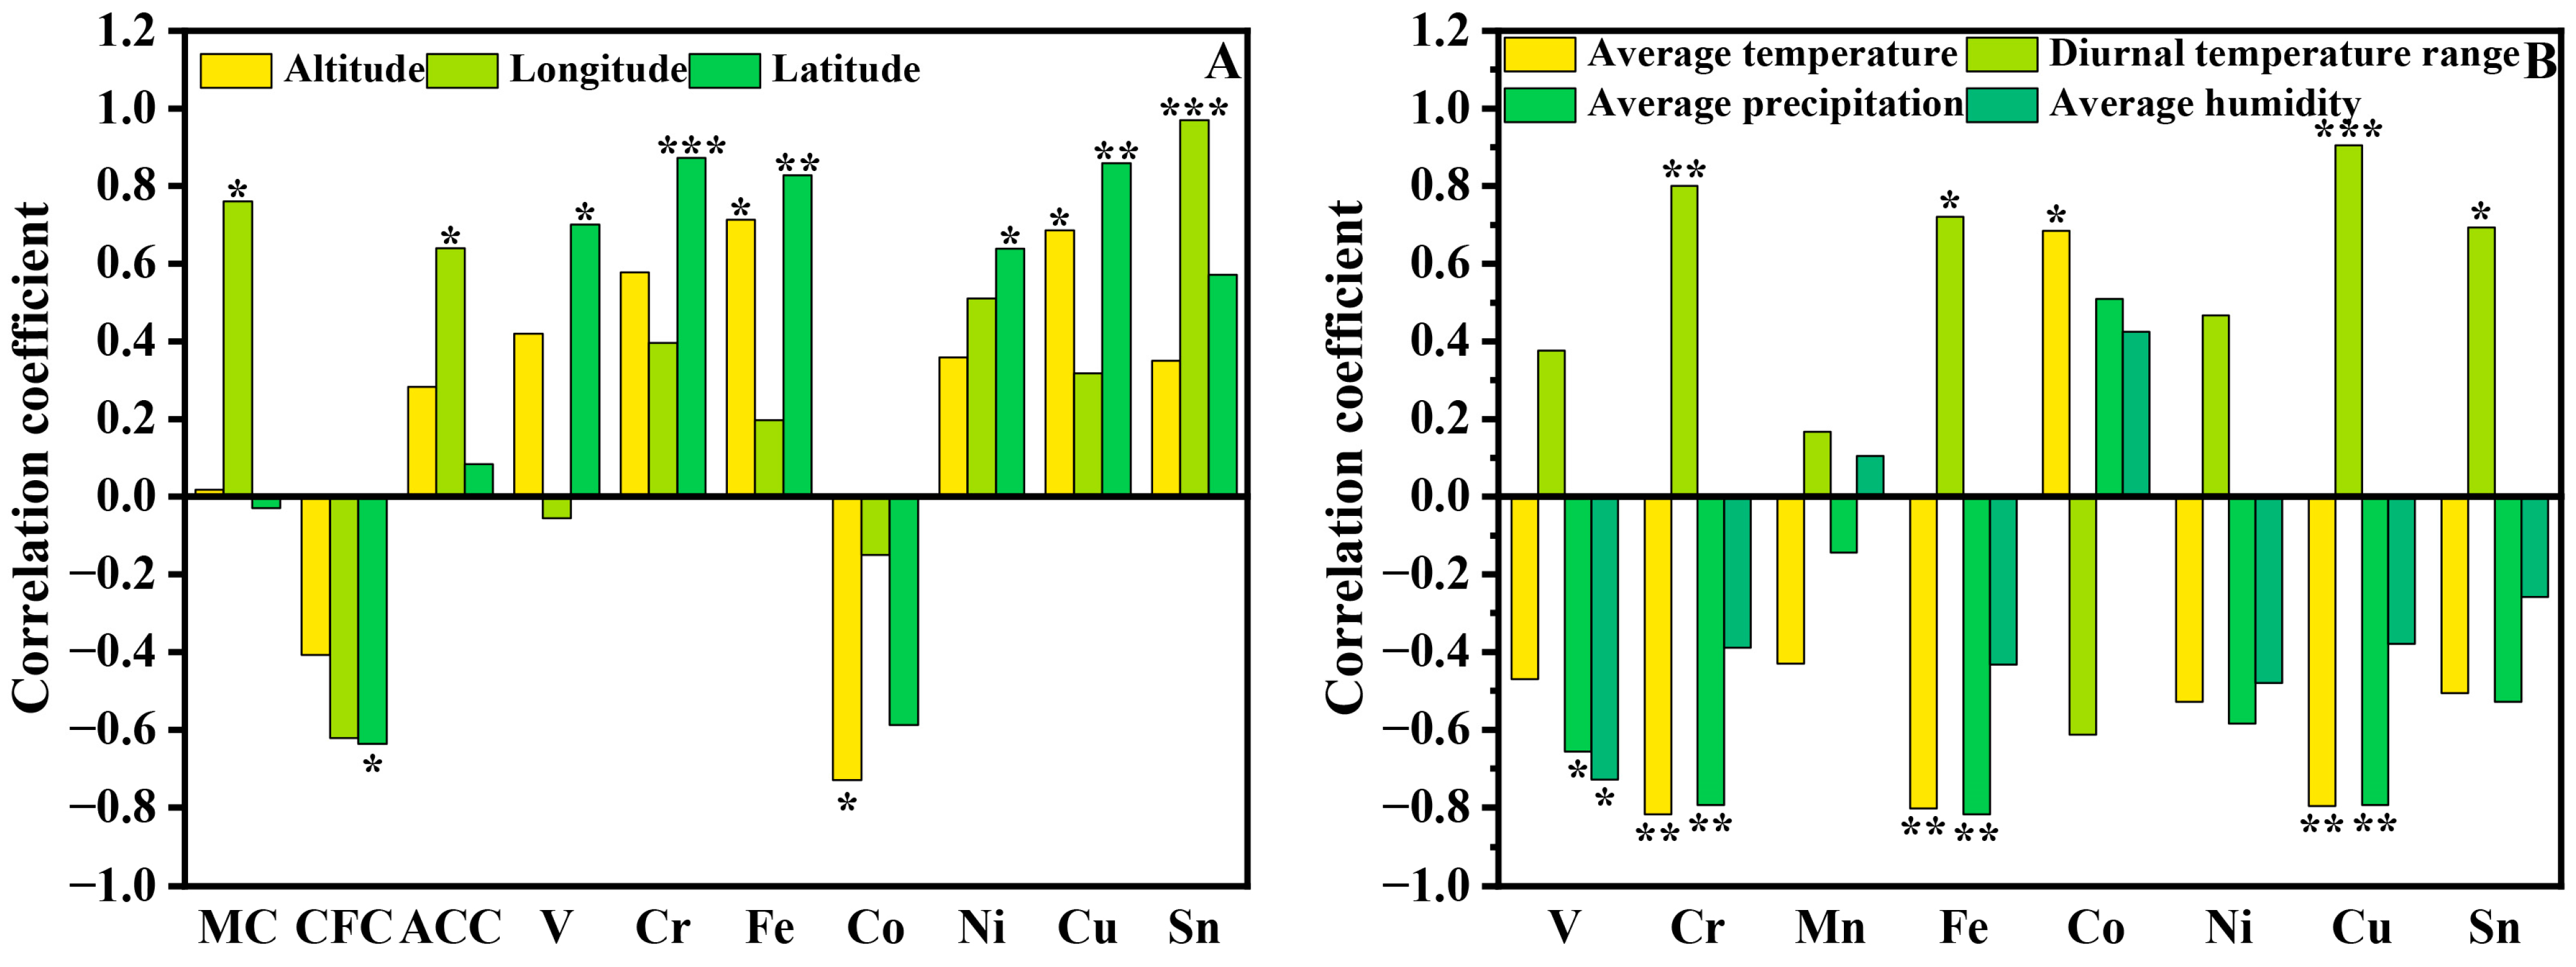
3.6. Relationship between Ecological Factors and Foxtail Millet Nutritional Quality

As shown in Supplementary Table S4, the correlation analysis was conducted between 18 nutritional quality traits and 13 ecological parameters. In general, geographical factors and climate factors had a greater impact on the nutritional quality of Jingu 21 than soil factors. We selected quality indicators that are significantly correlated with geographical and climatic factors, performed a correlation analysis, and plotted histograms (Figure 4). The content of Fe and Cu had a significant positive correlation with the altitude (p ≤ 0.05), whereas Co was negatively corrected to the altitude (p ≤ 0.05). The longitude was positively correlated to MC (r = 0.76) and ACC (r = 0.64) while having a negative correlation with the Sn content (r = 0.97). The latitude had a significant effect on the nutritional quality, and we found that it was negatively correlated to CFC (p ≤ 0.05) but positively correlated to V (p ≤ 0.05), Cr (p ≤ 0.001), Fe (p ≤ 0.01), and Cu (p ≤ 0.01) (Figure 4A). The average temperature and diurnal temperature range had opposite effects on foxtail millet nutritional quality, and our results showed that the average temperature positively affected the Co (r = 0.817) content, whereas the diurnal temperature range had a negative effect on Co (r = −0.801). Cr (p ≤ 0.01), Fe (p ≤ 0.01), and Cu (p ≤ 0.05) were negatively correlated with the average temperature, while Cr (p ≤ 0.01), Cu (p ≤ 0.001), and Sn (p ≤ 0.05) had a positive correlation with the diurnal temperature range. In addition, the average precipitation negatively affected the V (p ≤ 0.05), Cr (p ≤ 0.01), Fe (p ≤ 0.01), and Cu (p ≤ 0.01) content (Figure 4B). Average humidity was negatively correlated to V (r = −0.728), and the soil pH was negatively correlated with Mn (r = −0.702), while the available potassium had a negative correlation with Sr (r = −0.636).

3.7. Dynamic Correlation Analysis of Climate Factors to Foxtail Millet Nutritional Quality

The environment is dynamically and perpetually changing, and analyzing only the correlation coefficient between environmental factors and foxtail millet nutritional quality may not accurately demonstrate their relationship. Therefore, we divided the whole growth period of foxtail millet into stages every ten days and carried out continuous dynamic correlation analysis between climate factors at each stage and the key nutritional quality indexes (ACC, AP/ACC, CFC, Fe, Cu, and Mo) (Figure 5). The result showed that the average temperature was positively correlated with AP/ACC (S3 and S9) and Co (S8), while it was negatively correlated with ACC (S3), Cu (S5), and Fe (S5, S9, and S10). However, compared with the average temperature, the diurnal temperature range had opposite effects on the nutritional quality of foxtail millet. CFC had a negative correlation with the diurnal temperature range at S15, while Mo (S10) was negatively correlated with it. At S2, S6, and S9, Cu had a positive correlation with the diurnal temperature range. The average precipitation in the mid-growing period had the most significant impact on the nutritional quality of the foxtail millet. We found that the average precipitation showed a negative correlation with ACC (S9), AP/ACC (S8), CFC (S12), Fe (S6), and Mo (S5 and S8), while it had a positive correlation with AP/ACC (S6 and S10), CFC (S6), and Mo (S10). As for the average humidity at S10 and S14, Mo had a positive correlation with it.

4. Discussion

Previous research showed that the nutritional quality of rice [35], wheat [36], maize [37], foxtail millet [27,28], etc., was significantly different in different production areas. Our study also reached a similar conclusion; we found the contents of grain fillings in the foxtail millet, such as crude fat, amylose, and amylopectin, significantly varied in different areas. As for mineral elements, some (Co, Zn, Se, Sr, Mo, and Sn) were greatly affected by the production area, while others (V, Cr, Mn, Fe, Ni, and Cu) were not. In this study, nutritional quality indicators of foxtail millet were various and complex, and the ANOVA lacked consistency and representativeness in the comprehensive quality evaluation. The principal components analysis (PCA) is a statistical technique that could extract independent factors from a large set of inter-correlated variables and simplify the complexity in high-dimensional data while retaining trends and patterns [38]. In this case, PCA was used to calculate the comprehensive score of Jingu 21 nutritional quality in different areas. The result indicated that the nutritional quality of foxtail millet showed a strong regionality, and the foxtail millet produced in geographically close areas was extremely similar in nutritional quality.
The quality performance in crops was affected by the genotype, environment, and genotype × environment interactions [39]. In this study, we mainly discussed the effect of ecological factors on the nutritional quality of foxtail millet. We found that most nutritional quality indicators of Jingu 21 had a strong correlation with the latitude and climatic factors such as the average temperature, diurnal temperature range, and average precipitation, while the content of mineral elements was greatly affected by soil factors. Previous studies indicated that the temperature affected the pollination, fertilization, and floret development of rice during flowering, which affected the starch content and structure of the rice [40]. Li et al. [35] found a strong correlation between the diurnal temperature range and amylose and protein contents. A large diurnal temperature range favors the formation, accumulation, and transformation of nutrients in crop grains, resulting in higher synthesis and lower consumption [41]. This contributes to the accumulation of secondary metabolites and is conducive to the formation and accumulation of starch, fat, protein, and other nutrients in the grain of foxtail millet. Zhao et al. [37] identified N and P rates, soil pH, and organic matter as the main factors affecting maize quality. These results were similar to our findings. Our experiment showed that the latitude, average temperature, diurnal temperature range, average precipitation, and average humidity had a significant impact on CFC, Cr, Fe, and Cu, revealing that these nutritional quality indicators were greatly affected by the environment. However, calculating the correlation coefficient of ecological factors and quality indicators alone may not fully explain their relationship. Therefore, it is necessary to identify key nutritional quality indicators and conduct an in-depth analysis to clarify the impact of ecological factors on foxtail millet quality during each growth period.
Numerous nutritional quality indicators of foxtail millet had strong correlations, so we selected representative indicators through correlation analysis, clustering analysis, and principal component analysis. The hierarchical clustering could organize the data into objects with common attributes; that is to say, the quality indicators with a strong correlation and similarity can be classified into one category [38,42]. We obtained six representative indicators according to the result of hierarchical clustering analysis, and they were AP + ACC, Cr, Sr, Mo, and CFC. The diversity analysis has been used to measure the constancy of a set of data [43]. Sun et al. [11] reported that the quality of foxtail millet with a higher coefficient of variation was greatly affected by a variety of factors. We observed that Se, Sr, Sn, Mo, Zn, and AP/ACC had a high variation coefficient, which showed that these indicators were significantly affected by production areas. Furthermore, the correlation analysis between ecological factors and foxtail millet nutritional quality showed that V, Cr, Fe, and Cu were greatly influenced by ecological factors. In addition, Fe, Cu, and Mo play an important role in crop quality and can provide broad potential benefits to human health [22,44,45,46]. Based on the above analysis, we selected CFC, ACC, AP/ACC, Fe, Cu, and Mo as the representative indicators of 21 nutritional qualities for subsequent analysis.
Through dynamic correlation analysis, we found that the core nutritional quality of foxtail millet responded differently to climatic factors at different growth stages. Li et al. [35] suggested that the climatic conditions in different periods had different effects on crop quality, and we have also reached the same conclusion. Our result showed that the influence of the average temperature and diurnal temperature range on the nutritional quality of Jingu 21 was most significant at 90–110 days after sowing (heading and grain-filling stages), while the average precipitation was most significant at 50–90 days after sowing (jointing, booting–heading, and heading stages). During this stage, if there is enough water, sunshine, and nutrients, the ear node will quickly extend the flag leaf, and the ear can be fully developed. This is beneficial for producing high-quality foxtail millet [28]. Ning et al. [28] found that the precipitation of the booting–heading stage, the diurnal temperature range of booting, heading, and grain-filling stages, and the sunshine hours of the jointing and grain-filling stages showed the greatest effect on the grain quality of Changnong 35. Ning’s conclusion is basically consistent with the results of our study.

5. Conclusions

Under the influence of environmental factors such as geography, climate, and soil, the nutritional quality of the same variety of foxtail millet in different production areas had great differences, and the foxtail millet produced in geographically close areas was extremely similar in nutritional quality. Most nutritional quality indicators of Jingu 21 had a strong correlation with the latitude and climatic factors, such as the average temperature, diurnal temperature range, and average precipitation, while the content of the mineral elements was greatly affected by soil factors. Additionally, it was discovered that the average precipitation during the jointing, booting–heading, and heading stages had the greatest impact on grain quality. Meanwhile, the average temperature and diurnal temperature range during the heading and grain-filling stages significantly affected the nutritional quality. Therefore, adjusting the sowing date and improving the soil to adapt to the changes in foxtail millet quality caused by climate change can enhance its nutritional value.

Supplementary Materials

The following supporting information can be downloaded at: https://www.mdpi.com/article/10.3390/agronomy14020387/s1, Table S1: The main ecological factors of the twelve production areas. Table S2: The variation analysis of foxtail millet nutrient component contents in twelve production areas. Table S3: Eigenvalues of correlation matrix and eigenvectors of corresponding matrices for foxtail millet nutritional quality traits. Table S4: The correlation analysis between foxtail millet nutritional quality traits and ecological factors. * and ** indicate significance at 0.05 and 0.01, respectively.

Author Contributions

K.M.: Investigation, Data curation, Formal analysis, Writing—original draft. X.Z.: Investigation, Data curation, Formal analysis. B.L.: Investigation, Data curation, Formal analysis. Y.W.: Data curation, Formal analysis. Z.Y.: Data curation, Formal analysis. L.Z.: Conceptualization, Funding acquisition, Writing—review and editing. X.D.: Conceptualization, Funding acquisition, Writing—review and editing. X.Y.: Conceptualization, Funding acquisition, Writing—review and editing. All authors have read and agreed to the published version of the manuscript.

Funding

This research was funded by the Research Project Supported by Shanxi Scholarship Council of China (2020-068), Central Government Guides Local Science and Technology Development Fund Project (YDZX20201400001634), National Natural Science Foundation of China (32272229), Shanxi Agricultural University science and technology innovation and promotion project (CXGC2023002), China Agriculture Research System of MOF and MARA (CARS-06-14.5-A28), National Key Research and Development Program sub-project (2021YFD1901103-5), the Special Plan for Scientific and Technological Innovation Talent Team of Shanxi Province (202204051002036).

Data Availability Statement

Data will be made available on request.

Conflicts of Interest

The authors declare that they have no known competing financial interests or personal relationships that could have appeared to influence the work reported in this paper.

References

  1. Lesk, C.; Rowhani, P.; Ramankutty, N. Influence of extreme weather disasters on global crop production. Nature 2016, 529, 84–87. [Google Scholar] [CrossRef] [PubMed]
  2. Weichert, H.; Hogy, P.; Mora-Ramirez, I.; Fuchs, J.; Eggert, K.; Koehler, P.; Weschke, W.; Fangmeier, A.; Weber, H. Grain yield and quality responses of wheat expressing a barley sucrose transporter to combined climate change factors. J. Exp. Bot. 2017, 68, 5511–5525. [Google Scholar] [CrossRef] [PubMed]
  3. Jones, A.; Stolbovoy, V.; Rusco, E.; Gentile, A.R.; Gardi, C.; Marechal, B.; Montanarella, L. Climate change in Europe. 2. Impact on soil. A review. Agron. Sustain. Dev. 2009, 29, 423–432. [Google Scholar] [CrossRef]
  4. Rozhkov, V.A. Soils and the soil cover as witnesses and indicators of global climate change. Eurasian Soil Sci. 2009, 42, 118–128. [Google Scholar] [CrossRef]
  5. Dusenge, M.E.; Duarte, A.G.; Way, D.A. Plant carbon metabolism and climate change: Elevated CO2 and temperature impacts on photosynthesis, photorespiration and respiration. New Phytol. 2019, 221, 32–49. [Google Scholar] [CrossRef] [PubMed]
  6. Hussain, S.; Ulhassan, Z.; Brestic, M.; Zivcak, M.; Zhou, W.J.; Allakhverdiev, S.I.; Yang, X.H.; Safdar, M.E.; Yang, W.Y.; Liu, W.G. Photosynthesis research under climate change. Photosynth. Res. 2021, 150, 5–19. [Google Scholar] [CrossRef] [PubMed]
  7. Myers, S.S.; Smith, M.R.; Guth, S.; Golden, C.D.; Vaitla, B.; Mueller, N.D.; Dangour, A.D.; Huybers, P. Climate change and global food systems: Potential impacts on food security and undernutrition. Annu. Rev. Public Health 2017, 38, 259–277. [Google Scholar] [CrossRef]
  8. Song, C.X.; Huang, X.; Les, O.; Ma, H.Y.; Liu, R.F. The economic impact of climate change on wheat and maize yields in the north china plain. Int. J. Environ. Res. Public Health 2022, 19, 5707. [Google Scholar] [CrossRef]
  9. Custodio, M.C.; Cuevas, R.P.; Ynion, J.; Laborte, A.G.; Velasco, M.L.; Demont, M. Rice quality: How is it defined by consumers, industry, food scientists, and geneticists? Trends Food Sci. Technol. 2019, 92, 122–137. [Google Scholar] [CrossRef]
  10. Bhat, S.; Nandini, C.; Tippeswamy, V. Significance of small millets in nutrition and health-A review. Asian J. Dairy Food Res. 2018, 37, 35–40. [Google Scholar] [CrossRef]
  11. Sun, M.J.; Kang, X.R.; Wang, T.T.; Fan, L.R.; Wang, H.; Pan, H.; Yang, Q.G.; Liu, H.M.; Lou, Y.H.; Zhuge, Y.P. Genotypic diversity of quality traits in Chinese foxtail millet (Setaria italica L.) and the establishment of a quality evaluation system. Food Chem. 2021, 353, 129421. [Google Scholar] [CrossRef]
  12. Qi, Y.Y.; Wang, N.; Yu, J.L.; Wang, S.; Wang, S.J.; Copeland, L. Insights into structure-function relationships of starch from foxtail millet cultivars grown in China. Int. J. Biol. Macromol. 2020, 155, 1176–1183. [Google Scholar] [CrossRef] [PubMed]
  13. Yuan, Y.H.; Liu, C.J.; Zhao, G.; Gong, X.W.; Dang, K.; Yang, Q.H.; Feng, B.L. Transcriptome analysis reveals the mechanism associated with dynamic changes in fatty acid and phytosterol content in foxtail millet (Setaria italica) during seed development. Food Res. Int. 2021, 145, 110429. [Google Scholar] [CrossRef] [PubMed]
  14. Zhang, H.Y.; Wang, J.Y.; Zhao, J.; Sun, C.Q.; Wang, J.; Wang, Q.; Qu, F.; Yun, X.D.; Feng, Z.W. Integrated lipidomic and transcriptomic analysis reveals lipid metabolism in foxtail millet (Setaria italica). Front. Genet. 2021, 12, 758003. [Google Scholar] [CrossRef] [PubMed]
  15. Li, H.; Han, S.L.; Huo, Y.Q.; Ma, G.F.; Sun, Z.X.; Li, H.Y.; Hou, S.Y.; Han, Y.H. Comparative metabolomic and transcriptomic analysis reveals a coexpression network of the carotenoid metabolism pathway in the panicle of Setaria italica. BMC Plant Biol. 2022, 22, 105. [Google Scholar] [CrossRef] [PubMed]
  16. Li, W.; Wen, L.C.; Chen, Z.T.; Zhang, Z.L.; Pang, X.L.; Deng, Z.C.; Liu, T.; Guo, Y.F. Study on metabolic variation in whole grains of four proso millet varieties reveals metabolites important for antioxidant properties and quality traits. Food Chem. 2021, 357, 129791. [Google Scholar] [CrossRef] [PubMed]
  17. Zhang, Y.K.; Gao, J.H.; Qie, Q.R.; Yang, Y.L.; Hou, S.Y.; Wang, X.C.; Li, X.K.; Han, Y.H. Comparative analysis of flavonoid metabolites in foxtail millet (Setaria italica) with different eating quality. Life 2021, 11, 578. [Google Scholar] [CrossRef] [PubMed]
  18. Shahidi, F.; Chandrasekara, A. Millet grain phenolics and their role in disease risk reduction and health promotion: A review. J. Funct. Foods 2013, 5, 570–581. [Google Scholar] [CrossRef]
  19. Shi, P.; Zhao, Y.; Qin, F.; Liu, K.; Wang, H. Understanding the multi-scale structure and physicochemical properties of millet starch with varied amylose content. Food Chem. 2023, 410, 135422. [Google Scholar] [CrossRef]
  20. Kumar, P.C.; Amutha, S.; Oberoi, H.S.; Kanchana, S.; Azeez, S.; Rupa, T.R. Germination induced changes in bioactive compounds and nutritional components of millets. J. Food Sci. Technol. 2022, 59, 4244–4252. [Google Scholar] [CrossRef]
  21. Black, R.E.; Victora, C.G.; Walker, S.P.; Bhutta, Z.A.; Christian, P.; Onis, M.D.; Ezzati, M.; Grantham-McGregor, S.; Katz, J.; Martorell, R.; et al. Maternal and child undernutrition and overweight in low-income and middle-income countries. Lancet 2013, 382, 427–451. [Google Scholar] [CrossRef] [PubMed]
  22. Yao, B.M.; Chen, P.; Sun, G.X. Distribution of elements and their correlation in bran, polished rice, and whole grain. Food Sci. Nutr. 2020, 8, 982–992. [Google Scholar] [CrossRef] [PubMed]
  23. Lowe, N.M. The global challenge of hidden hunger: Perspectives from the field. Proc. Nutr. Soc. 2021, 80, 283–289. [Google Scholar] [CrossRef] [PubMed]
  24. Liang, K.H.; Liang, S.; Lu, L.G.; Zhu, D.Z.; Cheng, L. Geographical origin traceability of foxtail millet based on the combination of multi-element and chemical composition analysis. Int. J. Food Prop. 2018, 21, 1769–1777. [Google Scholar] [CrossRef]
  25. Satyavathi, C.T.; Ambawat, S.; Khandelwal, V.; Srivastava, R.K. Pearl Millet: A Climate-Resilient Nutricereal for Mitigating Hidden Hunger and Provide Nutritional Security. Front. Plant Sci. 2021, 12, 659938. [Google Scholar] [CrossRef] [PubMed]
  26. Wilson, M.L.; VanBuren, R. Leveraging millets for developing climate resilient agriculture. Curr. Opin. Biotechnol. 2022, 75, 102683. [Google Scholar] [CrossRef] [PubMed]
  27. Zhang, L.G.; Ma, K.; Zhao, X.T.; Li, Z.; Zhang, X.; Li, W.D.; Meng, R.; Lu, B.Y.; Yuan, X.Y. Development of a comprehensive quality evaluation system for foxtail millet from different ecological regions. Foods 2023, 12, 2545. [Google Scholar] [CrossRef]
  28. Ning, N.; Yang, Y.J.; Hong, J.P.; Yuan, X.Y.; Song, X.E.; Wang, H.F.; Guo, P.Y. Correlation between grain quality of foxtail millet (Setaria italica [L.] P. Beauv.) and environmental factors on multivariate statistical analysis. Chil. J. Agric. Res. 2017, 77, 303–310. [Google Scholar] [CrossRef]
  29. Liang, K.H.; Liang, S.; Lu, L.G.; Zhu, D.Z.; Zhu, H.; Liu, P.; Zhang, M. Metabolic variation and cooking qualities of millet cultivars grown both organically and conventionally. Food Res. Int. 2018, 106, 825–833. [Google Scholar] [CrossRef]
  30. Mi, J.Z.; Gregorich, E.G.; Xu, S.T.; McLaughlin, N.B.; Liu, J.H. Effect of bentonite as a soil amendment on field water-holding capacity, and millet photosynthesis and grain quality. Sci. Rep. 2020, 10, 18282. [Google Scholar] [CrossRef]
  31. Ma, K.; Zhao, L.R.; Zhao, X.T.; Li, X.R.; Dong, S.Q.; Zhang, L.G.; Guo, P.Y.; Yuan, X.Y.; Diao, X.M. The relationship between ecological factors and commercial quality of high-quality foxtail millet “Jingu 21”. Food Res. Int. 2023, 163, 112225. [Google Scholar] [CrossRef]
  32. Standardization Administration of the People’s Republic of China. GB/T 5009.3-2016; Determination of Moisture in Food. Standard Press: Beijing, China, 2016.
  33. Standardization Administration of the People’s Republic of China. GB/T 5009.6-2016; Determination of Fat in Food. Standard Press: Beijing, China, 2016.
  34. Li, X. Study on the Correlation between Millet Cooking Quality and Its Components. Master’s Thesis, China Agriculture University, Beijing, China, 2019. (In Chinese). [Google Scholar]
  35. Li, X.K.; Wu, L.; Geng, X.; Xia, X.H.; Wang, X.H.; Xu, Z.J.; Xu, Q. Deciphering the environmental impacts on rice quality for different rice cultivated areas. Rice 2018, 11, 7. [Google Scholar] [CrossRef] [PubMed]
  36. Graziano, S.; Marmiroli, N.; Visioli, G.; Gulli, M. Proteins and metabolites as indicators of flours quality and nutritional properties of two durum wheat varieties grown in different italian locations. Foods 2020, 9, 315. [Google Scholar] [CrossRef] [PubMed]
  37. Zhao, Q.Y.; Xu, S.J.; Zhang, W.S.; Zhang, Z.; Yao, Z.; Chen, X.P.; Zou, C.Q. Identifying key drivers for geospatial variation of grain micronutrient concentrations in major maize production regions of China. Environ. Pollut. 2020, 266, 115114. [Google Scholar] [CrossRef] [PubMed]
  38. Kopuzlu, S.; Önenç, A.; Bilgin, O.C.; Esenbuga, N. Determination of meat quality through principal components analysis. J. Anim. Plant Sci. 2011, 21, 151–156. [Google Scholar]
  39. Wodebo, K.Y.; Tolemariam, T.; Demeke, S.; Garedew, W.; Tesfaye, T.; Zeleke, M.; Gemiyu, D.; Bedeke, W.; Wamatu, J.; Sharma, M. AMMI and GGE biplot analyses for mega-environment identification and selection of some high-yielding oat (Avena sativa L.) genotypes for multiple environments. Plants 2023, 112, 3064. [Google Scholar] [CrossRef] [PubMed]
  40. Chen, J.L.; Tang, L.; Shi, P.H.; Yang, B.H.; Sun, T.; Cao, W.X.; Zhu, Y. Effects of short-term high temperature on grain quality and starch granules of rice (Oryza sativa L.) at post-anthesis stage. Protoplasma 2017, 254, 935–943. [Google Scholar] [CrossRef] [PubMed]
  41. Li, H.X.; Chen, Z.; Hu, M.X.; Hua, H.; Yin, C.X.; Zeng, H.L. Different effects of night versus day high temperature on rice quality and accumulation profiling of rice grain proteins during grain filling. Plant Cell Rep. 2011, 30, 1641–1659. [Google Scholar] [CrossRef]
  42. Shahidullah, S.M.; Hanafi, M.M.; Ashrafuzzaman, M.; Ismail, M.R.; Khair, A. Genetic diversity in grain quality and nutrition of aromatic rices. Afr. J. Biotechnol. 2009, 8, 1238–1246. [Google Scholar]
  43. Ren, Y.; Allenmark, F.; Muller, H.J.; Shi, Z.H. Variation in the “coefficient of variation”: Rethinking the violation of the scalar property in time-duration judgments. Acta Psychol. 2021, 214, 103263. [Google Scholar] [CrossRef]
  44. Verma, S.; Srivastava, S.; Tiwari, N. Comparative study on nutritional and sensory quality of barnyard and foxtail millet food products with traditional rice products. J. Food Sci. Technol. 2014, 52, 5147–5155. [Google Scholar] [CrossRef] [PubMed]
  45. Zimmermann, M.B.; Hurrell, R.F. Nutritional iron deficiency. Lancet. 2007, 370, 511–520. [Google Scholar] [CrossRef] [PubMed]
  46. Hille, R.; Hall, J.; Basu, P. The mononuclear molybdenum enzymes. Chem. Rev. 2014, 114, 3963–4038. [Google Scholar] [CrossRef] [PubMed]
Figure 1. The geographical coordinates (A), average temperature, and average precipitation (B) of 12 production areas.
Agronomy 14 00387 g001
Figure 2. Nutrient components moisture content (A), crude fat content (B), amylose content (C), amylopectin content (D), amylose and amylopectin content (E), and amylopectin/amylose (F) of foxtail millet in 12 production areas. The twelve production areas were numbered as Hunyuan (1), Shanyin (2), Dingxiang (3), Xingxian (4), Yangqu (5), Yuci (6), Taigu (7), Xixian (8), Qinxian (9), Yuanqu (10), Zezhou (11), and Yangcheng (12).
Agronomy 14 00387 g002
Figure 3. Correlation analysis, principal component analysis, and clustering analysis of foxtail millet nutrient quality. (A) The correlation between 18 nutrient quality traits of foxtail millet. *, **, and *** indicate significance at 0.05, 0.01, and 0.001, respectively. (B) PCA load and score plot depicting the distribution of foxtail millet nutrient quality in different production areas for the first two principal components. (C) Hierarchical clustering analysis of 18 nutrient quality parameters. The same color represents the same nutritional quality in the cluster analysis.
Agronomy 14 00387 g003
Figure 4. The correlation efficiency between foxtail millet nutrient quality traits and ecological factors include geographical factor (A) and climatic factor (B). *, **, and *** indicate significance at 0.05, 0.01, and 0.001, respectively.
Agronomy 14 00387 g004
Figure 5. Dynamic analysis of climate factors and the key nutrient quality of foxtail millet. The correlation coefficient of climate factors (average temperature, average humidity, diurnal temperature range, and average precipitation) with ACC (A), AP/ACC (B), CFC (C), Fe (D), Cu (E), and Mo (F). * and ** indicate significance at 0.05 and 0.01, respectively. S means every ten days after sowing.
Agronomy 14 00387 g005
Table 1. Element concentration of foxtail millet in 12 production areas.
AreaVCrMnFeCoNiCuZnSeSrMoSn
Hunyuan0.10 ± 0.00 b10.87 ± 0.58 a19.75 ± 0.60 e153.47 ± 3.24 b0.19 ± 0.01 de8.40 ± 0.28 a7.09 ± 0.40 ab27.25 ± 0.71 d0.02 ± 0.01 h2.17 ± 0.20 d0.74 ± 0.04 c0.44 ± 0.58 a
Shanyin0.13 ± 0.04 a10.74 ± 0.63 a19.60 ± 0.95 e162.59 ± 6.64 a0.20 ± 0.01 d7.93 ± 0.67 bc7.37 ± 0.59 a28.87 ± 1.14 c0.03 ± 0.00 g1.50 ± 0.08 f1.00 ± 0.18 b0.21 ± 0.13 ab
Dingxiang0.11 ± 0.02 b10.77 ± 0.40 a19.94 ± 0.57 de153.35 ± 3.56 b0.20 ± 0.01 d7.67 ± 0.15 c6.95 ± 0.23 ab20.79 ± 0.18 g0.05 ± 0.00 de1.76 ± 0.15 e1.07 ± 0.09 b0.19 ± 0.07 ab
Xingxian0.11 ± 0.01 ab10.63 ± 0.42 ab22.32 ± 0.87 b147.51 ± 3.15 bcd0.19 ± 0.01 de8.18 ± 0.31 ab5.96 ± 0.28 de16.63 ± 0.73 h0.02 ± 0.00 h2.67 ± 0.09 b0.43 ± 0.06 e0.18 ± 0.06 ab
Yangqu0.10 ± 0.01 b10.48 ± 0.42 abc25.55 ± 0.89 a155.45 ± 4.78 ab0.19 ± 0.01 de7.02 ± 0.18 ef7.27 ± 0.70 a29.9 ± 0.58 bc0.31 ± 0.01 b1.10 ± 0.12 g0.56 ± 0.05 d0.16 ± 0.04 ab
Yuci0.10 ± 0.01 b10.59 ± 0.52 abc21.53 ± 0.99 bc154.84 ± 7.58 ab0.18 ± 0.01 ef7.21 ± 0.35 de7.08 ± 0.38 ab30.43 ± 1.47 b0.05 ± 0.01 d1.03 ± 0.10 g0.61 ± 0.03 d0.17 ± 0.03 ab
Taigu0.09 ± 0.01 b9.91 ± 0.46 cd17.15 ± 0.61 gh142.67 ± 5.39 cd0.17 ± 0.01 f6.28 ± 0.25 g6.65 ± 0.34 bc38.34 ± 0.41 a0.14 ± 0.01 c2.38 ± 0.19 c1.24 ± 0.03 a0.16 ± 0.03 ab
Xixian0.10 ± 0.01 b9.95 ± 0.51 bcd18.41 ± 0.66 f140.86 ± 4.56 cd0.19 ± 0.01 de7.79 ± 0.30 bc6.13 ± 0.28 e20.59 ± 0.83 g0.01 ± 0.01 h4.54 ± 0.01 a0.78 ± 0.03 c0.15 ± 0.02 ab
Qinxian0.09 ± 0.01 b9.95 ± 0.25 bcd20.95 ± 0.36 cd148.99 ± 10.09 bc0.19 ± 0.01 de6.72 ± 0.21 f6.00 ± 0.19 cd15.90 ± 0.50 h0.73 ± 0.02 a0.74 ± 0.21 h0.42 ± 0.01 e0.15 ± 0.02 ab
Yuanqu0.09 ± 0.01 b10.00 ± 0.39 bcd21.89 ± 0.95 bc144.34 ± 3.84 cd0.29 ± 0.01 a7.09 ± 0.28 ef5.45 ± 0.25 de15.77 ± 0.28 h0.01 ± 0.01 h1.90 ± 0.09 e0.85 ± 0.03 c0.14 ± 0.02 b
Zezhou0.09 ± 0.00 b9.67 ± 0.18 d17.72 ± 0.36 fg140.88 ± 3.35 cd0.23 ± 0.00 b7.61 ± 0.12 cd6.60 ± 0.12 bc22.75 ± 0.17 f0.04 ± 0.01 ef0.95 ± 0.07 g0.77 ± 0.02 c0.19 ± 0.07 ab
Yangcheng0.10 ± 0.00 b9.50 ± 0.17 d16.45 ± 0.21 h139.59 ± 3.01 d0.22 ± 0.01 c6.98 ± 0.12 ef5.52 ± 0.09 e23.82 ± 0.68 e0.04 ± 0.01 f0.59 ± 0.04 h1.24 ± 0.03 a0.15 ± 0.01 ab
Mean0.1010.2520.10148.710.207.406.5024.250.121.780.810.19
SD0.010.472.557.280.030.630.686.920.211.100.280.08
CV (%)10.844.6112.684.9016.158.4810.3928.53172.7961.8035.0042.67
Note: Data represent means ± standard deviations. For each column, values not displaying the same letter are significantly different (p ≤ 0.05). SD: Standard deviation; CV: coefficient of variation.
Disclaimer/Publisher’s Note: The statements, opinions and data contained in all publications are solely those of the individual author(s) and contributor(s) and not of MDPI and/or the editor(s). MDPI and/or the editor(s) disclaim responsibility for any injury to people or property resulting from any ideas, methods, instructions or products referred to in the content.

