Article

Assaying the Use of a Leonardite-Suspension Concentrate-Based Product as a Potential Biostimulant to Enhance Growth, NPK Use Efficiency, and Antioxidant Capacity in Lactuca sativa L.

1
Department of Plant Physiology, Faculty of Science, University of Granada, 18071 Granada, Spain
2
Sofbey S.A., Via San Martino 16/A, CH-6850 Mendrisio, Switzerland
*
Author to whom correspondence should be addressed.
Agronomy 2024, 14(1), 64; https://doi.org/10.3390/agronomy14010064
Submission received: 14 November 2023 / Revised: 22 December 2023 / Accepted: 24 December 2023 / Published: 26 December 2023

Abstract

:
Biostimulants are presented as a potential tool to achieve the main objectives of modern agriculture: increase crop yield and nutritional quality while reducing chemical fertilizer use. Here, we investigated the use of a HS-based product (BLACKJAK®, from Sofbey S.A., Mendrisio, Switzerland) as a biostimulant to enhance plant growth, nitrogen (N), phosphorus (P), and potassium (K) use efficiency, as well as antioxidant capacity. For this purpose, BLACKJAK® was applied to lettuce (Lactuca sativa L.) as radicular (‘R’) and foliar (‘F’) at doses: 0.20 mL/L (R1), 0.40 mL/L (R2), 0.60 mL/L (R3), and 0.80 mL/L (R4), 5.00 mL/L (F1), 7.50 mL/L (F2), 10.00 mL/L (F3), and 12.50 mL/L (F4), along with a control. Shoot fresh weight (FW) and dry weight (DW), leaf area, NPK use efficiency parameters, and antioxidant capacity were evaluated. Our results showed that R1, R2, R3, F2, and F3 enhanced shoot FW and leaf area, while only R3 increased shoot DW. Furthermore, in general, most of the doses employed enhanced NPK use efficiency parameters such as apparent crop recovery, nutrient export, physiological efficiency, and internal utilization of applied nutrients. Similarly, HS also increased ascorbate, glutathione, and phenol concentrations, showing an improvement in antioxidant capacity measured through FRAP (Ferric Reducing Antioxidant Power) and TEAC (Trolox Equivalent Antioxidant Capacity) assays. Overall, root-HS offered better results than foliar-HS, especially at R3. Hence, our results indicate that BLACKJAK® could be a good candidate to enhance crop productivity and nutritional quality while reducing the use of chemical NPK fertilizers.

1. Introduction

Nitrogen (N), phosphorus (P), and potassium (K) are essential nutrients required by plants for crop yield and productivity [1]. Nitrogen is part of essential biomolecules such as amino acids, nucleic acids, chlorophyll, phytohormones, and ATP, playing a critical role in plant metabolism [2]. Phosphorus is a crucial component of plasma membranes as part of phospholipids, and it is also a constituent of nucleic acids and ATP, while inorganic P participates in signal transduction cascades. In addition, potassium, which is not incorporated into organic forms, plays an important role as a soluble ion (K+), mainly regulating cell turgor via osmoregulation as well as protein biosynthesis [3]. These nutrients are absorbed by plant roots and transported to the aerial part, where they perform their function. Thereby, the application of NPK to plants remains one of the most common strategies to increase crop productivity [1].
Chemical fertilizers continue to be the main form of NPK application by farmers. Nevertheless, because more than 60% of the fertilizers applied are lost into the environment, the overuse of NPK fertilizers leads to detrimental effects on human health and soil fertility [4]. In this way, soil degradation and acidification, depletion of soil organic matter, nutrient imbalance in soil solution, decrease in cation exchange capacity, and salt accumulation are some of the negative effects of excess NPK fertilizers at the soil level [5,6]. Furthermore, other environmental problems include an increase in greenhouse gas emissions, such as N2O, as well as groundwater contamination [1]. In this context, new environmentally friendly agrosolutions are needed to increase NPK use efficiency by plants and reduce inorganic fertilizer employment. Thus, biostimulants, which include different types such as humic substances, seaweed and botanical extracts, beneficial bacteria and fungi, chitosan, and protein hydrosilates, among others, are presented as a potential tool to provide nutrients to crops and increase nutrient use efficiency while decreasing chemical fertilizer use [4].
In addition, different research projects are focused on increasing the nutritional quality of agricultural products, which can be measured in terms of antioxidant concentrations that are beneficial for human health [7,8]. Thus, ascorbic acid (AsA) as well as glutathione (GSH) are some of the main non-enzymatic antioxidants present in plant tissues [9,10]. Other bioactive compounds are pigments such as lycopene, β-carotene, and anthocyanins [11]. The crucial function of these antioxidants is the scavenging of reactive oxygen species (ROS) such as superoxide (O2.−) and hydrogen peroxide (H2O2), which can cause lipid peroxidation, protein denaturalization, DNA damage, and, ultimately, severe illness [9,12]. Therefore, antioxidant biomolecules play an important role in animal and human health, preventing cancer, neurodegenerative diseases, obesity, diabetes, dyslipidemia, and other diseases [13]. The accumulation of antioxidant compounds in plant organs, which are subsequently consumed by humans, can be favored by biostimulant applications. In this way, Mannino et al. [14] found that the application of a biostimulant composed of seaweed and yeast extracts significantly enhanced antioxidant activity in tomato plants. Similar results were obtained by Velasco et al. [15] in three different Brassica species treated with Trichoderma hamatum and by Cristofano et al. [16] in lettuce plants subjected to foliar and root vegetal protein hydrosilate applications.
Among the main biostimulants that have been widely studied by the scientific community are humic substances (HS), which come from soil organic matter biodegradation and include three types: humic acids (HA), fulvic acids (FA), and humin. These HS are extracted from different sources, such as coal, peat, vermicompost, or lignites [17,18]. Different studies have demonstrated that root or foliar application of HA and FA, separately or combined, significantly enhances plant growth, biomass production, nutrient uptake, and assimilation, as well as abiotic stress tolerance in different plant species [18,19,20,21,22]. Regarding ionome, it is well known that HS can enhance root nutrients transporters activity and mineral element bioavailability, leading to an increase in nutrients (such as NPK) uptake and transport to leaves [23,24]. Furthermore, nutrient assimilation and utilization can also be improved by HS application through an enhancement in the activity of essential enzymes in these physiological processes [19,25]. In addition, it was found that HS may favor bioactive molecule accumulation, such as AsA or phenolic compounds, leading to an improvement in antioxidant capacity [26,27,28]. However, most studies about the beneficial effects of HS on nutrient use efficiency and antioxidant quality use only one mode of HS application (root/foliar).
Nutritional quality studies are focused on crops destined for human consumption, such as leafy vegetables. Lettuce (Lactuca sativa L.) is one of the most important economic leafy vegetables that is produced worldwide, especially in moderate climate conditions. Lettuce includes different types according to leaf morphology: iceberg, romaine, batavia, oilseed, and Latin, among others. It is mainly consumed in salads and provides benefits for human health, reducing cardiovascular disease and cancer risk. This is due to the high amounts of bioactive compounds in lettuce leaves: AsA, carotenoids, vitamins, and polyphenols, which prevent diseases through ROS scavenging [29,30].
In the present study, it was employed a purified leonardite-suspension concentrate (SC)-based product named BLACKJAK®, a biostimulant marketed by Sofbey S.A. (Mendrisio, Switzerland), which shows the capacity to improve soil fertility and crop yield. Nevertheless, there is limited information about which mode of application (root vs. foliar) is most appropriate, which dose (mL/L) is the best, and the beneficial effects of BLACKJAK® on the antioxidant quality of lettuce. For this reason, in this experiment, BLACKJAK® was applied to lettuce plants as root and foliar at different doses to assess its potential to enhance lettuce growth, NPK concentrations, and use efficiency, as well as antioxidant capacity, selecting which dose and mode of application could be most appropriate.

2. Materials and Methods

2.1. Plant Material and Growth Conditions

For the present work, lettuce (L. sativa L. cv. Capitata) was used as plant material. Lettuce seeds were grown for 45 days in a tray with cells (3 cm × 3 cm × 10 cm). After that, seedlings were transferred to pots filled with a perlite/vermiculite mixture (1:3) and randomly distributed in a culture chamber under environmental-controlled conditions: relative humidity 60–80%, temperature 25 °C/15 °C (day/night), 16 h/8 h of photoperiod, and 350 μmol m−1 s−1 of photosynthetically active radiation (PAR). Throughout the trial, lettuce plants received a complete Hoagland nutritive solution with some modifications: 4 mM KNO3, 3 mM Ca(NO3)2·4H2O, 1 mM KH2PO4, 1 mM NaH2PO4·2H2O, 2 mM MgSO4·7H2O, 0.25 mM CuSO4·5H2O, 2 µM MnCl2·4H2O, 1 µM ZnSO4·7H2O, 5 µM Fe-chelate (Sequestrene; 138FeG100), 10 µM HBO3, and 0.1 µM Na2MoO4·2H2O. The pH of this nutritive solution was 5.5–6, and it was renewed every three days.

2.2. Experimental Design and Biostimulant Application

The HS application started seven days after transplantation. Lettuce plants were treated with BLACKJAK® three times with a periodicity of 10 days. Root (‘R’) HS application was conducted by the addition of BLACKJAK® to the nutritive solution previously described at four different doses: 0.20 mL/L (R1), 0.40 mL/L (R2), 0.60 mL/L (R3), and 0.80 mL/L (R4). In addition, foliar (‘F’) HS application was also carried out at four doses: 5.00 mL/L (F1), 7.50 mL/L (F2), 10.00 mL/L (F3), and 12.50 mL/L (F4). The foliar-HS application started 2 h after the onset of the growth chamber light period. In addition, a control was carried out by the addition of a nutritive solution without HS. A total of nine treatments, with eight plants per treatment and randomly distributed, were used for this experiment.

2.3. Lettuce Sampling

Lettuce plants were sampled 30 days after treatment started. The leaves of all plants from each treatment were weighed to determine the fresh weight (FW). Afterwards, half of the leaves were frozen at −45 °C for later biochemical analyses, while the other half was lyophilized to determine the dry weight (DW) and NPK concentration. Furthermore, leaf area was also quantified with a LI-COR optical reader, model LI-3000A (LI-COR Inc., Lincoln, NE, USA).

2.4. Determination of NPK Concentration and Use Efficiency

Dry leaves were employed to determine the NPK concentration. N determination was assayed by dry combustion using an elemental analyzer, TruSpec CN LECO® (St. Joseph, MI, USA) [31]. In addition, P and K concentrations were quantified by ICP-MS (Perkin Elmer, Waltham, MA, USA) after dry leaf digestion with an HNO3/HClO4 mixture (v/v) and 30% H2O2 at 300 °C [32]. From NPK concentration, different nutrient use efficiency parameters were calculated: RE (apparent crop recovery efficiency of applied nutrient); PE (physiological efficiency of applied nutrient); IE (internal utilization efficiency of applied nutrient); AE (agronomic efficiency of applied nutrient); PFP (partial factor productivity of applied nutrient); NE (nutrient export of a plant nutrient in shoot). These parameters were determined using the following equations [33]:
PE: (Y − Y0)/(U − U0)
IE: Y/U
AE: (Y − Y0)/F
PFP: Y/F
NE: Y × C
where U is total plant nutrient uptake in aboveground biomass at maturity (mg); Y is crop yield (g) (shoot DW, except for AE and PFP, where Y was shoot FW). Both U and Y can be measured for the control treatment and expressed as U0 and Y0. F is the amount of nutrient applied (g), while C is the nutrient concentration (mg g−1 DW).

2.5. Antioxidant Quality Analysis

Total AsA was determined following the method described by Buturi et al. [34], with some modifications. A total of 0.1 g of lettuce leaves were macerated with 600 µL of 5% (w/v) meta-phosphoric acid and then centrifugated at 16,700× g for 15 min. Then, 200 µL of supernatant was mixed with 500 µL of 150 mM Na-phosphate buffer (pH 7.5) and 60 µL of 10 mM dithiothreitol (DTT). After 10 min of incubation at room temperature, 60 µL of 0.5% N-ethylmaleimide, 240 µL of 10% trifluoroacetic acid, 240 µL of 44% orthophosphoric acid, 240 µL of 4% bipyridyl (dissolved in 70% ethanol), and 120 µL of 3% FeCl3 were added. After incubation at 40 °C for 40 min, the absorbance was measured at 525 nm against a standard curve of ascorbic acid.
Total GSH was assayed according to López-Moreno et al. [35]. A total number of 0.1 g of plant material was macerated in 600 µL of 0.2 M HCl and then centrifugated at 16,000× g for 10 min. Afterwards, 500 µL of supernatant was mixed with 500 µL of 0.5M Na-phosphate buffer (pH 7.5). Then, an aliquot of 40 µL was mixed with 305 µL of 0.5M Na-phosphate buffer (pH 7.5), 32 µL of 10 mM NADPH, 32 µL of 6 mM 5,5′-dithio-bis(2-nitrobenzoic acid) (DTNB), 110 µL of distilled H2O, and 32 µL of glutathione reductase (GR). After 10 min of incubation at room temperature, total GSH was determined at 412 nm against a curve of GSH.
For total phenol and flavonoid concentration, the method described by Rivero et al. [36] was followed. For the extraction, 0.1 g of lettuce leaves were macerated with 0.5 mL of methanol, 0.5 mL of chloroform, and 250 µL of 1% NaCl. After centrifugation at 5000 rpm for 10 min, the supernatant was used for the determination of total phenols and flavonoids. Thus, 90 µL of supernatant was mixed with 180 µL of H2O, 240 µL of 5% Na2CO3, and 90 µL of 50% Folin–Ciocâlteu reagent. After incubation for 40 minutes at room temperature, the absorption was measured at 725 nm against a curve of caffeic acid. For flavonoid concentration, 85 µL of supernatant was mixed with 340 µL of distilled water and 26 µL of 5% NaNO2. Samples were incubated at room temperature for 5 min. After that, 26 µL of 10% AlCl3 and 170 µL of 1 M NaOH were added. The absorption was measured at 415 nm against a curve of rutin after 5 min of incubation at room temperature.
The anthocyanin extraction was carried out through the addition of 1 mL of methanol acidified with 1% HCl to 0.1 g of lettuce leaves. Samples were centrifuged at 5000 rpm for 5 min. Afterwards, and separately, 250 µL of supernatant was added to two different buffers: 0.025 M K-HCl (pH 1.0) and 0.4 M sodium acetate (pH 4.5). The absorption of both solutions was measured at 640 and 710 nm, and the anthocyanin concentration was determined as: [(A640 − A710) pH 1.0] − [(A640 − A710) pH 4.5] [34].
Lycopene and β-carotene were extracted from 0.1 g of leaves mixed with 4:6 (v/v) acetone:n-hexane. After centrifuging at 5000 rpm for 5 min, the absorbance of the supernatant was measured at 453, 505, 645, and 663 nm. Lycopene concentration was calculated as: (−0.048 × A663) + (0.204 × A645) + (0.372 × A505) − (0.0806 × A453), while β-carotene was determined as: (0.216 × A663) − (1.22 × A645) − (0.304 × A505) + (0.452 × A453) [37].
The antioxidant capacity of plant material was determined by FRAP (Ferric Reducing Antioxidant Power) and TEAC (Trolox Equivalent Antioxidant Capacity) tests [34]. For both antioxidant assays, 0.1 g of leaves was mixed with 1 mL of methanol and centrifuged at 10,200 rpm for 2 min. For FRAP, 5 µL of supernatant was mixed with 195 µL of FRAP reagent composed of a mixture of 0.25 M sodium acetate (pH 3.6), 1 mM TPTZ (2,4,6-tris(2-pyridyl)-s-triazine), and 20 mM FeCl3. Then, the absorption was measured at 593 nm against a curve of ferrous sulphate. For the TEAC test, 5 µL of supernatant was mixed with 195 µL of TEAC reagent composed of a mixture of 7 mM ABTS (2,2′-azino-bis(3-ethylbenzothiazoline-6-sulfonic acid) and 2.45 mM potassium persulfate. After that, the absorption was measured at 734 nm against a curve of Trolox (6-hydroxy-2,5,7,8-tetramethylchroman-2-carboxylic acid).

2.6. Statistical Procedures

The collected data were subjected to a simple ANOVA at 95% confidence using the Statgraphics Centurion 16.1.03 software. Mean comparisons were carried out using Fisher’s least significant differences (LSD). The significance levels were expressed as * p < 0.05, ** p < 0.01, *** p < 0.001, or NS (not significant).

3. Results

3.1. Shoot Growth

In the present study, shoot biomass was significantly increased by leonardite-SC application in terms of FW at doses R1, R2, R3, F2, and F3, with an increase of 16%, 17%, 23%, 13%, and 13%, respectively, with respect to control plants. Furthermore, the same doses of HS also enhanced leaf area: R1 (11%), R2 (10%), R3 (11%), F2 (10%), and F3 (10%). On the other hand, although R2, F1, F2, and F3 increased shoot DW, there were no significant differences compared to the control treatment. Only root-HS applied at R3 significantly enhanced shoot DW, with an increase of 77% (Table 1).

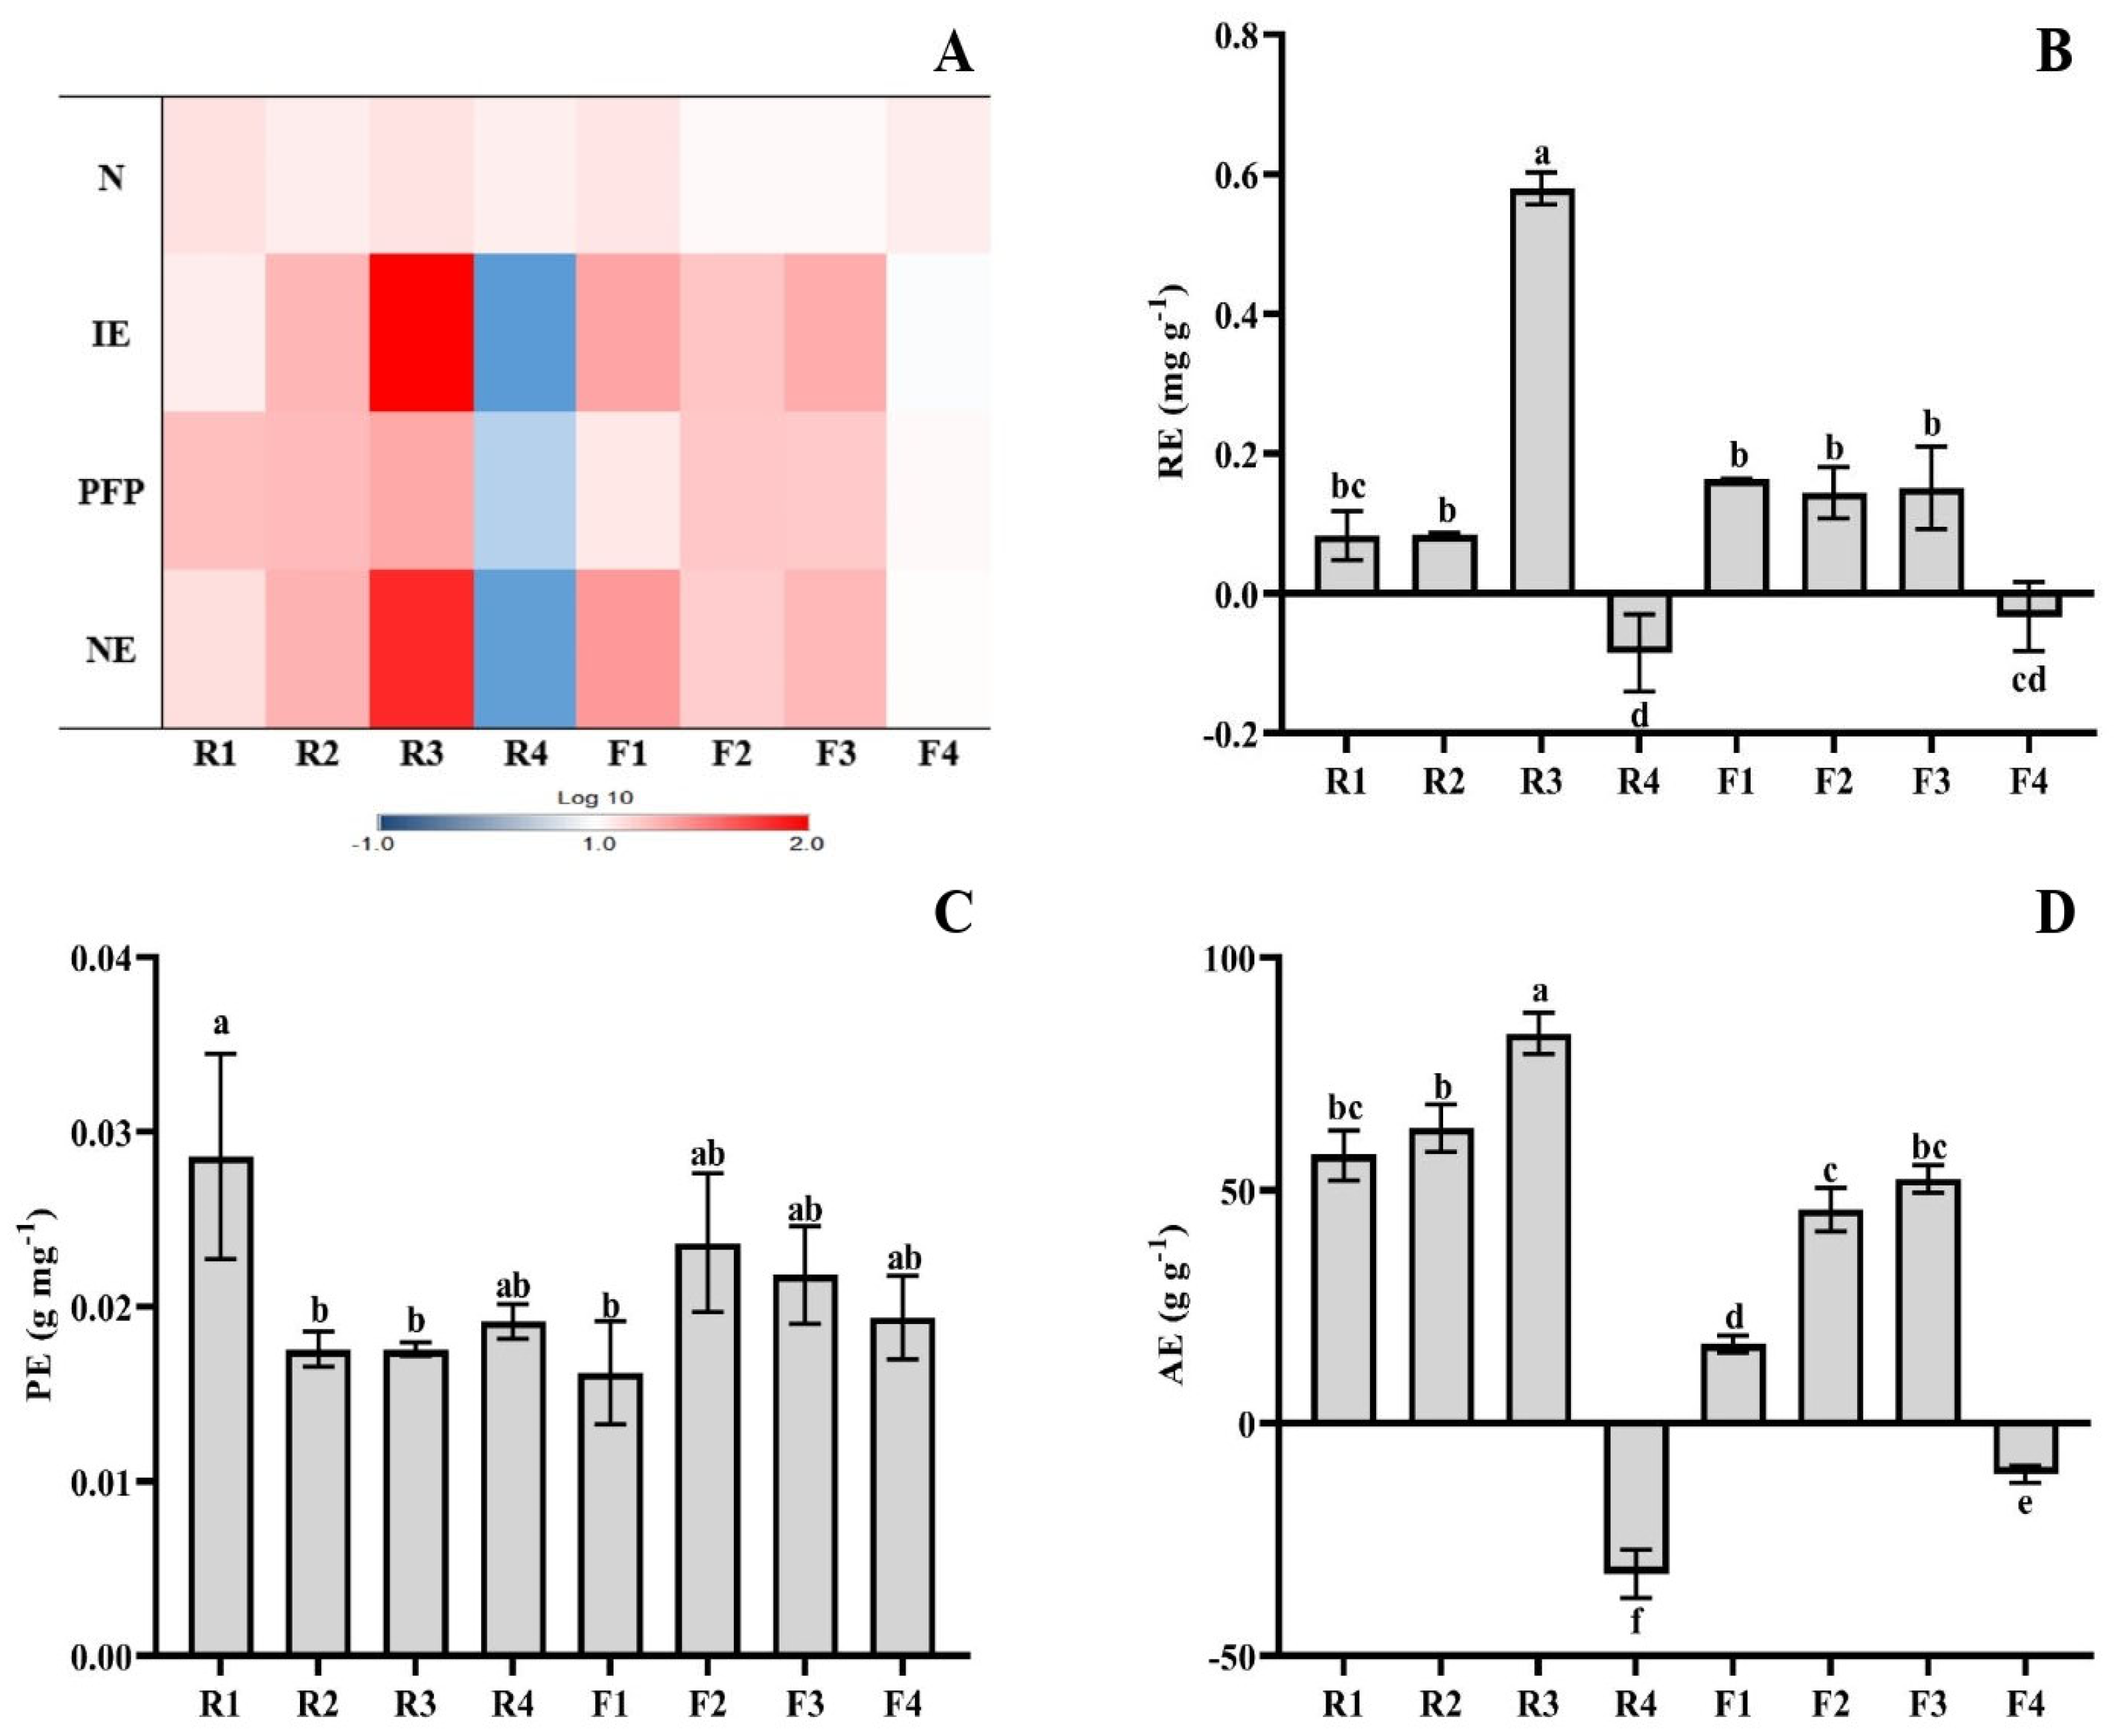
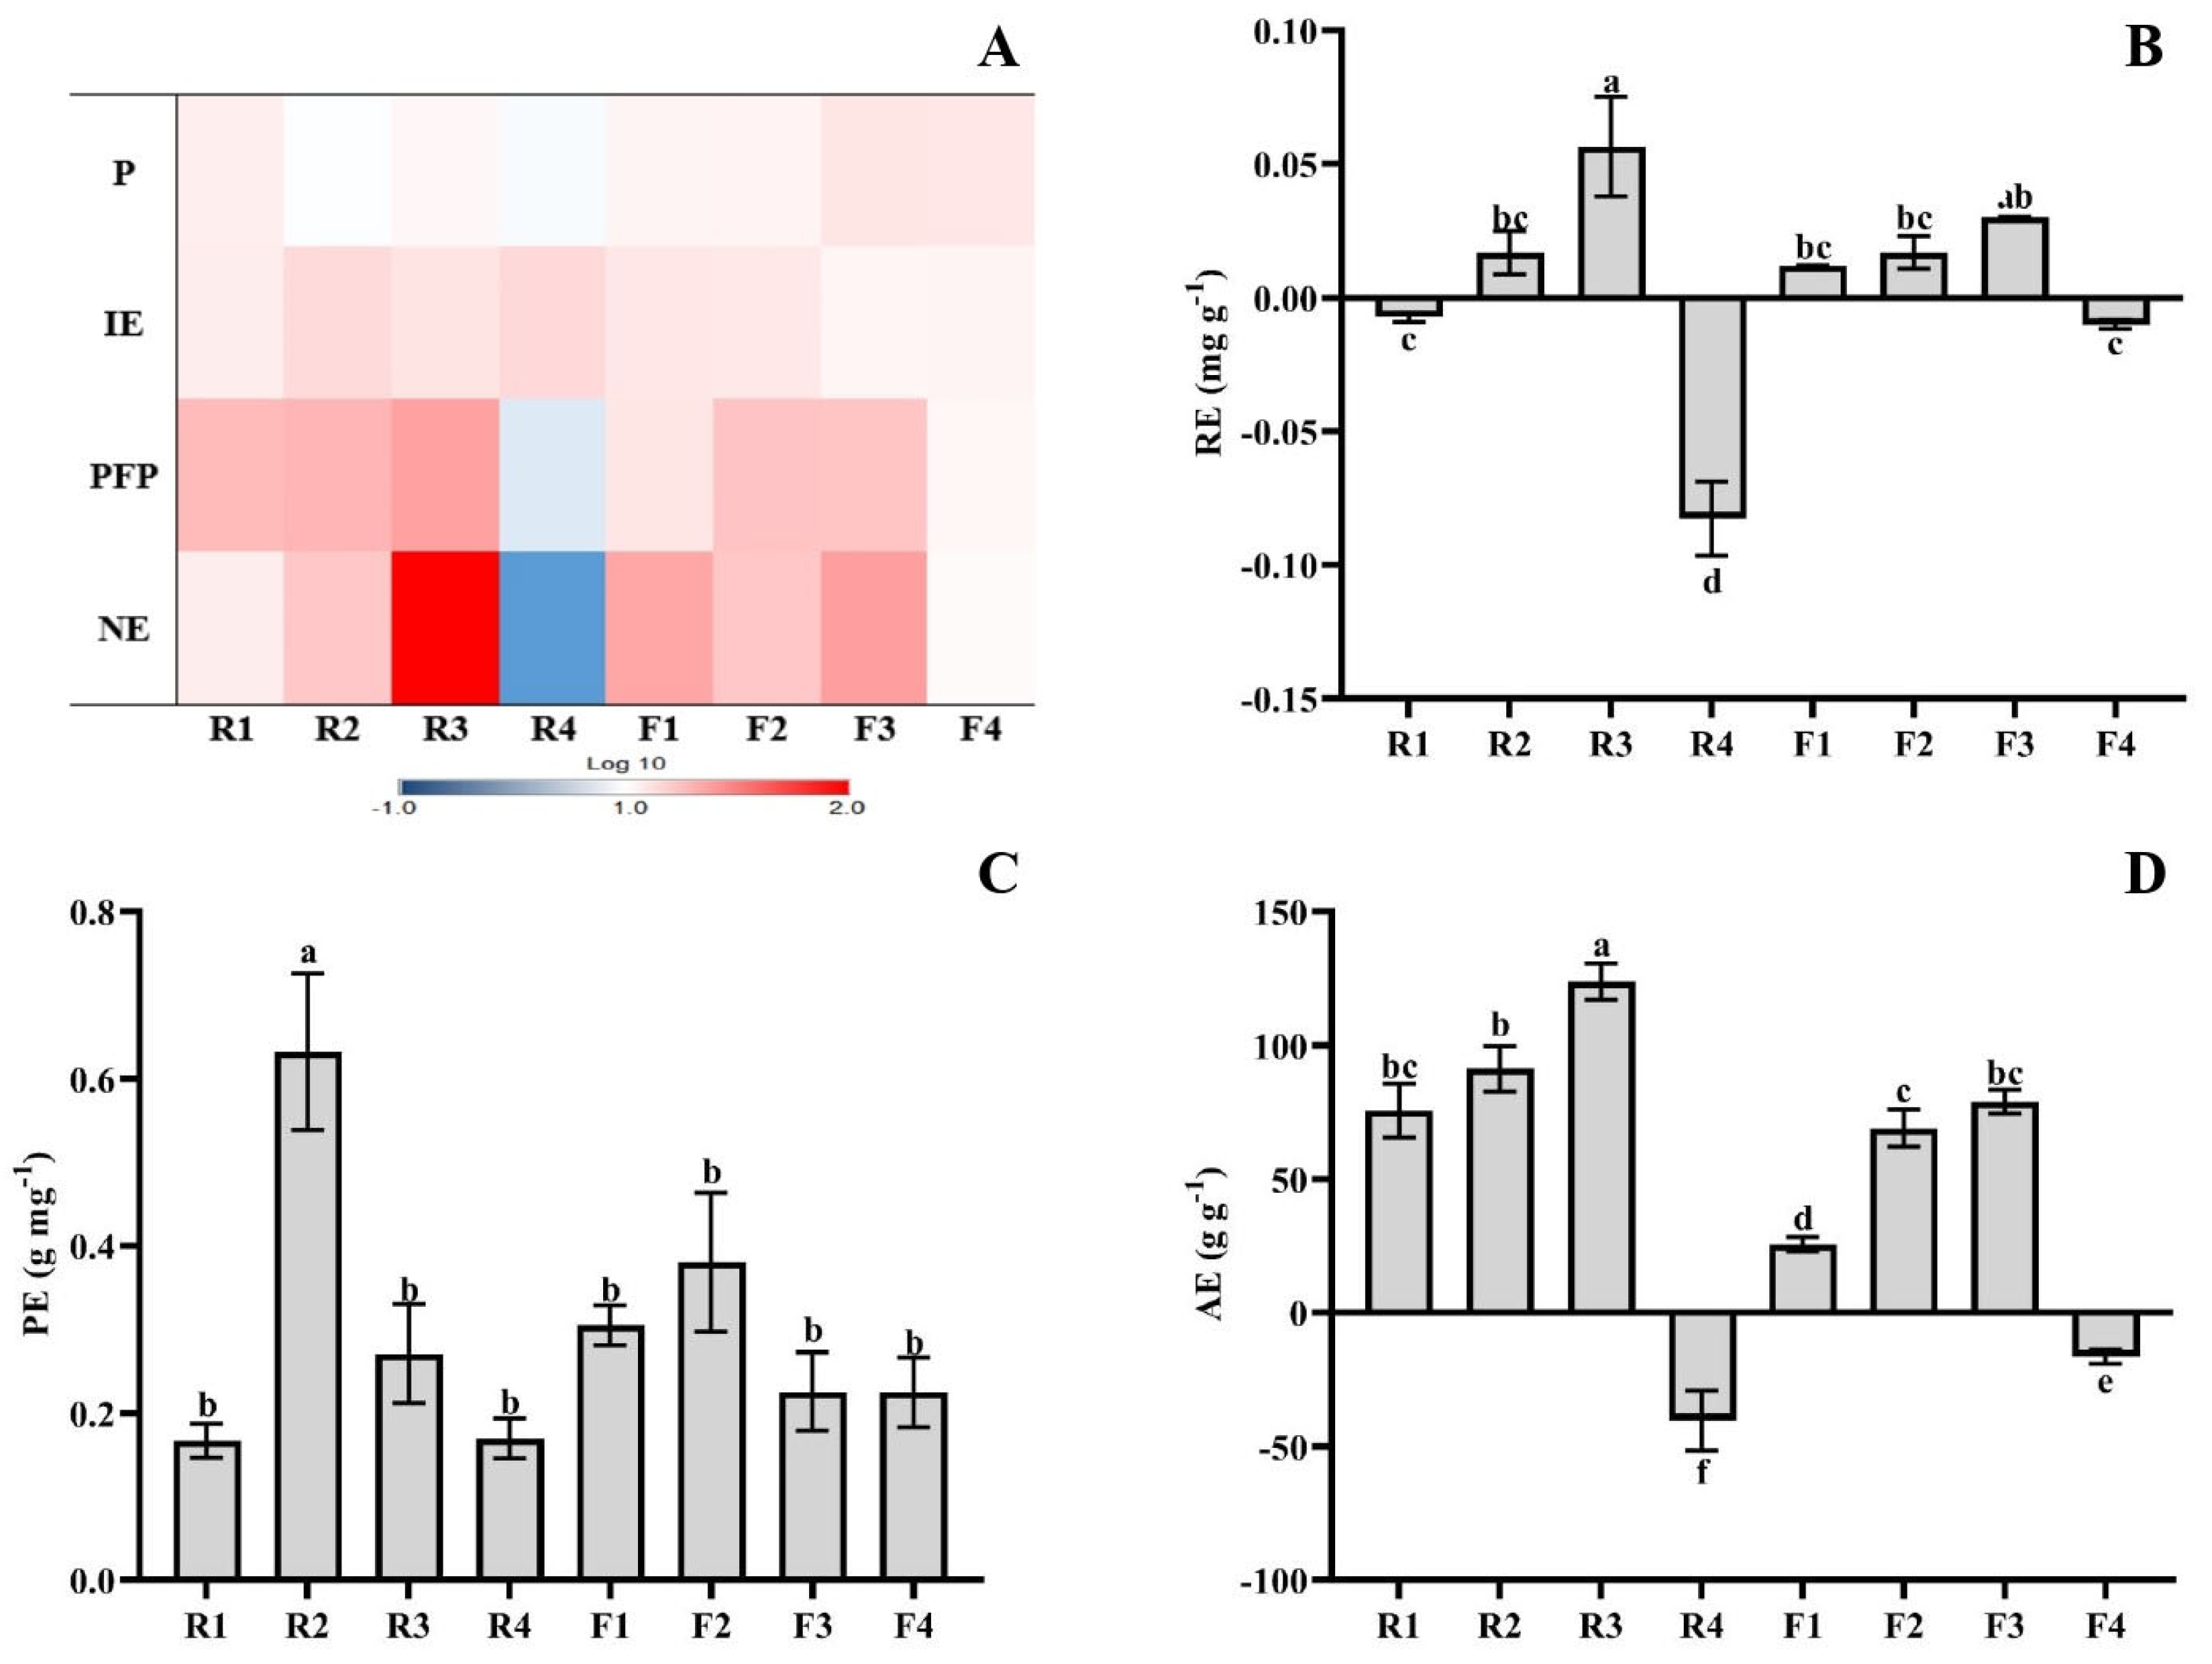
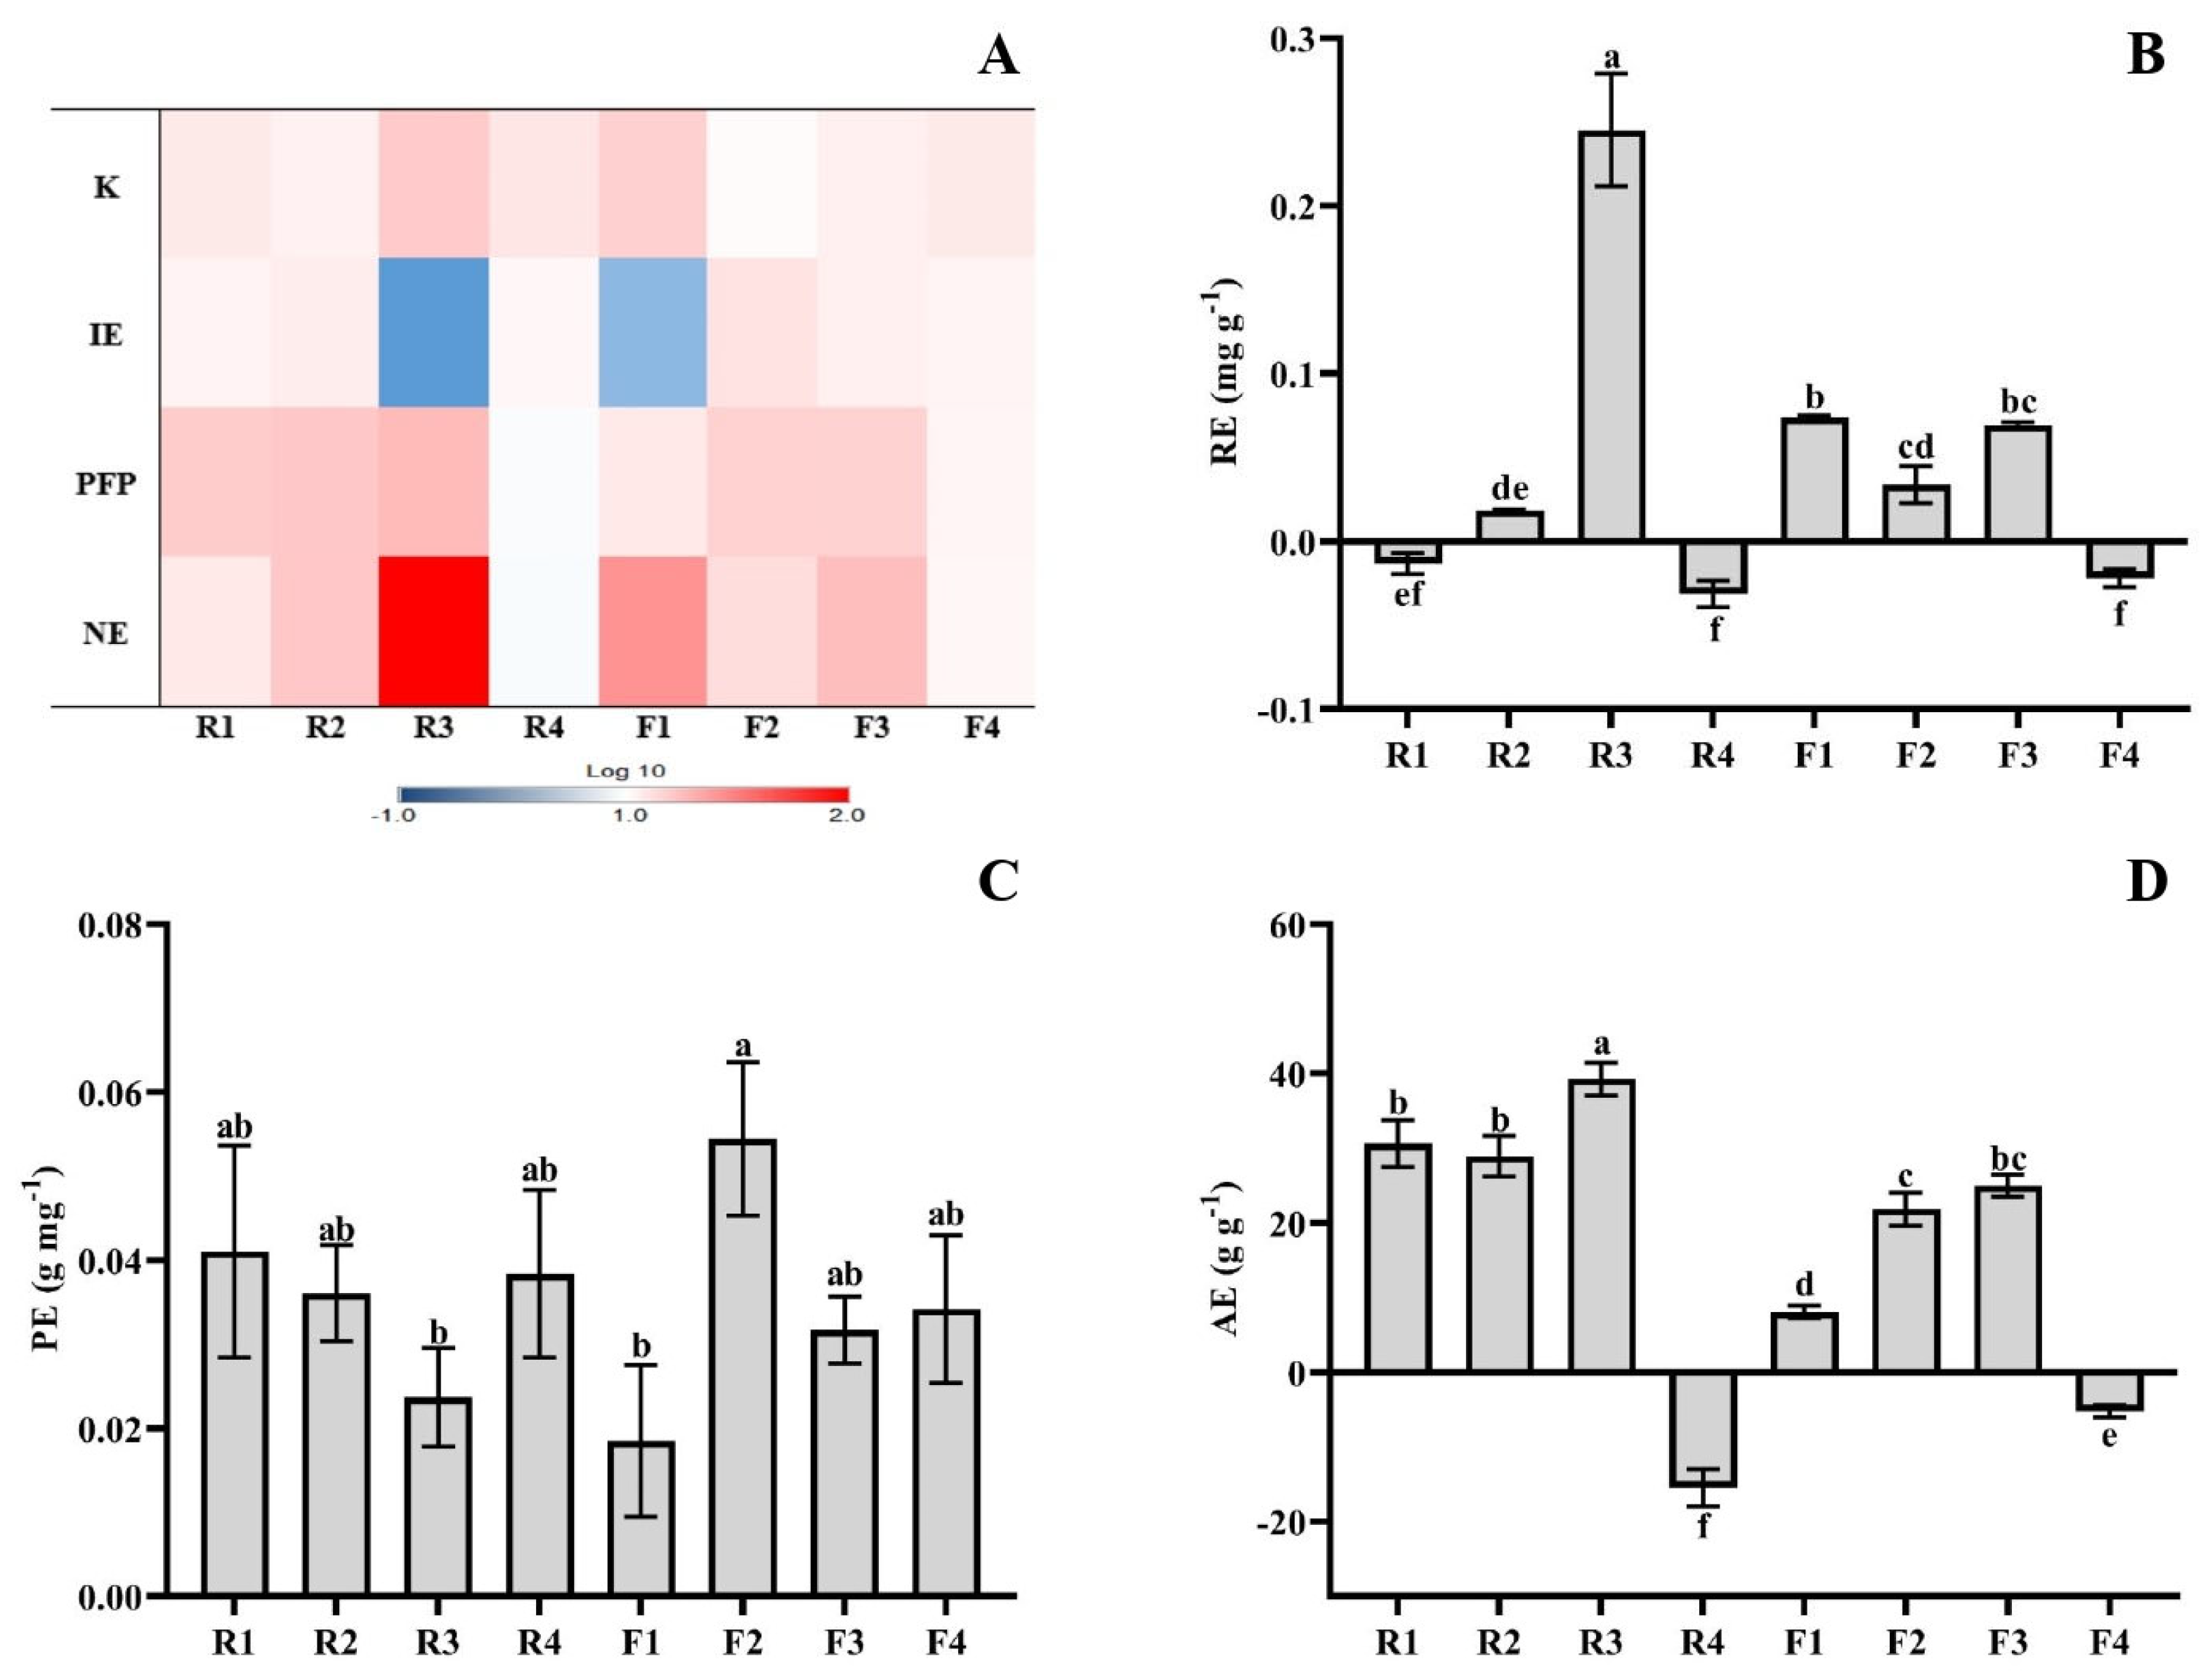
3.2. NPK Use Efficiency

N concentration was significantly increased by R1, R2, R3, F1, and F4, while F2 and F3 doses decreased N with respect to control. The highest N concentration increase was found in R1 and R3 doses. Furthermore, R3 also enhanced IE, PFP, and NE, with the highest increase in IE and NE compared to all other treatments. A significant increase in PFP was also observed in plants treated with R1, R2, F2, and F3, while F1 enhanced NE. (Figure 1A, Table S1). In addition, compared to control plants, RE was decreased by R4 and F4 doses, while the rest of the HS doses significantly increased RE, with R3 showing the highest values (Figure 1B). Concerning PE, it was enhanced by all the HS doses compared to the control (Figure 1C). Similar to RE, a significant reduction in AE was observed in R4 and F4 compared to control plants, while the rest of the doses increased AE; R3 presented the highest increase and F1 the lowest (Figure 1D).
Regarding P, any HS dose used in the present study significantly enhanced the P concentration. In addition, a significant decrease was observed in plants treated with R2 and R4 in relation to P concentration compared to the control treatment. However, IE was enhanced by R2 and R4 doses, while R1, R2, F3, and F4 significantly increased PFP. Furthermore, the application of the HS at the R3 dose increased PFP and NE (Figure 2A, Table S2). In addition, RE was decreased by R1, R4, and F4 application, with R4 showing the lowest value, while the rest of HS doses increased RE compared to control, presenting R3 with the highest values (Figure 2B). PE was enhanced by all the treatments, showing plants treated with R2 the largest increase (Figure 2C). Although R4 and F4 doses decreased AE, the rest of the HS doses significantly increased this parameter with respect to control plants, showing R3 the highest and F1 the lowest increases (Figure 2D).
K concentration was significantly increased by R3, R4, and F1 doses, with the highest increase in plants treated with R3 and F1. Only F2 enhanced IE, while R3, R4, and F1 decreased it. PFP was also enhanced by R1, R2, R3, F2, and F3, while a significant increase in NE was observed by R3 and F1 applications (Figure 3A, Table S3). In addition, R1, R4, and F4 decreased RE compared to the control, while the rest of the HS doses enhanced it, and the highest increase was observed in R3 (Figure 3B). All treatments significantly enhanced PE with respect to control (Figure 3C). Furthermore, AE was decreased by the highest doses (R4 and F4), while the rest of the HS doses significantly enhanced it compared to the control treatment, and R3 showed the highest and F1 the lowest values (Figure 3D).

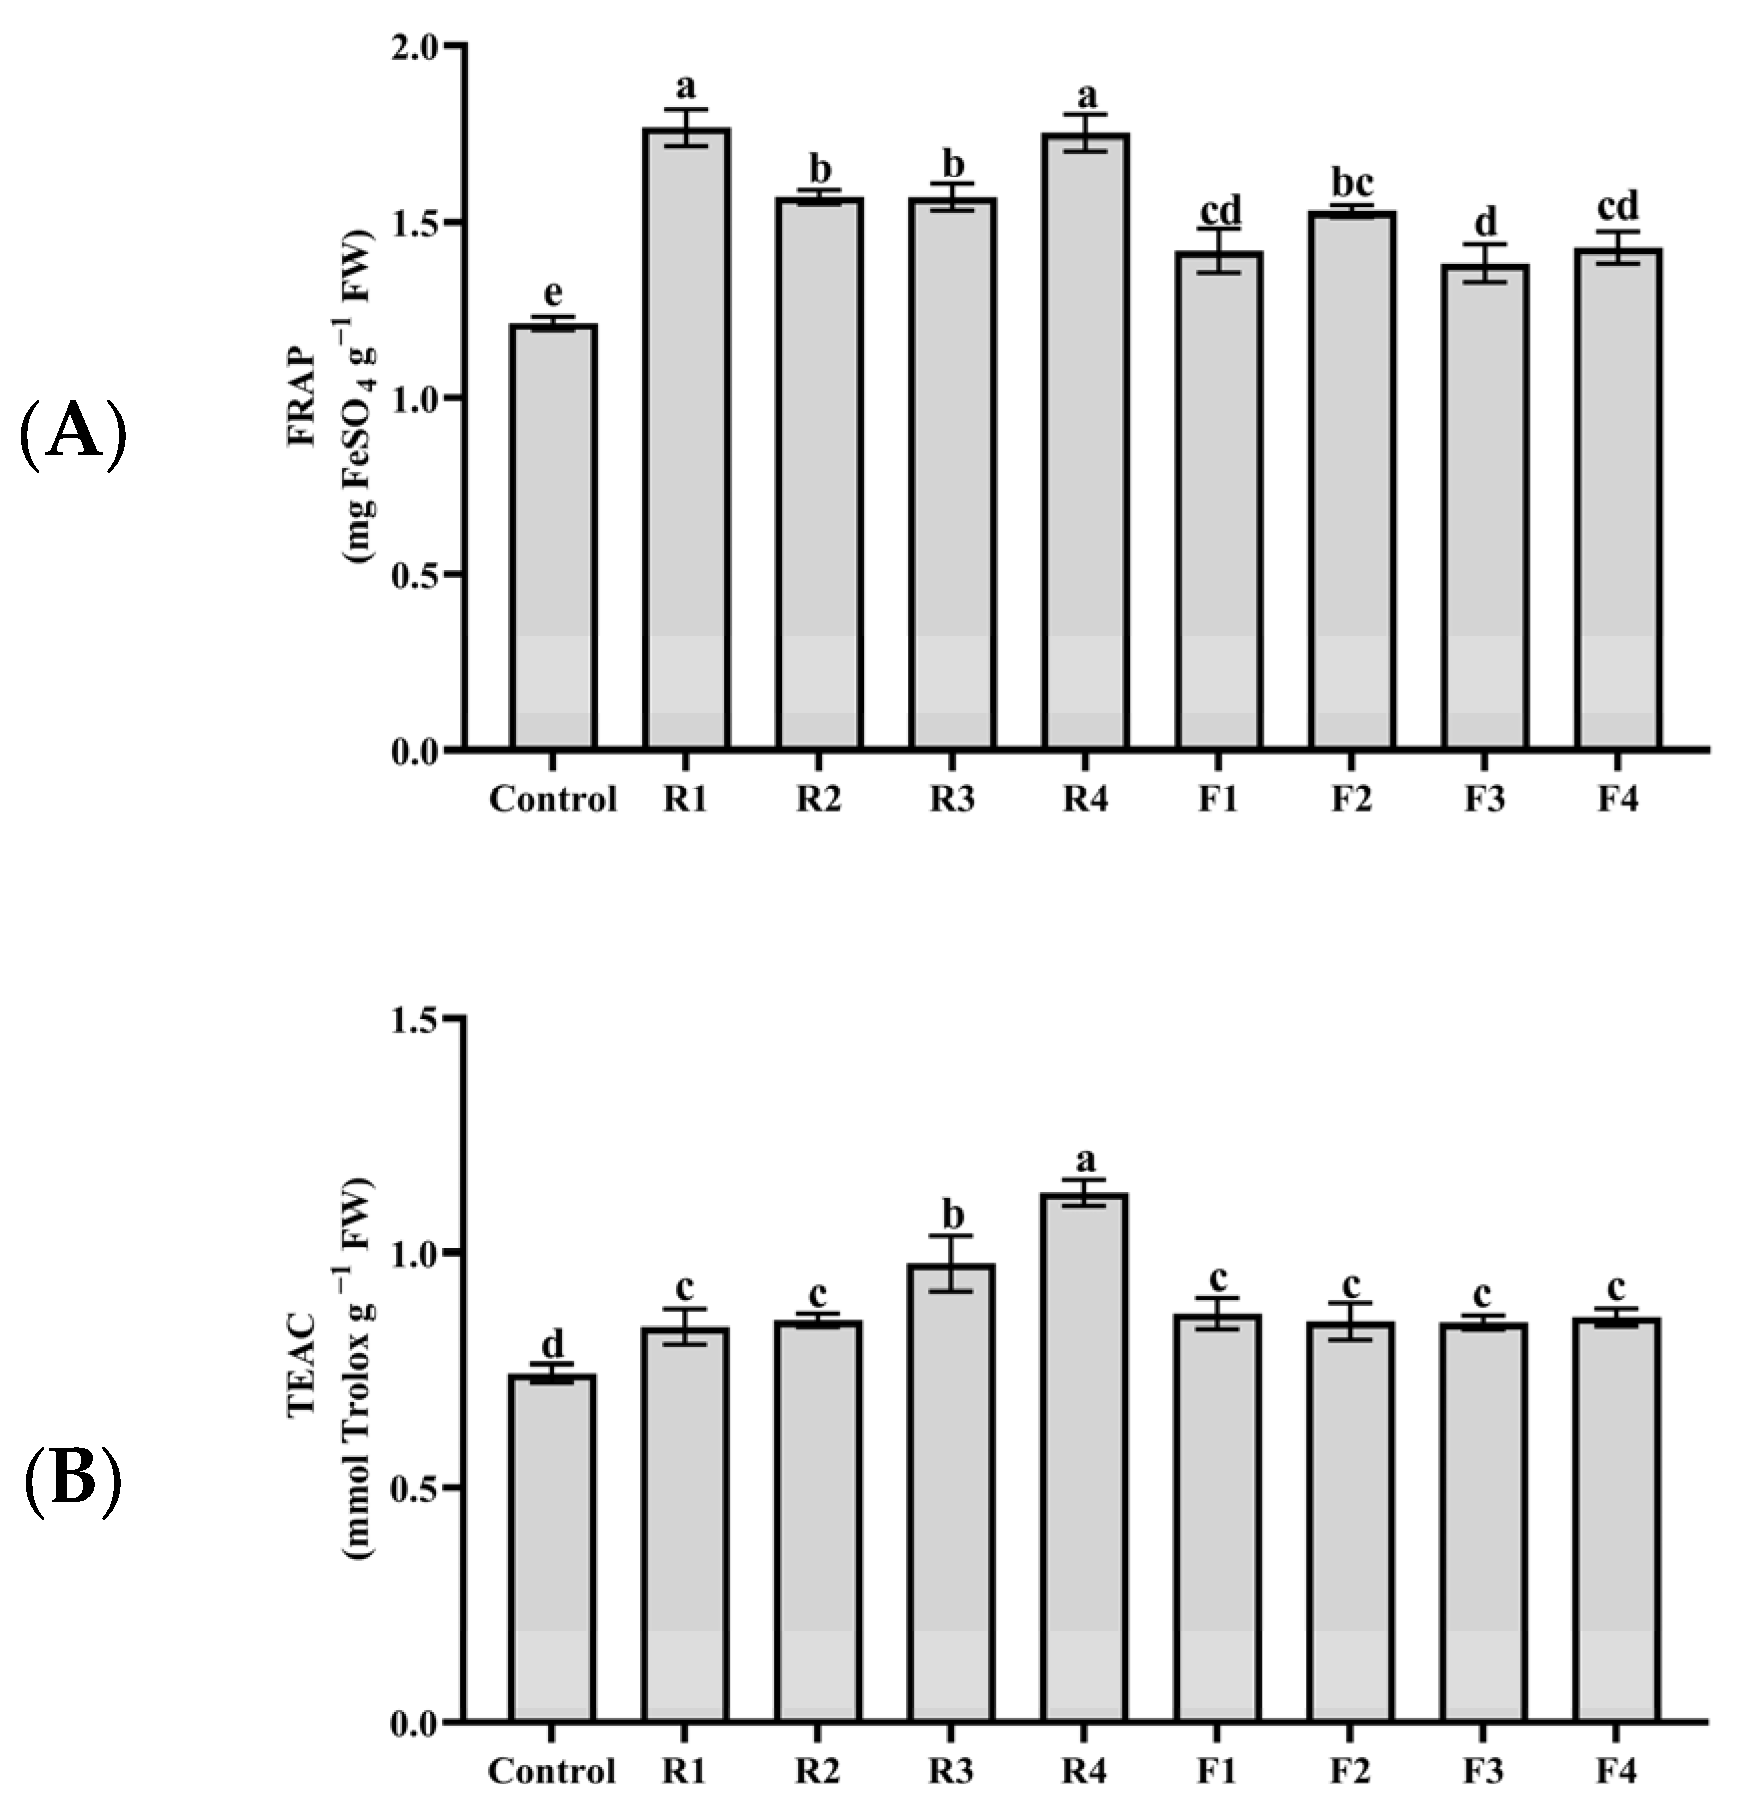
3.3. Antioxidant Capacity

AsA concentration was significantly enhanced by all HS doses at both root and foliar applications, with the largest values presented by F2 and F3 treatments. In addition, R1 and R4, as well as F2 and F3, increased GSH concentration, showing plants subjected to radicular-HS the highest values. Concerning phenolic compounds, leonardite-SC applied at R1, F1, F2, F3, and F4 increased total phenol and flavonol concentrations, while R4 also enhanced flavonoids. However, both total phenols and flavonoids were significantly decreased in lettuce plants treated with R2 and R3 doses. Lycopene concentration was increased only by root-HS at doses R1, R2, and R3, while β-carotene concentration was decreased by R1 and R2 and enhanced by F1 and F3. Finally, only foliar-HS significantly increased anthocyanin concentration, showing F2 and F3 the largest increase (Table 2).
The results obtained from the antioxidant capacity test showed a significant increase in FRAP and TEAC at all HS doses compared to control. Indeed, R1 and R4 offered the highest FRAP values, followed by R2, R3, and F2 (Figure 4A). Concerning the TEAC assay, R4 showed the largest value, followed by R3 (Figure 4B).

4. Discussion

Increased crop productivity is one of the main objectives of researchers and farmers to feed the world’s growing population. In this context, biostimulants or biofertilizers are presented as potential tools to enhance crop yield in a sustainable way while decreasing chemical fertilizer use [38,39]. A plant biostimulant can be defined as a product, organic or inorganic, that has the capacity to enhance different characteristics, such as the availability of nutrients in the rhizosphere, nutrient use efficiency, and quality traits [40]. HS, which has the potential to increase crop productivity, is included in this definition [18].
In the present study, the application of the leonardite-SC-based product BLACKJAK® enhanced lettuce growth at most of the doses employed, particularly at R1, R2, R3, F2, and F3 in terms of shoot FW and leaf area (Table 1). The highest increases in these growth parameters were found with root-HS doses, compared to foliar application, and especially at R3. In addition, leafy vegetables are consumed mainly fresh, so increases in crop fresh weight result in increased economic profitability [41]. BLACKJAK® is a HS-based product commercialized by Sofbey S.A. with the potential to increase crop yield in the field (https://www.sofbey.com/product/blackjak/, accessed on 4 September 2023). However, no studies have been carried out in environmentally controlled growth conditions to determine which dose and mode of application could be more appropriate. Therefore, the results obtained in our study suggest that BLACKJAK® could be employed to improve lettuce productivity, with root-HS application being more appropriate to enhance growth compared to foliar treatments, especially at R3.
Our results align with other studies that use different types of HS (HA and/or FA) at different rates and obtained from diverse natural sources such as lignite, including leonardite. Thus, Tahir et al. [42] showed that foliar lignite-derived HA application improved shoot FW of maize plants in two different soils (calcareous and non-calcareous). Similar results have subsequently been reported in lettuce plants subjected to foliar-HS derived from vermicompost [25] and in yarrow plants treated with different HA and FA rates applied as soil drench under field and greenhouse experimental conditions [43]. Likewise, shooting DW may also be enhanced by the HS application [43]. Nevertheless, although R2, R3, F1, F2, and F3 doses slightly increased shoot DW, only R3 showed a significant enhancement of this parameter compared to control plants (Table 1). Similarly, Tahir et al. [42] found that increases in shoot FW of plants treated with some HA doses did not result in shoot DW increases. Therefore, a positive correlation between FW and DW was not found in our study, except for the R3 dose.
The physiological mechanisms by which HS positively increases plant growth and productivity remain unclear and need further study. These mechanisms have been defined as indirect (changes in soil physicochemical properties) and direct (changes in primary and secondary metabolism) [44,45]. In the present experiment, we focused on nutrient concentration and use efficiency because there are limited studies about the physiological effects of BLACKJAK® on nutrient use efficiency parameters. particularly NPK, because they are the main components of chemical fertilizers applied in modern agriculture.
In our experiment, the application of a leonardite-SC-based product enhanced N concentration at all doses, except for R4, F2, and F3 (Figure 1A). The increase in N uptake and accumulation in plants treated with HS has been extensively studied and demonstrated. Thus, Haghighi et al. [46] found a significant increase in N concentration after HA application in lettuce plants, while Bayat et al. [43] showed similar results in yarrow plants subjected to HA and FA. Different explanations for the increase in N uptake and accumulation have been offered by researchers. HS may enhance the root plasma membrane (PM)-H+-ATPase activity, which subsequently stimulates N uptake by nitrate (NO3) symport (2 H+: 1 NO3) [22,47]. Furthermore, genes encoding NO3 transporters, such as NRT, may be induced by HS application, enhancing N uptake and transport to shoot [23]. Both considerations could explain that, in general, BLACKJAK® enhanced N concentration in lettuce leaves.
Inorganic P is the main source of P absorbed by plants. Nevertheless, most P in soil is adsorbed on soil particles, which complicates its uptake by plants. HS can enhance P bioavailability through a competition for adsorption sites, which results in P uptake, transport, and accumulation [48,49]. This indirect effect of HS is referred to as HA and FA applied to soil, although foliar HS can positively affect the plant P cycle [48]. However, the leonardite-SC used for this study did not enhance the P concentration in lettuce leaves at any of the doses employed. In addition, P accumulation was reduced by R2 and R4 doses compared to the control treatment (Figure 2A). These results could be due to HS physiological effects depending on different factors such as HS source and origin (lignite, peat, vermicompost, etc.), proportion of HA and FA, rate of application, plant species, etc. [22,44]. Nonetheless, our results agree with previous studies where HS application did not change or decrease P concentration, as it was found in wheat [42], lettuce [46], or tomato [50].
In addition, our data showed that HS enhanced K concentration at R3, R4, and F1 doses (Figure 3A). Like N, root K transporters can be induced by HS application, which is directly correlated with an increase in leaf K concentration. In this way, Khan et al. [51] found that the high-affinity K transporter (HKT) was enhanced in tomato seedlings treated with HA. Furthermore, an increase in foliar K was linked to the presence of this macronutrient in FA molecules [43]. This fact could explain the increases in K concentration observed in our study. These results agree with other research studies that found an increase in K after HS application in gerbera [52], pepper [53], or yarrow [43]. As mentioned above, different factors affect the physiological activity of the HS. Thus, our leonardite-SC applied by spraying at F2 dose decreased K concentration in lettuce leaves. Similarly, Suh et al. [50] also found that foliar-FA applied at 1.6 g/L decreased K concentration in tomato leaves, while lower doses (0.8 and 1.1 g/L) did not affect K.
Reducing the use of NPK fertilizers through the application of humic substances can be achieved by enhancing nutrient use efficiency [54]. For this reason, NPK use efficiency was analyzed through the estimation of different parameters such as IE, PFP, NE, RE, PE, and AE and comparing results with control plants. Overall, leonardite-SC improved NPK use efficiency parameters in most of the doses employed, especially at the R3 dose (Figure 1A–D, Figure 2A–D, and Figure 3A–D; Tables S1–S3). Apparent crop recovery efficiency of applied nutrient and nutrient export of a plant nutrient in shoot (RE and NE, respectively) indicate absorption efficiency of a nutrient by plant roots and its translocation to shoot [55,56]. Thus, our results indicate an increase in NPK uptake by lettuce plants treated with most of the HS doses, with R3 showing the highest values. These results suggest that BLACKJAK® applied at R3 could be appropriate for reducing NPK fertilizer use as well as growing plants in NPK-poor soils, which is more frequent due to climate change, although further studies are needed [54,57]. In addition, physiological efficiency and internal utilization efficiency of applied nutrients (PE and IE, respectively) are directly related to crop yield, which can be estimated from the agronomic efficiency and partial factor productivity of applied nutrients (AE and PFP, respectively) [55]. Thus, an increase in NPK utilization results in organic compound synthesis (i.e., proteins), which is correlated with enhanced agronomic efficiency in terms of plant growth [58]. In this way, application of R3 was the HS dose with the largest NPK utilization and agronomic efficiency (Figure 1A–D, Figure 2A–D, and Figure 3A–D; Tables S1–S3), which resulted in an increase in biomass production (Table 1).
Our data align with other studies where HS significantly enhanced NPK use efficiency. Thus, application of different HA formulations increased NPK use efficiency in potato [59], while Niaz et al. [60] found that HA also enhanced N PFP and AE in maize seedlings subjected to HA. Likewise, Kong et al. [61] showed that HA added to urea fertilizer reduced N loss and enhanced N use efficiency in maize and wheat. In addition, a significant increase in P use efficiency was found in maize, especially under low P conditions [62]. On the other hand, the highest doses of HS applied at both root and foliar (R4 and F4) caused a decrease in some NPK use efficiency parameters such as RE and AE, especially at R4. As previously reported, RE may be affected by some factors, such as the amount of biofertilizer applied, while AE directly depends on RE [33]. Our results showed that higher amounts of applied HS negatively affected these parameters, although it did not significantly influence biomass production.
In modern agriculture, increasing crop yields to feed the world’s growing population is the main objective. However, it is also crucial to improve the nutritional quality of crops with the associated benefits for human health [63,64]. Thus, the influence of leonardite-SC on the concentration of antioxidant compounds (such as phenols, AsA, GSH, anthocyanins, etc.) was evaluated. All HS doses applied as radicular or foliar enhanced AsA concentration, while GSH was also improved by both methods of application at doses R1, R4, F2, and F3. In addition, foliar application of HS increased total phenols, flavonoids, and anthocyanins at all doses employed, while R1 also improved total phenols and flavonoids (Table 2). Furthermore, antioxidant capacity of plant tissues can be estimated by different tests, such as FRAP and TEAC. These assays are based on the capacity of different antioxidants to reduce pro-oxidants, using as oxidants some radicals like ABTS or ions such as Fe2+ [35,65]. The application of HS to lettuce plants enhanced antioxidant capacity by both methods (root and foliar) at all doses (Figure 4A,B). The results obtained in our study in terms of antioxidant capacity are in line with those found by other authors in pepper plants [53]. In addition, HA and FA enhanced the phenolic compounds and antioxidant capacity of yarrow leaves [43], which was also reported by Zahedifar and Najafian [66]. The positive influence of HS on antioxidant quality could be attributed to the enhanced secondary metabolism, as was previously reported [67,68]. Our study revealed that the R4 dose showed the highest values of FRAP and TEAC. Therefore, although the highest dose of root-HS did not enhance biomass production and reduced some NPK use efficiency parameters, its application favoured the accumulation of beneficial bioactive compounds in lettuce leaves. In addition, finding the balance between biomass production, nutrient use efficiency, and antioxidant compound concentration would be ideal, and it was demonstrated in lettuce plants treated with R3.

5. Conclusions

In conclusion, our study provides evidence of the potential use of the leonardite-SC-based product employed in this experiment as a biostimulant to enhance lettuce biomass production, NPK use efficiency, and antioxidant capacity. Furthermore, HS application directly to a nutritive solution (radicular) offered better results than HS sprayed on leaves (foliar). Especially, radicular-HS applied at 0.60 mL/L (R3) could be the better dose to use in future studies since it offers an equilibrium between biomass production (shoot FW and DW), NPK use efficiency parameters (with subsequent reductions in NPK fertilizer use), and antioxidant quality. However, further research is still necessary to test the capacity of BLACKJAK® to improve NPK use efficiency, especially in NPK-poor soils.

Supplementary Materials

The following supporting information can be downloaded at: https://www.mdpi.com/article/10.3390/agronomy14010064/s1. Table S1: Effect of root and foliar humic substances application on N, IE, PFP, and NE; Table S2: Effect of root and foliar humic substances application on P, IE, PFP, and NE; Table S3: Effect of root and foliar humic substances application on P, IE, PFP, and NE.

Author Contributions

Conceptualization, J.M.R.; methodology, S.A.-C. and E.N.-L.; software, S.A.-C.; validation, J.M.R. and J.J.R.; formal analysis, S.A.-C. and E.N.-L.; investigation, S.A.-C.; resources, F.M. and G.M.; data curation, S.A.-C.; writing—original draft preparation, S.A.-C.; writing—review and editing, J.M.R., J.J.R., F.M. and G.M.; supervision, J.M.R. All authors have read and agreed to the published version of the manuscript.

Funding

This research was funded by the PAI program (Plan Andaluz de Investigación, Grupo de Investigación AGR282) and by a grant from the FPU of the Ministerio de Educación y Ciencia awarded to S.A.C. grant number [FPU20/05049].

Data Availability Statement

The data underlaying this article will be shared on reasonable request to the corresponding author.

Acknowledgments

We thank the Department of Soil Science and Agricultural Chemistry at the University of Granada for the CN LECO® and ICP-MS analyses.

Conflicts of Interest

Giacomo Masetti certifies that he is employed by Sofbey S.A. and hereby declares that he provided the biostimulant used in this experiment, as well as participated in writing and editing this manuscript. The remaining authors declare no conflict of interest.

References

  1. Tahery, S.; Munroe, P.; Marjo, C.E.; Rawal, A.; Horvat, J.; Mohammed, M.; Webber, J.B.W.; Arns, J.Y.; Arns, C.H.; Pan, G.; et al. A comparison between the characteristics of a biochar-NPK granule and a commercial NPK granule for application in the soil. Sci. Total Environ. 2022, 832, 155021. [Google Scholar] [CrossRef] [PubMed]
  2. Anas, M.; Liao, F.; Verma, K.K.; Sarwar, M.A.; Mahmood, A.; Chen, Z.L.; Li, Q.; Zeng, X.P.; Liu, Y.; Li, Y.R. Fate of nitrogen in agriculture and environment: Agronomic, eco-physiological and molecular approaches to improve nitrogen use efficiency. Biol. Res. 2020, 53, 47. [Google Scholar] [CrossRef] [PubMed]
  3. Wang, Y.; Chen, Y.F.; Wu, W.H. Potassium and phosphorus transport and signaling in plants. J. Integr. Plant Biol. 2021, 63, 34–52. [Google Scholar] [CrossRef] [PubMed]
  4. Abdo, A.I.; El-Sobky, E.S.E.A.; Zhang, J. Optimizing maize yields using growth stimulants under the strategy of replacing chemicals with biological fertilizers. Front. Plant Sci. 2022, 13, 1069624. [Google Scholar] [CrossRef] [PubMed]
  5. Agbede, T.M. Effect of tillage, biochar, poultry manure and NPK 15-15-15 fertilizer, and their mixture on soil properties, growth and carrot (Daucus carota L.) yield under tropical conditions. Heliyon 2021, 7, e07391. [Google Scholar] [CrossRef] [PubMed]
  6. Seleiman, M.F.; Elshayb, O.M.; Nada, A.M.; El-Leithy, S.A.; Baz, L.; Alhammad, B.A.; Mahdi, A.H.A. Azolla compost as an approach for enhancing growth, productivity and nutrient uptake of Oryza sativa L. Agronomy 2022, 12, 416. [Google Scholar] [CrossRef]
  7. Xu, D.P.; Li, Y.; Meng, X.; Zhou, T.; Zhou, Y.; Zheng, J.; Zhang, J.J.; Li, H. Bin Natural antioxidants in foods and medicinal plants: Extraction, assessment and resources. Int. J. Mol. Sci. 2017, 18, 96. [Google Scholar] [CrossRef]
  8. Michalak, M. Plant-derived antioxidants: Significance in skin health and the ageing process. Int. J. Mol. Sci. 2022, 23, 585. [Google Scholar] [CrossRef]
  9. Celi, G.E.A.; Gratão, P.L.; Lanza, M.G.D.B.; Dos Reis, A.R. Physiological and biochemical roles of ascorbic acid on mitigation of abiotic stresses in plants. Plant Physiol. Biochem. 2023, 202, 107970. [Google Scholar] [CrossRef]
  10. Ito, T.; Ohkama-Ohtsu, N. Degradation of glutathione and glutathione conjugates in plants. J. Exp. Bot. 2023, 74, 3313–3327. [Google Scholar] [CrossRef]
  11. Li, Z.; Ahammed, G.J. Hormonal regulation of anthocyanin biosynthesis for improved stress tolerance in plants. Plant Physiol. Biochem. 2023, 201, 107835. [Google Scholar] [CrossRef] [PubMed]
  12. Antonio, M.; Ortega-regules, A.E.; De Parrodi, C.A.; Lozada-Ram, D. Encapsulation of carotenoids—A review. Plants 2023, 12, 1–22. [Google Scholar]
  13. Khutami, C.; Sumiwi, S.A.; Khairul Ikram, N.K.; Muchtaridi, M. The effects of antioxidants from natural products on obesity, dyslipidemia, diabetes and their molecular signaling mechanism. Int. J. Mol. Sci. 2022, 23, 2056. [Google Scholar] [CrossRef] [PubMed]
  14. Mannino, G.; Campobenedetto, C.; Vigliante, I.; Contartese, V.; Gentile, C.; Bertea, C.M. The application of a plant biostimulant based on seaweed and yeast extract improved tomato fruit development and quality. Biomolecules 2020, 10, 1662. [Google Scholar] [CrossRef] [PubMed]
  15. Velasco, P.; Rodríguez, V.M.; Soengas, P.; Poveda, J. Trichoderma hamatum increases productivity, glucosinolate content and antioxidant potential of different leafy Brassica vegetables. Plants 2021, 10, 20449. [Google Scholar] [CrossRef] [PubMed]
  16. Cristofano, F.; El-Nakhel, C.; Pannico, A.; Giordano, M.; Colla, G.; Rouphael, Y. Foliar and root applications of vegetal-derived protein hydrolysates differentially enhance the yield and qualitative attributes of two lettuce cultivars grown in floating system. Agronomy 2021, 11, 1194. [Google Scholar] [CrossRef]
  17. Yang, F.; Tang, C.; Antonietti, M. Natural and artificial humic substances to manage minerals, ions, water, and soil microorganisms. Chem. Soc. Rev. 2021, 50, 6221–6239. [Google Scholar] [CrossRef]
  18. Ore, O.T.; Adeola, A.O.; Fapohunda, O.; Adedipe, D.T.; Bayode, A.A.; Adebiyi, F.M. Humic substances derived from unconventional resources: Extraction, properties, environmental impacts, and prospects. Environ. Sci. Pollut. Res. 2023, 30, 59106–59127. [Google Scholar] [CrossRef]
  19. Jannin, L.; Arkoun, M.; Ourry, A.; Laîné, P.; Goux, D.; Garnica, M.; Fuentes, M.; San Francisco, S.; Baigorri, R.; Cruz, F.; et al. Microarray analysis of humic acid effects on Brassica napus growth: Involvement of N, C and S metabolisms. Plant Soil 2012, 359, 297–319. [Google Scholar] [CrossRef]
  20. Hatami, E.; Shokouhian, A.A.; Ghanbari, A.R.; Naseri, L.A. Alleviating salt stress in almond rootstocks using of humic acid. Sci. Hortic. 2018, 237, 296–302. [Google Scholar] [CrossRef]
  21. Matuszak-Slamani, R.; Bejger, R.; Włodarczyk, M.; Kulpa, D.; Sienkiewicz, M.; Gołębiowska, D.; Skórska, E.; Ukalska-Jaruga, A. Effect of humic acids on soybean seedling growth under polyethylene-glycol-6000-induced drought stress. Agronomy 2022, 12, 1109. [Google Scholar] [CrossRef]
  22. Canellas, L.P.; Olivares, F.L.; Aguiar, N.O.; Jones, D.L.; Nebbioso, A.; Mazzei, P.; Piccolo, A. Humic and fulvic acids as biostimulants in horticulture. Sci. Hort. 2015, 196, 15–27. [Google Scholar] [CrossRef]
  23. Billard, V.; Etienne, P.; Jannin, L.; Garnica, M.; Cruz, F.; Garcia-Mina, J.M.; Yvin, J.C.; Ourry, A. Two biostimulants derived from algae or humic acid induce similar responses in the mineral content and gene expression of winter oilseed rape (Brassica napus L.). J. Plant Growth Regul. 2014, 33, 305–316. [Google Scholar] [CrossRef]
  24. Jindo, K.; Soares, T.S.; Peres, L.E.P.; Azevedo, I.G.; Aguiar, N.O.; Mazzei, P.; Spaccini, R.; Piccolo, A.; Olivares, F.L.; Canellas, L.P. Phosphorus speciation and high-affinity transporters are influenced by humic substances. J. Plant Nutr. Soil Sci. 2016, 179, 206–214. [Google Scholar] [CrossRef]
  25. Hernandez, O.L.; Calderín, A.; Huelva, R.; Martínez-Balmori, D.; Guridi, F.; Aguiar, N.O.; Olivares, F.L.; Canellas, L.P. Humic substances from vermicompost enhance urban lettuce production. Agron. Sustain. Dev. 2015, 35, 225–232. [Google Scholar] [CrossRef]
  26. Schiavon, M.; Pizzeghello, D.; Muscolo, A.; Vaccaro, S.; Francioso, O.; Nardi, S. High molecular size humic substances enhance phenylpropanoid metabolism in Maize (Zea mays L.). J. Chem. Ecol. 2010, 36, 662–669. [Google Scholar] [CrossRef] [PubMed]
  27. Monda, H.; McKenna, A.M.; Fountain, R.; Lamar, R.T. Bioactivity of humic acids extracted from shale ore: Molecular characterization and structure-activity relationship with tomato plant yield under nutritional stress. Front. Plant Sci. 2021, 12, 660224. [Google Scholar] [CrossRef] [PubMed]
  28. Muscolo, A.; Pizzeghello, D.; Francioso, O.; Cortes, S.S.; Nardi, S. Effectiveness of humic substances and phenolic compounds in regulating plant-biological functionality. Agronomy 2020, 10, 1553. [Google Scholar] [CrossRef]
  29. Peng, H.; Simko, I. Extending lettuce shelf life through integrated technologies. Curr. Opin. Biotechnol. 2023, 81, 102951. [Google Scholar] [CrossRef]
  30. Farooq, A.; Khattak, A.M.; Gul, G.; Habib, W.; Ahmad, S.; Asghar, M.; Rashid, T. Effect of moringa leaf extract on the performance of lettuce cultivars. Gesunde Pflanz 2023, 75, 1449–1459. [Google Scholar] [CrossRef]
  31. Paniagua-López, M.; Aguilar-Garrido, A.; Contero-Hurtado, J.; García-Romera, I.; Sierra-Aragón, M.; Romero-Freire, A. Ecotoxicological assessment of polluted soils one year after the application of different soil remediation rechniques. Toxics 2023, 11, 298. [Google Scholar] [CrossRef] [PubMed]
  32. Wolf, B. A comprehensive system of leaf analyses and its use for diagnosing crop nutrient status. Commun. Soil Sci. Plant Anal. 1982, 13, 1035–1059. [Google Scholar] [CrossRef]
  33. Dobermann, A. Nutrient use efficiency—Measurement and management. In Proceedings of the International Fertilizer Industry Association, Brussels, Belgium, 7–9 March 2007; pp. 1–22. [Google Scholar]
  34. Buturi, C.V.; Sabatino, L.; Mauro, R.P.; Navarro-León, E.; Blasco, B.; Leonardi, C.; Giuffrida, F. Iron biofortification of greenhouse soilless lettuce: An effective agronomic tool to improve the dietary mineral intake. Agronomy 2022, 12, 1793. [Google Scholar] [CrossRef]
  35. López-Moreno, F.J.; Atero-Calvo, S.; Navarro-León, E.; Blasco, B.; Soriano, T.; Ruiz, J.M. Evaluation of physiological and quality parameters of green asparagus spears subjected to three treatments against the decline syndrome. Agronomy 2021, 11, 937. [Google Scholar] [CrossRef]
  36. Rivero, R.M.; Ruiz, J.M.; García, P.C.; López-Lefebre, L.R.; Sánchez, E.; Romero, L. Resistance to cold and heat stress: Accumulation of phenolic compounds in tomato and watermelon plants. Plant Sci. 2001, 160, 315–321. [Google Scholar] [CrossRef] [PubMed]
  37. Flores, P.; Navarro, J.M.; Garrido, C.; Rubio, J.S.; Martínez, V. Influence of Ca2+, K+ and NO3 fertilisation on nutritional quality of pepper. J. Sci. Food Agric. 2004, 84, 569–574. [Google Scholar] [CrossRef]
  38. Bishopp, A.; Lynch, J.P. The hidden half of crop yields. Nat. Plants. 2015, 1, 15117. [Google Scholar] [CrossRef]
  39. Deolu-Ajayi, A.O.; van der Meer, I.M.; van der Werf, A.; Karlova, R. The power of seaweeds as plant biostimulants to boost crop production under abiotic stress. Plant Cell Environ. 2022, 45, 2537–2553. [Google Scholar] [CrossRef]
  40. du Jardin, P. Plant biostimulants: Definition, concept, main categories and regulation. Sci. Hortic. 2015, 196, 3–14. [Google Scholar] [CrossRef]
  41. Tan, W.K.; Goenadie, V.; Lee, H.W.; Liang, X.; Loh, C.S.; Ong, C.N.; Tan, H.T.W. Growth and glucosinolate profiles of a common Asian green leafy vegetable, Brassica rapa subsp. chinensis var. parachinensis (choy sum), under LED lighting. Sci. Hortic. 2020, 261, 108922. [Google Scholar] [CrossRef]
  42. Tahir, M.M.; Khurshid, M.; Khan, M.Z.; Abbasi, M.K.; Kazmi, M.H. Lignite-derived humic acid effect on growth of wheat plants in different soils. Pedosphere 2011, 21, 124–131. [Google Scholar] [CrossRef]
  43. Bayat, H.; Shafie, F.; Aminifard, M.H.; Daghighi, S. Comparative effects of humic and fulvic acids as biostimulants on growth, antioxidant activity and nutrient content of yarrow (Achillea millefolium L.). Sci. Hortic. 2021, 279, 109912. [Google Scholar] [CrossRef]
  44. Nardi, S.; Schiavon, M.; Francioso, O. Chemical structure and biological activity of humic substances define their role as plant growth promoters. Molecules 2021, 26, 2256. [Google Scholar] [CrossRef] [PubMed]
  45. Shah, Z.H.; Rehman, H.M.; Akhtar, T.; Alsamadany, H.; Hamooh, B.T.; Mujtaba, T.; Daur, I.; Al Zahrani, Y.; Alzahrani, H.A.S.; Ali, S.; et al. Humic substances: Determining potential molecular regulatory processes in plants. Front. Plant Sci. 2018, 9, 1–12. [Google Scholar] [CrossRef] [PubMed]
  46. Haghighi, M.; Kafi, M.; Fang, P. Photosynthetic activity and N metabolism of lettuce as affected by humic acid. Int. J. Veg. Sci. 2012, 18, 182–189. [Google Scholar] [CrossRef]
  47. Olaetxea, M.; Mora, V.; Bacaicoa, E.; Baigorri, R.; Garnica, M.; Fuentes, M.; Zamarreño, A.M.; Spíchal, L.; García-Mina, J.M. Root ABA and H+-ATPase are key players in the root and shoot growth-promoting action of humic acids. Plant Direct 2019, 3, e00175. [Google Scholar] [CrossRef] [PubMed]
  48. Yuan, Y.; Tang, C.; Jin, Y.; Cheng, K.; Yang, F. Contribution of exogenous humic substances to phosphorus availability in soil-plant ecosystem: A review. Crit. Rev. Environ. Sci. Technol. 2023, 53, 1085–1102. [Google Scholar] [CrossRef]
  49. Gerke, J. Review article: The effect of humic substances on phosphate and iron acquisition by higher plants: Qualitative and quantitative aspects. J. Plant Nutr. Soil Sci. 2021, 184, 329–338. [Google Scholar] [CrossRef]
  50. Suh, H.Y.; Yoo, K.S.; Suh, S.G. Effect of foliar application of fulvic acid on plant growth and fruit quality of tomato (Lycopersicon esculentum L.). Hortic. Environ. Biotechnol. 2014, 55, 455–461. [Google Scholar] [CrossRef]
  51. Khan, M.A.; Asaf, S.; Khan, A.L.; Jan, R.; Kang, S.M.; Kim, K.M.; Lee, I.J. Extending thermotolerance to tomato seedlings by inoculation with SA1 isolate of Bacillus cereus and comparison with exogenous humic acid application. PLoS ONE 2020, 15, e0232228. [Google Scholar] [CrossRef]
  52. Yazdani, B.; Nikbakht, A.; Etemadi, N. Physiological effects of different combinations of humic and fulvic acid on Gerbera. Commun. Soil Sci. Plant Anal. 2014, 45, 1357–1368. [Google Scholar] [CrossRef]
  53. Akladious, S.A.; Mohamed, H.I. Ameliorative effects of calcium nitrate and humic acid on the growth, yield component and biochemical attribute of pepper (Capsicum annuum L.) plants grown under salt stress. Sci. Hortic. 2018, 236, 244–250. [Google Scholar] [CrossRef]
  54. Leite, J.M.; Pitumpe Arachchige, P.S.; Ciampitti, I.A.; Hettiarachchi, G.M.; Maurmann, L.; Trivelin, P.C.O.; Prasad, P.V.V.; Sunoj, S.V.J. Co-addition of humic substances and humic acids with urea enhances foliar nitrogen use efficiency in sugarcane (Saccharum officinarum L.). Heliyon 2020, 6, e05100. [Google Scholar] [CrossRef]
  55. Congreves, K.A.; Otchere, O.; Ferland, D.; Farzadfar, S.; Williams, S.; Arcand, M.M. Nitrogen use efficiency definitions of today and tomorrow. Front. Plant Sci. 2021, 12, 637108. [Google Scholar] [CrossRef] [PubMed]
  56. The, S.V.; Snyder, R.; Tegeder, M. Targeting nitrogen metabolism and transport processes to improve plant nitrogen use efficiency. Front. Plant Sci. 2021, 11, 628366. [Google Scholar] [CrossRef] [PubMed]
  57. Tshewang, S.; Rengel, Z.; Siddique, K.H.M.; Solaiman, Z.M. Microbial consortium inoculant increases pasture grasses yield in low-phosphorus soil by influencing root morphology, rhizosphere carboxylate exudation and mycorrhizal colonisation. J. Sci. Food Agric. 2022, 102, 540–549. [Google Scholar] [CrossRef] [PubMed]
  58. Farzadfar, S.; Knight, J.D.; Congreves, K.A. Soil organic nitrogen: An overlooked but potentially significant contribution to crop nutrition. Plant Soil 2021, 462, 7–23. [Google Scholar] [CrossRef] [PubMed]
  59. Selladurai, R.; Jyoti Purakayastha, T. Effect of humic acid multinutrient fertilizers on yield and nutrient use efficiency of potato. J. Plant. Nutr. 2016, 39, 949–956. [Google Scholar] [CrossRef]
  60. Niaz, A.; Yaseen, M.; Shakar, M.; Sultana, S.; Ehsan, M.; Nazarat, A. Maize production and nitrogen use efficiency in response to nitrogen application with and without humic acid. J. Anim. Plant Sci. 2016, 26, 1641–1651. [Google Scholar]
  61. Kong, B.; Wu, Q.; Li, Y.; Zhu, T.; Ming, Y.; Li, C.; Li, C.; Wang, F.; Jiao, S.; Shi, L.; et al. The application of humic acid urea improves nitrogen use efficiency and crop yield by reducing the nitrogen loss compared with urea. Agriculture 2022, 12, 1996. [Google Scholar] [CrossRef]
  62. Santoro, V.; Della Lucia, M.C.; Francioso, O.; Stevanato, P.; Bertoldo, G.; Borella, M.; Ferrari, E.; Zaccone, C.; Schiavon, M.; Pizzeghello, D.; et al. Phosphorus acquisition efficiency and transcriptomic changes in maize plants treated with two lignohumates. Plants 2023, 12, 3291. [Google Scholar] [CrossRef] [PubMed]
  63. Scharff, L.B.; Saltenis, V.L.R.; Jensen, P.E.; Baekelandt, A.; Burgess, A.J.; Burow, M.; Ceriotti, A.; Cohan, J.P.; Geu-Flores, F.; Halkier, B.A.; et al. Prospects to improve the nutritional quality of crops. Food Energy Secur. 2022, 11, e327. [Google Scholar] [CrossRef]
  64. Soares, J.C.; Santos, C.S.; Carvalho, S.M.P.; Pintado, M.M.; Vasconcelos, M.W. Preserving the nutritional quality of crop plants under a changing climate: Importance and strategies. Plant Soil 2019, 443, 1–26. [Google Scholar] [CrossRef]
  65. Noperi-Mosqueda, L.C.; López-Moreno, F.J.; Navarro-León, E.; Sánchez, E.; Blasco, B.; Moreno, D.A.; Soriano, T.; Ruiz, J.M. Effects of asparagus decline on nutrients and phenolic compounds, spear quality, and allelopathy. Sci. Hortic. 2020, 261, 109029. [Google Scholar] [CrossRef]
  66. Zahedifar, M.; Najafian, S. Evaluation of essential oil composition and antioxidant activity of yarrow as influenced by foliar application of humic substance-based products: Using multivariate exploratory method. Sci. Hortic. 2023, 308, 111557. [Google Scholar] [CrossRef]
  67. Savarese, C.; Cozzolino, V.; Verrillo, M.; Vinci, G.; De Martino, A.; Scopa, A.; Piccolo, A. Combination of humic biostimulants with a microbial inoculum improves lettuce productivity, nutrient uptake, and primary and secondary metabolism. Plant Soil 2022, 481, 285–314. [Google Scholar] [CrossRef]
  68. Conselvan, G.B.; Pizzeghello, D.; Francioso, O.; Di Foggia, M.; Nardi, S.; Carletti, P. Biostimulant activity of humic substances extracted from leonardites. Plant Soil 2017, 420, 119–134. [Google Scholar] [CrossRef]
Figure 1. Effect of root and foliar humic substance application on nitrogen use efficiency parameters. (A) Heat map showing N concentration, IE, PFP, and NE These parameters are expressed as: mg g1 DW (N), g g1 (IE), g g1 (PFP), and mg (NE). The color scale refers to the logarithmic transformation (log10) of measured values (higher values are shown in red, lower values in blue, and intermediate values in white), and it is compared to the control treatment. For the interpretation of the color code, refer to Supplementary Table S1. (B) RE, (C) PE, and (D) AE. Parameter values are expressed in relation to the control treatment. Values are expressed as means ± standard error (n = 6). Columns marked with the same letters were not significantly different based on the LSD test (p < 0.05). Abbreviations: N: nitrogen; IE: internal utilization efficiency of a nutrient; PFP: partial factor productivity of applied nutrient; NE: nutrient export of applied nutrient in shoot; RE: apparent crop recovery efficiency of applied nutrient; PE: physiological efficiency of applied nutrient; AE: agronomic efficiency of applied nutrient. R1 (0.20 mL/L), R2 (0.40 mL/L), R3 (0.60 mL/L), R4 (0.80 mL/L), F1 (5.00 mL/L), F2 (7.50 mL/L), F3 (10.00 mL/L), and F4 (12.50 mL/L).
Agronomy 14 00064 g001
Figure 2. Effect of root and foliar humic substance application on phosphorus use efficiency parameters. (A) Heat map showing P concentration, IE, PFP, and NE. These parameters are expressed as: mg g1 DW (P), g g1 (IE), g g1 (PFP), and mg (NE). Color scale refers to the logarithmic transformation (log10) of measured values (higher values are shown in red, lower values in blue, and intermediate values in white colors), and it is compared to the control treatment. For the interpretation of the color code, refer to Supplementary Table S2. (B) RE, (C) PE, and (D) AE. Parameter values are expressed in relation to the control treatment. Values are expressed as means ± standard error (n = 6). Columns marked with the same letters were not significantly different based on the LSD test (p < 0.05). Abbreviations: P: phosphorus; IE: internal utilization efficiency of a nutrient; PFP: partial factor productivity of applied nutrient; NE: nutrient export of applied nutrient in shoot; RE: apparent crop recovery efficiency of applied nutrient; PE: physiological efficiency of applied nutrient; AE: agronomic efficiency of applied nutrient. R1 (0.20 mL/L), R2 (0.40 mL/L), R3 (0.60 mL/L), R4 (0.80 mL/L), F1 (5.00 mL/L), F2 (7.50 mL/L), F3 (10.00 mL/L), and F4 (12.50 mL/L).
Agronomy 14 00064 g002
Figure 3. Effect of root and foliar humic substance application on potassium use efficiency parameters. (A) Heat map showing K concentration, IE, PFP, and NE. These parameters are expressed as: mg g1 DW (K), g g1 (IE), g g1 (PFP), and mg (NE). The color scale refers to the logarithmic transformation (log10) of measured values (higher values are shown in red, lower values in blue, and intermediate values in white), and it is compared to the control treatment. For the interpretation of the color code, refer to Supplementary Table S3. (B) RE, (C) PE, and (D) AE. Parameter values are expressed in relation to the control treatment. Values are expressed as means ± standard error (n = 6). Columns marked with the same letters were not significantly different based on the LSD test (p < 0.05). Abbreviations: K: potassium; IE: internal utilization efficiency of a nutrient; PFP: partial factor productivity of applied nutrient; NE: nutrient export of applied nutrient in shoot; RE: apparent crop recovery efficiency of applied nutrient; PE: physiological efficiency of applied nutrient; AE: agronomic efficiency of applied nutrient. R1 (0.20 mL/L), R2 (0.40 mL/L), R3 (0.60 mL/L), R4 (0.80 mL/L), F1 (5.00 mL/L), F2 (7.50 mL/L), F3 (10.00 mL/L), and F4 (12.50 mL/L).
Agronomy 14 00064 g003
Figure 4. Effect of root and foliar HS application on (A) FRAP (Ferric Reducing Antioxidant Power) and (B) TEAC (Trolox Equivalent Antioxidant Capacity) assays. Values are expressed as means ± standard error (n = 9). Columns marked with the same letters were not significantly different based on the LSD test (p < 0.05). R1 (0.20 mL/L), R2 (0.40 mL/L), R3 (0.60 mL/L), R4 (0.80 mL/L), F1 (5.00 mL/L), F2 (7.50 mL/L), F3 (10.00 mL/L), and F4 (12.50 mL/L).
Agronomy 14 00064 g004
Table 1. Effect of root and foliar humic substance application on shoot fresh weight, shoot dry weight, and foliar area.
Shoot FW
(g−1 plant)
Leaf Area
(cm2)
Shoot DW
(g−1 plant)
Control49.65 ± 1.30 c479.38 ± 13.67 b2.23 ± 0.22 bcd
R157.35 ± 2.76 a529.96 ± 15.81 a2.16 ± 0.14 bcd
R258.14 ± 2.07 a526.89 ± 13.41 a2.65 ± 0.01 bc
R361.17 ± 1.90 a532.05 ± 12.38 a3.95 ± 0.48 a
R445.90 ± 2.19 c477.38 ± 12.15 b1.99 ± 0.15 d
F150.83 ± 1.80 bc483.72 ± 9.49 b 2.78 ± 0.04 b
F256.07 ± 0.66 ab528.17 ± 13.08 a2.55 ± 0.12 bcd
F355.91 ± 2.39 ab528.90 ± 14.17 a2.72 ± 0.22 bc
F448.36 ± 1.35 c498.98 ± 9.72 ab2.12 ± 0.11 cd
p-value*******
LSD0.055.4337.650.63
R1 (0.20 mL/L), R2 (0.40 mL/L), R3 (0.60 mL/L), R4 (0.80 mL/L), F1 (5.00 mL/L), F2 (7.50 mL/L), F3 (10.00 mL/L), and F4 (12.50 mL/L). Values are means ± standard deviation (n = 8). The levels of significance were represented as * (p < 0.05), and *** (p < 0.001). Values with different letters indicate significant differences.
Table 2. Effect of root and foliar humic substance application on total AsA, total GSH, flavonoids, total phenols, lycopene, β-carotene, and anthocyanins.
Total AsA
(µg gFW−1)
Total GSH
(µg gFW−1)
Flavonoids
(µg gFW−1)
Total Phenols
(µg gFW−1)
Lycopene
(µg gFW−1)
β-Carotene
(µg gFW−1)
Anthocyanins
(mg gFW−1)
Control8.51 ± 0.23 d69.33 ± 1.31 d353.85 ± 5.57 e693.18 ± 7.84 f1.37 ± 0.01 cd1.24 ± 0.05 cd1.67 ± 0.03 de
R116.83 ± 2.40 bc105.29 ± 3.73 a709.11 ± 8.30 c855.09 ± 4.94 c1.63 ± 0.01 a0.47 ± 0.03 f1.55 ± 0.05 e
R215.96 ± 1.80 bc67.45 ± 1.63 d260.31 ± 9.86 g599.98 ± 1.70 g1.46 ± 0.02 b0.94 ± 0.08 e1.70 ± 0.06 d
R315.36 ± 0.54 c73.04 ± 4.57 cd299.46 ± 20.07 f613.26 ± 4.25 g1.59 ± 0.03 a1.46 ± 0.17 bc1.63 ± 0.06 de
R419.75 ± 1.34 ab115.03 ± 3.44 a398.52 ± 7.75 d716.58 ± 4.51 ef1.44 ± 0.02 bc1.24 ± 0.02 cd1.56 ± 0.03 de
F116.14 ± 0.45 bc64.54 ± 2.76 d705.83 ± 10.10 c750.33 ± 1.90 de1.38 ± 0.03 cd1.70 ± 0.09 a1.92 ± 0.07 c
F221.25 ± 1.08 a84.33 ± 9.12 bc731.88 ± 14.15 bc759.60 ± 4.17 d1.36 ± 0.02 d1.37 ± 0.04 bcd2.33 ± 0.03 a
F323.24 ± 0.96 a86.05 ± 3.69 b761.15 ± 6.94 b1084.48 ± 39.50 a1.36 ± 0.03 d1.51 ± 0.08 ab2.24 ± 0.06 ab
F415.29 ± 1.97 c68.59 ± 4.24 d818.65 ± 19.25 a997.24 ± 8.24 b1.33 ± 0.02 d1.16 ± 0.03 de2.12 ± 0.05 b
p-value*********************
LSD0.053.9112.3734.9239.610.070.230.14
R1 (0.20 mL/L), R2 (0.40 mL/L), R3 (0.60 mL/L), R4 (0.80 mL/L), F1 (5.00 mL/L), F2 (7.50 mL/L), F3 (10.00 mL/L), and F4 (12.50 mL/L). Values are means ± standard deviation (n = 9). The levels of significance were represented as *** (p < 0.001). Values with different letters indicate significant differences.
Disclaimer/Publisher’s Note: The statements, opinions and data contained in all publications are solely those of the individual author(s) and contributor(s) and not of MDPI and/or the editor(s). MDPI and/or the editor(s) disclaim responsibility for any injury to people or property resulting from any ideas, methods, instructions or products referred to in the content.

