Article

Evaluation of Biochar and Inorganic Fertilizer on Soil Available Phosphorus and Bacterial Community Dynamics in Acidic Paddy Soils for Different Incubation Temperatures

1
Institute of Agriculture and Life Sciences, Gyeongsang National University, Jinju 660-701, Republic of Korea
2
Fujian Provincial Key Laboratory of Soil Environmental Health and Regulation, College of Resources and Environment, Fujian Agriculture and Forestry University, Fuzhou 350002, China
3
Department of Soil Science, Faculty of Agricultural Sciences, University of the Punjab, Lahore 54590, Pakistan
4
Institute of Marine Sciences and Guangdong Provincial Key Laboratory of Marine Biotechnology, Shantou University, Shantou 515063, China
5
Institute of Environmental Microbiology, College of Resources and Environment, Fujian Agriculture and Forestry University, Fuzhou 350002, China
6
Division of Applied Life Science (BK 21+ Program), Gyeongsang National University, Jinju 660-701, Republic of Korea
*
Authors to whom correspondence should be addressed.
Agronomy 2024, 14(1), 26; https://doi.org/10.3390/agronomy14010026
Submission received: 1 December 2023 / Revised: 18 December 2023 / Accepted: 20 December 2023 / Published: 21 December 2023

Abstract

:
The composition of microbial communities and the functioning of ecosystems are greatly influenced by the nutrient inputs. Despite this fact, our knowledge regarding the impact of phosphorus (P) inputs on soil P availability and microbial community structures in subtropical acidic soils remains limited. We hypothesized that diverse P inputs, incubation temperatures, and soil types could significantly alter soil P availability and microbial communities. To address this gap, we conducted a laboratory incubation experiment, investigating the effects of biochar and inorganic P amendments on soil available P, soil pH, acid phosphatase enzymes, and bacterial abundance. We employed two different incubation temperatures (15 °C and 25 °C) using acidic paddy soil and red soil from the subtropical Southern China region. Our results indicate a notable increase in soil pH, reaching 37% and 39% at 15 °C and 40% and 40.6% at 25 °C, respectively, following the application of biochar and inorganic P amendments in paddy soil. In the case of red soil, we observed pH increases of 41% and 43% at 15 °C and 44% and 45% at 25 °C after the application of biochar and inorganic P amendment, respectively. The addition of inorganic P amendment resulted in the highest available P contents in paddy soil, reaching 111.47 mg/kg at 15 °C and 100.17 mg/kg at 25 °C, respectively. However, Proteobacteria decreased after inorganic P addition, which showed that P might not be the only limiting nutrient for various bacterial communities. Bacterial diversity and richness indices were found to be higher after biochar application in both soils. Gemmatimonadetes, Acidobacteria, and Actinobacteria were found to be strongly influenced by incubation temperatures, whereas most of the top abundant bacterial phyla, such as Gemmatimonadetes, Actinobacteria, Chloroflexi, Acidobacteria, Planctomycetes, Firmicutes, Patescibacteria, and Bacteroidetes, were highly dependent on soil type. At the genus level, various important P solubilizing genera (Pseudomonas, Bradyrhizobium, Streptomyces jietaisiensis, Massilia) significantly increased after biochar and inorganic P addition in both soils. The correlation analysis proved that P-solubilizing genera were significantly associated with changes in soil pH, as well as soil available P after biochar and inorganic P addition. Conclusively, in a short-term incubation experiment, inorganic P amendment greatly increased the soil pH and available phosphorus contents compared to biochar and control treatments; however, the microbial community was observed to be strongly associated with biochar application, soil type, and incubation temperature.

1. Introduction

Soil microbes significantly contribute to improving soil structure, soil aggregates, the recycling of soil nutrients, and soil water characteristics [1]. In soil, bacteria have one of the largest populations and biomasses among soil organisms, ranging from 100 to 300 million per gram of soil [2]. Soil bacteria are described as a pocket full of enzymes and fertilizers, as they can multiply rapidly with optimal water and nutrient availability and even with starvation conditions or water scarcity [3]. Soil bacteria play a crucial role in driving soil processes and are highly sensitive to ongoing climatic changes [4].
Several environmental factors like soil pH, temperature, soil type, and nutrient availability have been reported to significantly affect the soil microbial communities [5,6]. The temperature directly impacts soil microbial activity, and variations in the availability of soil nutrients, such as phosphorus (P), have been documented. Nevertheless, diverse opinions exist regarding the influence of soil temperature on the structure of microbial communities. While some studies suggest an increase in soil microbial biomass with rising temperatures, others have reported a decrease in microbial biomass [7,8] or noted that certain communities remain relatively unaffected by temperature variations [9]. Changes in temperature and nutrient status are linked to shifts in soil microbial community compositions [10]. Notably, it has been reported that a temperature increase of approximately 2 °C does not significantly impact soil bacterial communities under controlled conditions [11]. Consequently, the effects of temperature changes on soil microbial communities are still not fully understood, emphasizing the need for further research to gain a comprehensive understanding of the influence of temperature on these communities.
Phosphorus (P) inputs are essential for plant growth and soil fertility [3]. Due to high temperatures and precipitation, soils in the subtropical areas of Southern China have lost much of the available P [12,13]. Therefore, continuous anthropogenic P additions are crucial to increase primary production and improve the soil’s nutritional status [14]. Several studies have reported the effect of P sources as organic amendments (biochar, manure, compost) and inorganic fertilizer (urea, DAP, SSP) and their integrated application into soil to increase soil nutrition. Notably, there is a dearth of studies examining the response of soil bacterial communities to inorganic amendments, such as DAP (di-ammonium phosphate), at different incubation temperatures and soil types.
To the best of our knowledge, there are no studies investigating the response of soil bacterial communities to inorganic amendments such as DAP (di-ammonium phosphate) at different incubation temperatures and soil types. Only a few studies have compared the effects of biochar and inorganic P fertilizer on soil microbes and soil P availability at various temperatures in P-limited conditions. Therefore, it becomes vital to explore the factors regulating soil microbial communities involved in P transformation processes in P-limiting soils using different temperatures.
Moreover, we hypothesize that the response of soil bacterial communities to phosphorus amendments will exhibit significant variability across different soil types. The distinct characteristics of each soil type, such as soil pH, P contents and microbial ecology, are expected to influence the way in which microbial communities interact with and respond to P additions. Hence, this study addresses the current gap in the literature, providing a foundation for understanding the nuanced relationships between soil types and microbial responses to phosphorus amendments, thereby contributing valuable insights for sustainable agricultural practices.
Keeping in mind the above discussion, this study was conducted to examine the effects of biochar and DAP on soil bacterial communities, diversity, and community compositions at different incubation temperatures, i.e., 15 °C and 25 °C. The objectives of this study were as follows; (i) to examine the effects of biochar and inorganic P amendment on soil pH; (ii) to determine the effect of biochar and inorganic P amendment on soil available P and enzyme activity; (iii) to evaluate the responses of bacterial communities to biochar and inorganic P amendment; (iv) to clarify the influence of temperature changes on soil bacterial communities; and (v) to investigate the influence of soil type on the soil bacterial communities. We assumed that temperature changes and soil type would significantly influence the bacterial community, soil pH, and P availability.

2. Materials and Methods

2.1. Site Descriptions and Soil Sampling

Two kinds of acidic soils, i.e., red soil and paddy soil, were used in this experiment. The soils were taken from Minhou County (26.2039° N, 119.0771° E) in Fujian Province, China. The average annual minimum and maximum temperatures in this county are 10.9 and 28.9 °C, while the average annual precipitation is 1600 millimetres. Red soil was collected from the surface (0–20 cm) of a mountain site, and the collection altitude was 271 m above sea level. Paddy soil was collected from the tillage layer (0–20 cm) of a farmland. After collection, the soil samples were air-dried, crushed with mortar and pestle, and passed through a square-mesh sieve of 2 mm. The basic properties of both soils are given below (Table 1):

2.2. Biochar Production and Characterization

Tremella fuciformis spent mushroom substrate for biochar generation was collected from firms located in Gutian County (Fujian). After collection, the feedstock was air-dried and placed in a stainless container under limited oxygen conditions and pyrolyzed in a sealed furnace at 700 °C for three hours. Once the process of pyrolysis was finished, we left the biochar samples to cool down to room temperature inside the pyrolysis unit. Biochar was then examined for various basic physicochemical properties, including pH, nitrogen (N), carbon (C), potassium (K), and total P. The pH of biochar (1:20; biochar:water) was determined using the standard method proposed by McLean (1982) [15] through a portable pH meter using a portable pH meter (INESA Scientific Instrument Co., Ltd., Shanghai, China) [14]. Total N and C percentage were measured using an elemental analyzer (LECO Corporation, St. Joseph, MI, USA). Total P (TP) was determined using the molybdenum blue method against the absorbance wavelength of 880 nm via a spectrophotometer (BioTek, Epoch2, Winooski, VT, USA) and total K was determined using a flame photometer (FP640; AOPU Analytical Instruments, Shanghai, China). The various biochar properties measured were as follows: pH = 9.61, total K = 2.11%, total N = 2.3%, total C = 68.7%, and total P = 2.46%.

2.3. Incubation Experiment

In an incubation experiment, the impacts of biochar and inorganic phosphorus (P) on two types of soils, namely paddy soil and red soil, were investigated. The application involved incorporating 2% (w/w) biochar and applying diammonium phosphate (DAP) at a rate of 62 kg per hectare to 200-g soil samples, resulting in the addition of 4 g of biochar and 1.24 g of DAP to the respective soil types. Each treatment involved mixing the specified soil type with the assigned treatment, and the resulting mixture was placed into glass cups. To maintain a constant sample weight, approximately 40% moisture was retained in glass beakers containing the soil samples, and the moisture levels were periodically monitored. Three replicates of various treatments were taken and incubated in the laboratory at different incubation temperatures (15 °C and 25 °C) for 60 days. Sampling was conducted every ten days throughout the incubation period. During each sampling event, soil replicates were removed from the incubator, air-dried, and assessed for soil pH, available P, and phosphatase enzyme activity. Samples used for enzyme activity determination were preserved at 4 °C. Microbial community analysis was conducted once at 60 days after the completion of the incubation experiment. Samples used for microbial community determination were stored at −80 °C for subsequent DNA extraction.

Treatments

The nomenclature for the treatments was established according to the soil type, incubation temperature, and specific amendments applied during the experiment. High-phosphorus paddy soil was represented by ‘H’, low-phosphorus red soil was represented by ‘L’, a 15 °C incubation temperature was denoted as ‘15’, a 25 °C incubation temperature was denoted as ‘25’, biochar was denoted as ‘B’, and diammonium phosphate (DAP) was denoted as ‘P’. Control treatments in both soil types were labeled as ‘C’. Consequently, based on the soil type, temperatures, and amendments applied, the treatments were named as follows: HC15, HB15, HP15, HC25, HB25, and HP25 for paddy soil and LC15, LB15, LP15, LC25, LB25, and LP25 for red soil.

2.4. Determination of Soil pH, Available P, and Phosphatase Enzyme Activity

A common portable laboratory pH meter was used to measure the soil pH according to the recommended protocol (soil: water: 1:2.5). An aliquot of each soil sample solution was used to calculate the amount of P present in the soil. The supernatant was then extracted and filtered through Whatman filter paper, before being appropriately diluted and subjected to P analysis using the molybdenum blue-ascorbic acid reagent and 2,4-dinitrophenol indicator solution against various standards. Using a spectrophotometer with a 420 nm wavelength, the P concentration was determined. The modified Tabatabai and Bremner (1969) [16] method was used to evaluate the soil phosphatase enzyme activity [17]. Next, 0.1 g of fresh soil was weighed into a 50 mL conical flask, which was then filled with a solution of toluene, modified universal buffer (pH 6.5), and p-nitrophenyl phosphate (PNP). The flask was briefly shaken, before being incubated for an hour at 37 °C. Sodium hydroxide and calcium chloride were added to the mixture after incubation. Whatman filter paper no. I was then used to filter the soil suspension. Using a spectrophotometer, the optical density of the soil filtrates was measured against a wavelength of 400 nm. The phosphatase enzyme activity, in terms of the concentration of each soil sample, was assessed using a standard curve of PNP in water, expressed as µg pNitrophenol.g−1 dry soil·hour−1.

2.5. Illumina MiSeq Sequencing

The DNA extraction of 500 mg of soil samples was conducted using a MoBio Power Soil DNA Isolation Kit following the standard guidelines provided by the manufacturers (Mo Bio Labs, Carlsbad, CA, USA). Using forward primer 520F (GCACCTAAYTGGGYDTAAAGNG) and backward primer 802R (TACNVGGGTATCTAATCC) to target the V4 region, the bacterial 16S rRNA genes were amplified. PCR was carried out by utilizing high-fidelity Trash Start Fastpfu DNA Polymerase and distinctive primers with barcodes (Trans Gen Biotech, Beijing, China). For the bacterial 16S rRNA gene, the PCR thermal cycle profile was as follows: 2 min at 98 °C; repeating 25 cycles of 15 s at 98 °C, 30 s at 55 °C, and 30s at 72 °C; and then extended for 5 min. at 72 °C, after which the samples were stored at 10 °C. Shanghai Personal Biotechnology Co., Ltd. prepared the next-generation sequencing libraries and the Illumina MiSeq sequencing (Shanghai, China).

2.6. High-Throughput Sequencing Data Processing

Using the paired-end Illumina Miseq technique and an index read of six cycles, the amplicons were sequenced. The pipelines of Mothur (v.1.31.2) and QIIME were used to process and analyze the raw data produced using the high-throughput sequencing run (V1.7.0). The sequence reads were reduced such that each read had an average Phred quality score of greater than 20. These reads were then assembled using Flash software (v.1.2.7) after trimming, and any reads that failed to assemble were eliminated. Using UCHIME, chimaera sequences were located and eliminated (V.4.2). The samples’ distinctive 7 bp barcodes were then used to assign high-quality sequences to each one of them. The samples were clustered into operational taxonomic groups using the UCLUST algorithm after clustering the sequences with a similarity criterion of 97%, after which point the samples were clustered into operational taxonomic units (OTUs). The Ribosomal Database Project (RDP) classifier and the SILVA databases were used to determine the taxonomic identities of the representative sequences of the bacterial OTUs. By comparing the number of sequences allocated to a certain taxon with the total number of sequences acquired for that sample, the relative abundance (%) of each taxon within each community was calculated. The summary single command of the MOTHUR program was used to analyze the alpha diversity using the Simpson, Chao1, and Shannon indices. The species abundance matrix and sample grouping data were used as the foundation for PLS-DA.

2.7. Statistical Analysis

The results were submitted as the means ± standard errors (SE) of three replicates. One-way variance comparison (ANOVA) and Duncan’s multiple comparisons were employed to determine the differences between the various treatments at different incubation intervals. Overall, significant treatments were sorted out using MANOVA for soil pH, available P, and acid phosphatase enzyme at different incubation temperatures and time intervals. Statistical analyses were carried out using the SPSS software version 20.0. A difference at the p < 0.05 level was considered to be statistically significant. The final values of the different treatments were used to investigate the correlation between the different treatments and the microbial communities in the soil. Group analyses of microbial properties on a temperature basis were carried out using STAMP (version 2.1.3).

3. Results

3.1. Variations in the Soil pH, Available P Concentration, and Acid Phosphatase Activity

The incubation temperatures of 15 °C and 25 °C resulted in significant enhancements in soil pH in both biochar and inorganic P-amended paddy and red soil in comparison to the control (no amendment) for all incubation days. The soil pH values observed at a 25 °C incubation temperature surpassed the values under 15 °C for both biochar and inorganic P-amended paddy and red soils, with the highest soil pH value for inorganic P amendment after 60DOI (days of incubation) (Table S1). After 60DOI, the soil pH increased by 36% and 34.5% in the inorganic P-amended and biochar-amended paddy soil, respectively, compared to the control at 15 °C. Similarly, increases of 37.6% and 37% in pH were observed in the P-amended and biochar-amended red soil at 25 °C (Table S1).
Similarly, the soil available P concentration was significantly increased in biochar and inorganic P-amended applications compared to paddy and red soils with respect to the control after 60DOI. The highest soil available P concentration was observed in treatment HP15 (111.47 mgkg−1), followed by HP25 (100.17 mgkg−1), after 60DOI in paddy soil. A similar trend was observed in red soil, where LP15 (103.47 mgkg−1) produced the highest soil available P concentration, followed by LP25 (92.17 mgkg−1), at 25 °C after 60DOI (Table S2). Acid phosphatase activity was significantly enhanced in HC25 treatment with respect to all other treatments except the control for all incubation times except 10DOI in both soils (Table S3). The results of MANOVA showed the significant (p < 0.05) individual effects of treatments (biochar and inorganic P amendments) and days of incubation (DOI) on soil pH and available P concentration, whereas acid phosphatase activity was only significantly affected by the treatments (Table 2). The interaction effects of the days of incubation and time (DOI×T) on soil pH and available P, both in red and paddy soil, were significant, whereas the interaction between the days of incubation and treatments (DOI × Trt), as well as the days of incubation, treatments, and time (DOI×Trt×T), showed significance for available P in both soils and for phosphatase activity in paddy soil only (Table 2).

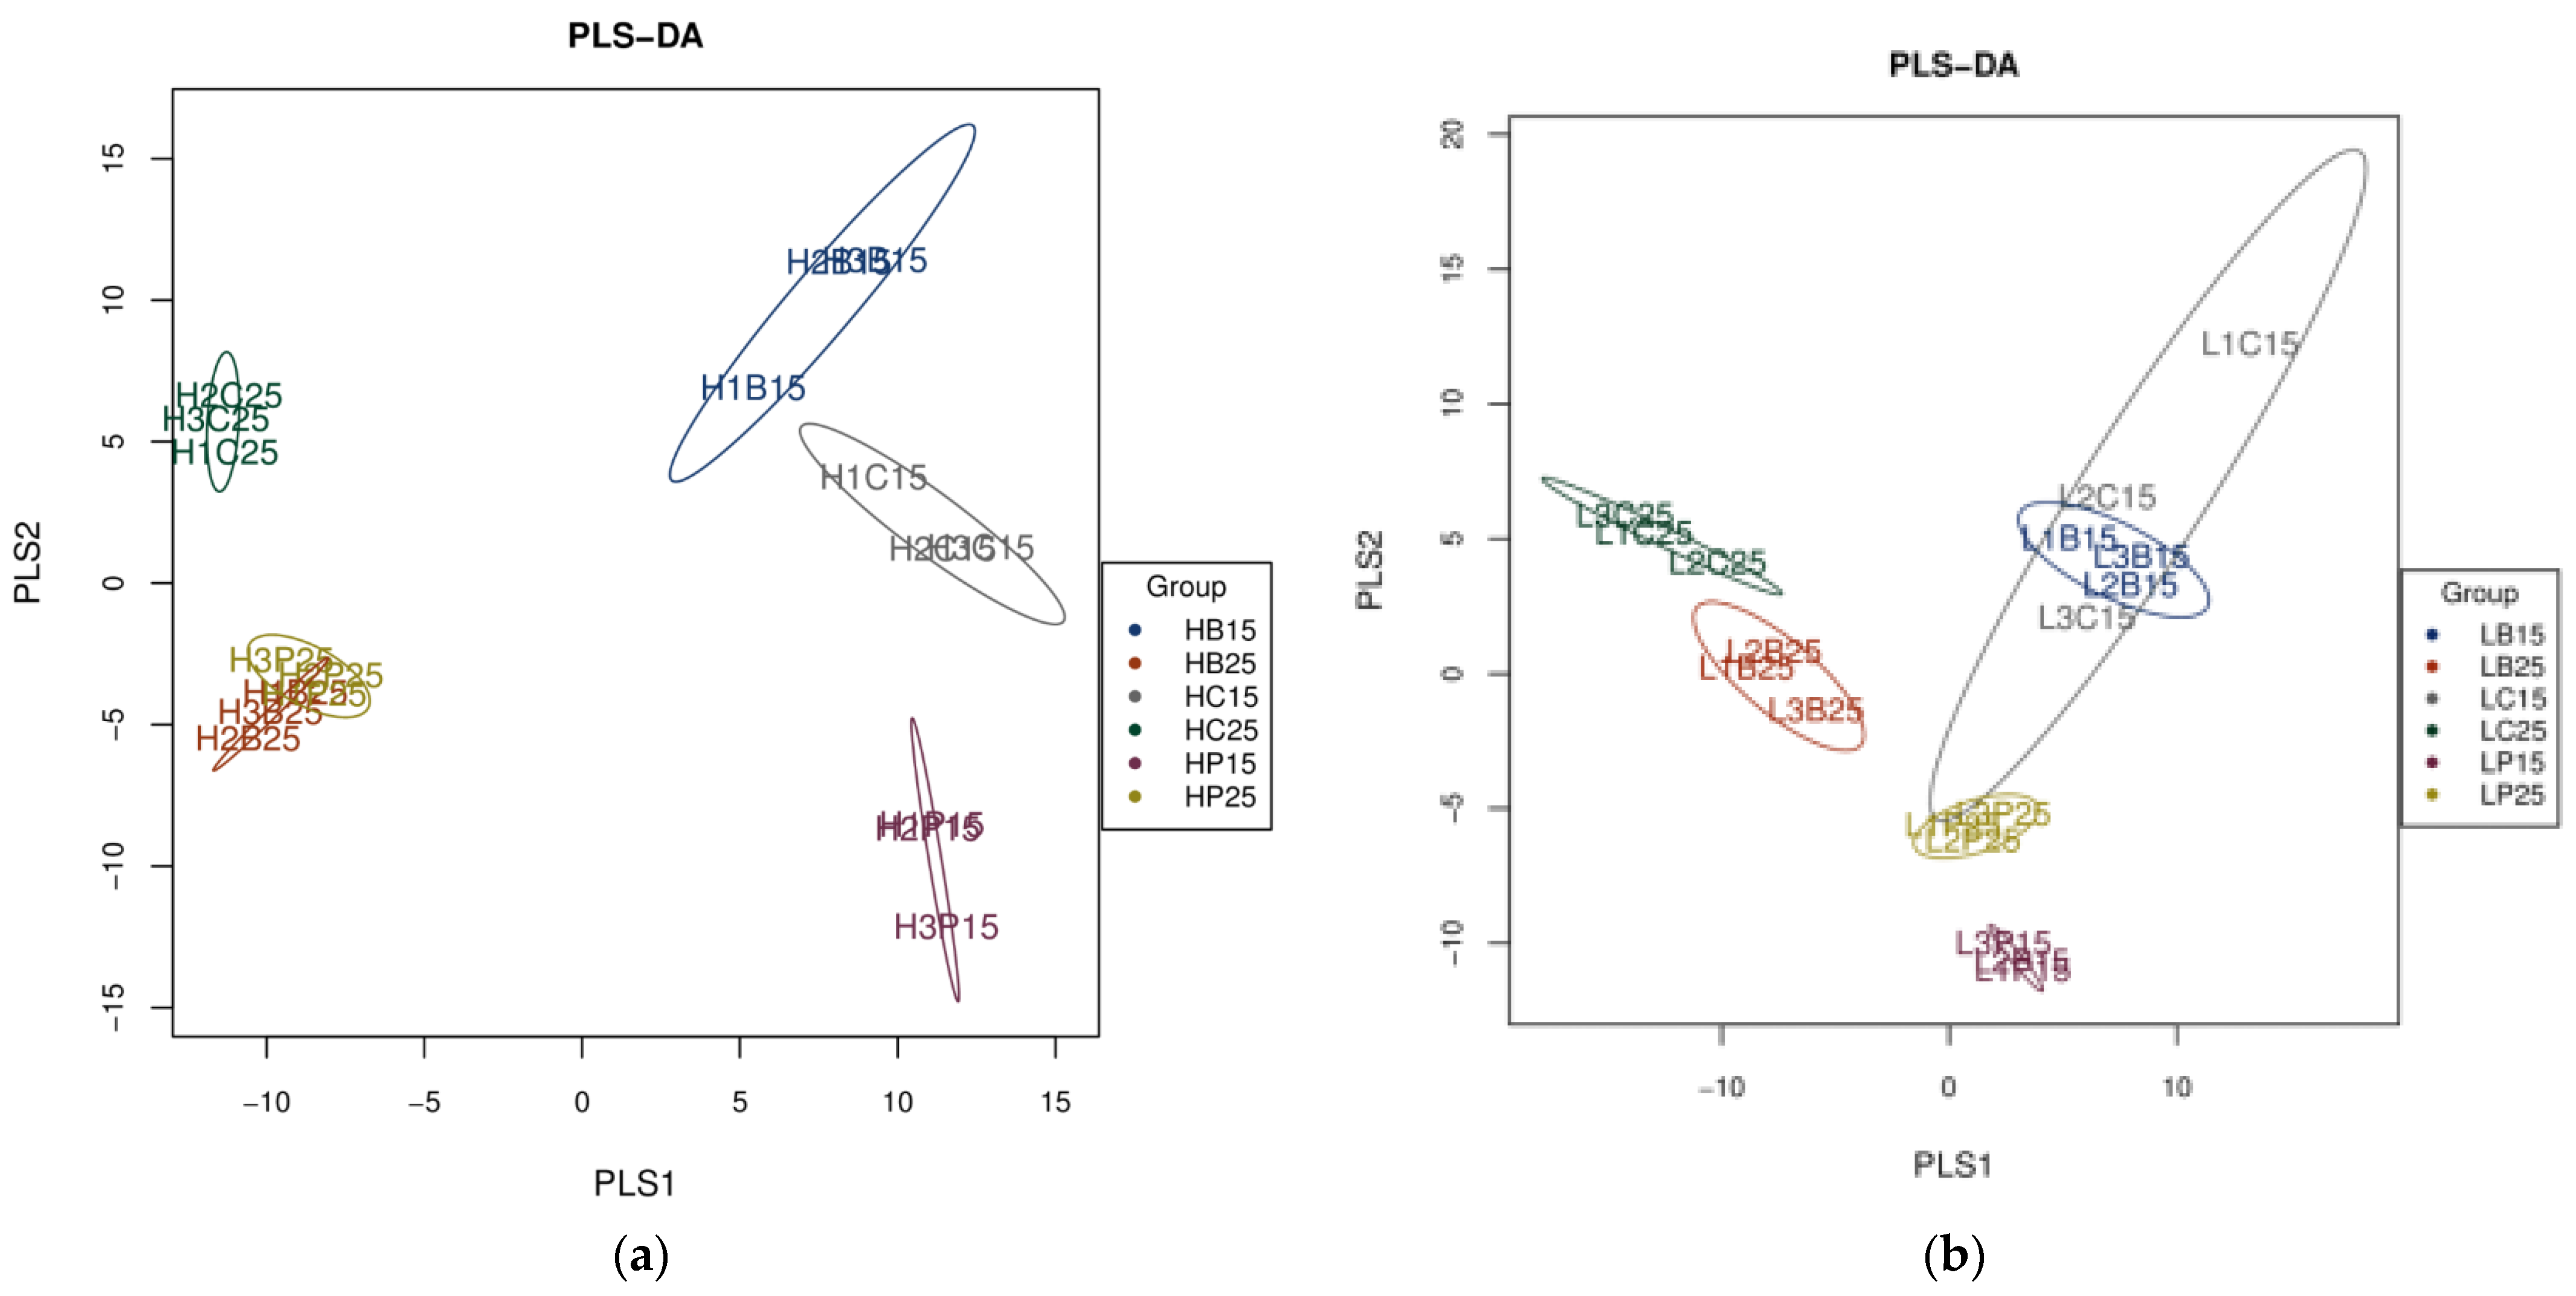
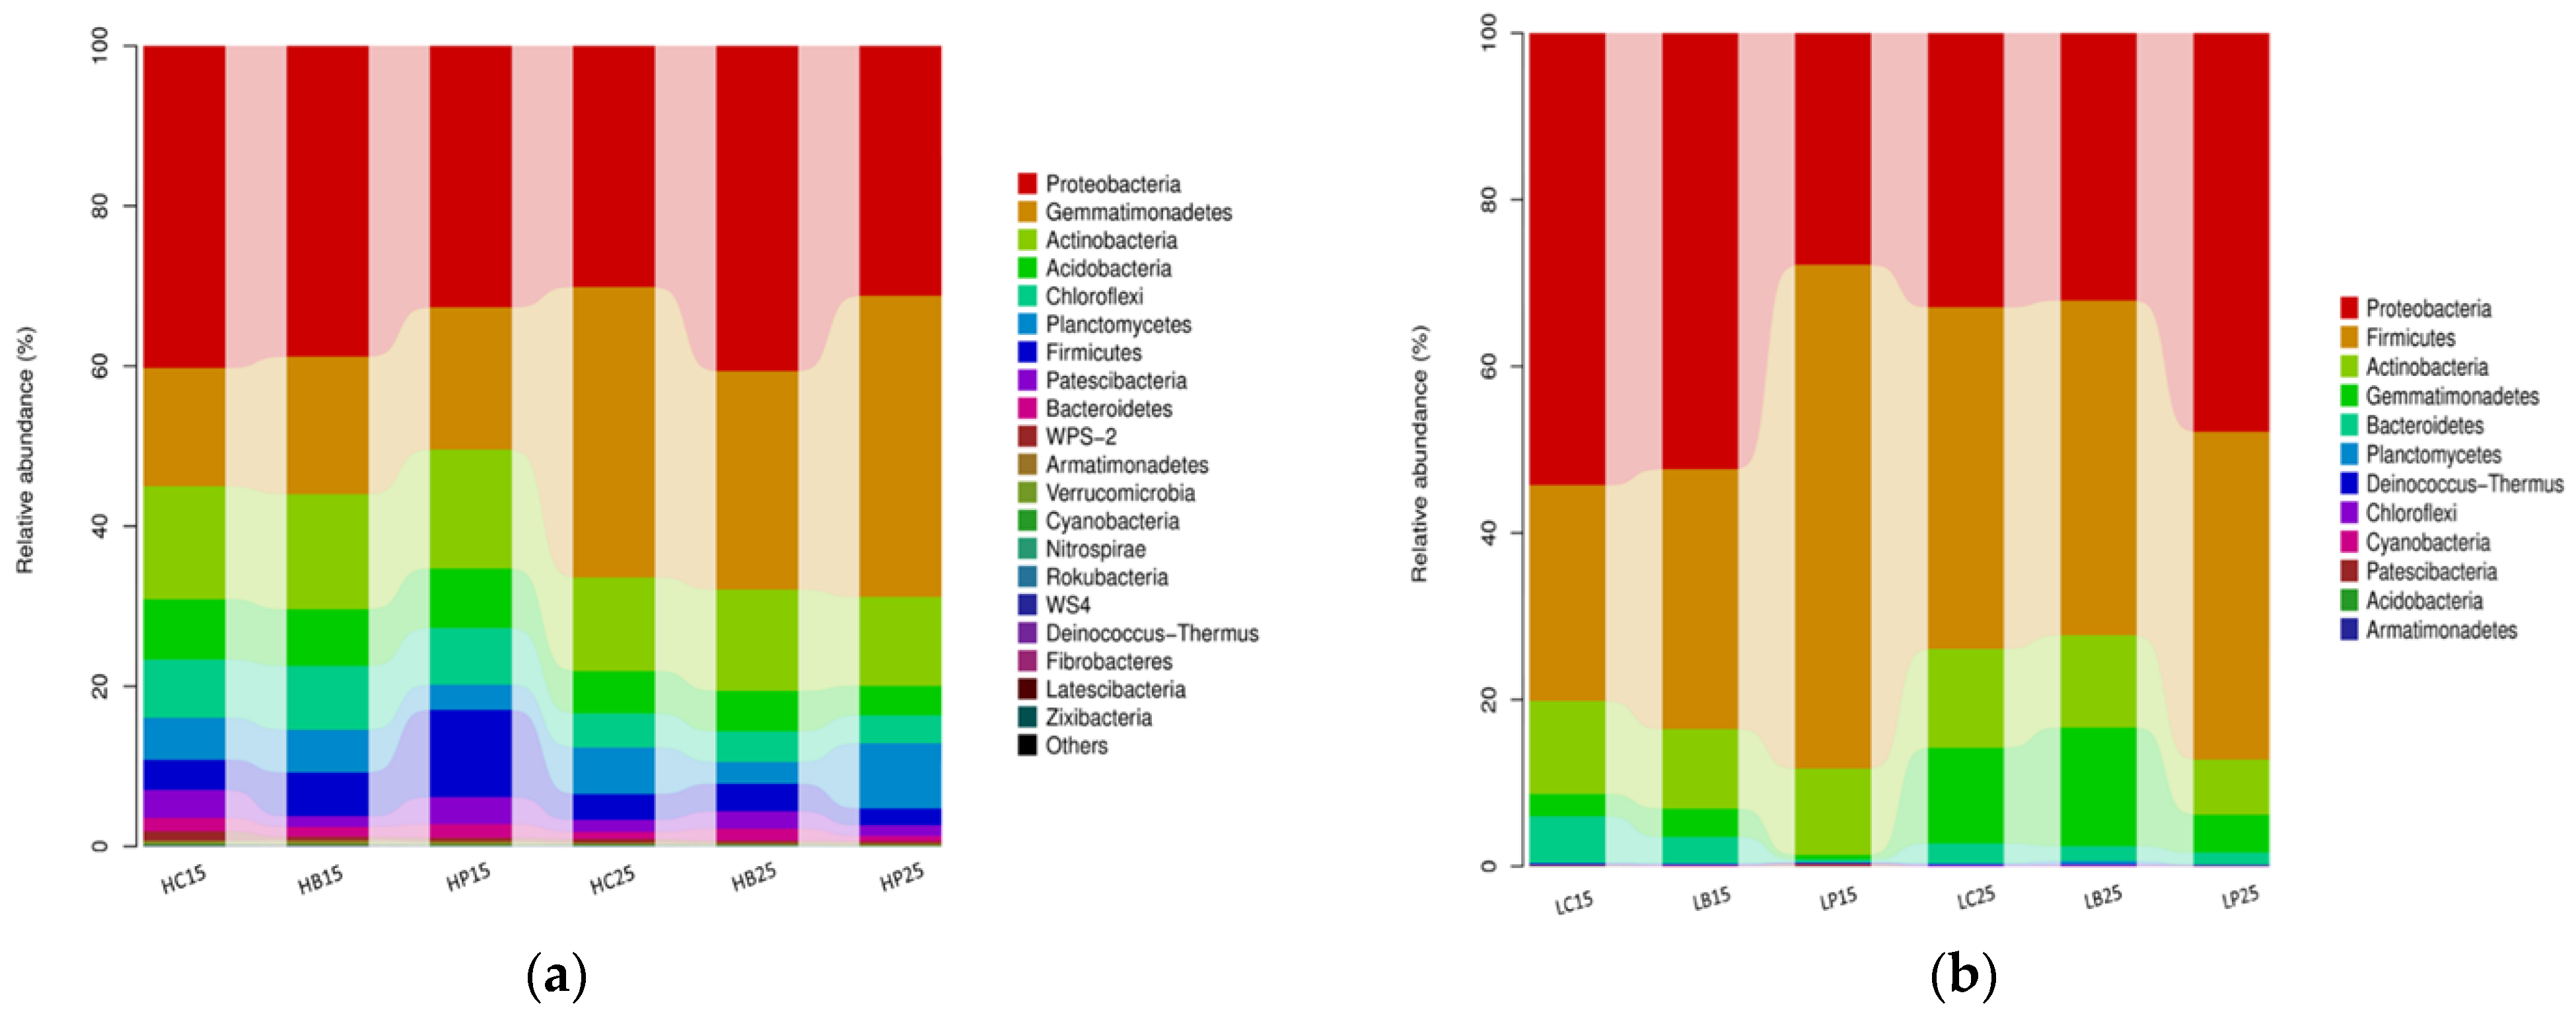
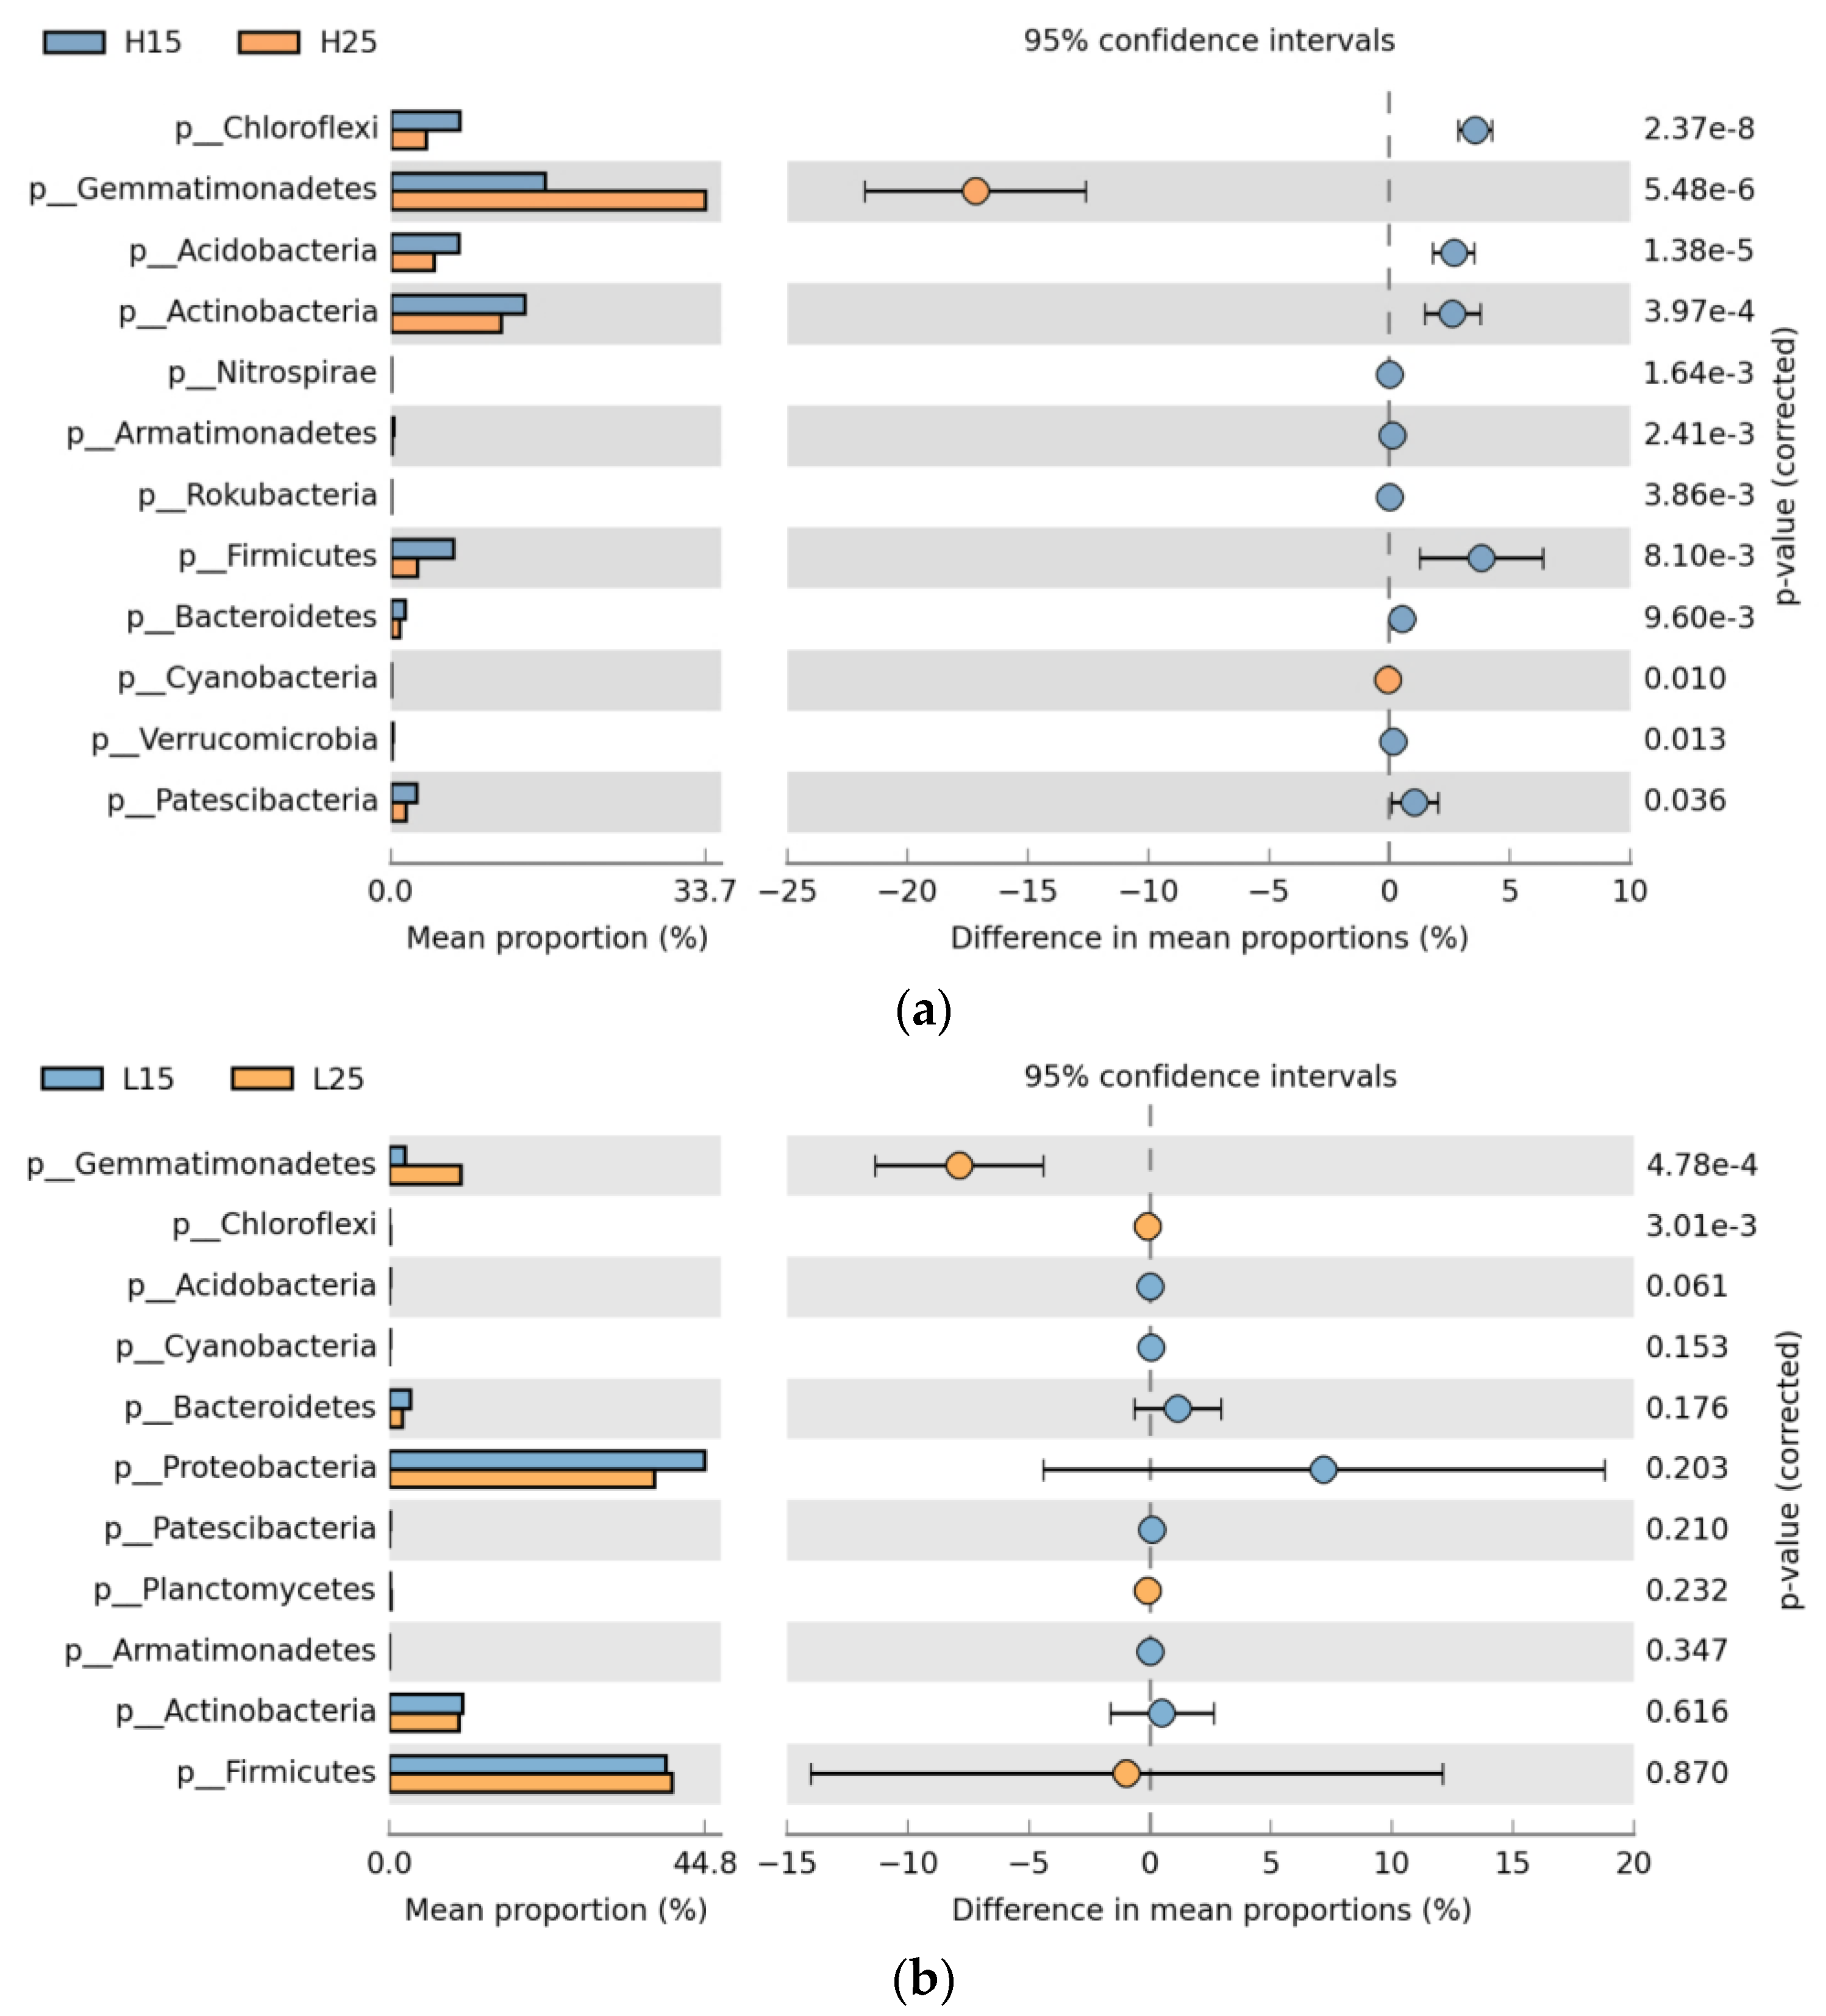
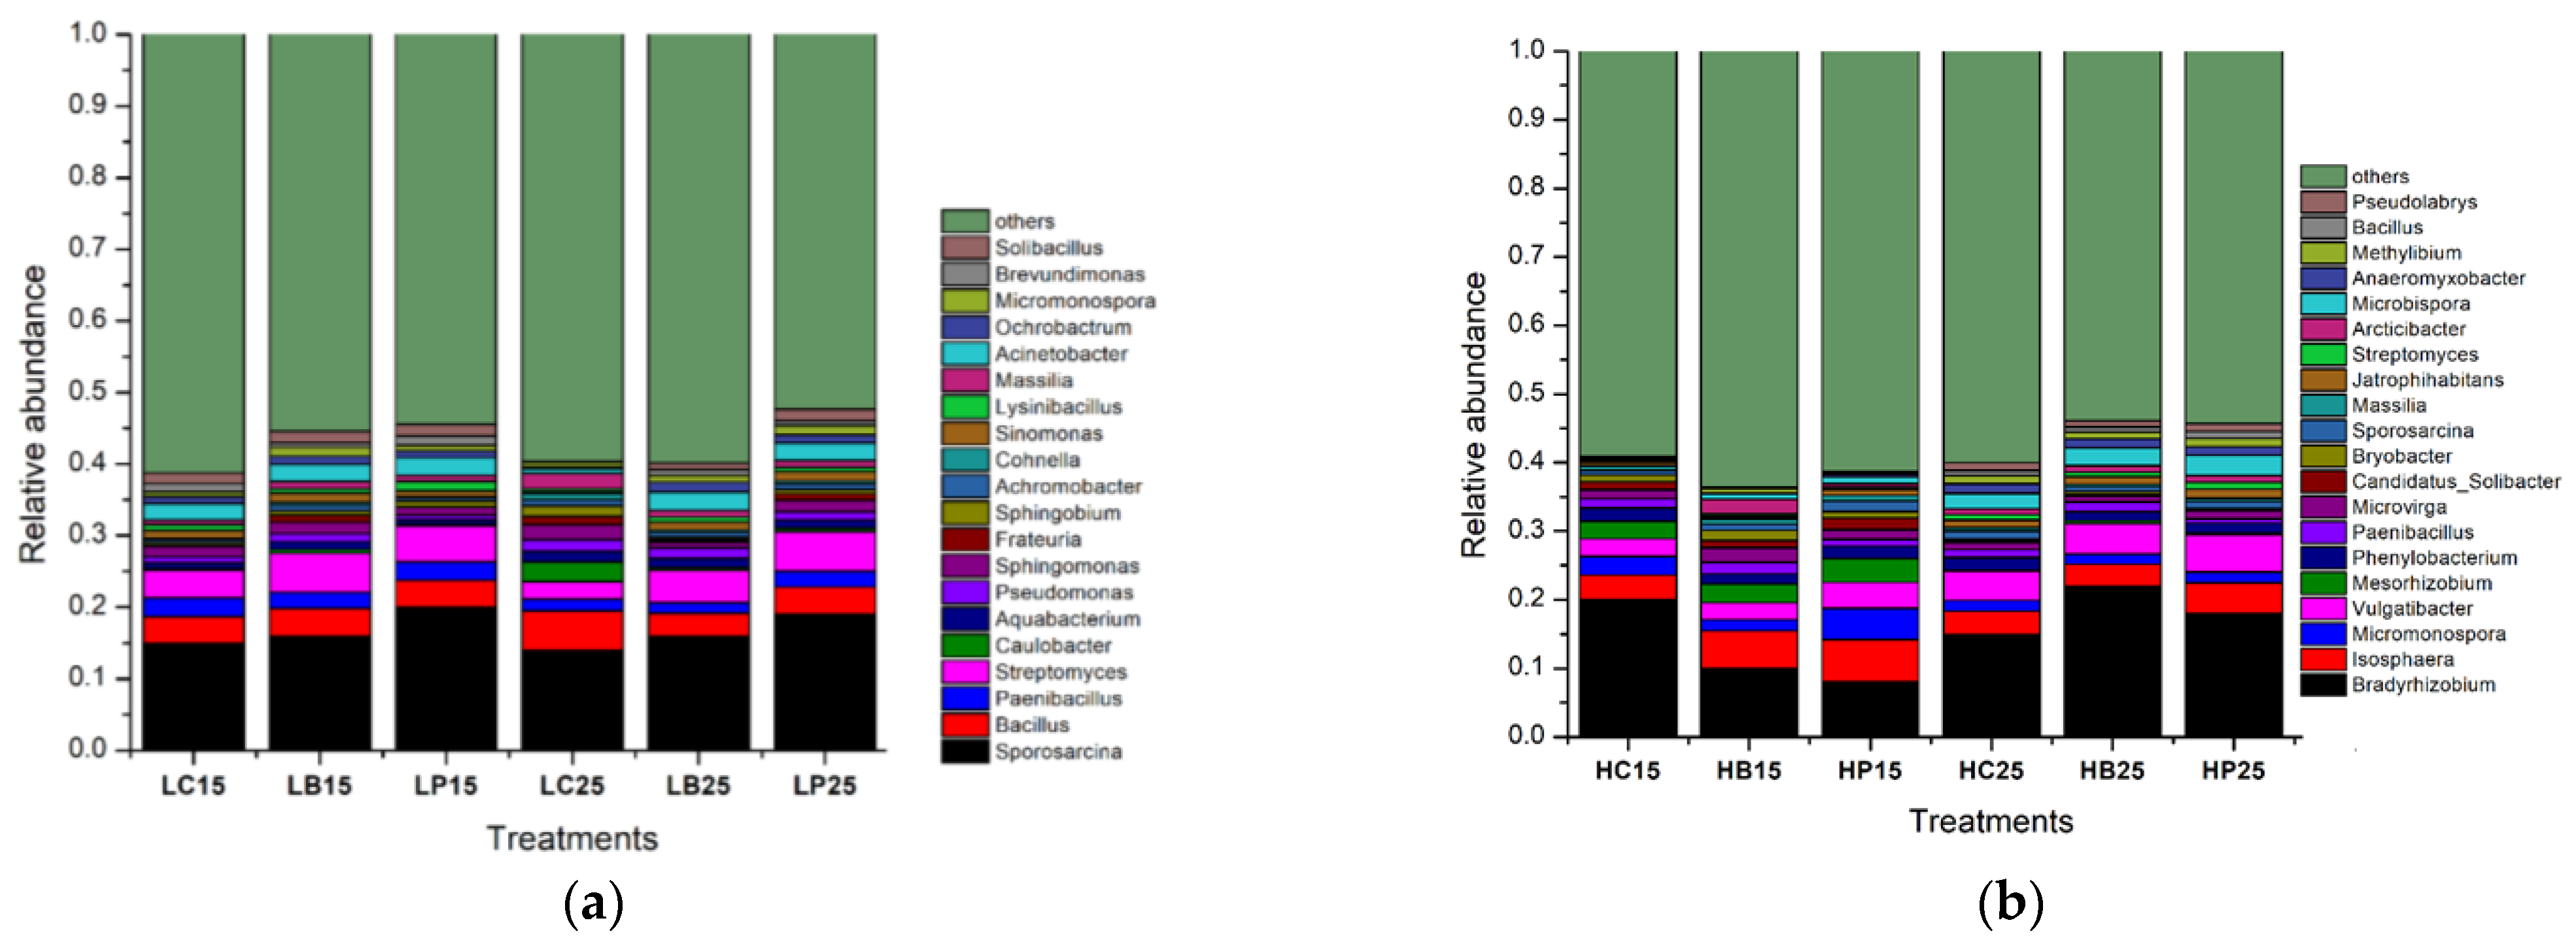
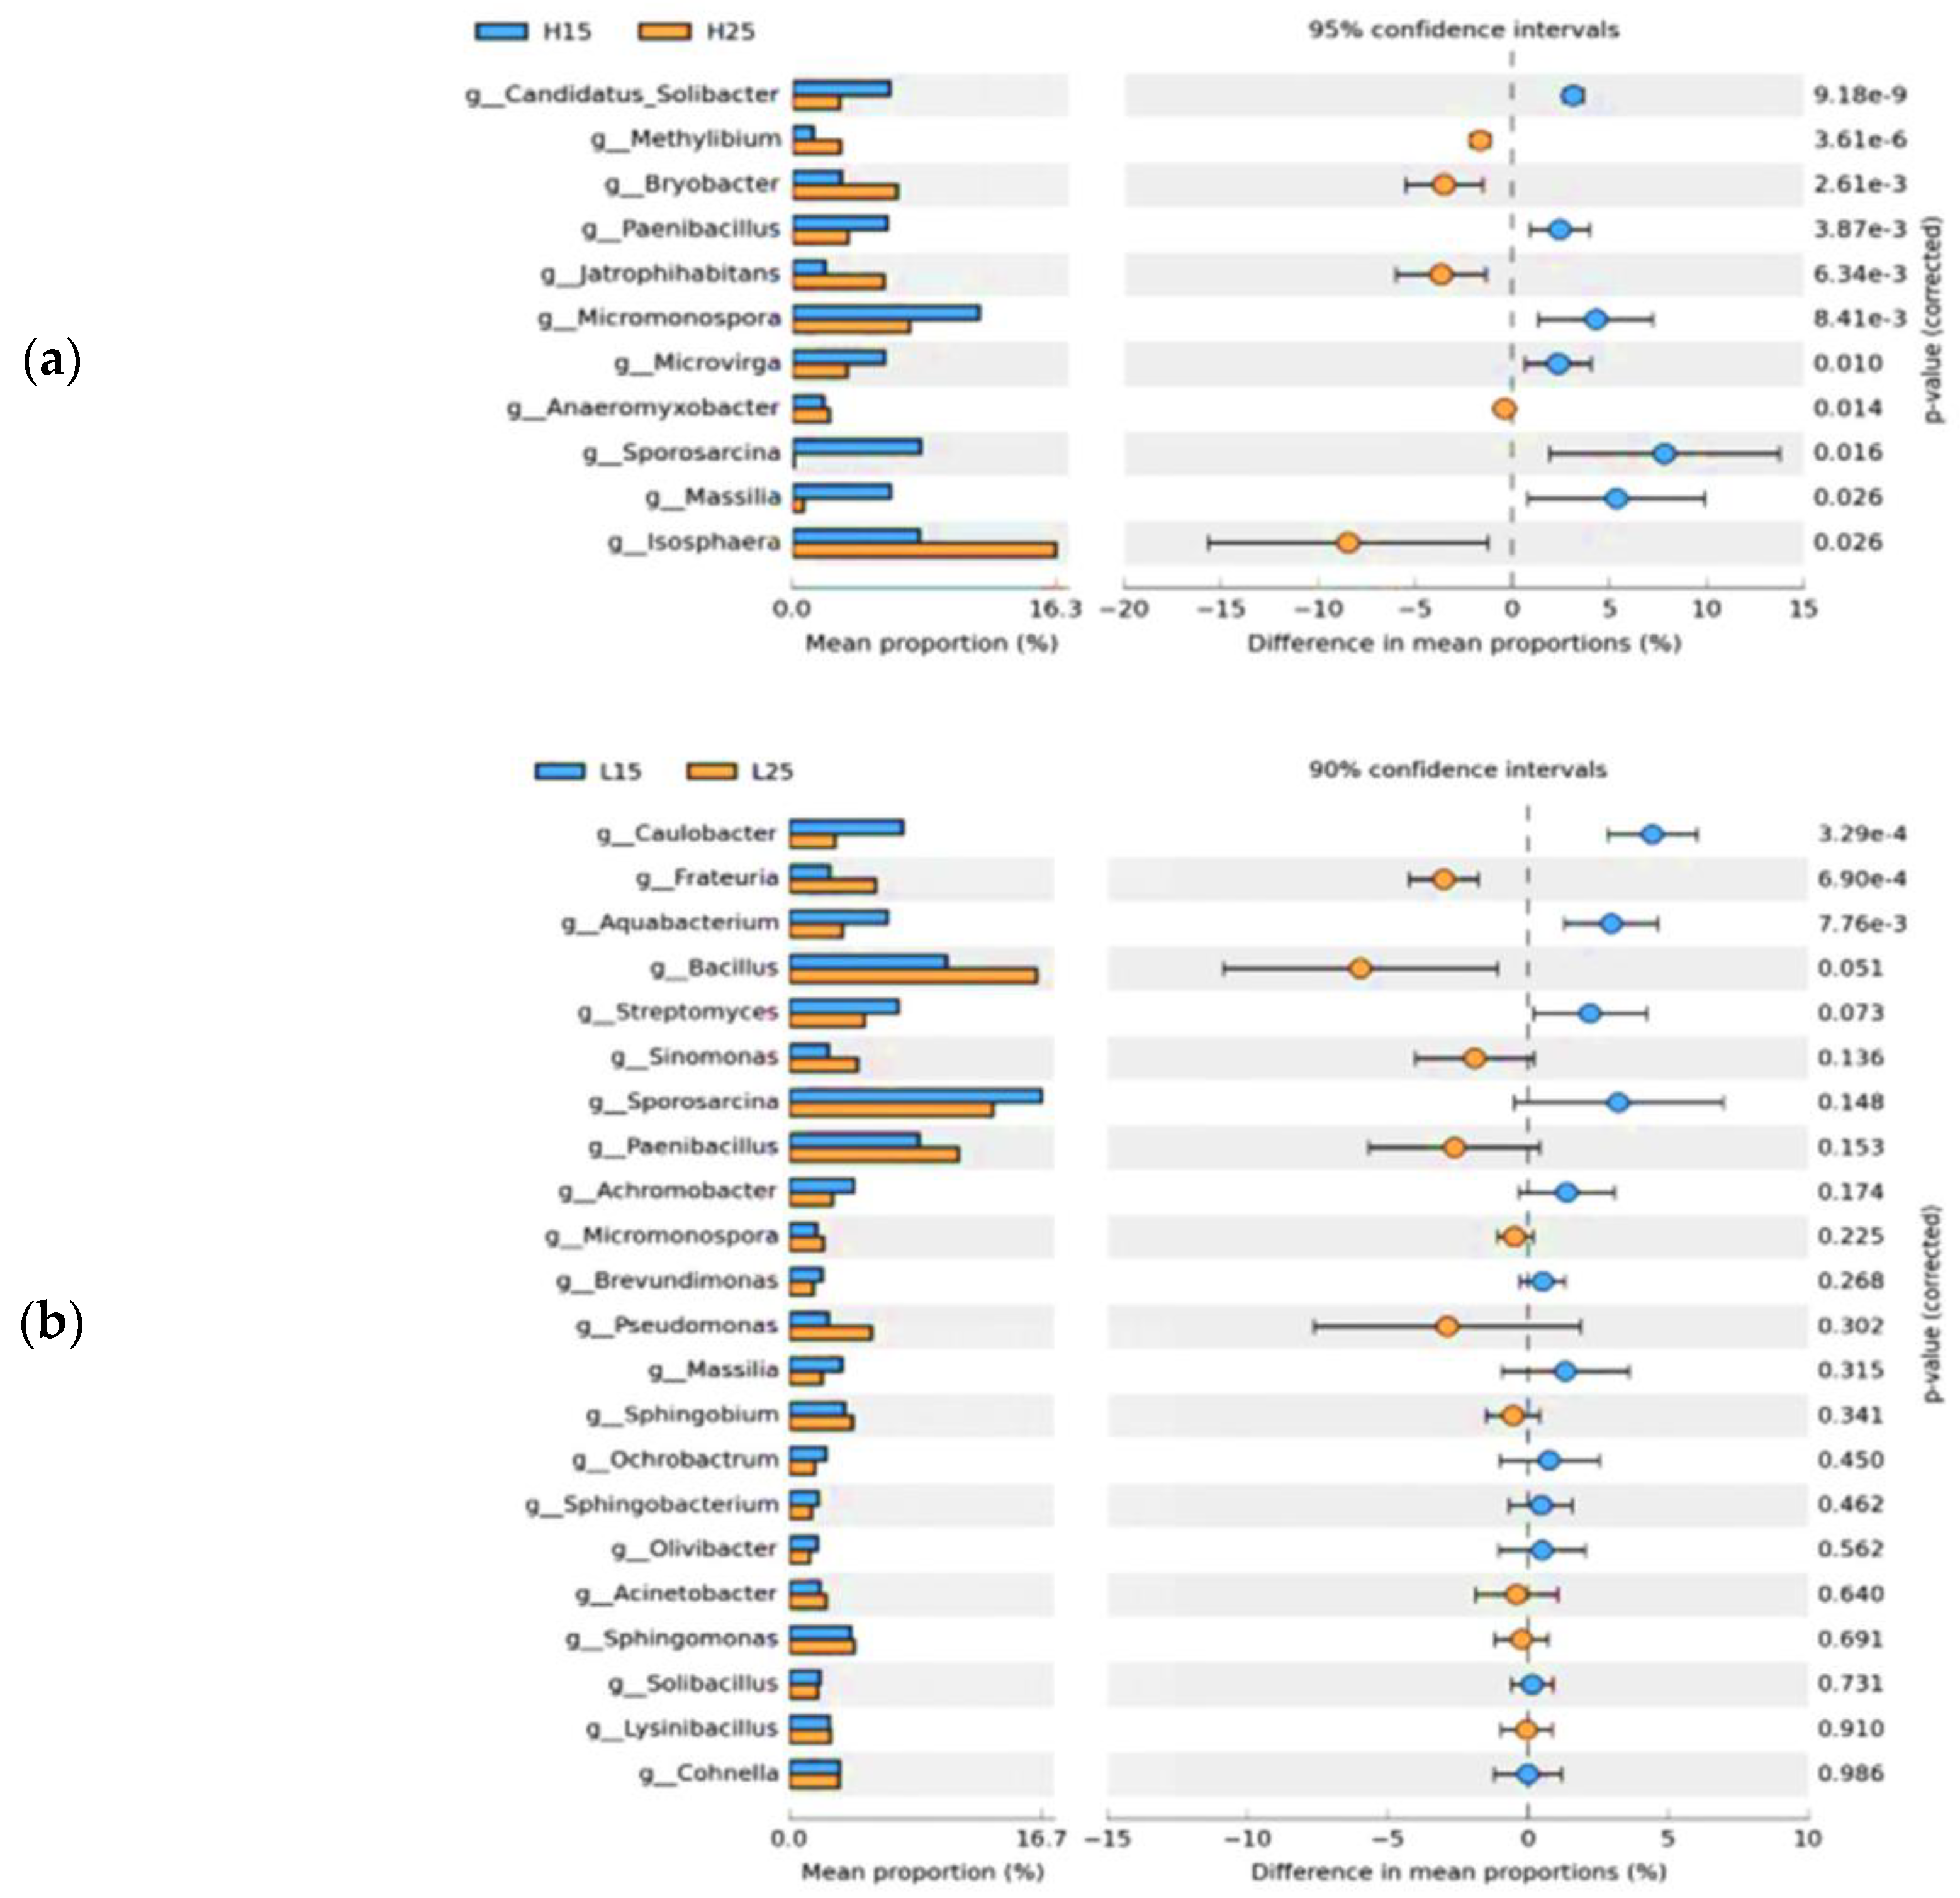
3.2. Dynamics of Soil Bacterial Community after Biochar Fertilizer Amendment

The application of biochar at 25 °C resulted in a notable increase in the diversity indices of Simpson and Shannon in paddy and red soil. A similar pattern was observed in terms of species richness, with an elevation in Chao1 and ACE metrics upon biochar application at 25 °C (Table S4). The results emphasize the influence of biochar amendment and temperature on bacterial community dynamics.
Partial least square-discriminant analysis (PLS-DA) also showed significant differences in the diversity and richness of bacterial communities in paddy and red soils at incubation temperatures of 15 °C, as well as 25 °C (Figure 1). Considerably separated clusters were observed in the diversity and richness of bacterial communities in biochar and inorganic P-amended paddy and red soil at 15 °C and 25 °C (Figure 1). Specifically, the inorganic P treatment, when used at 15 °C, was clearly separated from that of 25 °C, as well as any of the biochar treatment and control used in both soils. In red soil, the biochar addition at 15 °C and inorganic P application at 25 °C did not show any significance with respect to the control; however, the biochar addition at 25 °C and inorganic P application at 15 °C were separated not only from each other but also from the control (Figure 1). Both the inorganic P and biochar treatments at 15 °C lied separately with different application treatments at 25 °C but also from the control at both incubation temperatures in paddy soil. Bacterial communities with biochar and inorganic P addition, when treated at 25 °C, clustered together, yet they were far away from the control in paddy soil (Figure 1).
At the phylum level, Proteobacteria, Firmicutes, Actinobacteria, Gemmatimonadetes, Bacteroidetes, Planctomycetes, Deinococcus-Thermus, Chloroflexi, Cyanobacteria, Patescibacteria, Acidobacteria, and Armatimonadetes were the 12 bacterial phyla observed in red soil (Figure 2b). In addition to the aforementioned 12 bacterial phyla, 8 bacterial phyla (20 in total), namely WPS-2, Verrucomicrobia, Nitrospirae, Rokubacteria, WS-4, Fibrobacteria, Latesibacteria and Zixibacteria were observed in the paddy soil (Figure 2a). Proteobacteria was the most dominant phyla in the paddy soil (p < 0.05) and comprised 35.6% of the total sequences, followed by Gemmatimonadetes (25.2%), Actinobacteria (13.1%), and Acidobacteria (Figure 2a). The highest-abundance phylum of Proteobacteria (41%) was observed with biochar addition at 25 °C, whereas Gemmatimonadetes and Actinobacteria dominated with inorganic P application. The abundance of Gemmatimonadetes and Planctomycetes decreased with the use of biochar treatment. At 15 °C, the abundance of Firmicutes was significantly increased in the inorganic P treatment, while the abundance of Proteobacteria was significantly decreased in the inorganic P treatment (Figure 2a).
In red soil, Proteobacteria (41%), Firmicutes (39.7%), Actinobacteria (10.1%), Gemmatimonadetes, Bacteriodetes, and Chloroflexi remained the dominant bacterial phyla (Figure 2b). Among these most abundant phyla, Acidobacteria, Gemmatimonadetes, Chloroflexi, and Firmicutes were significantly affected by biochar and inorganic P amendment. The inorganic P amendment increased the abundance of Proteobacteria at 15 °C and 25 °C; however, the abundance of Firmicutes was only enhanced at 15 °C (Figure 2b).
Amongst the abundant bacterial phyla, Gemmatimonadetes was strongly associated with incubation temperatures and by far dominated at 25 °C (p < 0.05) in paddy and red soil. Cyanobacteria demonstrated significantly higher expression at 25 °C in paddy soil. Chloroflexi showed significantly (p < 0.05) higher expression at 15 °C and 25 °C in paddy and red soil, respectively. Acidobacteria, Actinobacteria, Nitrospirae, Armatimonadetes, Rokubacteria, Firmicutes, Bacteriodetes, and Patescibacteria dominated at 15 °C in paddy soil. Proteobacteria did not show any significant association with the incubation temperatures (Figure 3a,b).
A total of 123 and 105 genera were recognized in paddy soil and red soil at the genus level, respectively, regardless of the applied treatments. Out of these, the 20 most abundant genera, having relative abundances ≤ 1%, revealed the dominance of various P solubilizing species, namely Pseudomonas, Paenibacillus, Bradyrhizobium, Micromonospora, Massilia, Streptomyces, Bacillus, Streptomyces, Pseudomonas, Bryobacter, Mesorhizobium, Sphingomonas, and Micromonospora, in paddy and red soil. The relative abundances of Sporosarcina, Bacillus, Paenibacillus, and Streptomyces increased under inorganic P application, both at 15 °C and 25 °C, in red soil (Figure 4b). In paddy soil, Bradyrhizobium, Isosphaera, Micromonospora, and Vulgatibacter were highly abundant under biochar application at 25 °C (Figure 4a).
The relative abundances of Candidatus-Solibacter, Paenibacillus, MIcromonospora, Microvirga, Sporocarcina, and Massilia were significantly higher at 15 °C, irrespective of treatments, whereas Methylibium, Bryobacter, Jatrophihabitans, Anaeromyxobacter, and Isosphaera were significantly abundant at 25 °C in paddy soil (Figure 5a). In red soil, Caulobacter and Aquabacterium were significantly abundant at 15 °C, whereas only Frateuria showed significant abundance at 25 °C, regardless of the applied treatments (Figure 5b).

3.3. Relationship between Soil Bacterial Communities and Chemical Properties

The results of MANOVA showed the significant effects of soil type on bacterial phyla, such as Gemmatimonadetes, Actinobacteria, Chloroflexi, Acidobacteria, Planctomycetes, Firmicutes, Patescibacteria, and Bacteriodetes (Table 3). The treatment effect remained non-significant; however, the incubation temperature significantly regulated the abundances of Gemmatimonadetes, Actinobacteria, Chloroflexi, and Patescibacteria. Nonetheless, the interaction effects of treatment and incubation temperature significantly influenced the abundances of Gemmatimonadetes, Chloroflexi, and Acidobacteria (Table 3).
The correlation between the relative abundances of different dominant bacterial genera and soil variables (Table 4) showed that in paddy soil, Mesorhizobium and Streptomyces had significantly negative correlations with soil pH. Moreover, the correlation between available P and acid phosphatase activity with Bradyrhizobium and Mesorhizobium remained significantly positive. In red soil, Sporosarcina, Bacillus, Sphingobium, and Acinetobacter had significantly positive correlations with APA, while Achromobacter showed a significantly positive correlation with both the soil pH and the available P. Massilia and Brevundimonas were only positively influenced by soil pH (Table 4). APA showed a significantly negative correlation with Archomobacter, Sinomonas, and Missilia. The correlations of available P with Bacillus and Paenibacillus remained significantly negative, while the soil pH was negatively correlated with Bacillus and Sphingobium (Table 4).

4. Discussion

Given the alterations in P availability and diversity of the microbial community, the soil pH fluctuations remain a point to emphasize. Previous studies have reported the soil pH increments as a result of biochar and inorganic P amendments [17]. However, in this study, the increments in soil pH with biochar and inorganic P amendments were, perhaps, due to the alkaline nature of the biochar or the occurrence of carboxylic functional groups, as well as its oxidation properties [18]. In a short-duration incubation study, the increase in soil pH resulting from inorganic amendment was greater than that of biochar application, which indicates the alkaline nature of inorganic P amendment, which could have generated alkaline species in acidic soil [19]. The increase in temperature raised the soil pH somehow in this study due to the denaturation of organic acid [20].
A significant increase in available P concentration in biochar and inorganic P-amended paddy and red soils was observed in this study. The biochar used in this study had a significant proportion of labile P, which may have directly caused phosphate to be released into the soil, as reported previously by [21]. It has been reported that the biochar produced at high temperatures could act as a source of bioavailable P, which directly releases phosphate into the soil solution [22,23]. Moreover, the pyrolysis of organic material in some specific temperature range can greatly increase P availability through the volatilization of carbon and cleavage of P bonds, resulting in the enrichment of residual P in the pyrolysis material [24]. Usually, biochar at a low pyrolysis temperature provides highly available P contents. On the other hand, the available P concentration, which resulted from inorganic P amendment, was higher than that of biochar amendment (Table S1). It could be reasoned that the chemical fertilizers are readily soluble and release more P than organic sources, which cause short-term increases in available P reserves in soil; however, long-term and excessive use of inorganic fertilizers increases soil acidity and decreases P availability [25]. Moreover, the inorganic P application instantly stimulates microbial biomass and the growth in phosphate-solubilizing microorganisms, which promote organic P mineralization and release oxide-chelated non-active P in soil minerals [26]; in contrast, biochar is recalcitrant in nature and can persist and slowly release nutrients in soil for years [18,27].
Additionally, the P released from applied biochar and inorganic P was prevented from undergoing adsorption and complex formation, thereby mobilizing the native soil P and increasing it beyond the critical limits in this study. Moreover, the modifications in soil properties, such as pH, porosity, and microbial activities, also contributed to available P increments [21,25]. Interestingly, the available P concentration was relatively higher at 15 °C (although non-significant) than that at 25 °C. These findings were different from those of some of the previous studies, which reported more P availability at high temperatures [28] and, hence, called for long-term investigations to understand temperature-dependent P availability in different soils.
Significant decreases in acid phosphatase activity were observed after inorganic P additions compared to the control in this study. It is possible that the large quantity of inorganic P applied in the form of biochar has decreased phosphatase activities [29,30] (Tables S2 and S3). Inorganic P application in soil negatively influences acid phosphatase activity [31,32]. The response of the phosphatase activity in soil is reciprocal to the soil P contents [21,33] Moreover, soil pH increase up to 35% with the addition of DAP application could have caused the inhibition of the acid phosphatase activity [34].
The complexity of bacterial communities in terms of their variable abundance in soils has profound effects on soil function. Organic matter, such as biochar application in soil, influences the complexity of the bacterial consortium in soils [35,36,37], as is obvious from this study, where biochar application increased microbial diversity and altered the bacterial communities. Inconsistent with the biochar application, the inorganic P application did not significantly enhance the microbial community abundance in this study [38,39]. We speculated that, in a short-term study, inorganic P and biochar applications altered the soil acidity and released adequate P, which favored the growth of microbial communities [18]. However, the results of alpha diversity revealed that the bacterial communities and species richness levels were significantly enhanced by biochar compared to inorganic P and control. It can be observed that through higher nanoporosity and a larger specific surface area, the biochar may have improved soil bacterial growth by improving the soil microenvironment [21]. In addition, biochar is a rich source of carbon for microbes; thus, the greater variability in bacterial communities may have also been attributed to the improved nutrient (C, N) provision. Apart from this fact, biochar is highly resistant to microbial degradation and provides long-term benefit to soil microbes [40].
High-throughput sequencing analysis revealed that biochar inputs enhanced the relative abundances of Proteobacteria, but that of Acidobacteria was decreased. These outcomes were reinforced by a copiotrophic hypothesis [12], which states that copiotrophic groups (e.g., Proteobacteria and Gemmatimonadetes) with rapid growth rates were likely to increase in nutrient-rich soils, while oligotrophic groups (e.g., Acidobacteria and Chloroflexi) with slow growth rates were likely to decline [41]. Proteobacteria and Gemmatimonadetes have been reported to grow better in nutrient-rich environments with improved soil conditions [42]. The low abundance of Protobacteria under inorganic P application showed that the P availability might not be the only limiting factor influencing its growth [43]. The correlation between bacterial communities and soil properties indicates that soil pH and available P are strongly correlated with microbial communities [41].
In the current experiment, the abundance of some P-solubilizing bacteria significantly changed in soils amended with biochar and inorganic fertilizer. At the genus level, a large number of P-solubilizing genera were observed in soil, which may be due to the improvements in P availability and soil pH by biochar and inorganic P applications. This statement is supported by the findings of this study, where significant correlations were shown between soil pH and available P with Bradyrhizobium and Mesorhizobium in paddy soil and Massilia, Bacillus, Streptomyces, and Sphingomonas in red soil. The enhanced P availability under biochar application, in this study, could be due to the phosphate-solubilizing roles of genera Pseudomonas and Paenibacillus [44,45]. Moreover, the strains belonging to the genera Bradyrhizobium, Streptomyces, Massilia, and jietaisiensis may have contributed to increasing soil P in this study [21,45].
PLS-DA results predicted that bacterial communities in our soils at different temperature and treatments clustered separately, especially for inorganic P amendment. Moreover, bacterial communities were observed to be associated with incubation temperature (Figure 3). This highlights the significant role of a high incubation temperature in boosting microbial activities [20].
Gemmatimonadetes, Acidobacteria, and Actinobacteria were also found to be strongly influenced by incubation temperatures (Figure 3). Overall, the comparison of soil microbial abundance with the soil type showed that microbial communities were strongly influenced by soil type (Table 2). Most of the top abundant bacterial phyla, such as Gemmatimonadetes, Actinobacteria, Chloroflexi, Acidobacteria, Planctomycetes, Firmicutes, Patescibacteria, and Bacteroidetes were highly dependent on soil type. This influence of soil type on microbial communities depicted the role of soil native resources and already existing communities for controlling the microbial consortium resulting from biochar and inorganic P amendments [46].

5. Conclusions

In conclusion, the present study highlights the significant impact of biochar and inorganic phosphorus (P) amendments on soil properties, microbial communities, and P availability. The observed fluctuations in soil pH, attributed to the alkaline nature of biochar and the potential presence of carboxylic functional groups, indicate the complex interactions within the soil system. The increased available P concentration resulting from biochar application, especially with its labile P content, suggests its potential role as a bioavailable P source. However, inorganic P amendments exhibited higher immediate availability, simultaneously decreasing the acid phosphatase activity. The study also noted that both biochar and inorganic P applications mobilized native soil P beyond critical limits, impacting soil properties, such as pH, porosity, and microbial activities. Furthermore, the alterations in bacterial communities underscore the role of biochar in enhancing microbial diversity, while inorganic P application showed less pronounced effects. The findings emphasize the need for long-term investigations to understand temperature-dependent P availability in diverse soils. Despite revealing valuable insights, this study has limitations, such as its short-term nature, and opens up avenues for future studies to explore the sustainability and long-term effects of biochar and inorganic P amendments on soil health and nutrient cycling. Additionally, the observed changes in bacterial communities highlight the importance of considering soil type to be a crucial factor influencing microbial consortia post-amendments. Overall, this study contributes to our understanding of the complex interactions between soil, amendments, and microbial communities, providing a foundation for future research into sustainable management practices.

Supplementary Materials

The following supporting information can be downloaded via this link: https://www.mdpi.com/article/10.3390/agronomy14010026/s1, Table S1: Effect of biochar and inorganic P amendment on soil pH on different incubation intervals; Table S2: Effect of biochar and inorganic P amendment on soil available P on different incubation intervals; Table S3: Effect of biochar and inorganic P amendment on soil acid phosphatase activity on different incubation intervals; Table S4: Changes in the diversity and richness indices of the soil bactzerial communities in different treatments.

Author Contributions

R.S.: conducting experiment, data curation, writing—original draft; F.N.; editing and review, W.Y.; conceptualization, R.M.; review and editing, M.T., X.G. and M.I.K.; methodology, S.X.; resources and supervision, G.W.K.; funding and resources. All authors have read and agreed to the published version of the manuscript.

Funding

This work was carried out with the support of the “Cooperative Research Program for Agriculture Science & Technology Development (Project No. RS-2021-RD009042)”, Rural Development Administration, Republic of Korea.

Data Availability Statement

Data are contained within the article and Supplementary Materials.

Acknowledgments

We are grateful to Fujian Agriculture and Forestry University, Fuzhou, Fujian, China, for providing the support and facilities used to conduct this research.

Conflicts of Interest

The authors declare no conflict of interest.

References

  1. Hussain, A.; Ahmad, M.; Mumtaz, M.Z.; Ali, S.; Sarfraz, R.; Naveed, M.; Jamil, M.; Damalas, C.A. Integrated Application of Organic Amendments with Alcaligenes sp. AZ9 Improves Nutrient Uptake and Yield of Maize (Zea mays). J. Plant Growth Regul. 2020, 39, 1277–1292. [Google Scholar] [CrossRef]
  2. Yang, W.; Li, P.; Rensing, C.; Ni, W.; Xing, S. Biomass, activity and structure of rhizosphere soil microbial community under different metallophytes in a mining site. Plant Soil 2019, 434, 245–262. [Google Scholar] [CrossRef]
  3. Sarfraz, R.; Shakoor, A.; Abdullah, M.; Arooj, A.; Hussain, A.; Xing, S. Impact of integrated application of biochar and nitrogen fertilizers on maize growth and nitrogen recovery in alkaline calcareous soil. Soil Sci. Plant Nutr. 2017, 63, 488–498. [Google Scholar] [CrossRef]
  4. Tarin, M.W.K. Effects of different biochars ammendments on physiochemical properties of soil and root morphological attributes of Fokenia Hodginsii (Fujian cypress). Appl. Ecol. Environ. Res. 2019, 17, 11107–11120. [Google Scholar] [CrossRef]
  5. Zheng, B.-X.; Ding, K.; Yang, X.-R.; Wadaan, M.A.; Hozzein, W.N.; Peñuelas, J.; Zhu, Y.-G. Straw biochar increases the abundance of inorganic phosphate solubilizing bacterial community for better rape (Brassica napus) growth and phosphate uptake. Sci. Total. Environ. 2019, 647, 1113–1120. [Google Scholar] [CrossRef] [PubMed]
  6. Wang, Y.; Yang, L.; Xu, J.; Xin, F.; Jiang, L. Applications of synthetic microbial consortia in biological control of mycotoxins and fungi. Curr. Opin. Food Sci. 2023, 53, 101074. [Google Scholar] [CrossRef]
  7. Tarin, M.W.K.; Fan, L.; Tayyab, M.; Sarfraz, R.; He, T.; Rong, J.; Chen, L.; Zheng, Y. Effects of bamboo biochar amendment on the growth and physiological characteristics of fokienia hodginsii. Appl. Ecol. Environ. Res. 2018, 16, 8055–8074. [Google Scholar] [CrossRef]
  8. Tayyab, M. Biochar: An efficient way to manage low water availability in plants. Appl. Ecol. Environ. Res. 2018, 16, 2565–2583. [Google Scholar] [CrossRef]
  9. Kumar, U.; Shahid, M.; Tripathi, R.; Mohanty, S.; Kumar, A.; Bhattacharyya, P.; Lal, B.; Gautam, P.; Raja, R.; Panda, B.B.; et al. Variation of functional diversity of soil microbial community in sub-humid tropical rice-rice cropping system under long-term organic and inorganic fertilization. Ecol. Indic. 2017, 73, 536–543. [Google Scholar] [CrossRef]
  10. Estrada-Bonilla, G.A.; Lopes, C.M.; Durrer, A.; Alves, P.R.; Passaglia, N.; Cardoso, E.J. Effect of phosphate-solubilizing bacteria on phosphorus dynamics and the bacterial community during composting of sugarcane industry waste Effect of phosphate-solubilizing bacteria on phosphorus dynamics and the bacterial community during composting of su. Syst. Appl. Microbiol. 2017, 40, 308–313. [Google Scholar] [CrossRef]
  11. Corneo, P.E.; Pellegrini, A.; Cappellin, L.; Gessler, C.; Pertot, I. Moderate warming in microcosm experiment does not affect microbial communities in temperate vineyard soils. Microb. Ecol. 2014, 67, 659–670. [Google Scholar] [CrossRef] [PubMed]
  12. Wang, F.-C.; Fang, X.-M.; Wang, G.G.; Mao, R.; Lin, X.-F.; Wang, H.; Chen, F.-S. Effects of nutrient addition on foliar phosphorus fractions and their resorption in different-aged leaves of Chinese fir in subtropical China. Plant Soil 2019, 443, 41–54. [Google Scholar] [CrossRef]
  13. Li, Y.; Hu, S.; Chen, J.; Mueller, K.; Li, Y.; Fu, W.; Lin, Z.; Wang, H. Effects of biochar application in forest ecosystems on soil properties and greenhouse gas emissions: A review. J. Soils Sediments 2018, 18, 546–563. [Google Scholar] [CrossRef]
  14. Tayyab, M.; Islam, W.; Arafat, Y.; Pang, Z.; Zhang, C.; Lin, Y.; Waqas, M.; Lin, S.; Lin, W.; Zhang, H. Effect of Sugarcane Straw and Goat Manure on Soil Nutrient Transformation and Bacterial Communities. Sustainability 2018, 10, 2361. [Google Scholar] [CrossRef]
  15. McLean, E.O. Soil pH and lime requirement. In Methods of Soil Analysis, Part 2. Chemical and Microbiological Properties; American Society of Agronomy, Inc.: Madison, WI, USA, 1982. [Google Scholar] [CrossRef]
  16. Tabatabai, M.A.; Bremner, J.M. Use of p-nitrophenyl phosphate for assay of soil phosphatase activity. Soil Biol. Biochem. 1969, 1, 301–307. [Google Scholar] [CrossRef]
  17. Ng, C.W.W.; Wang, Y.C.; Ni, J.J.; So, P.S. Effects of phosphorus-modified biochar as a soil amendment on the growth and quality of Pseudostellaria heterophylla. Sci. Rep. 2022, 12, 7268. [Google Scholar] [CrossRef]
  18. Sarfraz, R.; Hussain, A.; Sabir, A.; Fekih, I.B.; Ditta, A.; Xing, S. Role of biochar and plant growth promoting rhizobacteria to enhance soil carbon sequestration—a review. Environ. Monit. Assess. 2019, 191, 251. [Google Scholar] [CrossRef]
  19. Lu, W.; Ding, W.; Zhang, J.; Li, Y.; Luo, J.; Bolan, N.; Xie, Z. Biochar suppressed the decomposition of organic carbon in a cultivated sandy loam soil: A negative priming effect. Soil Biol. Biochem. 2014, 76, 12–21. [Google Scholar] [CrossRef]
  20. Onwuka, B.M. Effects of Soil Temperature on Some Soil Properties and Plant Growth. Adv. Plants Agric. Res. 2018, 8, 34–37. [Google Scholar] [CrossRef]
  21. Sarfraz, R.; Yang, W.; Wang, S.; Zhou, B.; Xing, S. Short term effects of biochar with different particle sizes on phosphorous availability and microbial communities. Chemosphere 2020, 256, 126862. [Google Scholar] [CrossRef]
  22. Xu, G.; Sun, J.; Shao, H.; Chang, S.X. Biochar had effects on phosphorus sorption and desorption in three soils with differing acidity. Ecol. Eng. 2014, 62, 54–60. [Google Scholar] [CrossRef]
  23. Luo, D.; Wang, L.; Nan, H.; Cao, Y.; Wang, H.; Kumar, T.V.; Wang, C. Phosphorus adsorption by functionalized biochar: A review. Environ. Chem. Lett. 2023, 21, 497–524. [Google Scholar] [CrossRef]
  24. Gao, S.; DeLuca, T.H. Wood biochar impacts soil phosphorus dynamics and microbial communities in organically-managed croplands. Soil Biol. Biochem. 2018, 126, 144–150. [Google Scholar] [CrossRef]
  25. Ahmed, W.; Jing, H.; Kaillou, L.; Qaswar, M.; Khan, M.N.; Jin, C.; Geng, S.; Qinghai, H.; Yiren, L.; Guangrong, L.; et al. Changes in phosphorus fractions associated with soil chemical properties under long-term organic and inorganic fertilization in paddy soils of southern China. PLoS ONE 2019, 14, e0216881. [Google Scholar] [CrossRef] [PubMed]
  26. Kahura, M.W.; Min, H.; Kim, M.S.; Kim, J.G. Assessing Phosphorus Availability in a High pH, Biochar Amended Soil under Inorganic and Organic Fertilization. Ecol. Resilient Infrastruct. 2018, 5, 11–18. [Google Scholar] [CrossRef]
  27. Zhang, G.; Zhao, Z.; Zhu, Y. Changes in abiotic dissipation rates and bound fractions of antibiotics in biochar-amended soil. J. Clean. Prod. 2020, 256, 120314. [Google Scholar] [CrossRef]
  28. Fan, J.; Wang, J.-Y.; Hu, X.-F.; Chen, F.-S. Seasonal dynamics of soil nitrogen availability and phosphorus fractions under urban forest remnants of different vegetation communities in Southern China. Urban For. Urban Green. 2014, 13, 576–585. [Google Scholar] [CrossRef]
  29. Nannipieri, P.; Giagnoni, L.; Landi, L.; Renella, G. Role of Phosphatase Enzymes in Soil; Springer: Berlin/Heidelberg, Germany, 2010. [Google Scholar] [CrossRef]
  30. Nannipieri, P.; Ascher, J.; Ceccherini, M.; Landi, L.; Pietramellara, G.; Renella, G. Microbial diversity and soil functions. Eur. J. Soil Sci. 2017, 54, 655–670. [Google Scholar] [CrossRef]
  31. Saha, S.; Prakash, V.; Kundu, S.; Kumar, N.; Lal Mina, B. Soil enzymatic activity as affected by long term application of farm yard manure and mineral fertilizer under a rainfed soybean-wheat system in N-W Himalaya. Eur. J. Soil Biol. 2008, 44, 309–315. [Google Scholar] [CrossRef]
  32. Kader, M.; Yeasmin, S.; Solaiman, Z.; De Neve, S.; Sleutel, S. Response of hydrolytic enzyme activities and nitrogen mineralization to fertilizer and organic matter application in subtropical paddy soils. Eur. J. Soil Biol. 2017, 80, 27–34. [Google Scholar] [CrossRef]
  33. Zhang, T.; Li, H.; Yan, T.; Shaheen, S.M.; Niu, Y.; Xie, S.; Zhang, Y.; Abdelrahman, H.; Ali, E.F.; Bolan, N.S.; et al. Organic matter stabilization and phosphorus activation during vegetable waste composting: Multivariate and multiscale investigation. Sci. Total. Environ. 2023, 891, 164608. [Google Scholar] [CrossRef] [PubMed]
  34. Chen, D.; Yu, X.; Song, C.; Pang, X.; Huang, J.; Li, Y. Effect of pyrolysis temperature on the chemical oxidation stability of bamboo biochar. Bioresour. Technol. 2016, 218, 1303–1306. [Google Scholar] [CrossRef] [PubMed]
  35. Atkinson, C.J.; Fitzgerald, J.D.; Hipps, N.A. Potential mechanisms for achieving agricultural benefits from biochar application to temperate soils: A review. Plant Soil 2010, 337, 1–18. [Google Scholar] [CrossRef]
  36. Wang, D.; Zhang, W.; Hao, X.; Zhou, D. Transport of Biochar Particles in Saturated Granular Media: E ff ects of Pyrolysis Temperature and Particle Size. Environ. Sci. Technol. 2013, 47, 821–828. [Google Scholar] [CrossRef] [PubMed]
  37. Liu, Z.; Dugan, B.; Masiello, C.A.; Gonnermann, H.M. Biochar particle size, shape, and porosity act together to influence soil water properties. PLoS ONE 2017, 12, e0179079. [Google Scholar] [CrossRef] [PubMed]
  38. Xu, L.; Islam, F.; Ali, B.; Pei, Z.; Li, J.; Ghani, M.A.; Zhou, W. Silicon and water-deficit stress differentially modulate physiology and ultrastructure in wheat (Triticum aestivum L.). 3 Biotech 2017, 7, 273. [Google Scholar] [CrossRef] [PubMed]
  39. Shi, L.-L.; Mortimer, P.E.; Ferry Slik, J.W.; Zou, X.-M.; Xu, J.; Feng, W.-T.; Qiao, L. Variation in forest soil fungal diversity along a latitudinal gradient. Fungal Divers. 2014, 64, 305–315 . [Google Scholar] [CrossRef]
  40. Liu, M.; Liu, J.; Chen, X.; Jiang, C.; Wu, M.; Li, Z. Shifts in bacterial and fungal diversity in a paddy soil faced with phosphorus surplus. Biol. Fertil. Soils 2018, 54, 259–267. [Google Scholar] [CrossRef]
  41. Deng, J.; Yin, Y.; Zhu, W.; Zhou, Y. Variations in soil bacterial community diversity and structures among different revegetation types in the Baishilazi nature reserve. Front. Microbiol. 2018, 9, 2874. [Google Scholar] [CrossRef]
  42. Han, G.; Lan, J.; Chen, Q.; Yu, C.; Bie, S. Response of soil microbial community to application of biochar in cotton soils with different continuous cropping years. Sci. Rep. 2017, 7, 10184. [Google Scholar] [CrossRef]
  43. Yu, H.; Yan, X.; Zheng, X.; Xu, K.; Zhong, Q.; Yang, T.; Liu, F.; Wang, C.; Shu, L.; He, Z.; et al. Differential distribution of and similar biochemical responses to different species of arsenic and antimony in Vetiveria zizanioides. Environ. Geochem. Heal. 2020, 42, 3995–4010. [Google Scholar] [CrossRef] [PubMed]
  44. Khan, A.; Anwar, Y.; Hasan, M.M.; Iqbal, A.; Ali, M.; Alharby, H.F.; Hakeem, K.R.; Hasanuzzaman, M. Attenuation of Drought Stress in Brassica Seedlings with Exogenous Application of Ca2+ and H2O2. Plants 2017, 6, 20. [Google Scholar] [CrossRef] [PubMed]
  45. Zhao, F.; Zhang, Y.; Dijkstra, F.A.; Li, Z.; Zhang, Y.; Zhang, T.; Lu, Y.; Shi, J.; Yang, L. Effects of amendments on phosphorous status in soils with different phosphorous levels. Catena 2019, 172, 97–103. [Google Scholar] [CrossRef]
  46. Wang, H.H.; Chu, H.L.; Dou, Q.; Xie, Q.Z.; Tang, M.; Sung, C.K.; Wang, C.Y. Phosphorus and nitrogen drive the seasonal dynamics of bacterial communities in Pinus forest rhizospheric soil of the Qinling Mountains. Front. Microbiol. 2018, 9, 1930. [Google Scholar] [CrossRef]
Figure 1. Partial least square-discriminant analysis (PLS-DA) of soil bacterial communities (a). PLS-DA of soil bacterial communities in paddy soil (b). PLS-DA of soil bacterial communities in red soil. (H) Paddy soil; (L) red soil; (15) 15 °C incubation temperature; (25) 25 °C incubation temperature; (C) Control; (B) addition of biochar; (P) inorganic P amendment.
Agronomy 14 00026 g001
Figure 2. Relative abundance of the soil bacterial phyla (a). Relative abundance of the soil bacterial phyla in paddy soil. (b). Relative abundance of the soil bacterial phyla in red soil. (H) Paddy soil; (L) red soil; (15) 15 °C incubation temperature; (25) 25 °C incubation temperature; (C) control; (B) addition of biochar; (P) inorganic P amendment.
Agronomy 14 00026 g002
Figure 3. Extended bar graph of bacterial phyla for different incubation temperatures (a). Extended bar graph of bacterial phyla in paddy soil for different incubation temperatures; (b). Extended bar graph of bacterial phyla in red soil for various incubation temperatures. (H) Paddy soil; (L) red soil; (15) 15 °C incubation temperature; (25) 25 °C incubation temperature.
Agronomy 14 00026 g003
Figure 4. Relative abundance of the bacterial genus (a). Relative abundances of the soil bacterial communities at the genus level in paddy soil. (b). Relative abundances of soil bacterial communities at the genus level in red soil. (H) Paddy soil; (L) red soil; (15) 15 °C incubation temperature; (25) 25 °C incubation temperature; (C) control; (B) addition of biochar; (P) inorganic P amendment.
Agronomy 14 00026 g004
Figure 5. Extended bar graph of bacterial communities at the genus level for different incubation temperatures (a). Extended bar graph of soil bacterial communities at the genus level in paddy soil for different incubation temperatures (b). Extended bar graphs of soil bacterial communities at the genus level in red soil for different incubation temperatures. (H) Paddy soil; (L) red soil; (15) 15 °C incubation temperature; (25) 25 °C incubation temperature.
Agronomy 14 00026 g005
Table 1. The basic properties of the experimental soils.
ParametersPaddy Soil (H)Red Soil (L)
pH5.295.12
Total P (g kg−1)2.540.56
available P (mg kg−1)11.23.48
Table 2. Significant levels (MANOVA) of the effects of biochar, DAP, incubation temperature, incubation intervals, and their interactions on soil properties.
Factors pHAvailable PAcid Phosphatase Activity
Soil TypesF Valuep-ValueF Valuep-ValueF Valuep-Value
Treatments (Trt.)Red soil280.93<0.001 *10,262.660.002 *3509.140.003 *
Paddy soil524.70<0.001 *10,234.78<0.001 *5094.32<0.001 *
DOIRed soil4.51<0.001 *699.56<0.001 *1.940.10
Paddy soil8.62<0.001 *694.60<0.001 *1.570.18
TRed soil0.030.850.670.410.050.83
Paddy soil3.030.091.980.160.090.77
DOI × Trt.Red soil1.020.44178.53<0.001 *1.910.06
Paddy soil1.970.05177.48<0.001 *2.91<0.001 *
DOI × TRed soil3.98<0.001 *8.42<0.001 *0.160.97
Paddy soil3.75<0.001 *10.60<0.001 *0.400.85
T × Trt.Red soil0.330.721.070.350.230.80
Paddy soil0.700.500.720.490.990.38
DOI × T × Trt.Red soil1.240.284.82<0.001 *2.620.01 *
Paddy soil1.450.186.47<0.001 *4.21<0.001 *
* Significant difference at p < 0.05; DOI: days of incubation; Trt: treatments; T: incubation temperature.
Table 3. Significant levels (MANOVA) of the effects of organic and inorganic amendments, incubation temperature, soil types, and their interactions on soil prosperities at 60 DOI.
PropertiesSoil TypesTrtTSoil * Trt.Trt. * TSoil * TSoil * Trt. * T
Fsig.Fsig.Fsig.Fsig.Fsig.Fsig.Fsig.
pH0.000.970.001.000.020.900.011.000.000.980.001.000.001.00
Available P0.230.640.001.000.040.840.001.000.001.000.001.000.001.00
Acid phosphatase0.000.950.030.970.000.980.001.000.000.980.001.000.001.00
Proteobacteria2.840.110.120.892.470.130.040.970.350.560.110.900.090.91
Gemmatimonadetes167.87<0.001 *0.090.9172.85<0.001 *0.120.8910.07<0.001 *0.150.860.260.78
Actinobacteria26.39<0.001 *0.470.637.080.01 *0.080.923.270.080.990.390.940.40
Chloroflexi946.53<0.001 *0.380.6991.97<0.001 *0.420.66102.09<0.001 *0.180.840.140.87
Acidobacteria781.69<0.001 *0.900.4240.03<0.0010.760.4838.44<0.001 *0.030.970.030.97
Planctomycetes58.65<0.001 *0.900.420.720.410.800.460.490.490.510.610.370.69
Firmicutes110.53<0.001 *0.050.950.180.670.080.930.520.480.090.920.100.91
Patescibacteria82.47<0.001 *1.230.315.710.03 *0.670.524.070.060.280.760.140.87
Bacteroidetes6.680.02 *0.110.903.370.080.030.970.480.500.030.970.150.87
* Significant difference at p < 0.05; Days: incubation intervals; Trt: treatments; T: incubation temperature.
Table 4. Correlation between soil pH, available P, acid phosphatase, and the most abundant bacterial genus at 60 DOI.
Paddy SoilRed Soil
PhylumGenuspHAvailable PAcid
Phosphatase
PhylumGenuspHAvailable PAcid
Phosphatase
ProteobacteriaBradyrhizobium−0.43−0.51 *0.50 *FirmicutesSporosarcina−0.11−0.270.58 *
PlanctomycetesIsosphaera−0.14−0.160.11FirmicutesBacillus−0.58 *−0.58 *0.59 **
ActinobacteriaMicromonospora−0.12−0.050.07FirmicutesPaenibacillus−0.38−0.47 *0.22
ProteobacteriaVulgatibacter0.280.33−0.32ActinobacteriaStreptomyces0.13−0.190.25
ProteobacteriaMesorhizobium−0.53 *−0.57 *0.56 *ProteobacteriaCaulobacter0.50 *0.38−0.07
ProteobacteriaPhenylobacterium0.330.25−0.22ProteobacteriaAquabacterium0.49 *0.44−0.08
FirmicutesPaenibacillus0.160.26−0.23ProteobacteriaPseudomonas0.080.110.34
ProteobacteriaMicrovirga−0.24−0.270.26ProteobacteriaSphingomonas−0.16−0.210.20
AcidobacteriaCandidatus_Solibacter−0.09−0.040.07ProteobacteriaFrateuria0.03−0.06−0.21
AcidobacteriaBryobacter−0.29−0.290.33ProteobacteriaSphingobium−0.58 *−0.450.73 **
FirmicutesSporosarcina0.310.44−0.40ProteobacteriaAchromobacter0.59 **0.724 **−0.59 **
ProteobacteriaMassilia0.240.22−0.21FirmicutesCohnella−0.22−0.420.34
ActinobacteriaJatrophihabitans0.250.19−0.26ActinobacteriaSinomonas−0.030.22−0.69 **
ActinobacteriaStreptomyces−0.49 *−0.440.43FirmicutesLysinibacillus0.15−0.110.44
BacteroidetesArcticibacter−0.31−0.400.43ProteobacteriaMassilia0.62 **0.17−0.65 **
ActinobacteriaMicrobispora−0.39−0.30.35ProteobacteriaAcinetobacter−0.36−0.340.57 *
ActinobacteriaAnaeromyxobacter−0.090.000.04ProteobacteriaOchrobactrum0.030.000.14
ProteobacteriaMethylibium−0.19−0.200.16ActinobacteriaMicromonospora−0.23−0.090.06
ProteobacteriaBacillus0.340.26−0.25ProteobacteriaBrevundimonas0.52 *−0.040.16
ProteobacteriaPseudolabrys−0.44−0.440.44FirmicutesSolibacillus0.130.080.04
* p < 0.05; ** ≤ 0.001.
Disclaimer/Publisher’s Note: The statements, opinions and data contained in all publications are solely those of the individual author(s) and contributor(s) and not of MDPI and/or the editor(s). MDPI and/or the editor(s) disclaim responsibility for any injury to people or property resulting from any ideas, methods, instructions or products referred to in the content.

