Article

Integrated miRNA and mRNA Transcriptome Analysis Reveals Eggplant’s (Solanum melongena L.) Responses to Waterlogging Stress

College of Horticulture and Landscape Architecture, Yangzhou University, Yangzhou 225009, China
*
Author to whom correspondence should be addressed.
These authors contributed equally to this work and share first authorship.
Agronomy 2023, 13(9), 2215; https://doi.org/10.3390/agronomy13092215
Submission received: 8 August 2023 / Revised: 21 August 2023 / Accepted: 23 August 2023 / Published: 24 August 2023

Abstract

:
Waterlogging stress poses a significant threat to eggplants (Solanum melongena L.), causing root oxygen deficiency and subsequent plant damage. This study aims to explore the morphological changes and chlorophyll and lignin indicators of eggplant seedlings under different time points (0, 3, 6, 12, 24, 48 h) of waterlogging stress. High-throughput sequencing was used to identify differentially expressed miRNAs and mRNAs in response to waterlogging stress in eggplants. The results showed that the content of chlorophyll a significantly decreased during the early stage of waterlogging stress, while the degradation of chlorophyll b intensified with prolonged stress, and carotenoid content remained relatively stable. Additionally, this study investigated changes in root lignin, indicating its role in enhancing cell wall stability and tolerance to cope with hypoxic stress. Using DESeq2, 246 differentially expressed miRNAs were identified, among which significant changes were observed in the miR156, miR166, miR167, and miR399 families. These miRNAs may play a crucial regulatory role in eggplant’s adaptation to the hypoxic environment after waterlogging stress. Gene Ontology (GO) and Kyoto Encyclopedia of Genes and Genomes (KEGG) analyses revealed that differentially expressed genes were mainly related to cellular physiological processes, metabolic processes, and the biosynthesis of secondary metabolites, influencing the seedlings’ stress resistance under different waterlogging conditions. Furthermore, by constructing a regulatory miRNA–target gene network that pertains to eggplant’s response to waterlogging stress, we have laid the foundation for revealing the molecular mechanisms of eggplant’s response to waterlogging stress.

1. Introduction

Eggplant (Solanum melongena L.) is an important vegetable crop in the Solanaceae family that is cultivated globally. However, open-field eggplant cultivation is susceptible to flooding stress due to changes in seasonal rainfall patterns. Prolonged periods of rainy weather during the reproductive stage can lead to waterlogging stress. The harmful effects of waterlogging on plant growth are not solely caused by excess water; rather, it is primarily due to the water in the soil obstructing gas exchange between the plant and the atmospheric environment, resulting in root oxygen deficiency [1]. This impedes respiration, nutrient uptake, and transport, causing the plant to switch from aerobic respiration to anaerobic respiration, leading to secondary stress [2]. Consequently, this has severe implications for plant morphology, physiology, and biochemistry. During waterlogging stress, the diffusion rate of oxygen in water is approximately 1000 times slower than in air, leading to ethylene accumulation in the flooded roots, exerting a toxic effect on the plants [3]. Oxygen deficiency in the root zone reduces water and mineral uptake rates, inhibits primary root growth, and causes shallow and thinner roots with significantly reduced root hairs [4]. Moreover, under anaerobic conditions, the root system generates toxic substances such as alcohol and lactic acid, leading to root rot and death [5]. Although, in most cases, the root system of vegetable crops suffers the most under waterlogging stress, in practical agricultural production, symptoms of root waterlogging stress are challenging to observe. On the other hand, when subjected to waterlogging stress, stems and leaves exhibit noticeable symptoms such as slow stem growth, stunted plant stature, and the wilting of leaves [6].
MicroRNAs (miRNAs) are small single-stranded RNA molecules that are typically composed of 21–22 nucleotides and located in the non-coding region of the genome [7]. These miRNAs serve as vital regulatory factors in gene expression by targeting the mRNA (messenger RNA) for cleavage or inhibiting translation. In the context of plant waterlogging stress, miRNAs have been shown to play a critical role, particularly in the regulation of gene expression under low-oxygen conditions. Previous research has highlighted the importance of miRNAs in the response to water deficit in various plant species. For instance, in common bean (Phaseolus vulgaris L.), miR398 and miR2119 have been associated with the coordinated upregulation of CSD1 and ADH1 mRNAs in response to water deficit [8]. Additionally, the differential expression of certain miRNAs from the tasiRNA families has been observed in Arabidopsis (Arabidopsis thaliana) under 48 h of hypoxia [9]. In Nelumbo nucifera, NNU_Far-miR159, NNU_GMA-miR393h, and NNU_Aly-miR319c-3p were found to play crucial regulatory roles in the lotus response to flooding [10]. Moreover, several miRNAs, including miR159, miR164, miR167, miR393, miR408, and miR528, have been identified as key contributors to root development and stress responses in plants. Notably, their pivotal regulatory roles have also been identified under short-term waterlogging conditions in three different maize (Zea mays L.) inbred lines [11]. These findings underscore the significant role of miRNAs in mediating plant responses to waterlogging stress. The emergence of high-throughput sequencing technology has greatly facilitated research on miRNAs. miRNA sequencing (miRNA-seq) has become an important approach for miRNA discovery and analysis. In the field of vegetable stress-resistant breeding, high-throughput sequencing holds significant importance for studying changes in gene expression under waterlogging stress in plants. These differentially expressed genes are often associated with specific biological processes, providing clues for a deeper understanding of the mechanisms of plant responses to waterlogging conditions. Despite the availability of genomic references for eggplant, the gene annotation of the eggplant genome remains incomplete. To gain a better understanding of gene expression at the RNA level, an improved assembly of reference transcriptional data is required to elucidate the mechanisms of eggplant responses to waterlogging conditions [12].
In this study, different waterlogging conditions were analyzed using high-throughput sequencing technology to explore the transcriptional regulatory patterns of miRNAs in eggplants. Differential expression analysis was performed using DESeq2, followed by GO (Gene Ontology) and KEGG (Kyoto Encyclopedia of Genes and Genomes) analysis. By integrating mRNA sequencing data, we explored the interactions between miRNAs and target genes, leading to the identification of four miRNA families that are likely to play a critical role in eggplant’s response to waterlogging stress. This finding will serve as a key factor for further exploring regulatory networks and signal transduction pathways. The goal of this paper is to identify and characterize differentially expressed miRNAs using high-throughput sequencing. By employing this advanced technology, our intention was to provide valuable insights into the regulatory mechanisms of eggplant miRNAs in response to water stress. These results may have important implications for improving water stress tolerance in crops and sustainable agricultural development.

2. Materials and Methods

2.1. Plant Materials and Treatments

The eggplant cultivar “R2016” used in this study was obtained from the eggplant molecular breeding laboratory at Yangzhou University. The seeds were soaked in 55 °C water, wrapped in gauze, and then incubated in a climate chamber with an air temperature of 25 °C to promote germination. After germination, the seedlings were transferred to a controlled environment with a temperature range of 20–30 °C, 75% humidity, and a light intensity of 800 µmol m−2 s−1 until the seedlings developed 3–4 true leaves. The treatment method employed for simulating waterlogging stress involved placing eggplant seedlings within 50 mL centrifuge tubes filled with water, with the water level surpassing the entire root system of the eggplant. All other environmental parameters were maintained consistent with the aforementioned cultivation methods. Each treatment was replicated with 21 seedlings (one standard tray). Sampling was conducted at multiple time points, specifically 3, 6, 12, 24, and 48 h, with three biological replicates at each time point. All the aforementioned samples were used for expression profiling, while some materials were subjected to small RNA sequencing (performed by Dikang Jinnuo Biotechnology Co., Ltd., Nanjing, China) [13]. SPAD (Soil-Plant Analysis Development) values were determined using a portable chlorophyll meter, SPAD-502plus ((JAXA, Remote Sensing Technology Center of Japan, Chuo-ku, Sagamihara, Kanagawa, Japan). Three randomly selected plants were used, and the SPAD values of the top three leaves of each plant were measured with the meter. Three different positions on each leaf, avoiding the main vein, were randomly chosen for measurement, and the average value of the three positions was taken as one replicate, with three replicates conducted for each measurement. Chlorophyll a, chlorophyll b, and carotenoid contents were determined using the Plant Chlorophyll Content Assay Kit from BoxBio (Beijing BoxBio Science & Technology Co., Ltd., Beijing, China). Lignin content was measured using the Lignin Content Assay Kit (Solaibao Biotechnology Co., Ltd., Beijing, China), following the instructions provided in their respective manuals.

2.2. Expression Profiling (Transcriptome) Database Sequencing Process

The transcriptome database sequencing process involved a series of steps to detect and prepare total RNA samples. The initial assessment of RNA concentration and purity was performed using Nanodrop. The accurate quantification of RNA concentration required the use of Qubit 3.0 (Thermo Fisher Scientific, Waltham, MA, USA), and RNA integrity was evaluated via the RIN value using the Agilent 2100 system (Agilent Technologies, Santa Clara, CA, USA).
Following sample preparation, library construction and quality control procedures were carried out. For eukaryotic mRNA enrichment, mRNA Capture Beads were employed, while prokaryotic samples underwent rRNA (ribosomal RNA) removal to enrich the mRNA. Subsequently, the mRNA was achieved through high temperature and metal ions. Single-stranded cDNA (complementary DNA) was synthesized from the fragmented mRNA using random hexamers as primers, followed by the synthesis of double-stranded cDNA, which was purified using DNA Clean Beads. The double-stranded cDNA underwent A tail modification for sequencing link connection. DNA Clean Beads were used for fragment size sorting. The final library was obtained through PCR amplification and purified using DNA Clean Beads. Library concentration was determined using Qubit 3.0, and the library insert analysis was performed using the Agilent 2100 Bioanalyzer. The effective concentration of the library was accurately quantified using the ABI Step One Plus Real-Time PCR system (Applied Biosystems, Foster City, CA, USA) [14,15,16,17]. Upon successful library construction and quality control, online sequencing was conducted using the Illumina HiSeq platform (Illumina, Inc., San Diego, CA, USA). Different libraries were pooled according to their effective concentration and the desired data volume.
For the construction and sequencing of small RNA libraries, quality assessment was carried out on the total RNA samples. RNA joints were added at both ends, leveraging the unique structure of RNA with complete phosphoric acid groups at the 5’ ends and hydroxyl groups at the 3’ ends. Subsequently, DNA was synthesized using reverse transcriptase, followed by PCR amplification. DNA fragments were separated using a 6% PAGE (Polyacrylamide Gel Electrophoresis) gel. The small RNA molecules of 145–160 base pairs (22–30 nucleotides) in length, along with the total fragment length of the two end joints, were recovered through gel extraction. These results were compiled to form a small RNA library. Preliminary concentration determination was carried out using Qubit 3.0, and the insertion fragments of the library were identified using the Agilent 2100 Bioanalyzer. The effective concentration of the library was accurately quantified using the ABI Step One Plus Real-Time PCR system. Single-ended sequencing (SE50) was performed on the HiSeq platform to obtain 50 base pair reads of qualified fragments [18].

2.3. RNA Information Analysis Program

2.3.1. Assembly and Annotation of Transcriptome Sequencing Data

To assemble the transcriptome sequencing data, we utilized the Trinity software (v 2.8.5) and followed the steps outlined below:
  • Inchworm: We constructed a k-mer library with a k-mer size of 25. Low-frequency k-mers were filtered out, and the most frequent k-mer, excluding complexity and single k-mers, was selected as the seed. The k-1 length overlap between k-mers was used to extend the seeds until a linear contig was formed.
  • Chrysalis: Contig sets that potentially contained variable splicing and other parallel genes were identified and defined as components. De Bruijn graphs were constructed for each component, and read validation was performed to determine the reads supporting each component.
  • Butterfly: A linear path with continuous nodes was merged to form longer sequences in the de Bruijn graph. Bifurcations, likely caused by sequencing errors and rarely supported by reads, were eliminated to ensure even edges. The following steps were carried out: scoring with a dynamic programming algorithm, identifying the path supported by reads and read pairs, and eliminating the path supported by reads. The resulting Trinity assembly was referred to as Unigene.
The assembled Unigenes underwent a removal step to eliminate duplicates and were further stitched together using Tgicl (TIGR Gene Indices Clustering tools). Subsequently, clustering based on homologous transcripts was performed to achieve the final set of Unigenes. If multiple samples from the same species were sequenced, the Unigenes assembled from different samples were further processed through the aforementioned steps to obtain a non-redundant Unigene [17].
Following clustering with homologous transcripts, Unigenes were categorized into two groups. One group represented clusters, which consisted of several Unigenes with high similarity (>70%) grouped together under the same cluster name (starting with CL, followed by the gene family number). The remaining Unigenes were classified as singletons (starting with Unigene), representing individual Unigenes.
Finally, the direction of the Unigene sequence was determined through a blastx comparison against protein databases, including NR (Non-Redundant), Swiss-Prot, KEGG, and COG (Clusters of Orthologous Groups), with an e-value threshold of <0.00001. The most similar protein hit was used to determine the sequence direction of the Unigene. In cases where the results were contradictory between different libraries, the priority order of NR, Swiss-Prot, KEGG, and COG was followed. If the direction of the Unigene sequence could not be determined based on these libraries, the sequence direction was obtained from the assembly software.
The Unigene sequences were annotated using the NR, NT (Nucleotide database), Swiss-Prot, KEGG, COG, and GO databases, and functional annotation information for the assembled reference Unigenes was obtained [19].

2.3.2. Quantitative, Differential and Functional Enrichment Analysis of Sequencing Data of Expression Profiles

The clean reads were compared to the reference sequence using alignment software. After alignment, the distribution and coverage of the reads on the reference sequence were counted to determine whether the alignment results passed the second quality control process (quality evaluation of the alignment results). If the quality was suitable, a series of follow-up analyses, such as gene expression, gene structure optimization, variable splicing, prediction, and the annotation of new transcripts, were performed [20]. Finally, the differentially expressed genes were screened based on gene expression. From the differentially expressed genes and the assembled Unigene function annotation results, GO functional enrichment, KEGG pathway function enrichment, and protein interaction network analyses were performed.

2.3.3. Small RNA Information Analysis Scheme

In the analysis of small RNA information, the reads obtained from HiSeq sequencing underwent processing using specific software tools with designated versions. Initially, we employed Trimmo-matic (v0.36) for trimming and filtering reads, eliminating adapter sequences and low-quality bases. Subsequently, we conducted quality assessment and determined read lengths utilizing FastQC (v0.11.5). The processed reads were then classified and annotated by aligning them against the miRBase database (v22.1) with the help of Bowtie (v1.2.2). New miRNAs were predicted using miRDeep2 (v0.0.7) or miRQuest (v1.0). For subsequent analyses, we utilized software tools such as DESeq2 (v1.20.0), edgeR (v3.22.3), and limma (v3.38.3) [21,22,23] to perform differential analysis, cluster analysis, target gene prediction, GO functional annotation, and KEGG pathway annotation on both established and novel miRNAs.

2.3.4. Differential Expression Analysis

The input data for the gene differential expression analysis consisted of read counts corresponding to miRNA expression levels obtained from miRNA profiling analysis. The analysis was performed using the DESeq2 package in the R programming language. A filtering threshold of |log2 fold change| > 1 and p-value < 0.05 was applied to identify significantly differentially expressed miRNAs. For both the known and novel miRNAs identified, miRNA target gene prediction analysis was conducted. As individual software predictions often yield a large number of target genes, this study employed the intersection of results from two software programs, namely Target Finder v1.0 and psRobot v2013, as the final set of predicted target genes. Based on the relationship between miRNAs and their target genes, GO functional analysis and KEGG enrichment analysis were performed on the target gene sets associated with the differentially expressed miRNAs in each group.

2.4. qRT-PCR Assay

The qRT-PCR analysis was performed using well-established protocols to assess the transcript expression levels of the selected genes [24]. To ensure the accuracy and consistency of the findings, we utilized four independent biological replicates for each target gene during the evaluation of transcript expression levels.

2.5. Statistical Calculations

The statistical analysis data were analyzed utilizing Microsoft Office Excel 2019 and IBM SPSS Statistics 26. To assess the variations among the samples, a one-way analysis of variance (ANOVA) was conducted, followed by Tukey’s test (p < 0.01) for post hoc comparisons.

3. Results

3.1. Morphological and Physiological Differences in Eggplants Grown under Different Waterlogging Conditions

According to the phenotype observations, the leaves of eggplant seedlings gradually droop as the waterlogging time extended during the sampling period. As the waterlogging persisted, the seedlings eventually ceased to grow, and the leaves started to decay and fall off. Eventually, under such waterlogged conditions, the entire plant perished (Figure 1A). We conducted measurements of SPAD, chlorophyll a, chlorophyll b, and carotenoid contents after subjecting the seedlings to different durations of waterlogging stress. The results indicated that with the increasing severity of waterlogging stress, the chlorophyll content decreased significantly, and a significant difference was observed after 48 h of waterlogging. Specifically, chlorophyll a exhibited a significant decline at the initial stages of waterlogging and reached its lowest value at 48 h. On the other hand, chlorophyll b showed no significant reduction during the initial stages of waterlogging, but a significant difference was observed after 48 h. Interestingly, the carotenoid content appeared to be insensitive to the escalating waterlogging conditions (Figure 1B). The above findings suggest that the oxygen deficiency resulting from waterlogging stress might cause the degradation of photosynthetic pigments in eggplant leaves. The oxygen limitation caused by waterlogging conditions restricts the supply of oxygen within the leaf, thereby affecting the synthesis and stability of chlorophyll, resulting in a significant decline in SPAD values, chlorophyll a, and chlorophyll b content. Additionally, we measured the lignin content in the root system under the aforementioned treatments. The results indicated a significant increase in eggplant root lignin content after 48 h of waterlogging stress compared to the control, suggesting that prolonged root oxygen deficiency conditions might induce the synthesis or accumulation of root lignin.

3.2. Analysis of Differential Gene Expression under Different Waterlogging Conditions

We conducted an analysis on differentially expressed mRNAs using DESeq2. The most significant difference was observed in the comparison between 0 h and 48 h, with 1832 Unigenes showing differential expression. This was followed by the comparison between 6 h and 48 h, with 1279 Unigenes exhibiting differential expression. On the other hand, the smallest difference was observed in the comparison between 12 h and 24 h, with only 42 Unigenes showing differential expression. This was followed by the comparison between Sm3h and Sm6h, with 43 Unigenes exhibiting differential expression. Notably, 12 h-vs.-24 h, 3 h-vs.-6 h, and 6 h-vs.-12 h had relatively low total numbers of differentially expressed genes (Figure 2A). In this study, we focused on the differential expression analysis of the sequencing results at 3 h and 48 h under waterlogging stress (Figure 2B). We selected the top ten Unigenes with the most significant differential expression based on FPKM values using DESeq2 analysis (Figure 2C). The results indicated that the expression level of Unigene757 exhibited a continuous upward trend under progressively intensifying waterlogging stress. Unigene7248, Unigene17030, Unigene32801, Unigene19616, and Unigene11109 were significantly upregulated within the initial 3 h of waterlogging stress and subsequently displayed a decrease in expression level. Unigene23518, Unigene24587, and Unigene25558 maintained relatively high expression levels throughout the waterlogging stress period, while Unigene18892 reached its peak expression level after 6 h of waterlogging stress, followed by a gradual decline.

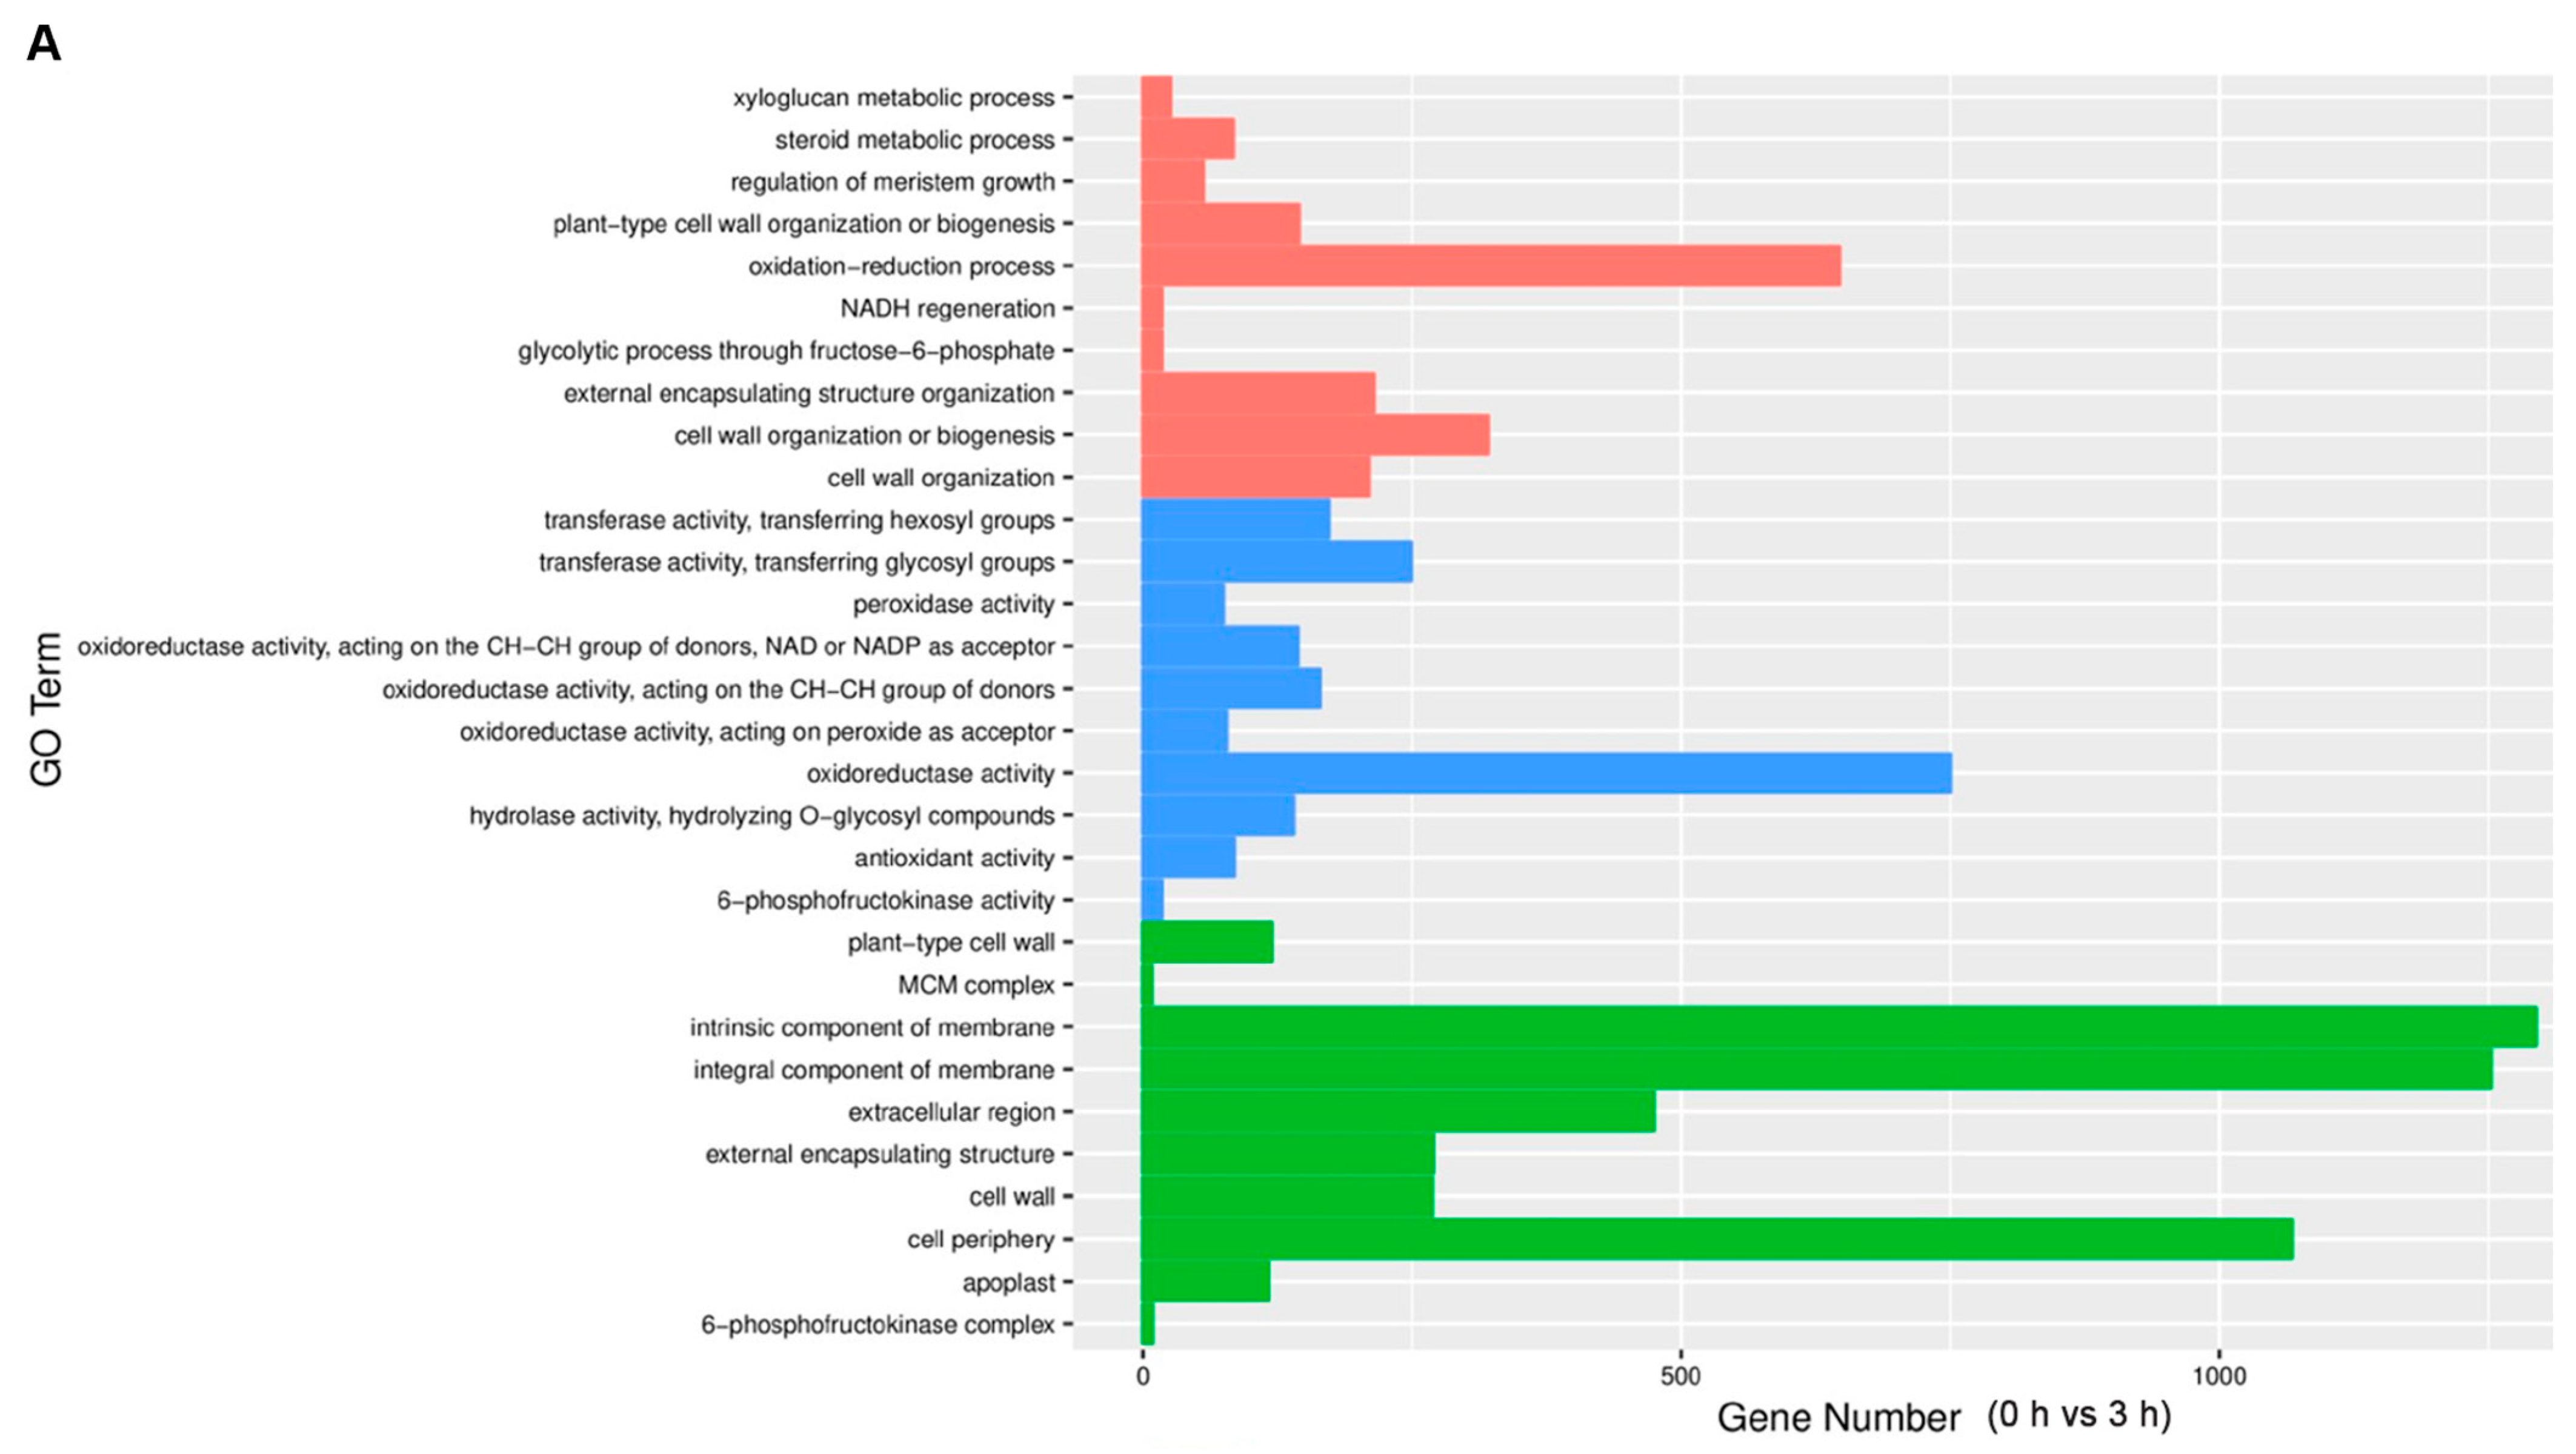
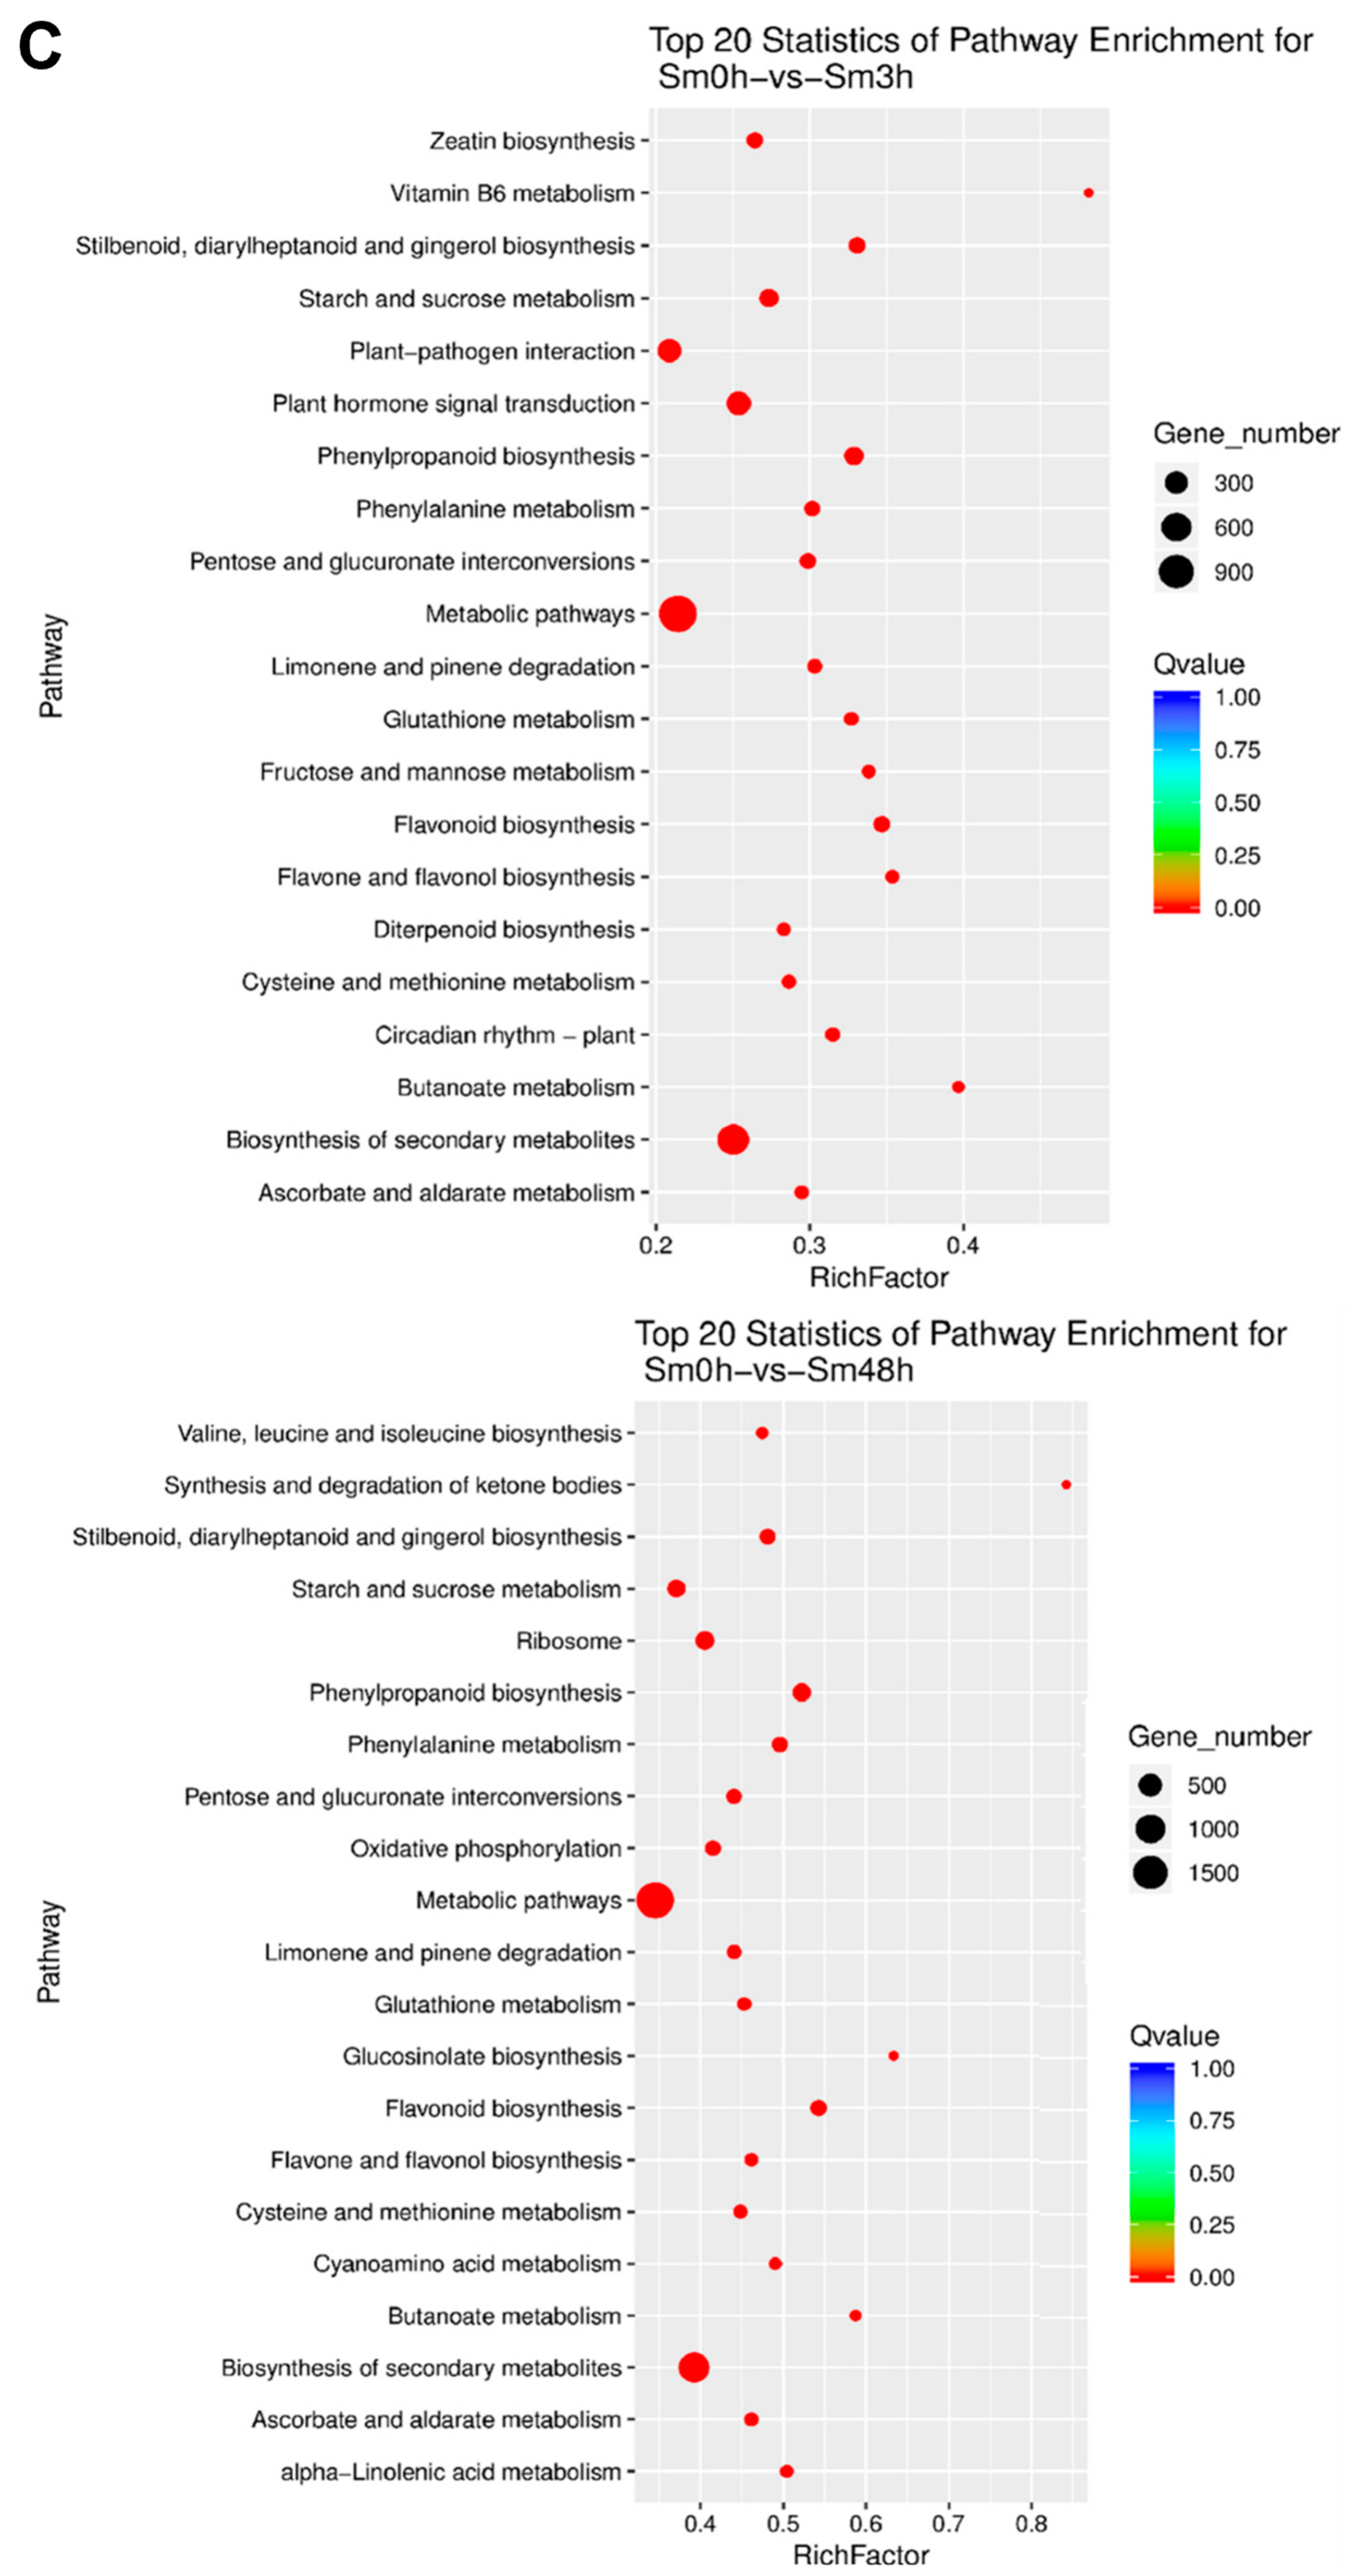
3.3. Functional Analysis of Differentially Expressed Genes under Different Waterlogging Conditions (GO and KEGG Pathway)

We performed GO functional enrichment analysis on the differentially expressed genes for between 0 h and 3 h while the eggplant seedlings were subjected to waterlogging stress. We selected the top 10 GO terms with the highest enrichment levels in the categories of biological processes, cellular components, and molecular functions. In the biological processes category, the significantly enriched term was the oxidation–reduction process (GO: 0055114). In the molecular functions category, the significantly enriched term was oxidoreductase activity (GO: 0016491). In the cellular components category, the significantly enriched terms were the intrinsic component of membrane (GO: 0031224) and integral component of membrane (GO: 0016021). For the differentially expressed genes between 0 h and 48 h of eggplant under waterlogging stress, GO functional enrichment analysis was conducted. In the biological processes category, the significantly enriched term was the oxidation–reduction process (GO: 0055114). In the molecular functions category, the significantly enriched term was oxidoreductase activity (GO: 0016491). In the cellular components category, the significantly enriched term was cell periphery (GO: 0071944). Based on these results, it can be inferred that the enriched GO terms in the three components (biological processes, molecular functions, and cellular components) were mostly the same between the 3 h and 48 h of eggplant under waterlogging stress. However, the significant enrichment of cell periphery-related genes in the 48 h suggests that prolonged hypoxic conditions after the aggravation of waterlogging stress lead to significant changes in gene expression regulation in the cell periphery region. Receptor and channel proteins on the cell membrane may play a crucial role in water regulation. Additionally, we noticed that the number of annotated GO terms was higher at 48 h compared to 3 h, indicating that eggplant exhibits more complex and extensive biological responses under 48 h of waterlogging stress (Figure 3A). Prolonged waterlogging stress may induce more persistent biological responses in eggplant, involving a greater number of molecular and physiological changes to adapt to prolonged water stress (Figure 3B). The KEGG enrichment results showed that the annotated pathways of differentially expressed genes were largely consistent between the 3 h and 48 h under waterlogging stress. The differentially expressed genes were primarily involved in Metabolic pathways and Biosynthesis of secondary metabolites. This phenomenon suggests that eggplant may regulate fundamental metabolic pathways and synthesize secondary metabolites to cope with environmental changes and stress under waterlogging conditions (Figure 3C).

3.4. Classification Annotation of Small RNAs (sRNAs)

The annotation information of all sRNAs against various RNA classes was summarized. It is possible for an sRNA to align with multiple annotation data simultaneously. To assign a unique annotation to each unique sRNA, the following priority order was used for traversing sRNAs: rRNAetc > known miRNA > piRNA > repeat > exon > intron. For sRNAs that did not match any annotation information, the term “unann” was used. The priority order between Genbank and Rfam, which are two databases used for obtaining rRNAetc, was defined as Genbank > Rfam. The alignment results of all sRNAs to different types of RNA are presented in Table 1 and Table 2.

3.5. Differential Expression Analysis of miRNAs under Different Waterlogging Conditions

We performed the analysis on differentially expressed miRNAs using DESeq2. We observed that waterlogging stress at 3 h resulted in the highest number of upregulated miRNAs compared to the control, with a relatively small number of downregulated miRNAs. Conversely, waterlogging stress at 48 h mainly led to downregulated miRNAs, with very few upregulated or equally expressed miRNAs (Figure 4).

3.6. Prediction of Target Gene Loci

Target gene prediction was conducted for known miRNAs and differentially expressed known miRNAs. Target Finder and psRobot were used to predict the target gene [25,26]. The intersection or union was included in the prediction result (Table 3).

3.7. GO Enrichment Analysis of miRNA Target Genes

In this study, we separately performed enrichment analyses of predicted target genes with respect to their molecular function (MF), cellular component (CC), and biological process (BP). Under waterlogging stress, the differential expression of miRNA target genes in eggplant at 0 h versus 3 h was analyzed for GO functional enrichment. A total of 29 GO terms were annotated, including 15 enriched terms in the biological process category, 11 in the cellular component category, and 3 in the molecular function category. Significantly enriched biological process terms included metabolic process (GO:0008152), cellular process (GO:0009987), and single-organism process (GO:0044699). In the cellular component category, the significantly enriched terms were cell (GO:0005623), cell part (GO:0044464), and organelle (GO:0043226). The significantly enriched term in the molecular function category was binding (GO:0005488) and catalytic activity (GO:0003824). Similarly, GO functional enrichment analysis was performed for differentially expressed miRNA target genes in eggplant at 0 h versus 48 h under waterlogging stress, resulting in the annotation of 41 GO terms. Among them, 20 terms were enriched in the biological process category, 12 in the cellular component category, and 9 in the molecular function category. The significantly enriched terms were the same as those observed at 3 h. Taken together, these results indicate that there is a substantial overlap in the enriched GO terms for differentially expressed miRNA target genes in eggplant under waterlogging stress at 3 h and 48 h. However, both the number of annotated GO terms and the enrichment of miRNA target genes in each term were greater at 48 h compared to 3 h. This suggests that, as waterlogging stress intensifies, the miRNA response becomes more complex. It can be speculated that, under more severe waterlogging stress, a greater number of miRNAs are involved in regulating downstream target genes to protect plants from damage (Figure 5).

3.8. The KEGG Metabolic Pathway Analysis of miRNA-Targeted mRNA

Pathway enrichment analysis can help identify the main metabolic pathways. The results showed that differentially expressed target genes were mainly involved in three plant metabolic pathways, namely Propanoate metabolism, the Ethanol metabolic pathway, and the Pentose phosphate pathway. Specifically, they mainly participated in the synthesis and metabolism of alcohol dehydrogenase, pyruvate decarboxylase, and Phosphofructokinase-1. It is worth noting that Alcohol dehydrogenase (NADP+), a key enzyme in the Ethanol metabolic pathway, plays a crucial role in the response to waterlogging stress for 48 h. This response was not observed in other treatments, indicating that prolonged waterlogging stress leads to root hypoxia, resulting in ethanol accumulation. The active response of the enzymes in the Ethanol metabolic pathway in respiration serves to alleviate the damage (Figure 6).

3.9. Prediction of the miRNA–Target Gene Interaction Network

To investigate the regulatory miRNA–target gene network, which is involved in the response of eggplant to waterlogging stress, the differentially expressed miRNAs and target genes at 3 h and 48 h of waterlogging stress were analyzed using Cytoscape v3.10.0. Ultimately, we obtained 126 and 106 miRNA–target gene pairs, respectively. In the network diagram shown in Figure 7, the interactions between miRNAs and target genes are represented by gray lines, while the relative expression levels of genes are displayed in different colors.

3.10. qRT-PCR Verification

In order to detect gene expression and verify the sequencing results, eight genes with specific expression were selected for further analysis. Specific primers were designed based on coding region sequences identified from the database (Bioengineering Limited by Share Ltd. Shanghai, China. Table S1).
Among these genes, the expression levels of CL1964Contig3 and Unigene8533 were generally increased under water stress conditions, which were significantly different from those of the control group. In addition, the expression levels of CL3246Contig1, CL2137Contig2, CL8240Contig2, Unigene13435, and Unigene28095 were generally decreased under water stress. In addition, the expression level of Unigene19667 showed a trend of first decreasing and then increasing (Figure 8).

4. Discussion

Waterlogging stress can lead to oxygen deficiency in plant roots and cause a rapid shift in metabolism from aerobic respiration to anaerobic respiration, resulting in rapid changes in gene transcription and protein synthesis. In this study, we observed the morphological changes and changes in chlorophyll and lignin indicators of eggplant seedlings under waterlogging stress conditions for 0, 3, 6, 12, 24, and 48 h. We found that, during the initial stages of waterlogging stress, the content of chlorophyll a in plant leaves significantly decreased under hypoxic conditions, possibly due to the inhibition of chlorophyll a synthesis or its accelerated degradation. Chlorophyll a reached its lowest value at 48 h, indicating its sensitivity to waterlogging stress. Meanwhile, the decrease in chlorophyll b was not significant during the early stages of waterlogging stress, possibly due to its delayed response to hypoxia. However, with prolonged exposure to waterlogging stress, the degradation of chlorophyll b intensified, showing a significant difference at 48 h. Interestingly, the content of carotenoids, an essential antioxidant that aids plants in combating oxidative stress and damage, seemed to remain relatively stable during the aggravation of waterlogging stress. Previous studies have shown that waterlogging stress significantly affects the content of chlorophyll a and chlorophyll b in plant leaves, indirectly and directly influencing the photosynthetic mechanism and leading to a decline in plant yield [27,28]. In our study, we speculated that the synthesis or degradation of carotenoids under waterlogging stress may be regulated by other factors, keeping their content relatively stable, similar to findings in waterlogging-tolerant chili pepper research [29]. Additionally, this study also explored the changes in root lignin under waterlogging stress. Lignin is a complex natural organic compound mainly present in plant cell walls and is an important component of plant xylem [30]. When plants face stress such as waterlogging, bacterial infection, or drought, they may respond by regulating lignin synthesis [31]. Studies have found that lignin synthesis genes in the roots of flax (Linum usitatissimum) are upregulated under waterlogging stress [32]. Under waterlogging stress, the plant roots may experience limited oxygen supply, leading to restricted cellular metabolism and energy production. To cope with the hypoxic stress, plants may enhance root lignin synthesis to improve cell wall stability and tolerance. Moreover, the increased lignin content caused by waterlogging may be related to the adaptability of roots to waterlogging stress [33]. Roots are vital organs for plants to absorb water and nutrients from the soil, and the adaptive regulation of roots may be one of the important strategies for plants to survive and resume growth in waterlogged environments. The accumulation of lignin may provide better protection for the roots.
Previous studies have shown that miRNAs play an important role in the morphological response of maize crown roots to waterlogging stress. Waterlogging stress leads to the downregulation of multiple miRNAs, which affects the expression of related genes [34]. In this study, eggplant seedlings were subjected to waterlogging treatment for 0, 3, 6, 12, 24, and 48 h, and 246 differentially expressed miRNAs were identified. After analysis and screening, significantly differentially expressed miRNAs were mainly found in the miR156, miR166, miR167, and miR399 families. These results indicate the widespread presence of conserved miRNAs in eggplant, which may play an important regulatory role in eggplant’s adaptation to the hypoxic environment after waterlogging stress [35]. In the plant’s response to external environmental factors, miRNAs affect the physiological functions of plants by regulating the expression of target genes. Based on the predicted target genes of miRNAs and the differentially expressed genes identified by transcriptome sequencing, GO and KEGG analyses were performed. The results showed that differentially expressed genes were mainly involved in cellular physiological processes, metabolic processes, and the biosynthesis of secondary metabolites in response to waterlogging stress, indicating that the differentially expressed miRNAs in eggplant regulate the expression of target genes related to environmental adaptation, thereby affecting the stress resistance of seedlings under different waterlogging stress conditions. Previous research has found that, in cucumber, target genes related to cellular redox homeostasis, cytoskeleton, photosynthesis, and cell growth are overexpressed under waterlogging stress, indicating that cell-related biological processes play an important role in responding to waterlogging stress [36]. In this study, we found that differentially expressed target genes are mainly involved in the synthesis and metabolism pathways of alcohol dehydrogenase, pyruvate decarboxylase, and fructokinase-1. Waterlogging stress leads to inadequate oxygen supply in cells, resulting in oxidative stress. Plants adjust the enzymes related to respiration to enhance the synthesis of sugars, maintain cellular energy balance, and eliminate harmful substances [37]. Additionally, through miRNA–target gene network analysis, we identified differentially expressed miRNAs interacting with target genes, annotated as tyrosine decarboxylase (Unigene22641), serine/threonine-protein kinase abkC-like (CL2034.Contig1), nuclear transcription factor Y subunit A-3-like (CL2095.Contig2), etc. These miRNA–target gene interactions may play an important regulatory role in eggplant’s response to waterlogging stress.
miR156 is an important regulatory factor in the growth and development of plants and plays a key role in abiotic stress. The regulatory function of miR156 was first discovered in Arabidopsis, where it can function by targeting the SPL gene. SPL is a transcription factor with a conserved SBP domain. In Arabidopsis, the overexpression of miR156b delays flowering and is accompanied by the downregulation of multiple SPL genes [38]. miR156 is often expressed when plants are exposed to environmental stress, and studies have shown that CSA-miR156G-3p is downregulated in waterlogged cucumber and involved in the plant’s waterlogging response [36]. Furthermore, research has also revealed that the overexpression of miR1561 enhances the sensitivity of tomatoes to ABA, facilitating improved responses to drought stress [39]. In this study, the expression levels of the miR156 family decreased with the prolongation of waterlogging stress, demonstrating that eggplant responds to stress by expressing more relevant genes to reduce the impact of waterlogging stress.
miR166 participates in regulating plant stress responses through the regulation of target gene HD-Zip [40]. In studies on waterlogging stress in Arabidopsis, miR166 was found to depend on mitochondrial function to play a role in gene expression regulation and low-oxygen environments [9]. In maize, waterlogging stress leads to the accumulation of miR166, which affects the normal activity of the root meristem and leads to the expansion of the woody tissue [41]. In this study, miR166 was also downregulated, and it was speculated that it may be involved in integrating key hypoxia signaling pathways in eggplant in response to water stress in order to alleviate hypoxia damage.
miR167 targets the auxin response factor (ARF) gene family, which is involved in regulating the auxin signaling pathway and promoting lateral root growth [42]. In this study, the expression of miR167 gradually decreased with the prolongation of waterlogging stress, indicating that miR167 may enhance the plant’s adaptation to water stress by promoting the expression of ARF genes after being subjected to waterlogging stress.
miR399 was initially discovered in Arabidopsis and has been extensively studied in many plant species. It is considered as one of the key regulatory factors in response to phosphorus deficiency stress in plants [43]. Phosphorus is one of the important essential nutrients for plant growth and development, and miR399 adapts to the phosphorus deficiency environment by regulating phosphorus metabolism and distribution in plants. When plants are in a low-phosphorus environment, the expression of miR399 increases, which in turn downregulates the expression of its target gene PHO2, thus improving the plant’s ability to absorb, transport, and utilize phosphorus to help plants grow and survive in a low-phosphorus environment. Therefore, miR399 plays an important role in regulating phosphorus nutrition in plants [44]. We hypothesized that miR399 can promote phosphorus uptake and transport by downregulating its target gene PHO2. Within 24 h of waterlogging stress, the expression level of miR399 was significantly upregulated, which inhibits the expression of PHO2, increases the efficiency of phosphorus utilization, and enhances the plant’s ability to withstand waterlogging stress. However, after 48 h of waterlogging stress, the expression level of miR399 began to decrease, suggesting that it may have exceeded its regulatory range.
In this study, we conducted a comprehensive analysis of the response mechanism of eggplant to waterlogging stress through the combined analysis of miRNA and mRNA. These findings provide important clues for a deeper understanding of the physiological responses and molecular regulatory mechanisms of eggplant under waterlogging stress. Additionally, we performed high-throughput miRNA and mRNA sequencing at different time points of waterlogging stress (0, 3, 6, 12, 24, 48 h). However, our analysis and discussions focused only on the early stage (3 h) and the late stage (48 h) of waterlogging stress. Further investigations can be conducted based on our publicly available high-throughput sequencing data. Despite identifying a series of miRNAs and their target genes, the specific functions and regulatory mechanisms require further validation and research.

5. Conclusions

This study employed high-throughput sequencing to investigate the differential expression and pathways of miRNAs and the mRNA at different time points after waterlogging stress in eggplants. Additionally, we predicted the target genes of miRNAs and constructed a miRNA–target gene interaction network. Based on the predicted miRNA sequences and target gene functions, we inferred that miR156, miR166, miR167, and miR399 are likely to participate in eggplant’s response to waterlogging stress and regulate the respiratory-related kinases and some transcription factors. These findings provide valuable insights into the potential functions and mechanisms of miRNAs in the waterlogging tolerance process of eggplants. However, further research is needed to elucidate how miRNAs involved in the response to waterlogging stress regulate their target genes and how predicted waterlogging-tolerance-related target genes exert their functions.

Supplementary Materials

The following supporting information can be downloaded at: https://www.mdpi.com/article/10.3390/agronomy13092215/s1, Table S1: Primers used in this study.

Author Contributions

All authors contributed to overseeing the experimental design. Z.J. and Y.L. designed the experiments. Y.L. and X.X. performed the experiments. Z.J. and X.Y. analyzed the data. J.H. and Z.J. wrote the paper. All authors have read and agreed to the published version of the manuscript.

Funding

The work was supported by the High-level Personnel Project Funding of Jiangsu Province Six Talents Peak (2015-NY-020).

Data Availability Statement

The data presented in this study are available in Supplementary Material.

Acknowledgments

The funders had no role in the design of the study, in data analysis, or in the preparation of the manuscript.

Conflicts of Interest

The authors declare no conflict of interest.

References

  1. Bakshi, A.; Gilroy, S. Analysis of plant flooding response. Methods Enzym. 2023, 680, 461–491. [Google Scholar] [CrossRef]
  2. Zhou, W.; Chen, F.; Meng, Y.; Chandrasekaran, U.; Luo, X.; Yang, W.; Shu, K. Plant waterlogging/flooding stress responses: From seed germination to maturation. Plant Physiol. Biochem. 2020, 148, 228–236. [Google Scholar] [CrossRef] [PubMed]
  3. Sairam, R.K.; Kumutha, D.; Ezhilmathi, K.; Deshmukh, P.S.; Srivastava, G.C. Physiology and biochemistry of waterlogging tolerance in plants. Biol. Plant. 2008, 52, 401–412. [Google Scholar] [CrossRef]
  4. Luo, Q.; Xie, H.; Chen, Z.; Ma, Y.; Yang, H.; Yang, B.; Ma, Y. Morphology, photosynthetic physiology and biochemistry of nine herbaceous plants under water stress. Front. Plant Sci. 2023, 14, 1147208. [Google Scholar] [CrossRef]
  5. Niki, T.; Gladish, D.K. Changes in growth and structure of pea primary roots (Pisum sativum L. cv. Alaska) as a result of sudden flooding. Plant Cell Physiol. 2001, 42, 694–702. [Google Scholar] [CrossRef]
  6. Wei, W.; Li, D.; Wang, L.; Ding, X.; Zhang, Y.; Gao, Y.; Zhang, X. Morpho-anatomical and physiological responses to waterlogging of sesame (Sesamum indicum L.). Plant Sci. 2013, 208, 102–111. [Google Scholar] [CrossRef] [PubMed]
  7. Last, L.; Widmer, F.; Fjellstad, W.; Stoyanova, S.; Kolliker, R. Genetic diversity of natural orchardgrass (Dactylis glomerata L.) populations in three regions in Europe. BMC Genet. 2013, 14, 102. [Google Scholar] [CrossRef]
  8. De la Rosa, C.; Covarrubias, A.A.; Reyes, J.L. A dicistronic precursor encoding miR398 and the legume-specific miR2119 coregulates CSD1 and ADH1 mRNAs in response to water deficit. Plant Cell Environ. 2019, 42, 133–144. [Google Scholar] [CrossRef]
  9. Moldovan, D.; Spriggs, A.; Yang, J.; Pogson, B.J.; Dennis, E.S.; Wilson, I.W. Hypoxia-responsive microRNAs and trans-acting small interfering RNAs in Arabidopsis. J. Exp. Bot. 2010, 61, 165–177. [Google Scholar] [CrossRef]
  10. Jin, Q.; Xu, Y.; Mattson, N.; Li, X.; Wang, B.; Zhang, X.; Jiang, H.; Liu, X.; Wang, Y.; Yao, D. Identification of Submergence-Responsive MicroRNAs and Their Targets Reveals Complex MiRNA-Mediated Regulatory Networks in Lotus (Nelumbo nucifera Gaertn). Front. Plant Sci. 2017, 8, 6. [Google Scholar] [CrossRef]
  11. Liu, Z.; Kumari, S.; Zhang, L.; Zheng, Y.; Ware, D. Characterization of miRNAs in response to short-term waterlogging in three inbred lines of Zea mays. PLoS ONE 2012, 7, e39786. [Google Scholar] [CrossRef] [PubMed]
  12. Pan, J.; Sharif, R.; Xu, X.; Chen, X. Mechanisms of Waterlogging Tolerance in Plants: Research Progress and Prospects. Front. Plant Sci. 2020, 11, 627331. [Google Scholar] [CrossRef] [PubMed]
  13. Yang, X.; Liu, F.; Zhang, Y.; Wang, L.; Cheng, Y.F. Cold-responsive miRNAs and their target genes in the wild eggplant species Solanum aculeatissimum. BMC Genom. 2017, 18, 1000. [Google Scholar] [CrossRef] [PubMed]
  14. Singh, K.; Talla, A.; Qiu, W. Small RNA profiling of virus-infected grapevines: Evidences for virus infection-associated and variety-specific miRNAs. Funct. Integr. Genom. 2012, 12, 659–669. [Google Scholar] [CrossRef] [PubMed]
  15. Liu, H.H.; Tian, X.; Li, Y.J.; Wu, C.A.; Zheng, C.C. Microarray-based analysis of stress-regulated microRNAs in Arabidopsis thaliana. Rna 2008, 14, 836–843. [Google Scholar] [CrossRef]
  16. Wan, F.; Pan, Y.; Li, J.; Chen, X.; Pan, Y.; Wang, Y.; Tian, S.; Zhang, X. Heterologous expression of Arabidopsis C-repeat binding factor 3 (AtCBF3) and cold-regulated 15A (AtCOR15A) enhanced chilling tolerance in transgenic eggplant (Solanum melongena L.). Plant Cell Rep. 2014, 33, 1951–1961. [Google Scholar] [CrossRef]
  17. Waseem, M.; Ahmad, F.; Habib, S.; Li, Z. Genome-wide identification of the auxin/indole-3-acetic acid (Aux/IAA) gene family in pepper, its characterisation, and comprehensive expression profiling under environmental and phytohormones stress. Sci. Rep. 2018, 8, 12008. [Google Scholar] [CrossRef] [PubMed]
  18. Allen, E.; Xie, Z.; Gustafson, A.M.; Carrington, J.C. microRNA-directed phasing during trans-acting siRNA biogenesis in plants. Cell 2005, 121, 207–221. [Google Scholar] [CrossRef]
  19. Sun, J.; Li, M.; Li, Z.; Xue, J.; Lan, X.; Zhang, C.; Lei, C.; Chen, H. Identification and profiling of conserved and novel microRNAs from Chinese Qinchuan bovine longissimus thoracis. BMC Genom. 2013, 14, 42. [Google Scholar] [CrossRef]
  20. Yang, X.; Wang, L.; Yuan, D.; Lindsey, K.; Zhang, X. Small RNA and degradome sequencing reveal complex miRNA regulation during cotton somatic embryogenesis. J. Exp. Bot. 2013, 64, 1521–1536. [Google Scholar] [CrossRef]
  21. Carnavale Bottino, M.; Rosario, S.; Grativol, C.; Thiebaut, F.; Rojas, C.A.; Farrineli, L.; Hemerly, A.S.; Ferreira, P.C. High-throughput sequencing of small RNA transcriptome reveals salt stress regulated microRNAs in sugarcane. PLoS ONE 2013, 8, e59423. [Google Scholar] [CrossRef] [PubMed]
  22. Khraiwesh, B.; Pugalenthi, G.; Fedoroff, N.V. Identification and analysis of red sea mangrove (Avicennia marina) microRNAs by high-throughput sequencing and their association with stress responses. PLoS ONE 2013, 8, e60774. [Google Scholar] [CrossRef] [PubMed]
  23. Lin, Y.; Lai, Z. Comparative analysis reveals dynamic changes in miRNAs and their targets and expression during somatic embryogenesis in longan (Dimocarpus longan Lour.). PLoS ONE 2013, 8, e60337. [Google Scholar] [CrossRef]
  24. Jiang, Z.; Shen, L.; He, J.; Du, L.; Xia, X.; Zhang, L.; Yang, X. Functional Analysis of SmMYB39 in Salt Stress Tolerance of Eggplant (Solanum melongena L.). Horticulturae 2023, 9, 848. [Google Scholar] [CrossRef]
  25. Zhang, X.; Zou, Z.; Gong, P.; Zhang, J.; Ziaf, K.; Li, H.; Xiao, F.; Ye, Z. Over-expression of microRNA169 confers enhanced drought tolerance to tomato. Biotechnol. Lett. 2011, 33, 403–409. [Google Scholar] [CrossRef] [PubMed]
  26. Zhuang, Y.; Zhou, X.H.; Liu, J. Conserved miRNAs and Their Response to Salt Stress in Wild Eggplant Solanum linnaeanum Roots. Int. J. Mol. Sci. 2014, 15, 839–849. [Google Scholar] [CrossRef]
  27. Li, S.H.; Ge, Z.M.; Xie, L.N.; Chen, W.; Yuan, L.; Wang, D.Q.; Li, X.Z.; Zhang, L.Q. Ecophysiological response of native and exotic salt marsh vegetation to waterlogging and salinity: Implications for the effects of sea-level rise. Sci. Rep. 2018, 8, 2441. [Google Scholar] [CrossRef]
  28. Ma, M.H.; Wang, H.X.; Jia, P.F.; Liu, R.H.; Hong, Z.; Labriola, L.G.; Hong, Y.; Miao, L.J. Investigation of inducements and defenses of flash floods and urban waterlogging in Fuzhou, China, from 1950 to 2010. Nat. Hazards 2018, 91, 803–818. [Google Scholar] [CrossRef]
  29. Guo, H.; Tian, H.; Wang, Y.Q.; Xiong, X.W.; Tian, H.Z.; Zhang, S.Q.; Geng, G.D. Comparative analysis of growth, physiological and transcriptomic response revealed mechanisms of waterlogging tolerance of hot pepper (Capsicum annuum var. conoides). Plant Breed. 2022, 141, 807–819. [Google Scholar] [CrossRef]
  30. de Souza, W.R.; Mitchell, R.A.C.; Cesarino, I. Editorial: The plant cell wall: Advances and current perspectives. Front. Plant Sci. 2023, 14, 1235749. [Google Scholar] [CrossRef]
  31. Gu, L.; Wu, Y.; Li, M.; Wang, F.; Li, Z.; Yuan, F.; Zhang, Z. Over-immunity mediated abnormal deposition of lignin arrests the normal enlargement of the root tubers of Rehmannia glutinosa under consecutive monoculture stress. Plant Physiol. Biochem. 2021, 165, 36–46. [Google Scholar] [CrossRef] [PubMed]
  32. Qiu, C.S.; Qiu, H.J.; Peng, D.X.; Chen, J.H.; Wang, Y.F.; Stybayev, G.; Baitelenova, A.; Kipshakpayeva, G.; Begalina, A.; Wu, Z.M. The Mechanisms Underlying Physiological and Molecular Responses to Waterlogging in Flax. J. Nat. Fibers 2023, 20, 2198275. [Google Scholar] [CrossRef]
  33. Kharel, B.; Rusalepp, L.; Bhattarai, B.; Kaasik, A.; Kupper, P.; Lutter, R.; Mand, P.; Rohula-Okunev, G.; Rosenvald, K.; Tullus, A. Effects of air humidity and soil moisture on secondary metabolites in the leaves and roots of Betula pendula of different competitive status. Oecologia 2023, 202, 193–210. [Google Scholar] [CrossRef] [PubMed]
  34. Zhai, L.; Liu, Z.; Zou, X.; Jiang, Y.; Qiu, F.; Zheng, Y.; Zhang, Z. Genome-wide identification and analysis of microRNA responding to long-term waterlogging in crown roots of maize seedlings. Physiol. Plant. 2013, 147, 181–193. [Google Scholar] [CrossRef] [PubMed]
  35. Jones-Rhoades, M.W.; Bartel, D.P. Computational identification of plant microRNAs and their targets, including a stress-induced miRNA. Mol. Cell 2004, 14, 787–799. [Google Scholar] [CrossRef]
  36. Xu, X.; Wang, K.; Pan, J.; Chen, X. Small RNA sequencing identifies cucumber miRNA roles in waterlogging-triggered adventitious root primordia formation. Mol. Biol. Rep. 2019, 46, 6381–6389. [Google Scholar] [CrossRef]
  37. Phukan, U.J.; Mishra, S.; Shukla, R.K. Waterlogging and submergence stress: Affects and acclimation. Crit. Rev. Biotechnol. 2016, 36, 956–966. [Google Scholar] [CrossRef]
  38. Schwab, R.; Palatnik, J.F.; Riester, M.; Schommer, C.; Schmid, M.; Weigel, D. Specific effects of microRNAs on the plant transcriptome. Dev. Cell 2005, 8, 517–527. [Google Scholar] [CrossRef]
  39. Visentin, I.; Pagliarani, C.; Deva, E.; Caracci, A.; Tureckova, V.; Novak, O.; Lovisolo, C.; Schubert, A.; Cardinale, F. A novel strigolactone-miR156 module controls stomatal behaviour during drought recovery. Plant Cell Environ. 2020, 43, 1613–1624. [Google Scholar] [CrossRef]
  40. Ohashi-Ito, K.; Fukuda, H. HD-zip III homeobox genes that include a novel member, ZeHB-13 (Zinnia)/ATHB-15 (Arabidopsis), are involved in procambium and xylem cell differentiation. Plant Cell Physiol. 2003, 44, 1350–1358. [Google Scholar] [CrossRef]
  41. Zhang, Z.; Wei, L.; Zou, X.; Tao, Y.; Liu, Z.; Zheng, Y. Submergence-responsive MicroRNAs are potentially involved in the regulation of morphological and metabolic adaptations in maize root cells. Ann. Bot. 2008, 102, 509–519. [Google Scholar] [CrossRef] [PubMed]
  42. Gutierrez, L.; Bussell, J.D.; Pcurar, D.I.; Schwambach, J.; Pcurar, M.; Bellini, C. Phenotypic Plasticity of Adventitious Rooting in Arabidopsis Is Controlled by Complex Regulation of AUXIN RESPONSE FACTOR Transcripts and MicroRNA Abundance. Plant Cell 2009, 21, 3119–3132. [Google Scholar] [CrossRef] [PubMed]
  43. Fujii, H.; Chiou, T.J.; Lin, S.I.; Aung, K.; Zhu, J.K. A miRNA involved in phosphate-starvation response in Arabidopsis. Curr. Biol. 2005, 15, 2038–2043. [Google Scholar] [CrossRef] [PubMed]
  44. Bari, R.; Datt Pant, B.; Stitt, M.; Scheible, W.R. PHO2, microRNA399, and PHR1 define a phosphate-signaling pathway in plants. Plant Physiol. 2006, 141, 988–999. [Google Scholar] [CrossRef] [PubMed]
Figure 1. Phenotypic responses, chlorophyll, and lignin indicators of eggplant under different waterlogging durations. (A) Phenotypic changes in eggplant seedlings under different waterlogging treatments. With the increase in waterlogging duration, eggplant seedling leaves gradually turned yellow and wilted. (B) SPAD index of eggplant seedling leaves under different waterlogging treatments, which reflects the relative content of chlorophyll in the leaves. (C) Contents of chlorophyll a, chlorophyll b, and carotenoids (fresh weight) in eggplant seedling leaves under different waterlogging treatments. Chl-a: chlorophyll a; Chl-b: chlorophyll b. (D) Lignin content in eggplant seedling roots under different waterlogging treatments (dry weight). Data are presented as means ± standard deviation from three biological replicates. Different capital letters between samples denote significant differences according to one-way ANOVA and Tukey’s test (p < 0.01). The error bars represent the standard deviation.
Agronomy 13 02215 g001
Figure 2. (A) Analysis of Differential Gene Expression. The x-axis represents the comparative combinatorial, and the y-axis represents the number of Unigenes. The red columns represent the upregulated gene count, while the green columns represent the downregulated gene count. (B) Volcano plot of significantly differentially expressed genes. The screening criteria for significantly differentially expressed genes were: |log2Ratio| ≥ 1 and q-value ≤ 0.05. (C) FPKM values of significantly differentially expressed genes under waterlogging stress at 0, 3, 6, 12, 24, and 48 h. Different capital letters between samples indicate significant differences according to one-way ANOVA and Tukey’s test (p < 0.01).
Agronomy 13 02215 g002aAgronomy 13 02215 g002b
Figure 3. (A) GO enrichment analysis of differentially expressed genes after 3 h of waterlogging stress. (B) GO enrichment analysis of differentially expressed genes after 48 h of waterlogging stress. (C) Functional analysis of differentially expressed genes in KEGG Pathways under different treatment conditions.
Agronomy 13 02215 g003aAgronomy 13 02215 g003bAgronomy 13 02215 g003c
Figure 4. Differential expression analysis of miRNAs under different waterlogging conditions. Each point in the figure represents a single miRNA, and the expression of the miRNAs in the two samples are shown on the X and Y axes, respectively. Red represents ratio > 2 of the miRNAs; blue represents 1/2≤ ratio ≤ 2 of the miRNAs, and green represents ratio < 1/2 of the miRNAs.
Agronomy 13 02215 g004
Figure 5. Histogram of GO classification of differential miRNA target genes flooding in eggplant.
Agronomy 13 02215 g005
Figure 6. KEGG Metabolic Pathway Map. (A) KEGG metabolic pathway analysis of 3 h differential expression in eggplant. (B) KEGG metabolic pathway analysis of 48 h differential expression in eggplant. The highlighted boxes represent pathways or enzymes with differential expression in the context of the study.
Agronomy 13 02215 g006aAgronomy 13 02215 g006b
Figure 7. miRNA–target gene regulatory network involved in the response to waterlogging stress. (A) miRNA–target gene regulatory network after 3 h of waterlogging stress. (B) miRNA–target gene regulatory network after 48 h of waterlogging stress. The different colors in the nodes represent differential expression levels, with red indicating upregulation and blue indicating downregulation. The targeting relationship between miRNAs and target genes is represented by the gray connecting lines.
Agronomy 13 02215 g007aAgronomy 13 02215 g007b
Figure 8. qRT-PCR was used to verify the expression of genes in eggplant under control (0 h) and water stress conditions (3, 6, 12, 24, and 48 h). SmActin was used as an internal reference. The target gene data were generated from the average of three repeating qRT-PCR experiments for the three biological repeats of each sample. The error bars represent the standard deviations of the three different qRT-PCR repeats. Different capital letters between samples indicate significant differences according to one-way ANOVA and Tukey’s test (p < 0.01).
Agronomy 13 02215 g008
Table 1. Total number of tags aligned to different types of non-coding sRNAs.
rRNAsnoRNAsnRNArRNAetcmiRNAUnannKnown_miRNAtRNA
0 h1,688,34815,383983385,83537,0196,755,726610,121185,323
3 h1,759,93020,09812,87798,19644,7908,754,388753,614276,079
6 h1,718,49919,99818,72594,07284,2338,724,408644,141213,054
12 h2,259,87718,54419,83286,21558,6056,605,543466,736141,748
24 h4,551,60323,65129,375103,45569,8576,683,368580,503171,313
48 h6,225,970972213,56085,37224,0484,594,547390,776158,796
Table 2. Number of unique tags aligned to each category of non-coding sRNAs.
rRNAsnoRNAsnRNArRNAetcmiRNAUnannKnown_miRNAtRNA
0 h248,4045113377120,2943184,784,562326726,426
3 h236,1656000452221,2843615,929,137361326,890
6 h199,9235482466819,3923545,767,460314330,098
12 h216,6425260496818,9012984,675,733307224,818
24 h334,2396225569920,7482944,561,252310932,369
48 h373,4563329348616,6202453,225,708249233,930
Table 3. Prediction statistics of known differentially expressed miRNA target loci.
miRNA_NumberTarget_Gene_NumbermiRNA::Target_Number
Sm 0 h-vs.-Sm 3 h2985237
Sm 0 h-vs.-Sm 6 h31239358
Sm 0 h-vs.-Sm 12 h22222310
Sm 0 h-vs.-Sm 24 h51314607
Sm 0 h-vs.-Sm 48 h89436850
Disclaimer/Publisher’s Note: The statements, opinions and data contained in all publications are solely those of the individual author(s) and contributor(s) and not of MDPI and/or the editor(s). MDPI and/or the editor(s) disclaim responsibility for any injury to people or property resulting from any ideas, methods, instructions or products referred to in the content.

