
Effects of Combined Application of Biochar and Different Types of Nitrogen Fertilizers on Rapeseed Root Growth and Properties of Purple Soil in Southwest China

Abstract
:1. Introduction
2. Materials and Methods
2.1. Experimental Materials
2.2. Experimental Design
2.3. Sampling and Analyses
2.4. Statistical Analysis
3. Results
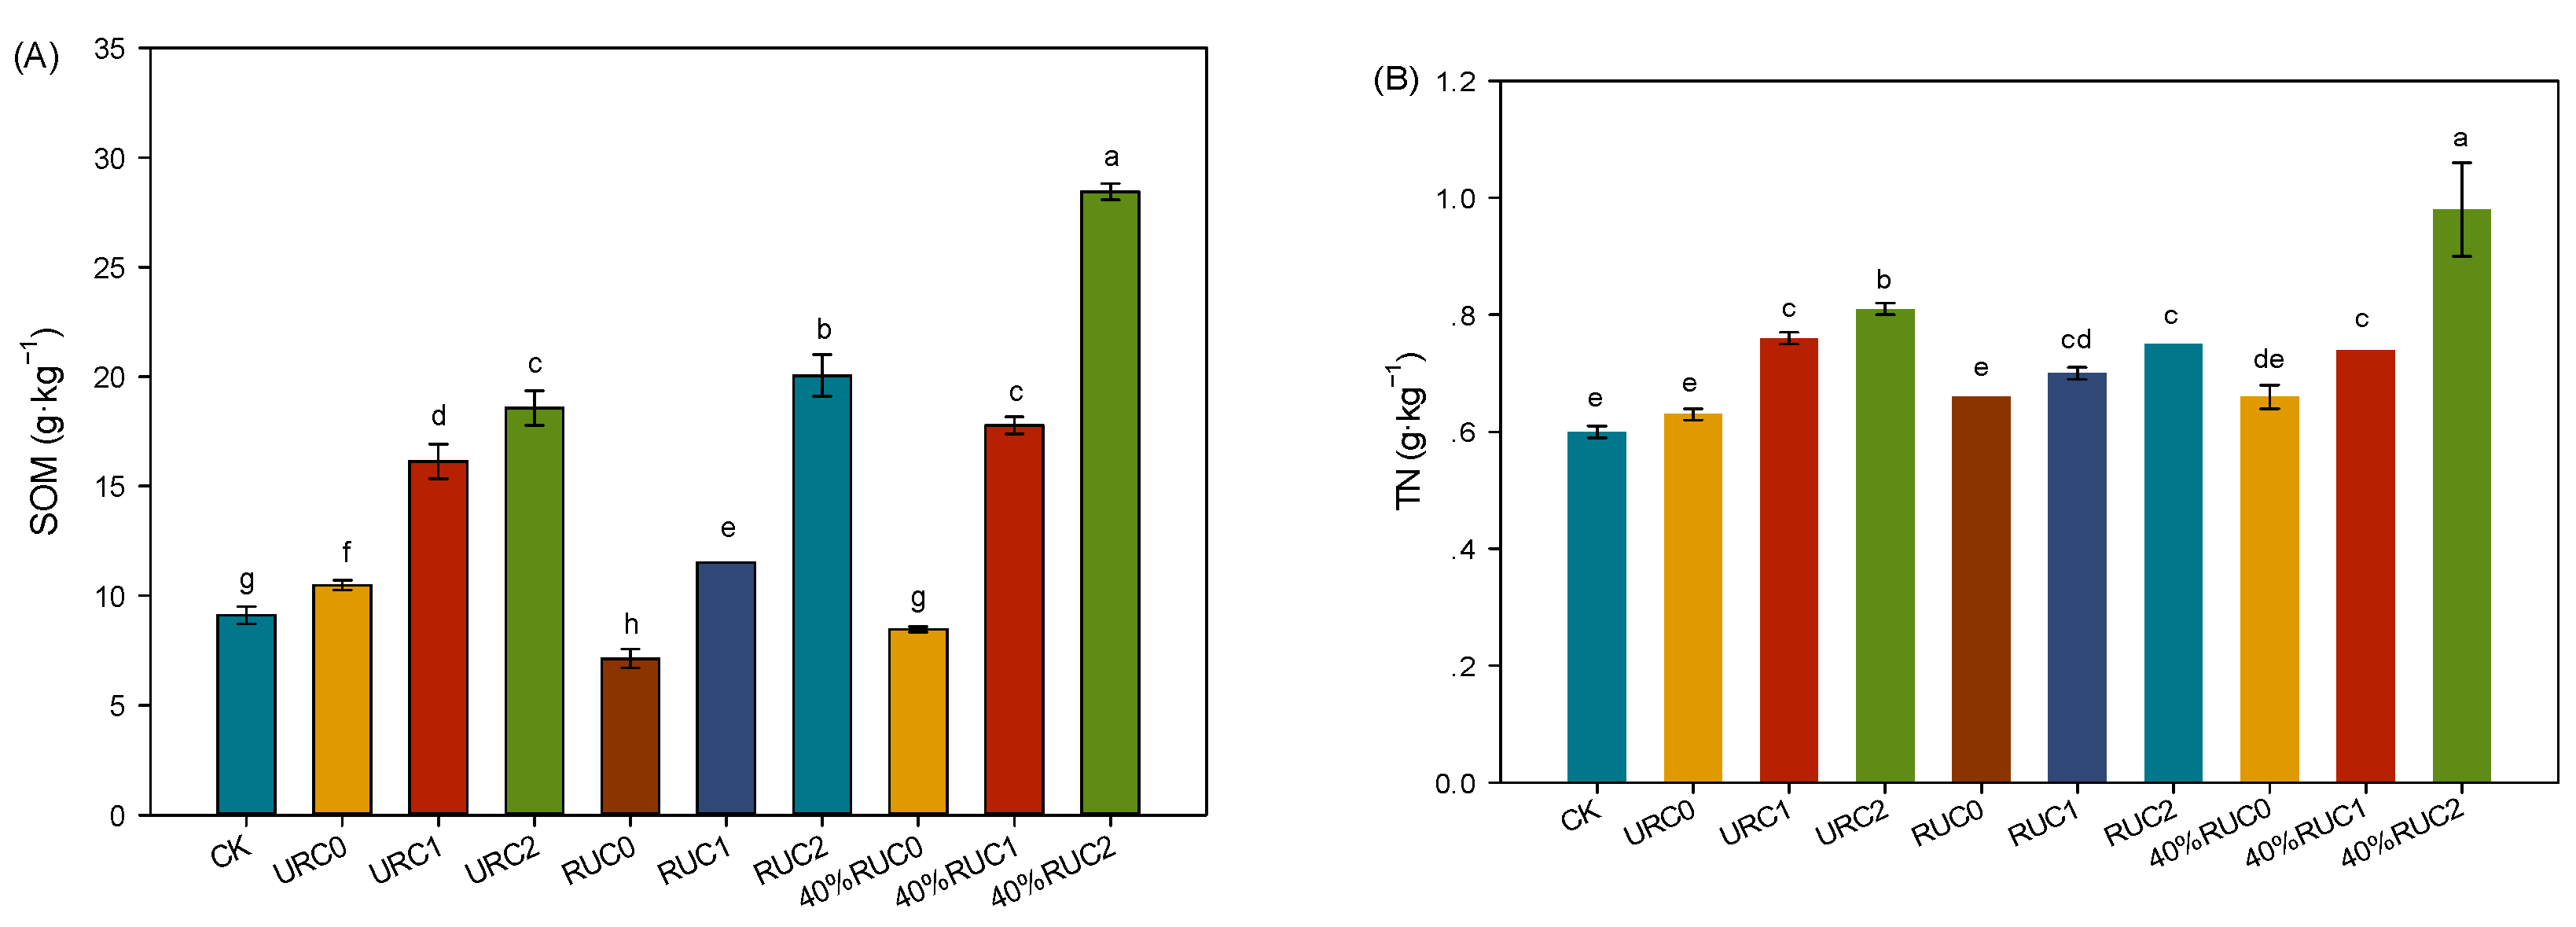
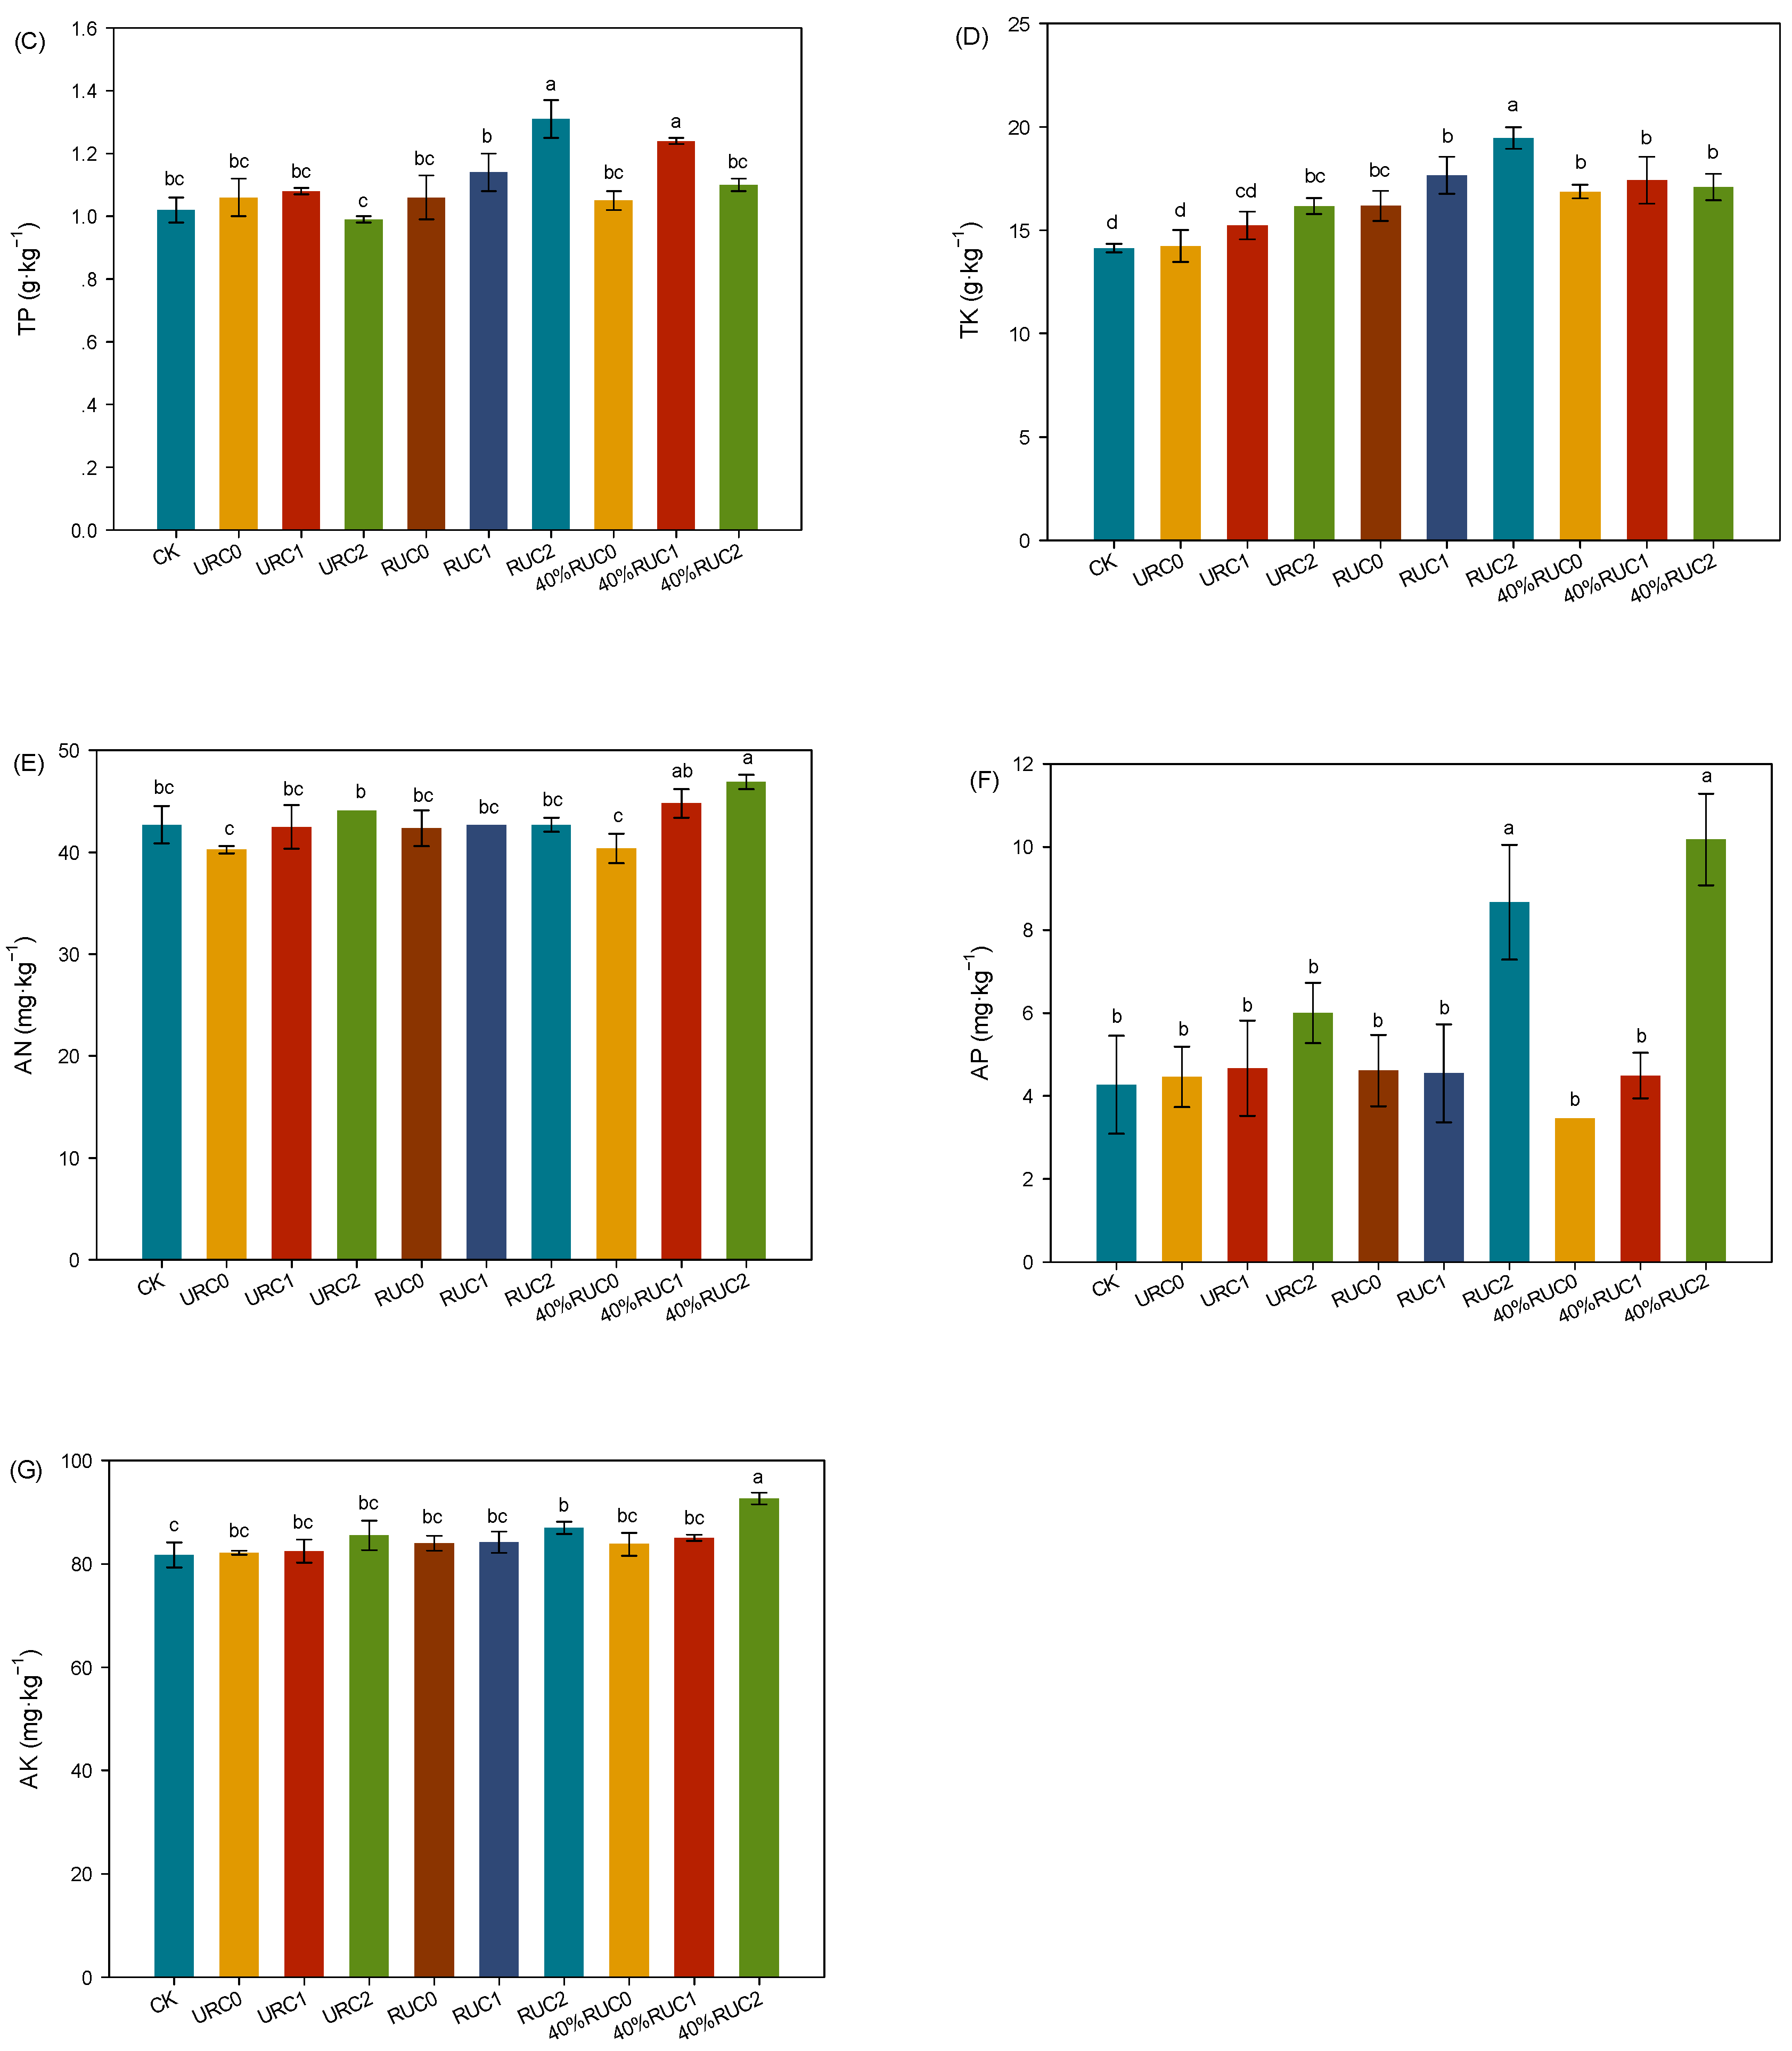
3.1. Soil Nutrients
3.2. Soil Organic Carbon Components
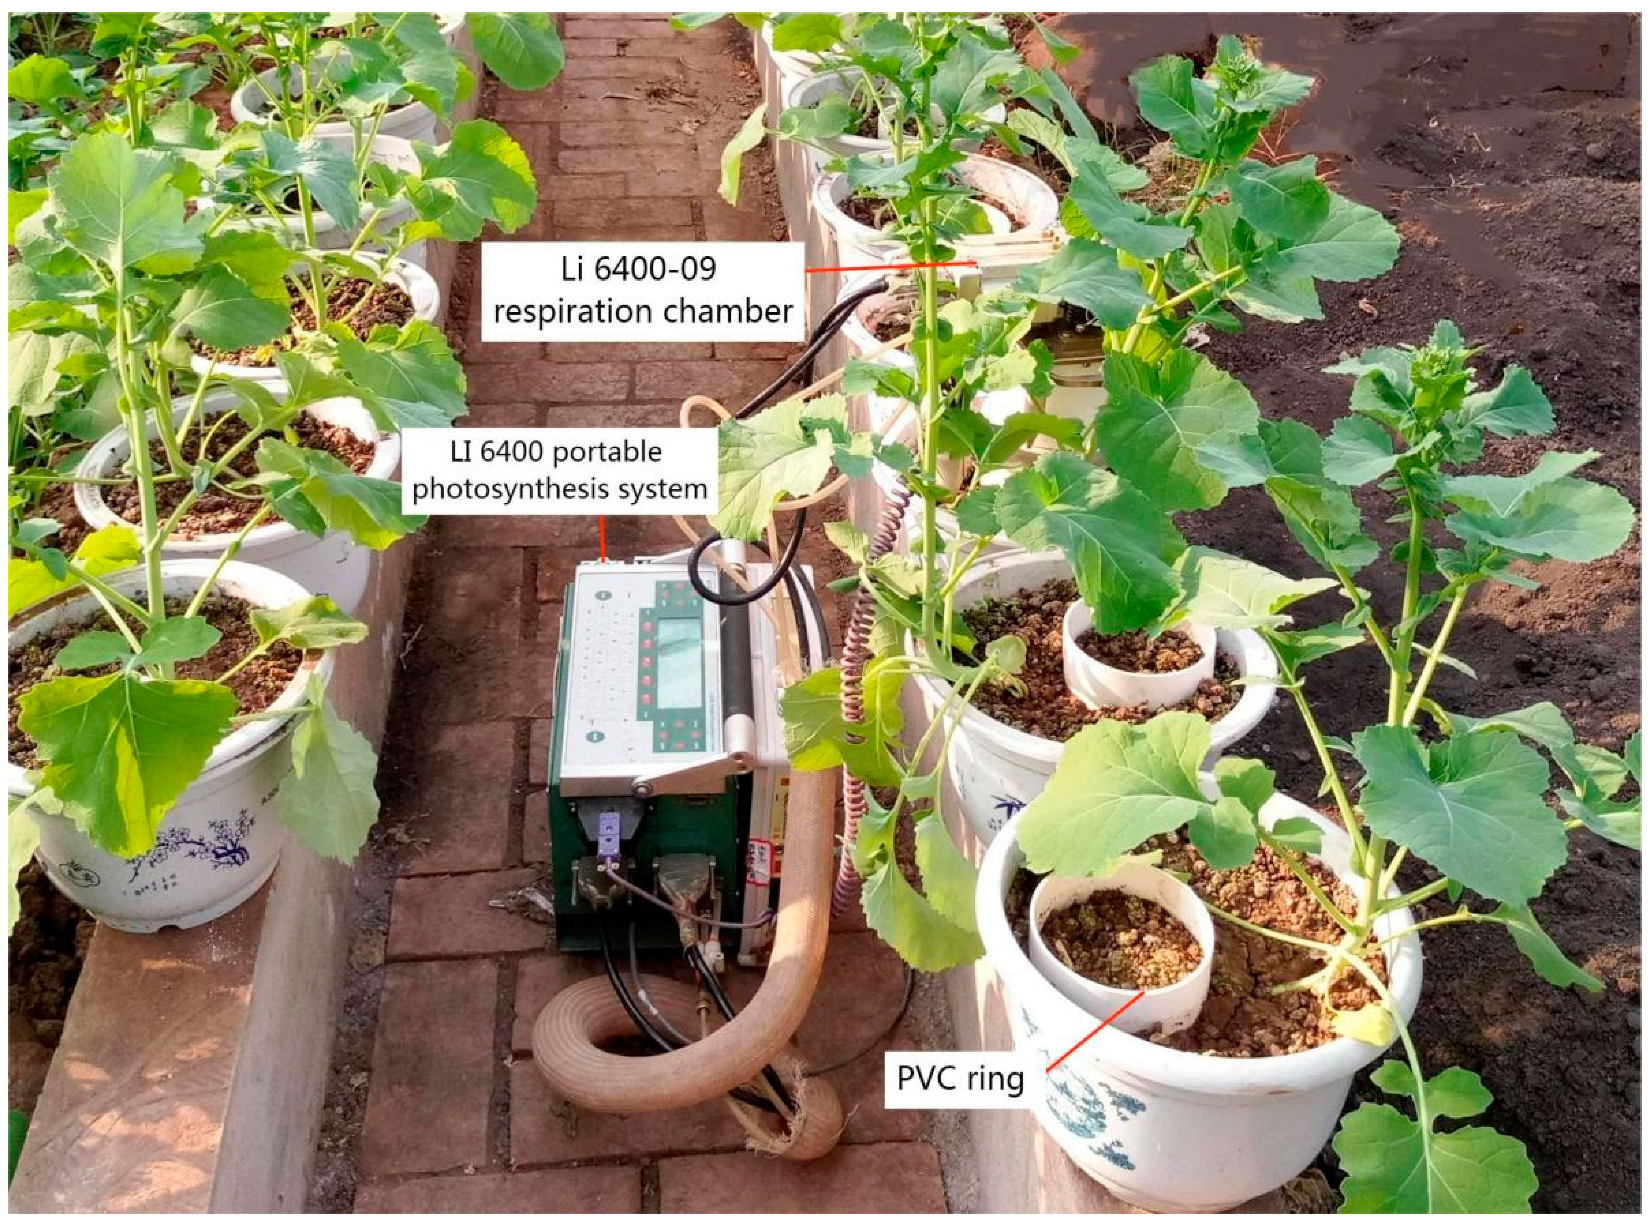
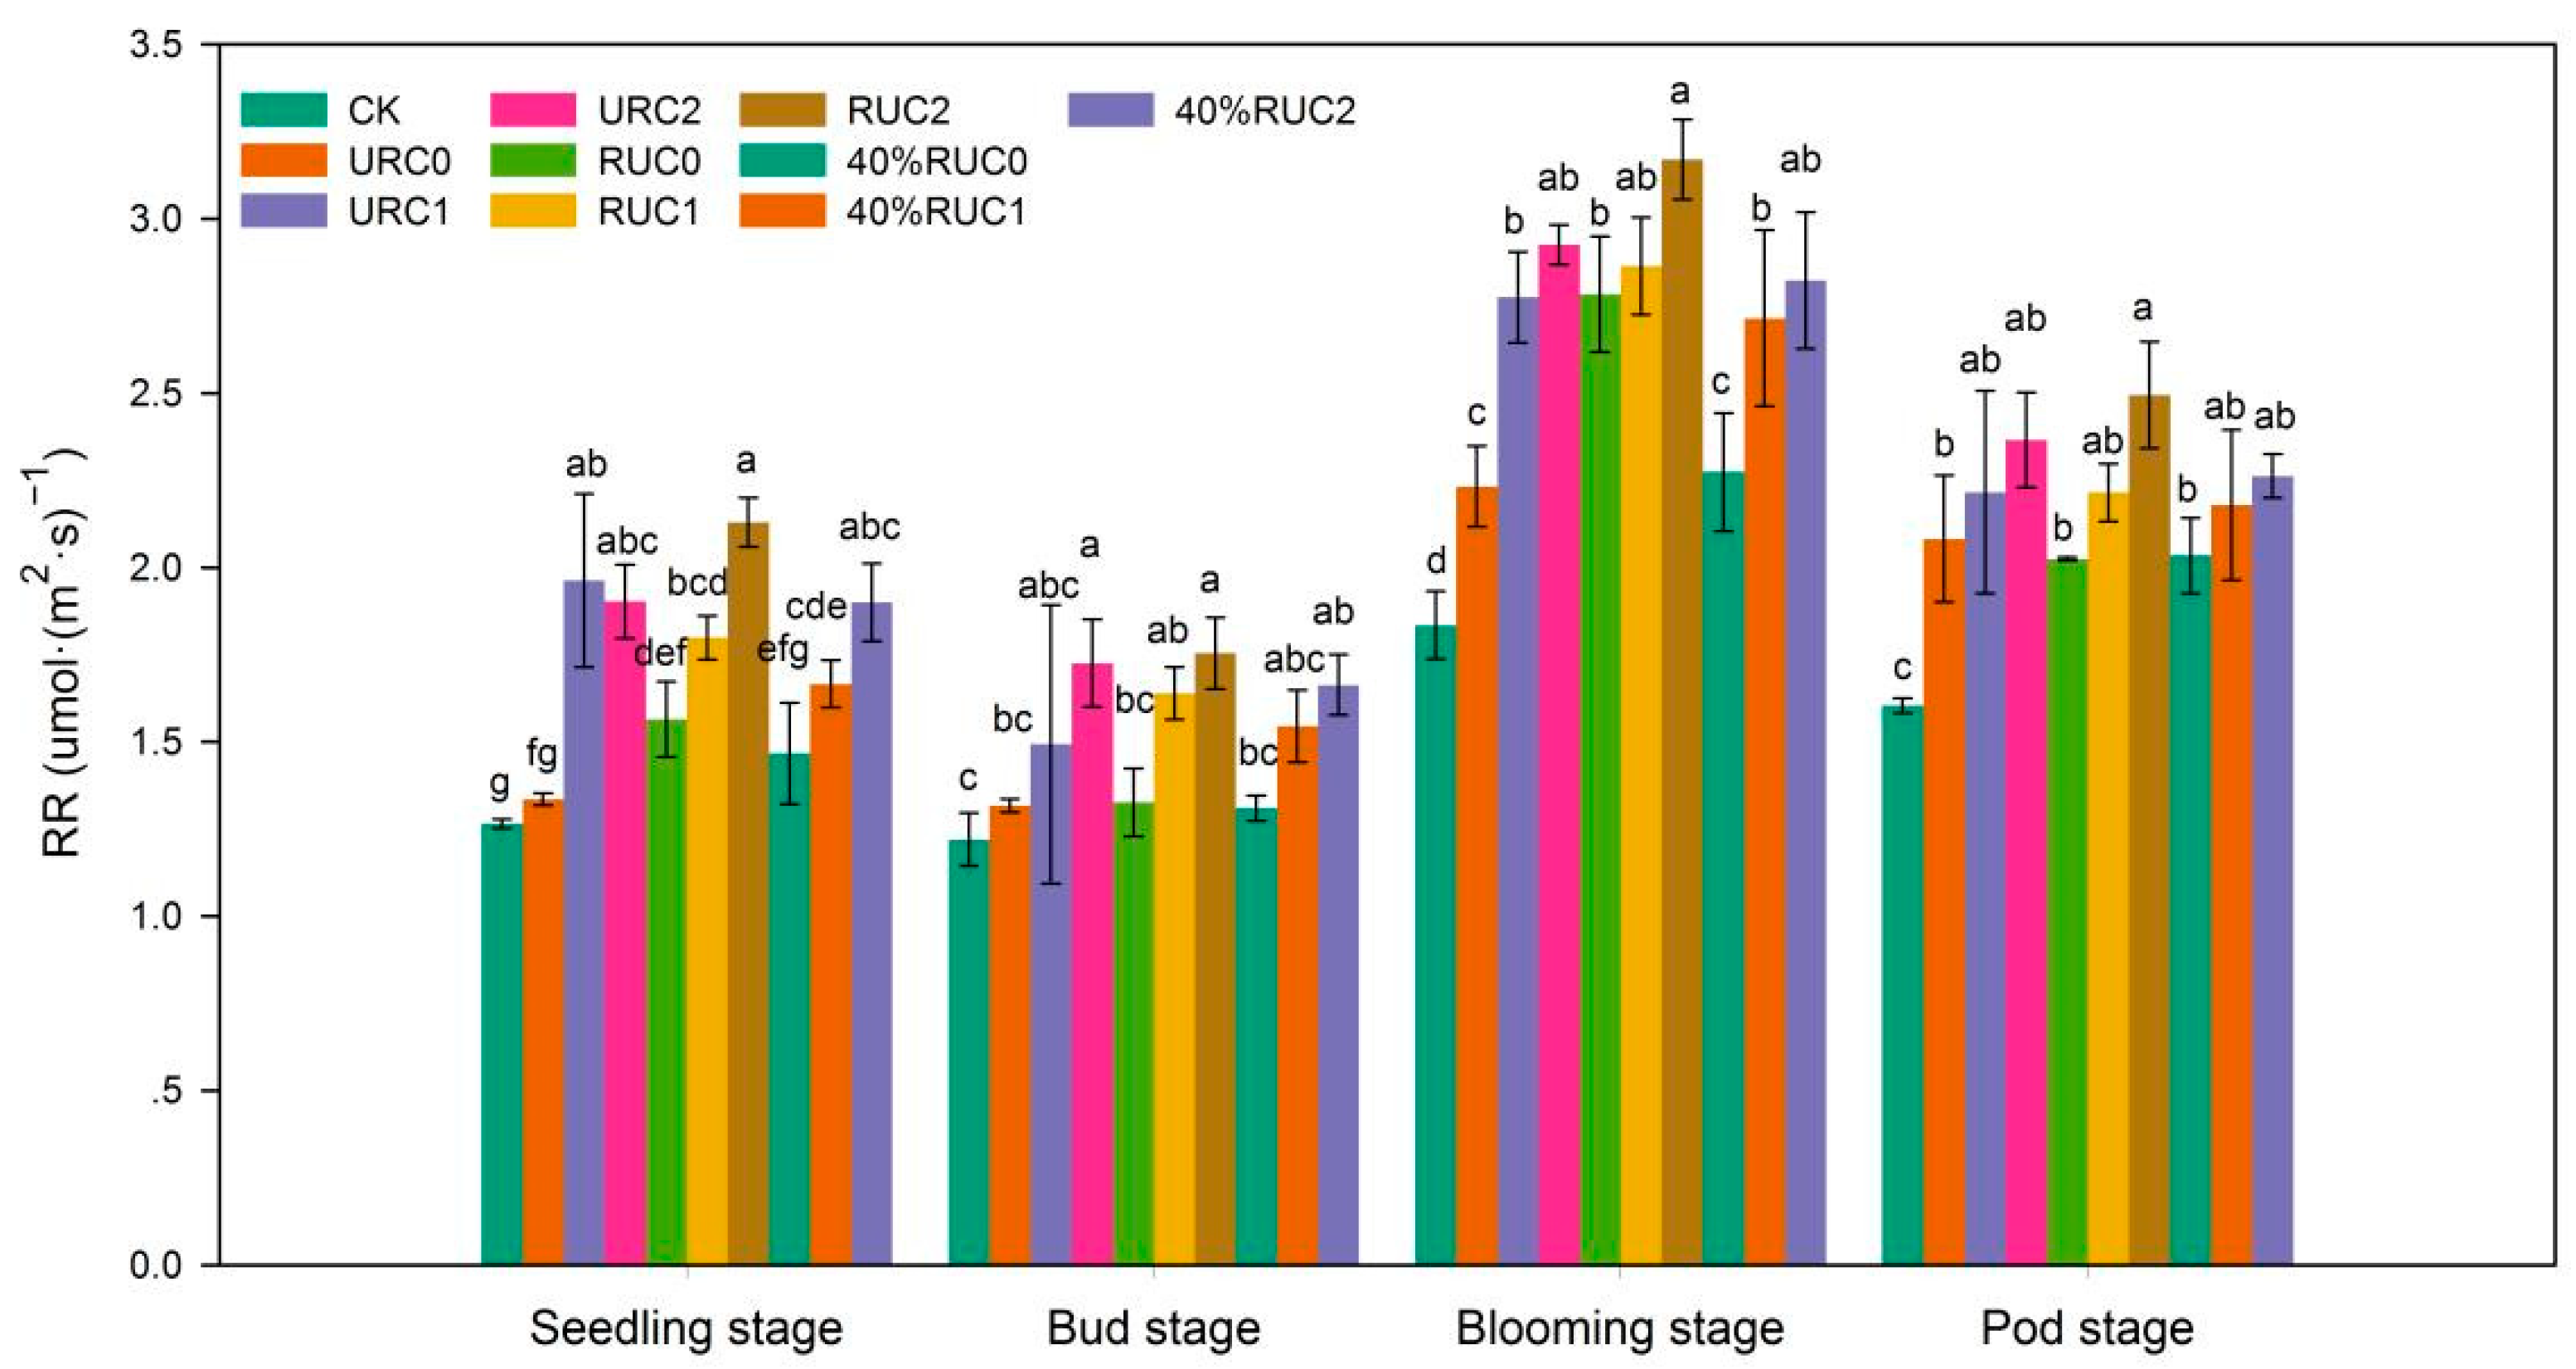
3.3. Soil Respiration
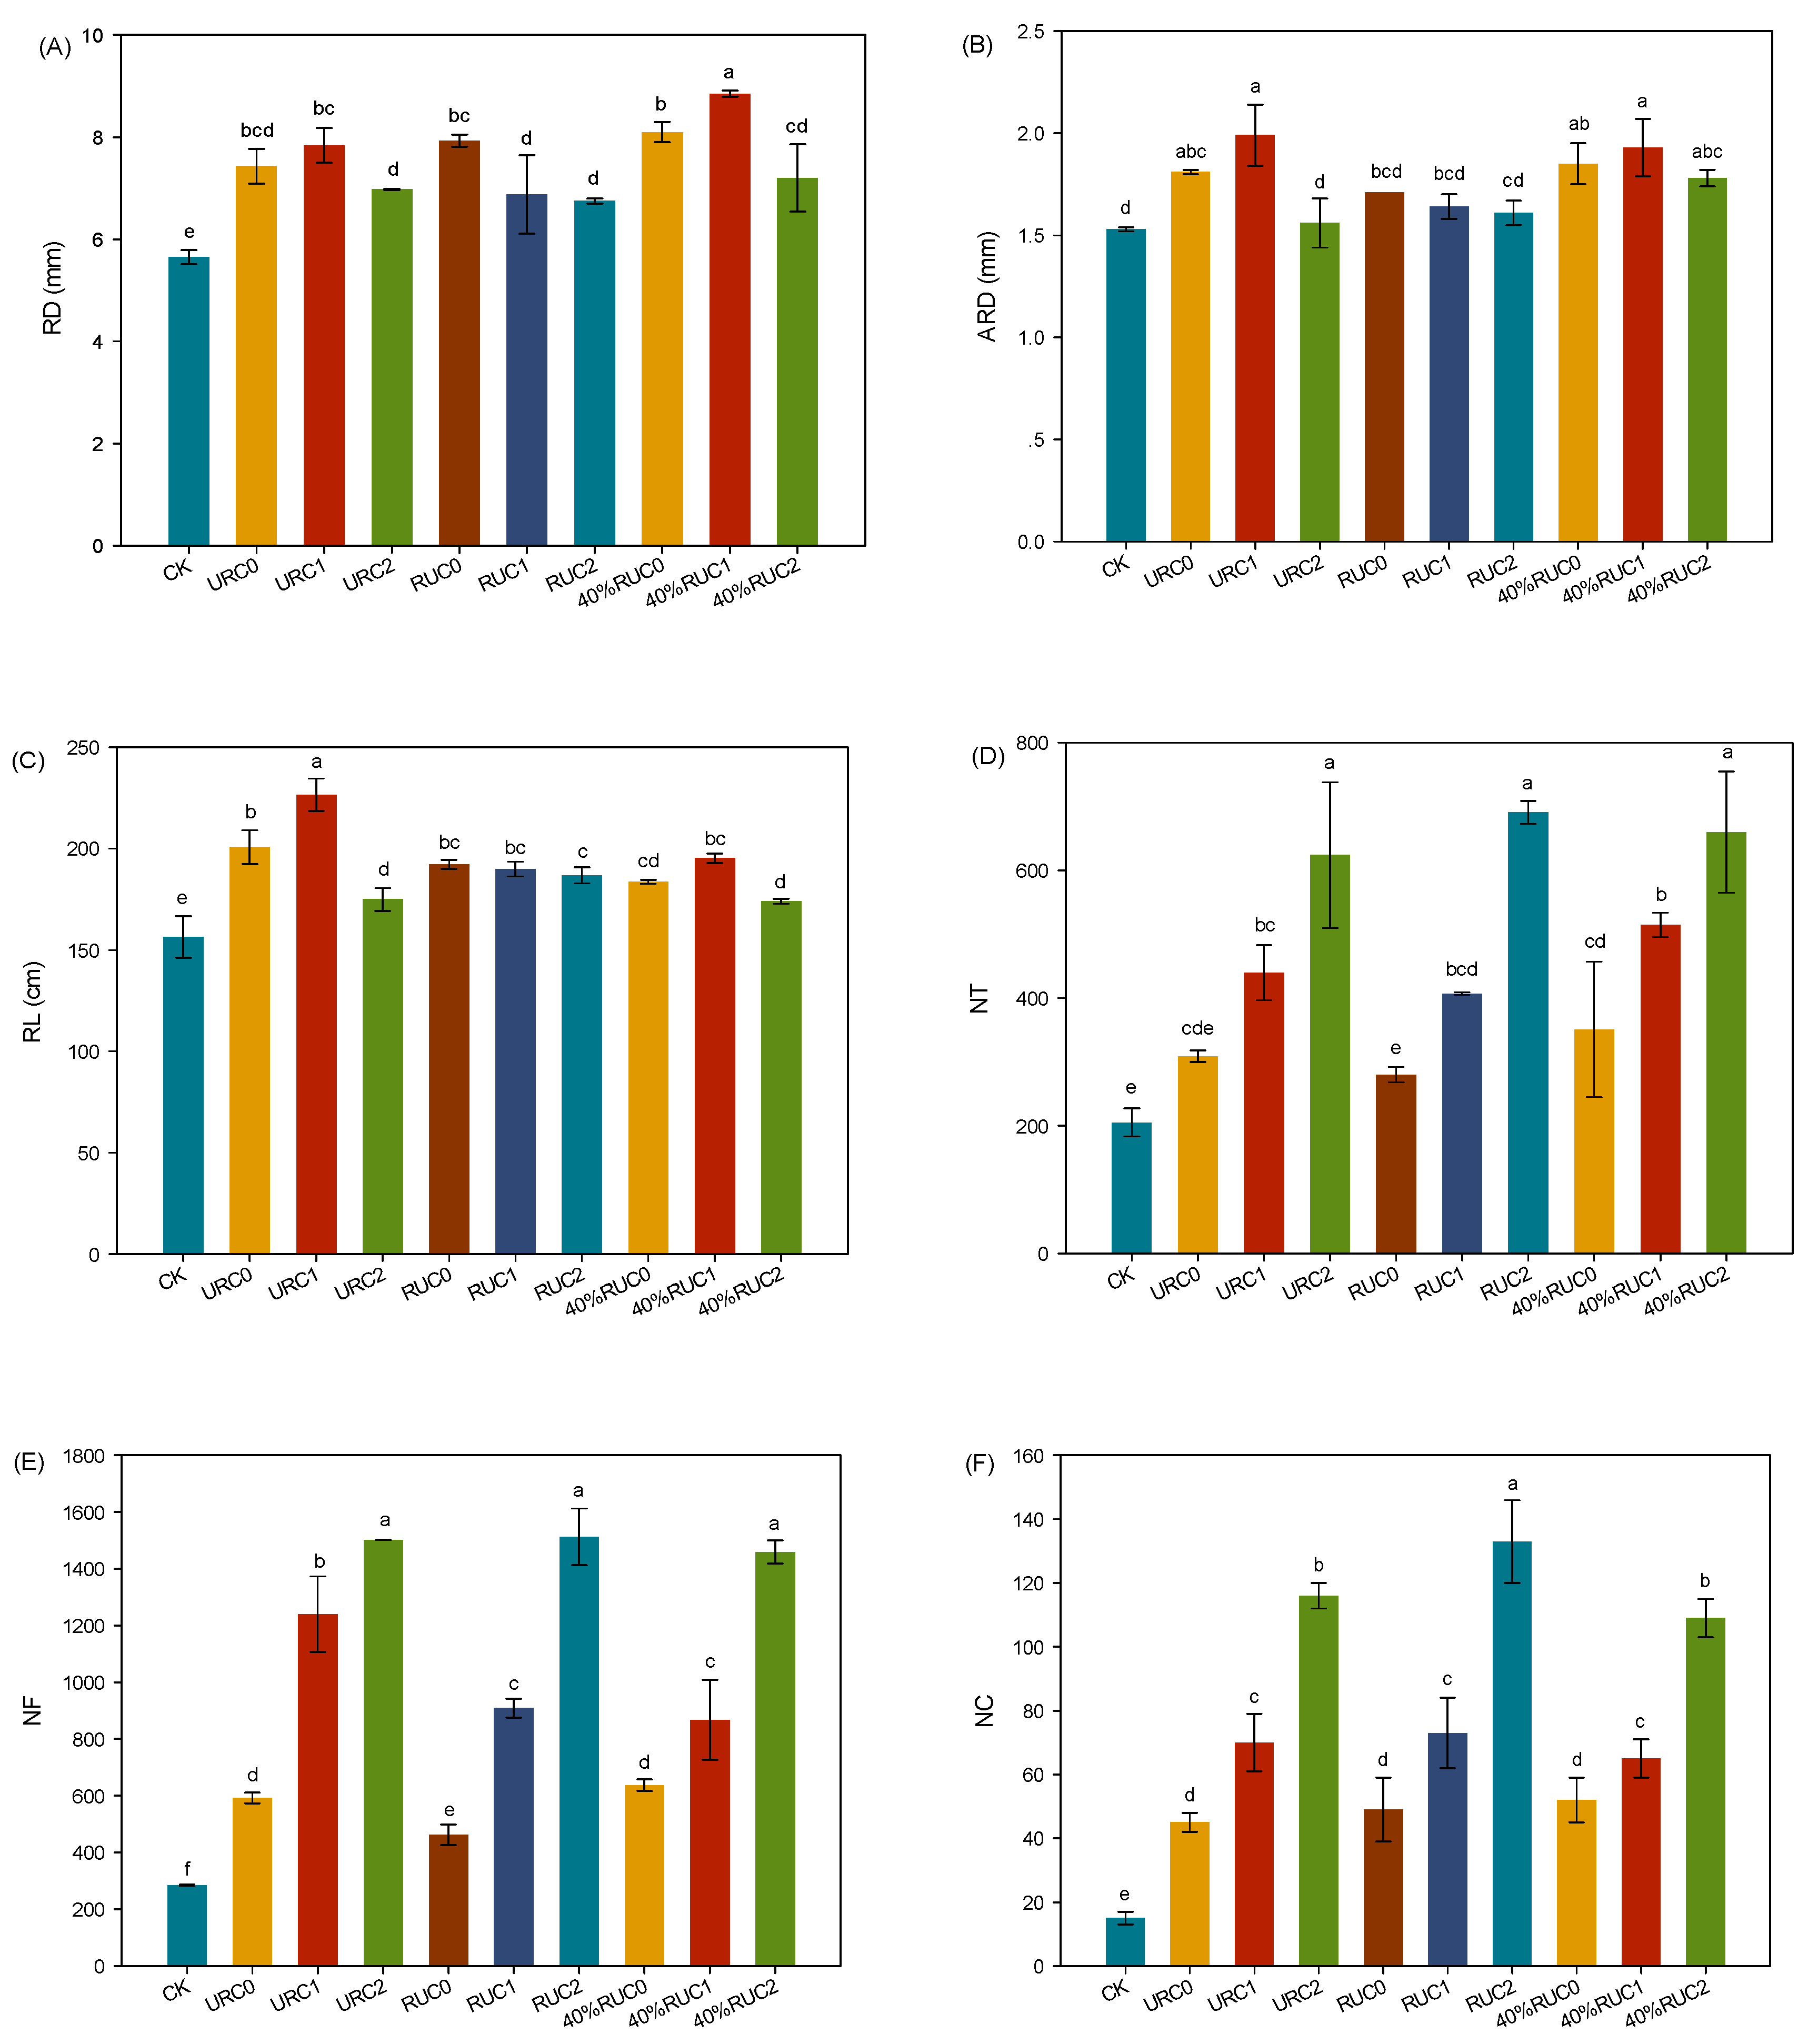
3.4. Crop Root Traits
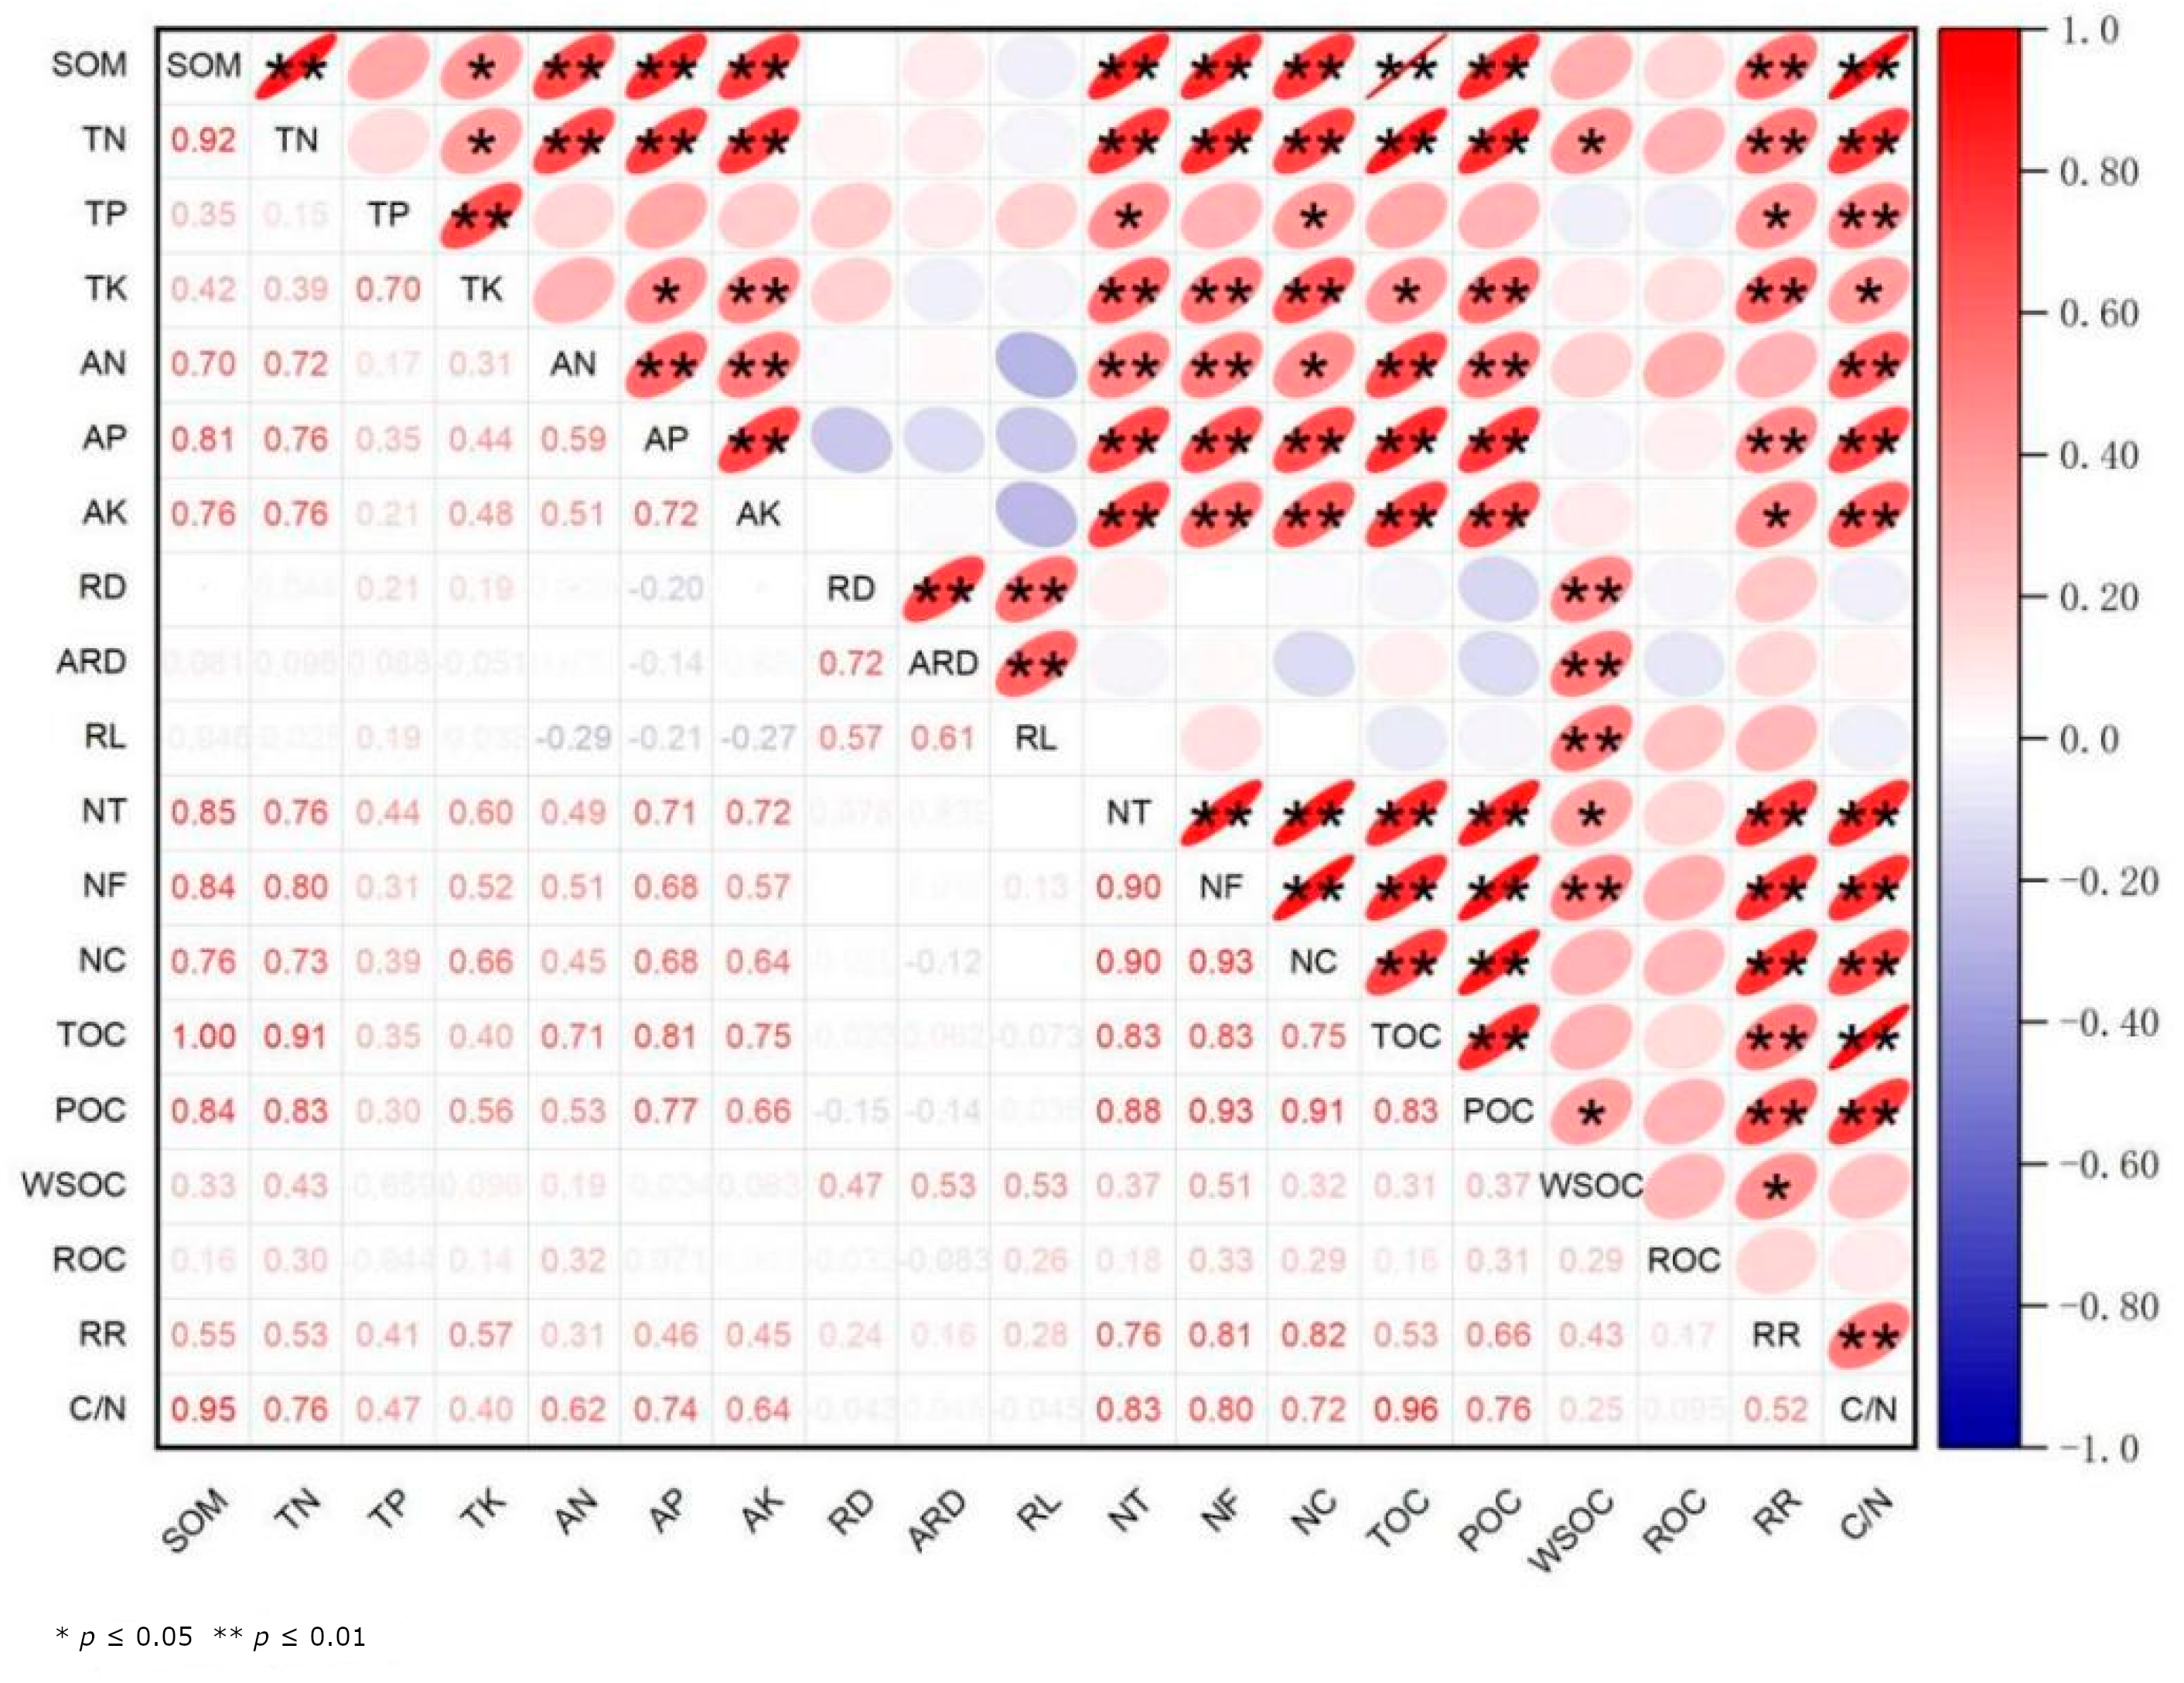
3.5. Correlations between Soil Nutrients, Organic Carbon Components, Respiration, and Crop Root Traits
4. Discussion
4.1. Effects of Biochar and Different Types of Nitrogen Fertilizers on Soil Nutrients
4.2. Effects of Biochar and Different Types of Nitrogen Fertilizers on Soil Carbon Content
4.3. Effects of Biochar and Different Types of Nitrogen Fertilizers on Soil Respiration
4.4. Effects of Biochar and Different Types of Nitrogen Fertilizers on Root Traits of Rapeseed
5. Conclusions
- (1)
- Biochar significantly improves soil nutrient content. The combination of 40% RU at C1 level is more effective in improving soil nutrient status compared to RU and UR, while at the C2 level, it is more conducive to enhancing soil available nutrients.
- (2)
- Addition of biochar significantly increases TOC and POC content, WSOC is strongly influenced by the type of nitrogen fertilizer that is used. Compared to the combination of UR, RU and biochar, the combination of 40% RU with 4% biochar is more effective in increasing TOC and POC content. The combination of 40%RU with 2% biochar shows a more pronounced effect in increasing ROC. The effect of biochar combined with different nitrogen fertilizer types on WSOC varies with the crop growth stage, but a higher dosage of biochar (4%) has some inhibitory effect on WSOC in the later stages of crop growth.
- (3)
- Overall, the application of 4% biochar significantly increases RR, while the application of 2% biochar and different types of nitrogen fertilizers have no significant impact on soil respiration. Furthermore, the combination of 2% biochar with 40% RU has a carbon emission reduction effect compared to the UR and RU treatments.
- (4)
- NT, NF and NC significantly increase with the addition of biochar, while other root traits show different responses to biochar among different types of nitrogen fertilizers. The combination of biochar with 40% RU is more beneficial for rapeseed root growth and development compared to RU and UR treatments.
Author Contributions
Funding
Data Availability Statement
Acknowledgments
Conflicts of Interest
References
- Zhu, B.; Wang, T.; Kuang, F.; Luo, Z.; Tang, J.; Xu, T. Measurements of Nitrate Leaching from a Hillslope Cropland in the Central Sichuan Basin, China. Soil Sci. Soc. Am. J. 2009, 73, 1419–1426. [Google Scholar] [CrossRef]
- Zhou, Z.; Shi, X.; Zheng, Y.; Qin, Z.; Xie, D.; Li, Z.; Guo, T. Abundance and community structure of ammonia-oxidizing bacteria and archaea in purple soil under long-term fertilization. Eur. J. Soil Biol. 2014, 60, 24–33. [Google Scholar] [CrossRef]
- Fan, F.; Xie, D.; Wei, C.; Ni, J.; Yang, J.; Tang, Z.; Zhou, C. Reducing soil erosion and nutrient loss on sloping land under crop-mulberry management system. Environ. Sci. Pollut. Res. 2015, 22, 14067–14077. [Google Scholar] [CrossRef] [PubMed]
- Zhao, L.; Jin, J.; Du, S.; Liu, G. A Quantification of the Effects of Erosion on the Productivity of Purple Soils. J. Mt. Sci. 2012, 9, 96–104. [Google Scholar] [CrossRef]
- Zhou, M.; Zhu, B.; Butterbach-Bahl, K.; Wang, T.; Bergmann, J.; Brueggemann, N.; Wang, Z.; Li, T.; Kuang, F. Nitrate leaching, direct and indirect nitrous oxide fluxes from sloping cropland in the purple soil area, southwestern China. Environ. Pollut. 2012, 162, 361–368. [Google Scholar] [CrossRef]
- Myers, S.S.; Smith, M.R.; Guth, S.; Golden, C.D.; Vaitla, B.; Mueller, N.D.; Dangour, A.D.; Huybers, P. Climate Change and Global Food Systems: Potential Impacts on Food Security and Undernutrition. Annu. Rev. Public Health 2017, 38, 259. [Google Scholar] [CrossRef] [PubMed]
- Lehmann, J.; Joseph, S. Biochar for Environmental Management: An Introduction; Routledge: London, UK, 2009; pp. 1–12. [Google Scholar]
- Downie, A.; Crosky, A.; Munroe, P. Physical Properties of Biochar; Taylor and Francis: London, UK, 2012; Volume 9781849770552, pp. 13–32. [Google Scholar]
- Rasa, K.; Heikkinen, J.; Hannula, M.; Arstila, K.; Kulju, S.; Hyväluoma, J. How and why does willow biochar increase a clay soil water retention capacity? Biomass Bioenergy 2018, 119, 346–353. [Google Scholar] [CrossRef]
- Niu, Y.; Chen, Z.; Mueller, C.; Zaman, M.M.; Kim, D.; Yu, H.; Ding, W. Yield-scaled N2O emissions were effectively reduced by biochar amendment of sandy loam soil under maize—Wheat rotation in the North China Plain. Atmos. Environ. 2017, 170, 58–70. [Google Scholar] [CrossRef]
- Hagemann, N.; Joseph, S.; Schmidt, H.P.; Kammann, C.I.; Harter, J.; Borch, T.; Young, R.B.; Varga, K.; Taherymoosavi, S.; Elliott, K.W. Organic coating on biochar explains its nutrient retention and stimulation of soil fertility. Nat. Commun. 2017, 8, 1089. [Google Scholar] [CrossRef]
- Liu, M.; Linna, C.; Ma, S.; Ma, Q.; Guo, J.; Wang, F.; Wang, L. Effects of Biochar with Inorganic and Organic Fertilizers on Agronomic Traits and Nutrient Absorption of Soybean and Fertility and Microbes in Purple Soil. Front. Plant Sci. 2022, 13, 871021. [Google Scholar] [CrossRef]
- Cui, B.J.; Cui, E.P.; Hu, C.; Fan, X.Y.; Gao, F. Effects of Selected Biochars Application on the Microbial Community Structures and Diversities in the Rhizosphere of Water Spinach (Ipomoea aquatica Forssk.) Irrigated with Reclaimed Water. Environ. Sci. 2020, 41, 5636–5647. [Google Scholar] [CrossRef]
- Liu, Y.; Lonappan, L.; Brar, S.K.; Yang, S. Impact of biochar amendment in agricultural soils on the sorption, desorption, and degradation of pesticides: A review. Sci. Total Environ. 2018, 645, 60–70. [Google Scholar] [CrossRef]
- Azeem, M.; Hayat, R.; Hussain, Q.; Ahmed, M.; Pan, G.; Tahir, M.I.; Imran, M.; Irfan, M.; Mehmood-ul-Hassan. Biochar improves soil quality and N2-fixation and reduces net ecosystem CO2 exchange in a dryland legume-cereal cropping system. Soil Tillage Res. 2019, 186, 172–182. [Google Scholar] [CrossRef]
- Liu, M.; Linna, C.; Ma, S.; Ma, Q.; Song, W.; Shen, M.; Song, L.; Cui, K.; Zhou, Y.; Wang, L. Biochar combined with organic and inorganic fertilizers promoted the rapeseed nutrient uptake and improved the purple soil quality. Front. Nutr. 2022, 9, 997151. [Google Scholar] [CrossRef]
- Bruun, E.W.; Petersen, C.T.; Hansen, E.; Holm, J.K.; Hauggaard-Nielsen, H. Biochar amendment to coarse sandy subsoil improves root growth and increases water retention. Soil Use Manag. 2014, 30, 109–118. [Google Scholar] [CrossRef]
- Abiven, S.; Hund, A.; Martinsen, V.; Cornelissen, G. Biochar amendment increases maize root surface areas and branching: A shovelomics study in Zambia. Plant Soil 2015, 395, 45–55. [Google Scholar] [CrossRef]
- Feng, L.; Xu, W.; Tang, G.; Gu, M.; Geng, Z. Biochar induced improvement in root system architecture enhances nutrient assimilation by cotton plant seedlings. BMC Plant Biol. 2021, 21, 269. [Google Scholar] [CrossRef]
- Yang, S.; Xiao, Y.N.; Sun, X.; Ding, J.; Jiang, Z.; Xu, J. Biochar improved rice yield and mitigated CH4 and N2O emissions from paddy field under controlled irrigation in the Taihu Lake Region of China. Atmos. Environ. 2019, 200, 69–77. [Google Scholar] [CrossRef]
- Warnock, D.D.; Lehmann, J.; Kuyper, T.W.; Rillig, M.C. Mycorrhizal responses to biochar in soil—Concepts and mechanisms. Plant Soil 2007, 300, 9–20. [Google Scholar] [CrossRef]
- Yamamoto, C.F.; Pereira, E.I.; Mattoso, L.H.C.; Matsunaka, T.; Ribeiro, C. Slow release fertilizers based on urea/urea–formaldehyde polymer nanocomposites. Chem. Eng. J. 2016, 287, 390–397. [Google Scholar] [CrossRef]
- Tian, X.; Li, C.; Zhang, M.; Li, T.; Lu, Y.; Liu, L. Controlled release urea improved crop yields and mitigated nitrate leaching under cotton-garlic intercropping system in a 4-year field trial. Soil Tillage Res. 2018, 175, 158–167. [Google Scholar] [CrossRef]
- Sun, H.; Zhou, S.; Zhang, J.; Zhang, X.; Wang, C. Effects of controlled-release fertilizer on rice grain yield, nitrogen use efficiency, and greenhouse gas emissions in a paddy field with straw incorporation. Field Crops Res. 2020, 253, 107814. [Google Scholar] [CrossRef]
- Vejan, P.; Khadiran, T.; Abdullah, R.; Ahmad, N. Controlled release fertilizer: A review on developments, applications and potential in agriculture. J. Control. Release 2021, 339, 321–334. [Google Scholar] [CrossRef] [PubMed]
- Farmaha, B.S.; Sims, A.L. The Influence of Polymer-Coated Urea and Urea Fertilizer Mixtures on Spring Wheat Protein Concentrations and Economic Returns. Agron. J. 2013, 105, 1328–1334. [Google Scholar] [CrossRef]
- Zhao, C.; Gao, Z.; Liu, G.; Chen, Y.; Ni, W.; Lu, J.; Shi, Y.; Qian, Z.; Wang, W.; Huo, Z. Combining Controlled-Release Urea and Normal Urea to Improve the Yield, Nitrogen Use Efficiency, and Grain Quality of Single Season Late japonica Rice. Agronomy 2023, 13, 276. [Google Scholar] [CrossRef]
- Zheng, W.; Zhang, M.; Liu, Z.; Zhou, H.; Chen, B. Combining controlled-release urea and normal urea to improve the nitrogen use efficiency and yield under wheat-maize double cropping system. Field Crops Res. 2016, 197, 52–62. [Google Scholar] [CrossRef]
- Tian, X.; Li, Z.; Wang, L.; Wang, Y.; Li, B. Biochar and Slow Release Urea Effects on Root Morphology, Grain Yield, Nitrogen Uptake and Utilization in Brassica napus. Int. J. Agric. Biol. 2020, 23, 653–660. [Google Scholar]
- Bao, S.D. Soil Agrochemical Analysis; China Agriculture Press: Beijing, China, 2000; pp. 14–21. [Google Scholar]
- Dorich, R.A.; Nelson, D.W. Evaluation of Manual Cadmium Reduction Methods for Determination of Nitrate in Potassium Chloride Extracts of Soils. Soil Sci. Soc. Am. J. 1984, 48, 72–75. [Google Scholar] [CrossRef]
- Tan, B.; Li, Y.; Deng, D.; Pan, H.; Zeng, Y.; Tan, X.; Zhuang, W.; Li, Z. Rhizosphere inoculation of Nicotiana benthamiana with Trichoderma harzianum TRA1-16 in controlled environment agriculture: Effects of varying light intensities on the mutualism-parasitism interaction. Front. Plant Sci. 2022, 13, 989155. [Google Scholar] [CrossRef]
- Nelson, D.W.; Sommers, L.E. Total Carbon, Organic Carbon, and Organic Matter. Methods Soil Anal. 1996, 9, 961–1010. [Google Scholar] [CrossRef]
- Blair, G.; Lefroy, R.; Lisle, L. Soil carbon fractions based on their degree of oxidation, and the development of a carbon management index for agricultural systems. Aust. J. Agric. Res. 1995, 46, 393–406. [Google Scholar] [CrossRef]
- Franzluebbers, A.J.; Arshad, M.A. Particulate Organic Carbon Content and Potential Mineralization as Affected by Tillage and Texture. Soil Sci. Soc. Am. 1997, 61, 1382–1386. [Google Scholar] [CrossRef]
- Wang, H.; Kawamura, K.; Shooter, D. Carbonaceous and ionic components in wintertime atmospheric aerosols from two New Zealand cities: Implications for solid fuel combustion. Atmos. Environ. 2005, 39, 5865–5875. [Google Scholar] [CrossRef]
- Zhang, S.; Hussain, H.A.; Wang, L.; Hussain, S.; Li, B.; Zhou, H.; Luo, H.; Zhang, X.; Ma, Z.; Long, L.; et al. Responses of Soil Respiration and Organic Carbon to Straw Mulching and Ridge Tillage in Maize Field of a Triple Cropping System in the Hilly Region of Southwest China. Sustainability 2019, 11, 3068. [Google Scholar] [CrossRef]
- Yan, S.; Zhang, S.; Yan, P.; Aurangzeib, M. Effect of biochar application method and amount on the soil quality and maize yield in Mollisols of Northeast China. Biochar 2022, 4, 56. [Google Scholar] [CrossRef]
- Yao, T.; Zhang, W.; Gulaqa, A.; Cui, Y.; Zhou, Y.; Weng, W.; Wang, X.; Liu, Q.; Jin, F. Effects of Peanut Shell Biochar on Soil Nutrients, Soil Enzyme Activity, and Rice Yield in Heavily Saline-Sodic Paddy Field. J. Soil Sci. Plant Nutr. 2021, 21, 655–664. [Google Scholar] [CrossRef]
- Kizito, S.; Luo, H.; Lu, J.; Bah, H.; Dong, R.; Wu, S. Role of Nutrient-Enriched Biochar as a Soil Amendment during Maize Growth: Exploring Practical Alternatives to Recycle Agricultural Residuals and to Reduce Chemical Fertilizer Demand. Sustainability 2019, 11, 3211. [Google Scholar] [CrossRef]
- Yao, Q.; Liu, J.; Yu, Z.; Li, Y.; Jin, J.; Liu, X.; Wang, G. Three years of biochar amendment alters soil physiochemical properties and fungal community composition in a black soil of northeast China. Soil Biol. Biochem. 2017, 110, 56–67. [Google Scholar] [CrossRef]
- Zwieten, L.V.; Kimber, S.; Morris, S.; Chan, K.Y.; Downie, A.; Rust, J.; Joseph, S.; Cowie, A. Effects of biochar from slow pyrolysis of papermill waste on agronomic performance and soil fertility. Plant Soil 2010, 327, 235–246. [Google Scholar] [CrossRef]
- Sarkhot, D.V.; Ghezzehei, T.A.; Berhe, A.A. Effectiveness of Biochar for Sorption of Ammonium and Phosphate from Dairy Effluent. J. Environ. Qual. 2013, 42, 1545–1554. [Google Scholar] [CrossRef]
- Sun, Q.; Meng, J.; Lan, Y.; Shi, G.; Yang, X.; Cao, D.; Chen, W.; Han, X. Long-term effects of biochar amendment on soil aggregate stability and biological binding agents in brown earth. Catena 2021, 205, 105460. [Google Scholar] [CrossRef]
- Theis, J.E.; Rillig, M. Characteristics of Biochar: Biological Properties; Biochar for Environmental Management; Lehmann, J., Joseph, S., Eds.; Earthscan: London, UK, 2009; pp. 85–105. [Google Scholar] [CrossRef]
- Dong, L.; Yang, X.; Shi, L.; Shen, Y.; Wang, L.; Wang, J.; Li, C.; Zhang, H. Biochar and nitrogen fertilizer co-application changed SOC content and fraction composition in Huang-Huai-Hai plain, China. Chemosphere 2022, 291, 132925. [Google Scholar] [CrossRef] [PubMed]
- Zhang, J.; Zhou, S.; Sun, H.; Lü, F.; He, P. The soluble fraction from straw-derived biochar supplies nutrients and affects carbon storage of coastal mudflat soil in rice paddy. Environ. Sci. Pollut. Res. 2020, 27, 18079–18088. [Google Scholar] [CrossRef] [PubMed]
- Tian, J.; Wang, J.; Dippold, M.; Gao, Y.; Blagodatskaya, E.; Kuzyakov, Y. Biochar affects soil organic matter cycling and microbial functions but does not alter microbial community structure in a paddy soil. Sci. Total Environ. 2016, 556, 89–97. [Google Scholar] [CrossRef]
- Yang, X.; Wang, D.; Lan, Y.; Meng, J.; Jiang, L.; Sun, Q.; Cao, D.; Sun, Y.; Chen, W. Labile organic carbon fractions and carbon pool management index in a 3-year field study with biochar amendment. J. Soil Sediments 2018, 18, 1569–1578. [Google Scholar] [CrossRef]
- Yang, X.; Meng, J.; Lan, Y.; Chen, W.; Yang, T.; Yuan, J.; Liu, S.; Han, J. Effects of maize stover and its biochar on soil CO2 emissions and labile organic carbon fractions in Northeast China. Agric. Ecosyst. Environ. 2017, 240, 24–31. [Google Scholar] [CrossRef]
- Grant, C.A.; Wu, R.; Selles, F.; Harker, K.N.; Clayton, G.W.; Bittman, S.; Zebarth, B.J.; Lupwayi, N.Z. Crop yield and nitrogen concentration with controlled release urea and split applications of nitrogen as compared to non-coated urea applied at seeding. Field Crops Res. 2012, 127, 170–180. [Google Scholar] [CrossRef]
- Han, L.; Sun, K.; Yang, Y.; Xia, X.; Li, F.; Yang, Z.; Xing, B. Biochar’s stability and effect on the content, composition and turnover of soil organic carbon. Geoderma 2020, 364, 114184. [Google Scholar] [CrossRef]
- Matovic, D. Biochar as a viable carbon sequestration option: Global and Canadian perspective. Energy 2011, 36, 2011–2016. [Google Scholar] [CrossRef]
- Liang, B.; Lehmann, J.; Sohi, S.P.; Thies, J.E.; O’Neill, B.; Trujillo, L.; Gaunt, J.; Solomon, D.; Grossman, J.; Neves, E.G.; et al. Black carbon affects the cycling of non-black carbon in soil. Org. Geochem. 2010, 41, 206–213. [Google Scholar] [CrossRef]
- Liu, S.; Zhang, Y.; Zong, Y.; Hu, Z.; Wu, S.; Zhou, J.I.; Jin, Y.; Zou, J. Response of soil carbon dioxide fluxes, soil organic carbon and microbial biomass carbon to biochar amendment: A meta-analysis. Gcb Bioenergy 2015, 8, 392–406. [Google Scholar] [CrossRef]
- Zimmerman, A.R.; Gao, B.; Ahn, M.-Y. Positive and negative carbon mineralization priming effects among a variety of biochar-amended soils. Soil Biol. Biochem. 2011, 43, 1169–1179. [Google Scholar] [CrossRef]
- Smith, J.L.; Collins, H.P.; Bailey, V.L. The effect of young biochar on soil respiration. Soil Biol. Biochem. 2010, 42, 2345–2347. [Google Scholar] [CrossRef]
- Spokas, K.A.; Reicosky, D.C. Impacts of Sixteen Different Biochars on Soil Greenhouse Gas Production. Ann. Environ. Sci. 2009, 3, 179–193. [Google Scholar]
- Liu, X.; Zheng, J.; Zhang, D.; Cheng, K.; Zhou, H.; Zhang, A.; Li, L.; Joseph, S.; Smith, P.; Crowley, D.; et al. Biochar has no effect on soil respiration across Chinese agricultural soils. Sci. Total Environ. 2016, 554–555, 259–265. [Google Scholar] [CrossRef] [PubMed]
- Subedi, R.; Taupe, N.; Pelissetti, S.; Petruzzelli, L.; Bertora, C.; Leahy, J.J.; Grignani, C. Greenhouse gas emissions and soil properties following amendment with manure-derived biochars: Influence of pyrolysis temperature and feedstock type. J. Environ. Manag. 2016, 166, 73–83. [Google Scholar] [CrossRef]
- Zhang, T.a.; Chen, H.Y.H.; Ruan, H. Global negative effects of nitrogen deposition on soil microbes. ISME J. 2018, 12, 1817–1825. [Google Scholar] [CrossRef] [PubMed]
- Inukai, Y.; Ashikari, M.; Kitano, H.; Matsuoka, M. Function of the root system and molecular mechanism of crown root formation in rice. In Plant and Cell Physiology; Oxford University Press: Oxford, UK, 2004; p. S17. [Google Scholar]
- Xiang, Y.; Deng, Q.; Duan, H.; Guo, Y. Effects of biochar application on root traits: A meta-analysis. GCB Bioenergy 2017, 9, 1563–1572. [Google Scholar] [CrossRef]
- Li, Q.; Fu, Q.; Li, T.; Liu, D.; Hou, R.; Li, M.; Gao, Y. Biochar impacts on the soil environment of soybean root systems. Sci. Total Environ. 2022, 821, 153421. [Google Scholar] [CrossRef]
- Bruun, S.; Clauson-Kaas, S.; Bobuľská, L.; Thomsen, I.K. Carbon dioxide emissions from biochar in soil: Role of clay, microorganisms and carbonates. Eur. J. Soil Sci. 2014, 65, 52–59. [Google Scholar] [CrossRef]
- Joseph, S.D.; Camps-Arbestain, M.; Lin, Y.; Munroe, P.; Chia, C.H.; Hook, J.; van Zwieten, L.; Kimber, S.; Cowie, A.; Singh, B.P.; et al. An investigation into the reactions of biochar in soil. Soil Res. 2010, 48, 501–515. [Google Scholar] [CrossRef]
- Rondon, M.A.; Lehmann, J.; Ramírez, J.; Hurtado, M. Biological nitrogen fixation by common beans (Phaseolus vulgaris L.) increases with bio-char additions. Biol. Fertil. Soils 2007, 43, 699–708. [Google Scholar] [CrossRef]
- Deenik, J.L.; McClellan, A.; Uehara, G. Biochar volatile matter content effects on plant growth and nitrogen transformations in a tropical soil. In Proceedings of the Western Nutrient Management Conference, Salt Lake City, UT, USA, 4–5 March 2009; pp. 26–31. [Google Scholar]


| Treatment | UR | RU | 60% UR + 40% RU (40% RU) |
|---|---|---|---|
| Biochar 0%(C0) | URC0 | RUC0 | 40%RUC0 |
| Biochar 2%(C1) | URC1 | RUC1 | 40%RUC1 |
| Biochar 4%(C2) | URC2 | RUC2 | 40%RUC2 |
| Treatment | UR (g) | RU (g) | P2O5 (g) | K2O (g) | Biochar (g) | Soil (g) | Total Applied N (g) | Total Applied C (g) |
|---|---|---|---|---|---|---|---|---|
| CK | 0 | 0 | 0.75 | 0.75 | 0 | 5000 | 0 | 0 |
| URC0 | 1 | 0 | 0.75 | 0.75 | 0 | 5000 | 1 | 0.429 |
| URC1 | 1 | 0 | 0.75 | 0.75 | 100 | 5000 | 1.061 | 54.226 |
| URC2 | 1 | 0 | 0.75 | 0.75 | 200 | 5000 | 1.122 | 108.023 |
| RUC0 | 0 | 1 | 0.75 | 0.75 | 0 | 5000 | 1 | 0.436 |
| RUC1 | 0 | 1 | 0.75 | 0.75 | 100 | 5000 | 1.061 | 54.233 |
| RUC2 | 0 | 1 | 0.75 | 0.75 | 200 | 5000 | 1.122 | 108.030 |
| 40% RUC0 | 0.6 | 0.4 | 0.75 | 0.75 | 0 | 5000 | 1 | 0.432 |
| 40% RUC1 | 0.6 | 0.4 | 0.75 | 0.75 | 100 | 5000 | 1.061 | 54.229 |
| 40% RUC2 | 0.6 | 0.4 | 0.75 | 0.75 | 200 | 5000 | 1.122 | 108.026 |
| Factors | SOM (g·kg−1) | TN (g·kg−1) | TP (g·kg−1) | TK (g·kg−1) | AN (mg·kg−1) | AP (mg·kg−1) | AK (mg·kg−1) |
|---|---|---|---|---|---|---|---|
| N | ** | ** | ** | ** | * | ns | ** |
| B | ** | ** | ** | ** | ** | ** | ** |
| N*B | ** | ** | ** | * | ** | ** | * |
| Treatment | Blooming Stage | Maturity Stage | ||||||
|---|---|---|---|---|---|---|---|---|
| TOC (g·kg−1) | POC (g·kg−1) | WSOC (g·kg−1) | ROC (g·kg−1)) | TOC (g·kg−1) | POC (g·kg−1) | WSOC (g·kg−1) | ROC (g·kg−1) | |
| URC0 | 6.60 + 0.46 de | 3.15 + 0.02 c | 0.53 + 0.01 c | 9.59 + 0.35 b | 6.08 + 0.13 f | 3.00 + 0.03 c | 0.81 + 0.01 c | 3.92 + 0.78 bc |
| URC1 | 8.00 + 0.26 bc | 4.70 + 0.02 a | 0.54 + 0.02 c | 12.32 + 0.91 b | 9.36 + 0.47 d | 4.55 + 0.83 b | 1.08 + 0.05 a | 6.67 + 0.86 a |
| URC2 | 9.69 + 0.20 a | 4.63 + 0.00 a | 0.61 + 0.06 c | 10.31 + 1.02 b | 10.78 + 0.47 c | 5.34 + 0.41 b | 0.97 + 0.01 b | 6.39 + 0.17 a |
| RUC0 | 6.44 + 0.34 de | 3.09 + 0.15 c | 0.38 + 0.07 d | 8.42 + 0.69 b | 4.14 + 0.25 h | 3.10 + 0.10 c | 0.73 + 0.03 d | 6.49 + 0.63 a |
| RUC1 | 9.13 + 0.77 a | 4.10 + 0.09 b | 0.37 + 0.06 d | 12.84 + 0.33 a | 6.68 + 0.11 e | 4.28 + 0.06 b | 0.90 + 0.02 b | 6.03 + 0.56 a |
| RUC2 | 8.84 + 0.64 ab | 4.61 + 0.42 a | 0.73 + 0.01 b | 8.61 + 1.67 b | 11.64 + 0.55 b | 5.84 + 0.06 a | 0.75 + 0.01 cd | 5.14 + 0.09 ab |
| 40% RUC0 | 6.16 + 0.35 e | 2.70 + 0.15 d | 0.62 + 0.07 c | 8.67 + 1.16 b | 4.91 + 0.07 g | 3.53 + 0.08 c | 0.93 + 0.07 b | 3.69 + 0.41 c |
| 40% RUC1 | 7.43 + 0.82 cd | 4.45 + 0.32 a | 0.60 + 0.02 c | 11.94 + 0.89 a | 10.31 + 0.23 c | 3.62 + 0.15 c | 0.92 + 0.03 b | 5.14 + 0.54 ab |
| 40% RUC2 | 10.03 + 0.58 a | 4.93 + 0.17 a | 0.85 + 0.00 a | 7.92 + 0.62 b | 16.50 + 0.21 a | 6.05 + 0.39 a | 0.90 + 0.04 b | 5.21 + 0.64 ab |
| N | ns | ns | ** | * | ** | ns | ** | ** |
| B | ** | ** | ** | ** | ** | ** | ** | ** |
| N*B | ** | ** | ** | ns | ** | ** | ** | ** |
| Factors | Seedling Stage | Bud Stage | Blooming Stage | Pod Stage |
|---|---|---|---|---|
| N | ** | ** | ** | ** |
| B | ** | ** | ** | ** |
| N*B | ** | ** | ** | * |
| Factors | RD (mm) | ARD (mm) | RL (cm) | NT | NF | NC |
|---|---|---|---|---|---|---|
| N | ** | ** | ** | ns | ** | * |
| B | ** | ** | ** | ** | ** | ** |
| N*B | ** | ** | ** | ns | ** | ns |
Disclaimer/Publisher’s Note: The statements, opinions and data contained in all publications are solely those of the individual author(s) and contributor(s) and not of MDPI and/or the editor(s). MDPI and/or the editor(s) disclaim responsibility for any injury to people or property resulting from any ideas, methods, instructions or products referred to in the content. |
© 2023 by the authors. Licensee MDPI, Basel, Switzerland. This article is an open access article distributed under the terms and conditions of the Creative Commons Attribution (CC BY) license (https://creativecommons.org/licenses/by/4.0/).
Share and Cite
Li, B.; Tian, X.; Zhang, S.; Duan, M.; Wang, L. Effects of Combined Application of Biochar and Different Types of Nitrogen Fertilizers on Rapeseed Root Growth and Properties of Purple Soil in Southwest China. Agronomy 2023, 13, 2209. https://doi.org/10.3390/agronomy13092209
Li B, Tian X, Zhang S, Duan M, Wang L. Effects of Combined Application of Biochar and Different Types of Nitrogen Fertilizers on Rapeseed Root Growth and Properties of Purple Soil in Southwest China. Agronomy. 2023; 13(9):2209. https://doi.org/10.3390/agronomy13092209
Chicago/Turabian StyleLi, Biao, Xiaoqin Tian, Sai Zhang, Meichun Duan, and Longchang Wang. 2023. "Effects of Combined Application of Biochar and Different Types of Nitrogen Fertilizers on Rapeseed Root Growth and Properties of Purple Soil in Southwest China" Agronomy 13, no. 9: 2209. https://doi.org/10.3390/agronomy13092209