Article

Complete Mitochondrial Genome Sequence, Characteristics, and Phylogenetic Analysis of Oenanthe javanica

1
College of Horticulture, Sichuan Agricultural University, Chengdu 611130, China
2
Institute of Horticulture, Guizhou Academy of Agricultural Sciences, Guiyang 550006, China
*
Authors to whom correspondence should be addressed.
These authors contributed equally to this work.
Agronomy 2023, 13(8), 2103; https://doi.org/10.3390/agronomy13082103
Submission received: 3 July 2023 / Revised: 1 August 2023 / Accepted: 7 August 2023 / Published: 10 August 2023

Abstract

:
The plant mitochondria play a crucial role in various cellular energy synthesis and conversion processes and are essential for plant growth. Watercress (Oenanthe javanica) is a fast-growing vegetable with strong adaptability and wide cultivation range, and it possesses high nutritional value. In our study, we assembled the O. javanica mitochondrial genome using the Illumina and Nanopore sequencing platforms. The results revealed that the mitochondrial genome map of watercress has a circular structure of 384,074 bp, containing 28 tRNA genes, 3 rRNA genes, and 34 protein-coding genes. A total of 87 SSR (simple sequence repeat) loci were detected, with 99% composed of palindrome repeats and forward repeats, while no complementary repeats were identified. Codon preference analysis indicated that watercress prefers to use codons encoding leucine, isoleucine, and serine with a preference for A/U-ending codons. Phylogenetic analysis showed that watercress is closely related to species of Bupleurum, Apium, Angelica, and Daucus, with the closest evolutionary relationship observed with Saposhnikovia divaricata and Apium graveolens. This study provides a valuable resource for the study of the evolution and molecular breeding of watercress.

1. Introduction

Plant genomes consist of nuclear, chloroplast, and mitochondrial components, with each exhibiting different genetic and evolutionary patterns [1]. Among them, mitochondria are essential organelles in most eukaryotes and play a crucial role in cellular energy production [2]. Plant mitochondrial genomes, known as the largest organelle genomes, exhibit low synonymous substitution rates, relatively frequent rearrangements, and high levels of inversions and recombinations [3]. Horizontal transfer of mitochondrial genes was observed in early stages of plant evolution [4], and most transferred mitochondrial genes are ribosomal-protein-coding genes [5]. The transferred genetic information includes not only complete functional genes but also noncoding sequences and gene fragments [6]. Repeat sequences play a vital role in maintaining the structure of noncoding regions in the plant mitochondrial genome through their involvement in genome rearrangements [7], inversions, insertions, and deletions [8,9]. Plant mitochondrial genomes are known to vary significantly between species, and scattered repeat sequences can give rise to multipartite structures within a species [10]. In addition, plant mitochondria have lower mutation rates than their nuclear or chloroplast genomes with high variation in genome size, gene order, and intergenic sequences but high conservation in protein-coding sequences [7]. Hence, the highly conserved features of the mitochondrial genome can provide valuable information for the study of plant evolution and phylogenetics [11].
Plant mitochondrial genomes have generally received less attention than plastid or nuclear genomes. This is mainly due to the larger size of plant mitochondrial genomes (typically around 400 kb) compared to animal mitochondrial genomes (usually 10–39 kb) [12] as well as the substantial differences in genome size, structure, and rearrangement patterns, leading to extensive variation in structural dynamics and repetitive DNA content [13]. Consequently, the complexity of the structure presents a challenging task for mitochondrial genome sequencing [14]. However, with the rapid development of sequencing platforms and assembly programs, a growing number of mitochondrial genomes have been completely sequenced [2], providing a rich source of data for molecular breeding of plant genetic resources, such as Coptis chinensis [15], Physcomitrella patens [16], Nymphaea colorata [17], Piper betle [18], Actinidia chinensis [19], Apium graveolens [20], etc. Against this research background, exploring the intrinsic information of mitochondrial genomes at a broader taxonomic scale will provide a theoretical basis for the study of plant genetics, evolution, and genetic resources.
Watercress (Oenanthe javanica (Blume) DC.) is a perennial aquatic herb of the Oenanthe genus in the Apiaceae family [21], cultivated in tropical and temperate regions of Asia for thousands of years [22]. Watercress is highly nutritious, containing fiber, vitamins, minerals, flavonoids, and other substances in its edible stems and leaves [23,24]. It aids digestion and has medicinal properties such as anti-inflammatory, antioxidant, and antihypertensive effects, making it a vegetable with both culinary and medicinal value [25]. In addition, watercress is appreciated for its unique texture and flavor, which makes it popular with people [26]. With its fast growth, wide geographical distribution, high adaptability, and extensive growing range, watercress is a desirable off-season vegetable and a favorite with consumers. Currently, research on watercress has mainly focused on its nutritional composition and cultivation physiology, and the lack of comprehensive genomic data has limited in-depth studies on watercress. Although some phylogenetic studies have reported the chloroplast genome sequence, transcriptome, and miRNA data of watercress [27,28], a complete mitochondrial genome sequence is still lacking. Therefore, analyzing the sequence structure characteristics of watercress mitochondria will help to enrich its genomic data and elucidate the phylogenetic relationships between watercress and other species in the Apiaceae family.
In this study, we assembled the complete mitochondrial genome of watercress and analyzed its gene content, repetitive sequences, codon preference, RNA editing sites, Pi nucleotide diversity, and phylogenetic relationships. In addition, we studied the structural analysis of the mitochondria and the gene transfer between the chloroplast and the mitochondrial genome. These findings will improve our understanding of the organellar genome and genetic diversity of watercress and provide opportunities for further genomic breeding research in watercress.

2. Materials and Methods

2.1. Plant Materials

Watercress samples were collected from Xiongshi Village, Qixingguan District, Bijie City, Guizhou Province. The plants were transplanted to the greenhouse of the Institute of Horticulture Research, Guizhou Academy of Agricultural Sciences, in January 2022. During the stage of vigorous leaf growth in April 2022, the leaves were harvested and rapidly frozen in liquid nitrogen and stored at −80 °C for mitochondrial genome sequencing. High-quality total genomic DNA was extracted from fresh leaves using a plant DNA extraction kit (TransGene, Beijing, China), and the DNA quality and concentration were checked using 1% agarose gel electrophoresis and NanoDrop ND 2000 (ThermoFischer, Waltham, MA, USA).

2.2. Mitogenome Assembly and Annotation

To obtain the full-length mitochondrial genome with high accuracy, short-read and long-read sequencing technologies were combined in this study. The short-read sequencing platform was Illumina Novaseq 6000 (Illumina, San Diego, CA, USA), and the paired-end sequencing (PE) read length was 150 bp. The fastp software (v0.20.0, https://github.com/OpenGene/fastp, accessed on 15 June 2022) was used to filter the original data and obtain high-quality reads [29]. The long-read sequencing platform was Nanopore PromethION (Nanopore, Oxford, UK), and the sequencing data were filtered by filtlong (v0.2.1) software. Plant mitochondrial genes (CDS and rRNA) are highly conserved. Taking advantage of this characteristic, the alignment software Minimap2 (v2.1) was used to align the raw long-read sequencing data with the reference gene sequences (plant mitochondrial core genes, https://github.com/xul962464/plant_mt_ref_gene, accessed on 15 June 2022) in order to obtain all the long-read sequencing data of the mitochondrial genome. Then, the assembly software canu [30] was used to correct the long-read sequencing data obtained, and bowtie2 (v2.3.5.1) was used to align the short-read sequencing data to the corrected sequence. Then, the default parameter Unicycler (v0.4.8) was used to compare the above short-read sequencing data and the corrected long-read sequencing data for concatenation. Finally, the complete mitochondrial genome of watercress was submitted to the NCBI database under the accession number OR209169.

2.3. Mitochondrial Gene Annotation and Analysis

Protein-coding genes and rRNA genes were annotated by comparing them with published plant mitochondrial sequences and further adjusted based on closely related species. Related species included Apium graveolens (MZ328722.1), Apium leptophyllum (MZ328723.1), Ferula sinkiangensis (OK585063.1), Bupleurum chinense (OK166971.1), Saposhnikovia divaricate (MZ128146.1), and Daucus carota (NC_017855.1). tRNA annotation was performed using tRNAscan-SE software (http://lowelab.ucsc.edu/tRNAscan-SE/, accessed on 17 June 2022) [31]. ORFs were predicted using the NCBI Open Reading Frame Finder (https://www.ncbi.nlm.nih.gov/orffinder/, accessed on 17 June 2022) with a minimum length of 102 bp. Redundant sequences and sequences overlapping with known genes were excluded. Sequences longer than 300 bp were annotated by searching against the nonredundant database (nr) using BLASTn software (v2.10.1). The mitochondrial genome map was generated using OGDRAW (https://chlorobox.mpimp-golm.mpg.de/OGDraw.html, accessed on 17 June 2022).

2.4. Repeat Sequence Analysis and Chloroplast-to-Mitochondrial DNA Transfer Analysis

SSRs were identified using MISA v1.0 software. Tandem repeats were identified using TRF software (trf409.linux64), and dispersed repeats were identified using BLASTn software (v2.10.1) with the redundant and tandem repeats removed. The identified repeats were visualized using Circos (v0.69-5). Chloroplast data of watercress with the GenBank accession number MT622521 were downloaded from the NCBI. BLAST search was performed to find homologous sequences between the chloroplast and mitochondrial genomes, with the similarity threshold set at 70% and the E-value set at 10-5. The results of homologous sequences were visualized using Circos (v0.69-5).

2.5. Mitochondrial Genome Feature Analysis

RNA editing sites were predicted using the online software PREP Suite (http://prep.unl.edu/, accessed on 18 June 2022). Codon usage bias analysis was performed using a Perl script developed in-house following the method described by Li et al. [32] for analyzing codon usage bias in protein-coding genes. Multiple sequence alignment of homologous gene sequences from different species was performed using MAFFT v7.427 software, and the pi value for each gene was calculated using DnaSP. The software CGVIEW (RELEASE-2017_09_19, http://stothard.afns.ualberta.ca/cgview_server/, accessed on 18 June 2022) was used with default parameters for comparative analysis of mitochondrial genome structures among closely related species.

2.6. Genome Comparative Analysis

Sequences from six species in the Apiaceae family, including Saposhnikovia divaricate (MZ128146.1), Apium leptophyllum (MZ328723.1), Daucus carota (JQ248574.1), Bupleurum chinense (KX887330.1), and Ferula sinkiangensis (OK585063.1), were download for comparative analysis of mitochondrial genomes. The software nucmer (4.0.0beta2) was used for genome alignment of other sequences and assembled sequences to generate dot plot graphs. The assembled species were compared with the selected species using the blastn (2.10.1+) algorithm, setting the -word_size to 7 and the E-value to 1 × 10⁻⁵ and selecting fragments with a comparison length greater than 300 bp to construct the multiplexed synteny map.

2.7. Phylogenetic Analysis

Mitochondrial genome sequences of 29 species in the family Apiaceae, including Bupleurum chinense (OK166971.1), Saposhnikovia divaricata (MZ128146.1), and Lactuca sativa (MK642355.1), were selected from the NCBI database for collinearity analysis with Oenanthe. Multiple sequence alignment of shared CDS sequences was performed using MAFFT in auto mode, and the aligned sequences were concatenated and trimmed using trimAl (v1.4.rev15, parameter: -gt 0.7). The model was predicted using jmodeltest-2.1.10 software, and the GTR model type was determined. Finally, the maximum likelihood phylogenetic tree was constructed using RAxML (v8.2.10) with the GTRGAMMA model and 1000 bootstrap replicates.

3. Results

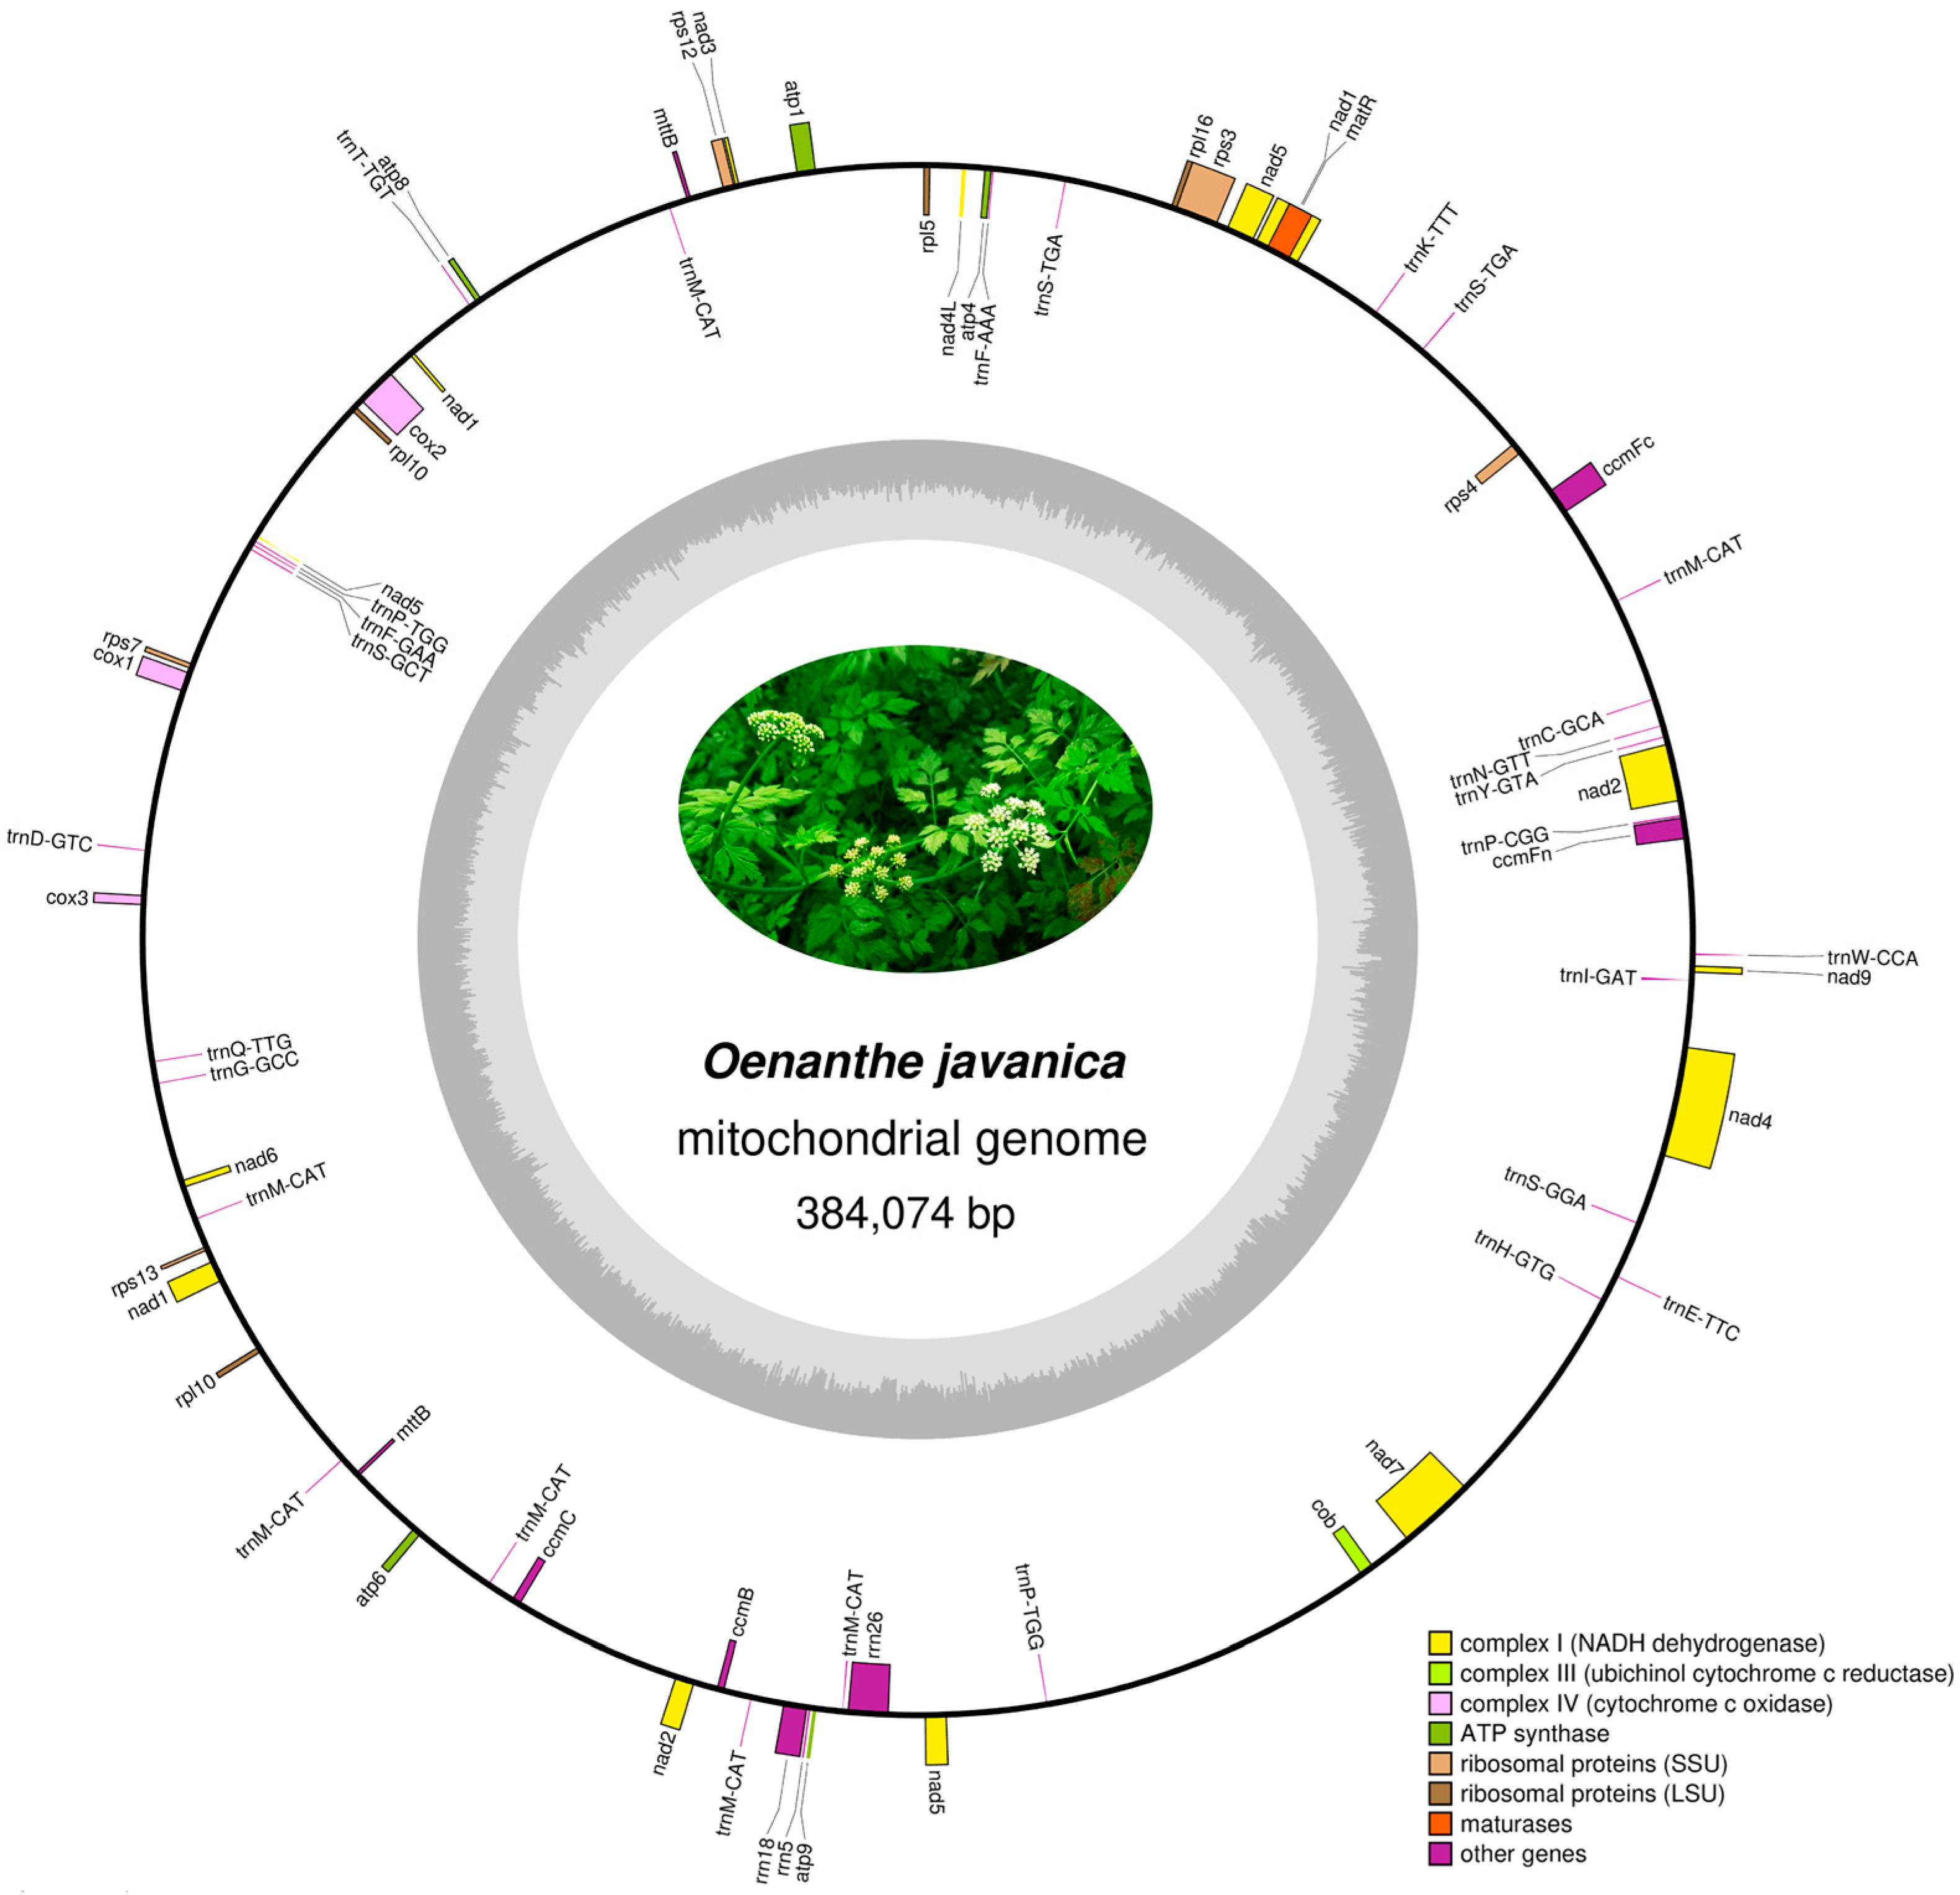
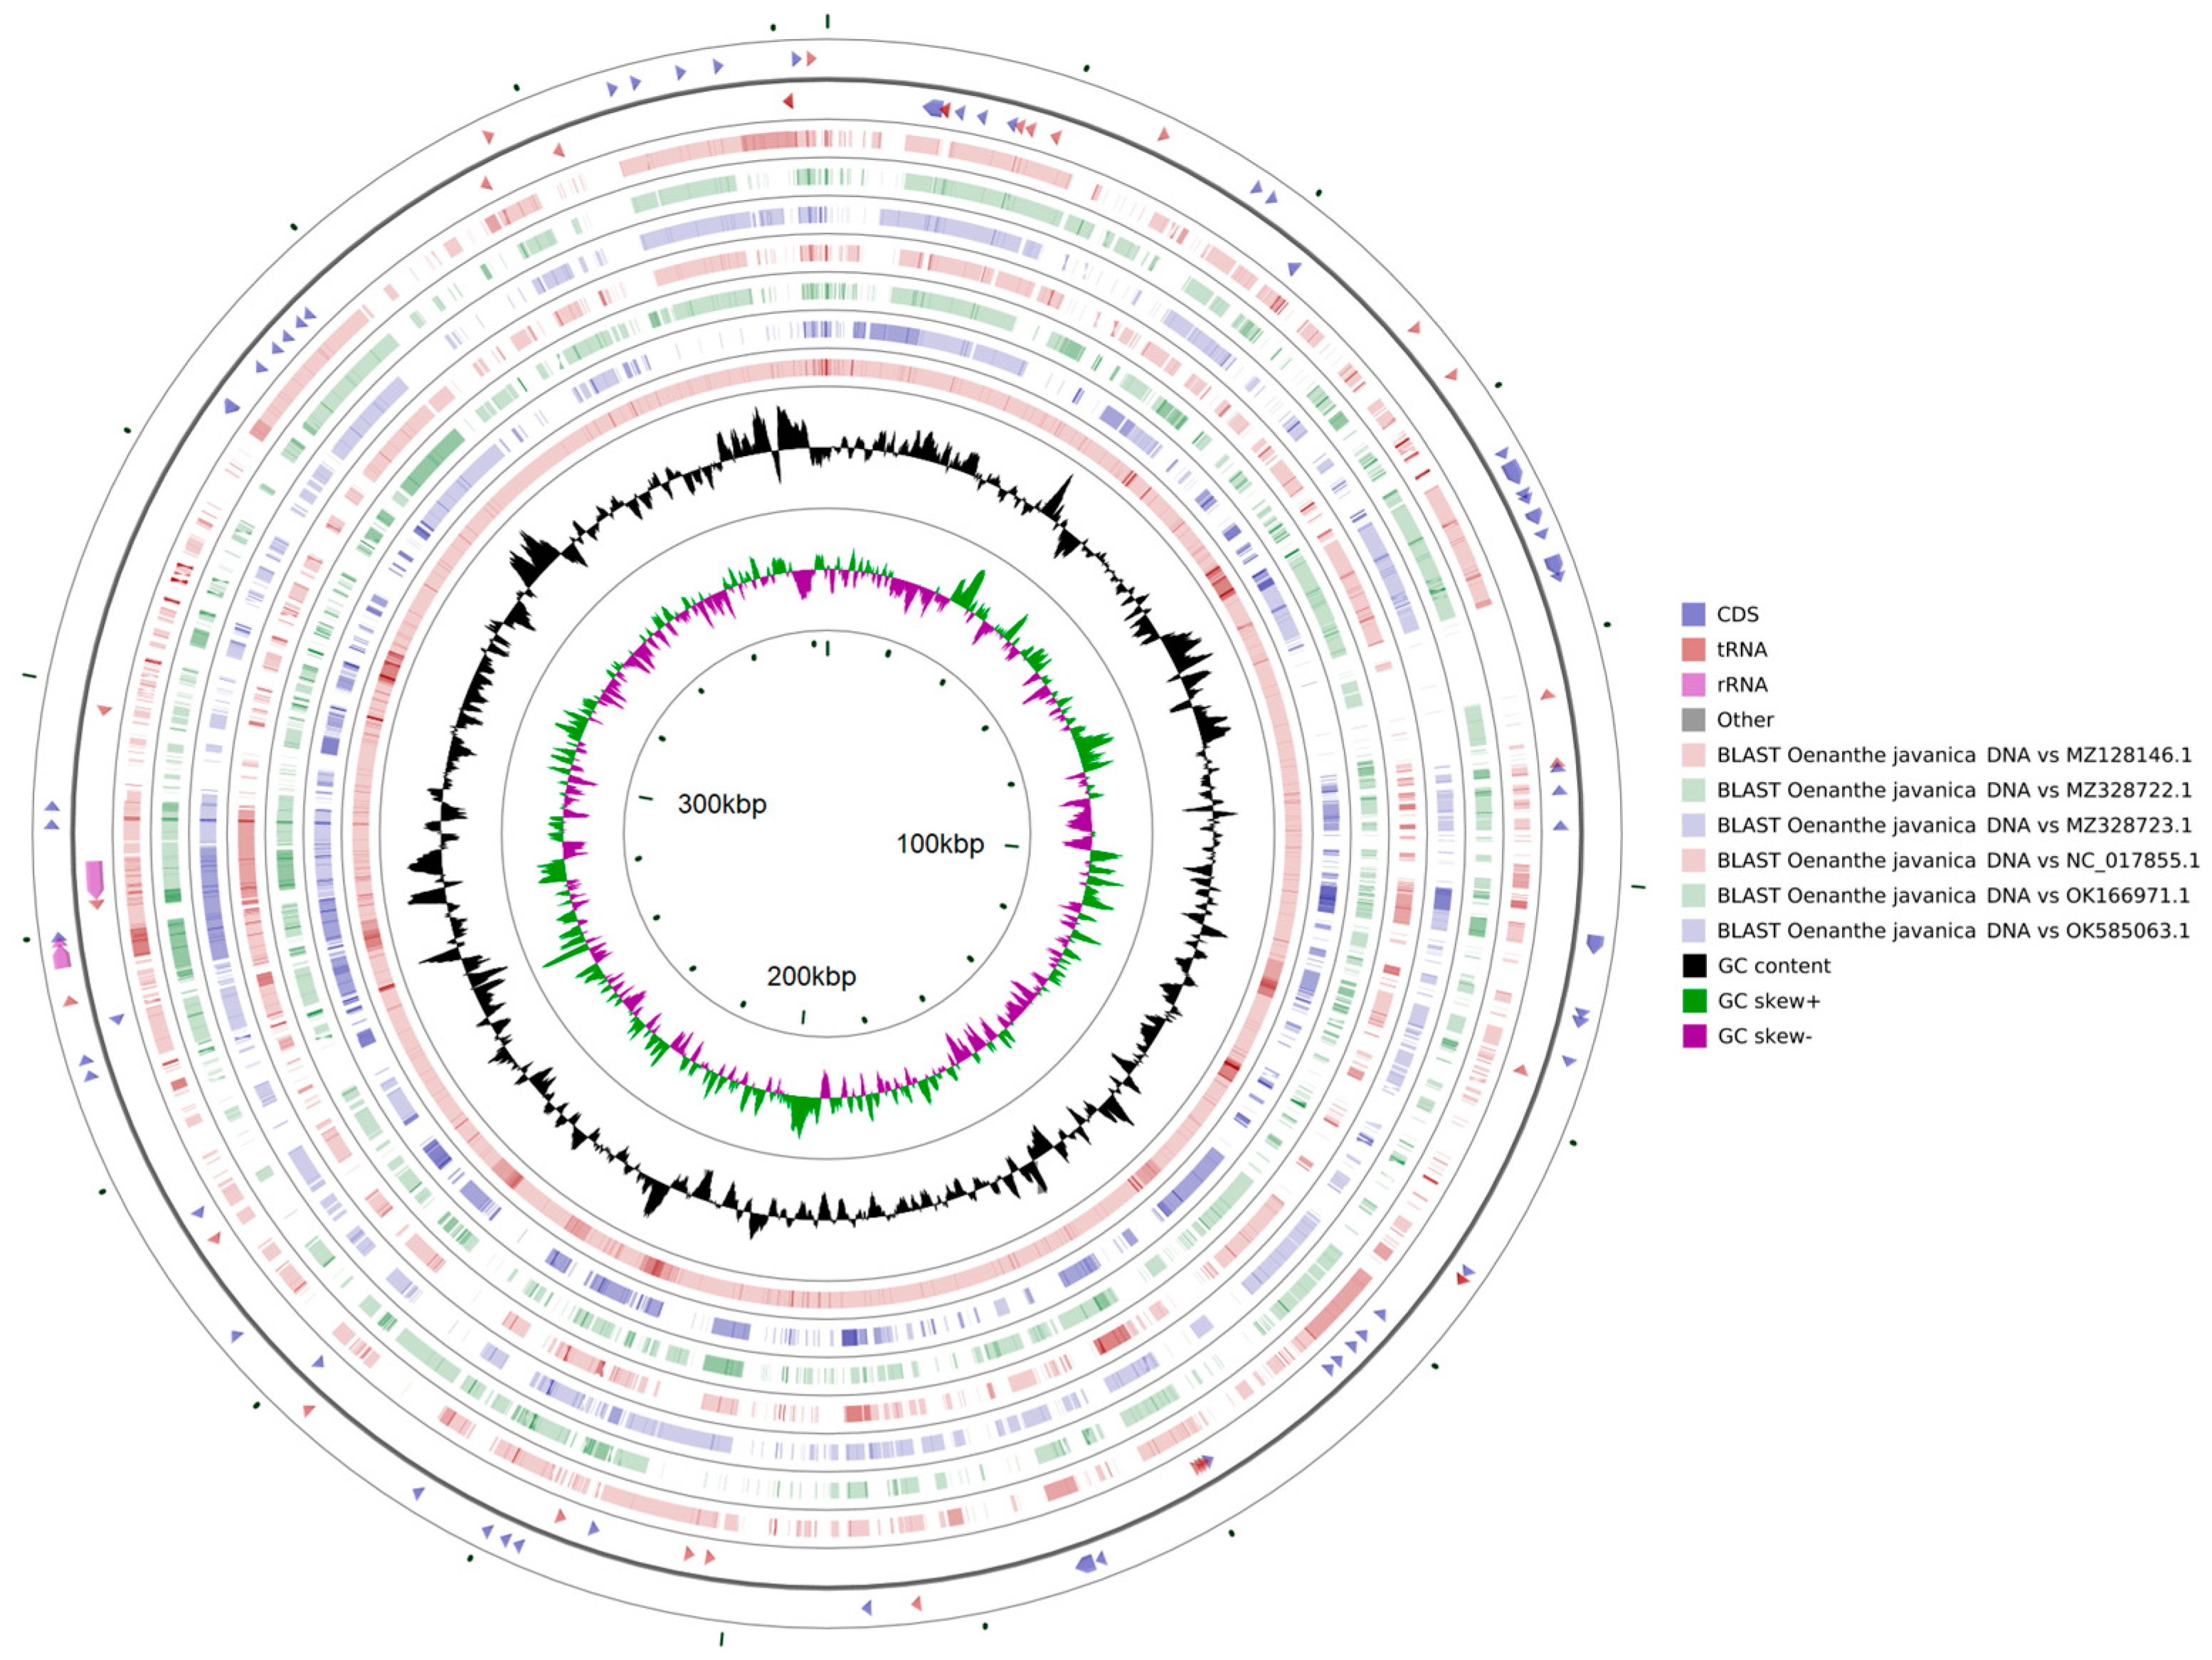
3.1. Assembly and Basic Features of the O. javanica Mitochondrial Genome

The mitochondrial genome of O. javanica was sequenced, resulting in a total of 7,359,287,400 base pairs (bp) of gene sequences. The mitochondrial genome showed a complex multibranched structure. After excluding repetitive regions, a high quality clean read dataset of 24,530,958 bp was obtained. Finally, the mitochondrial genome of watercress was assembled and mapped to a circular structure with 384,074 bp (Figure 1 and Table S1). The GC content was 44.97%, and the base composition showed an AT bias. Only three tRNA genes contained one intron each, indicating that the watercress mitochondrial genome is compact. The watercress mitochondrial genome was annotated, revealing a total of 65 genes, including 28 tRNA genes, 3 rRNA genes, and 34 protein-coding genes (Table 1 and Table S2). The protein-coding genes (PCGs) included 25 unique core mitochondrial genes: five ATP synthase genes, nine NADH dehydrogenase genes, one cytochrome c biogenesis gene, four cytochrome c oxidase genes, two transporter membrane protein genes, one mature enzyme gene, and three cytochrome c oxidase genes. In addition, nine noncore mitochondrial genes were identified, including four large subunit ribosomal protein genes and five small subunit ribosomal protein genes. Among the tRNA genes identified, trnI-GAT and trnP-CGG contained one intron each. Among all the mitochondrial genes, five were found to be multicopy genes, including the membrane transport protein gene (mttB), the ribosomal large subunit gene (rpl10), and three tRNA genes (trnM-CAT, trnP-TGG, and trnS-TGA). The trnM-CAT gene had up to seven copies, while the other genes (mttB, rpl10, trnP-TGG, and trnS-TGA) had two copies each.

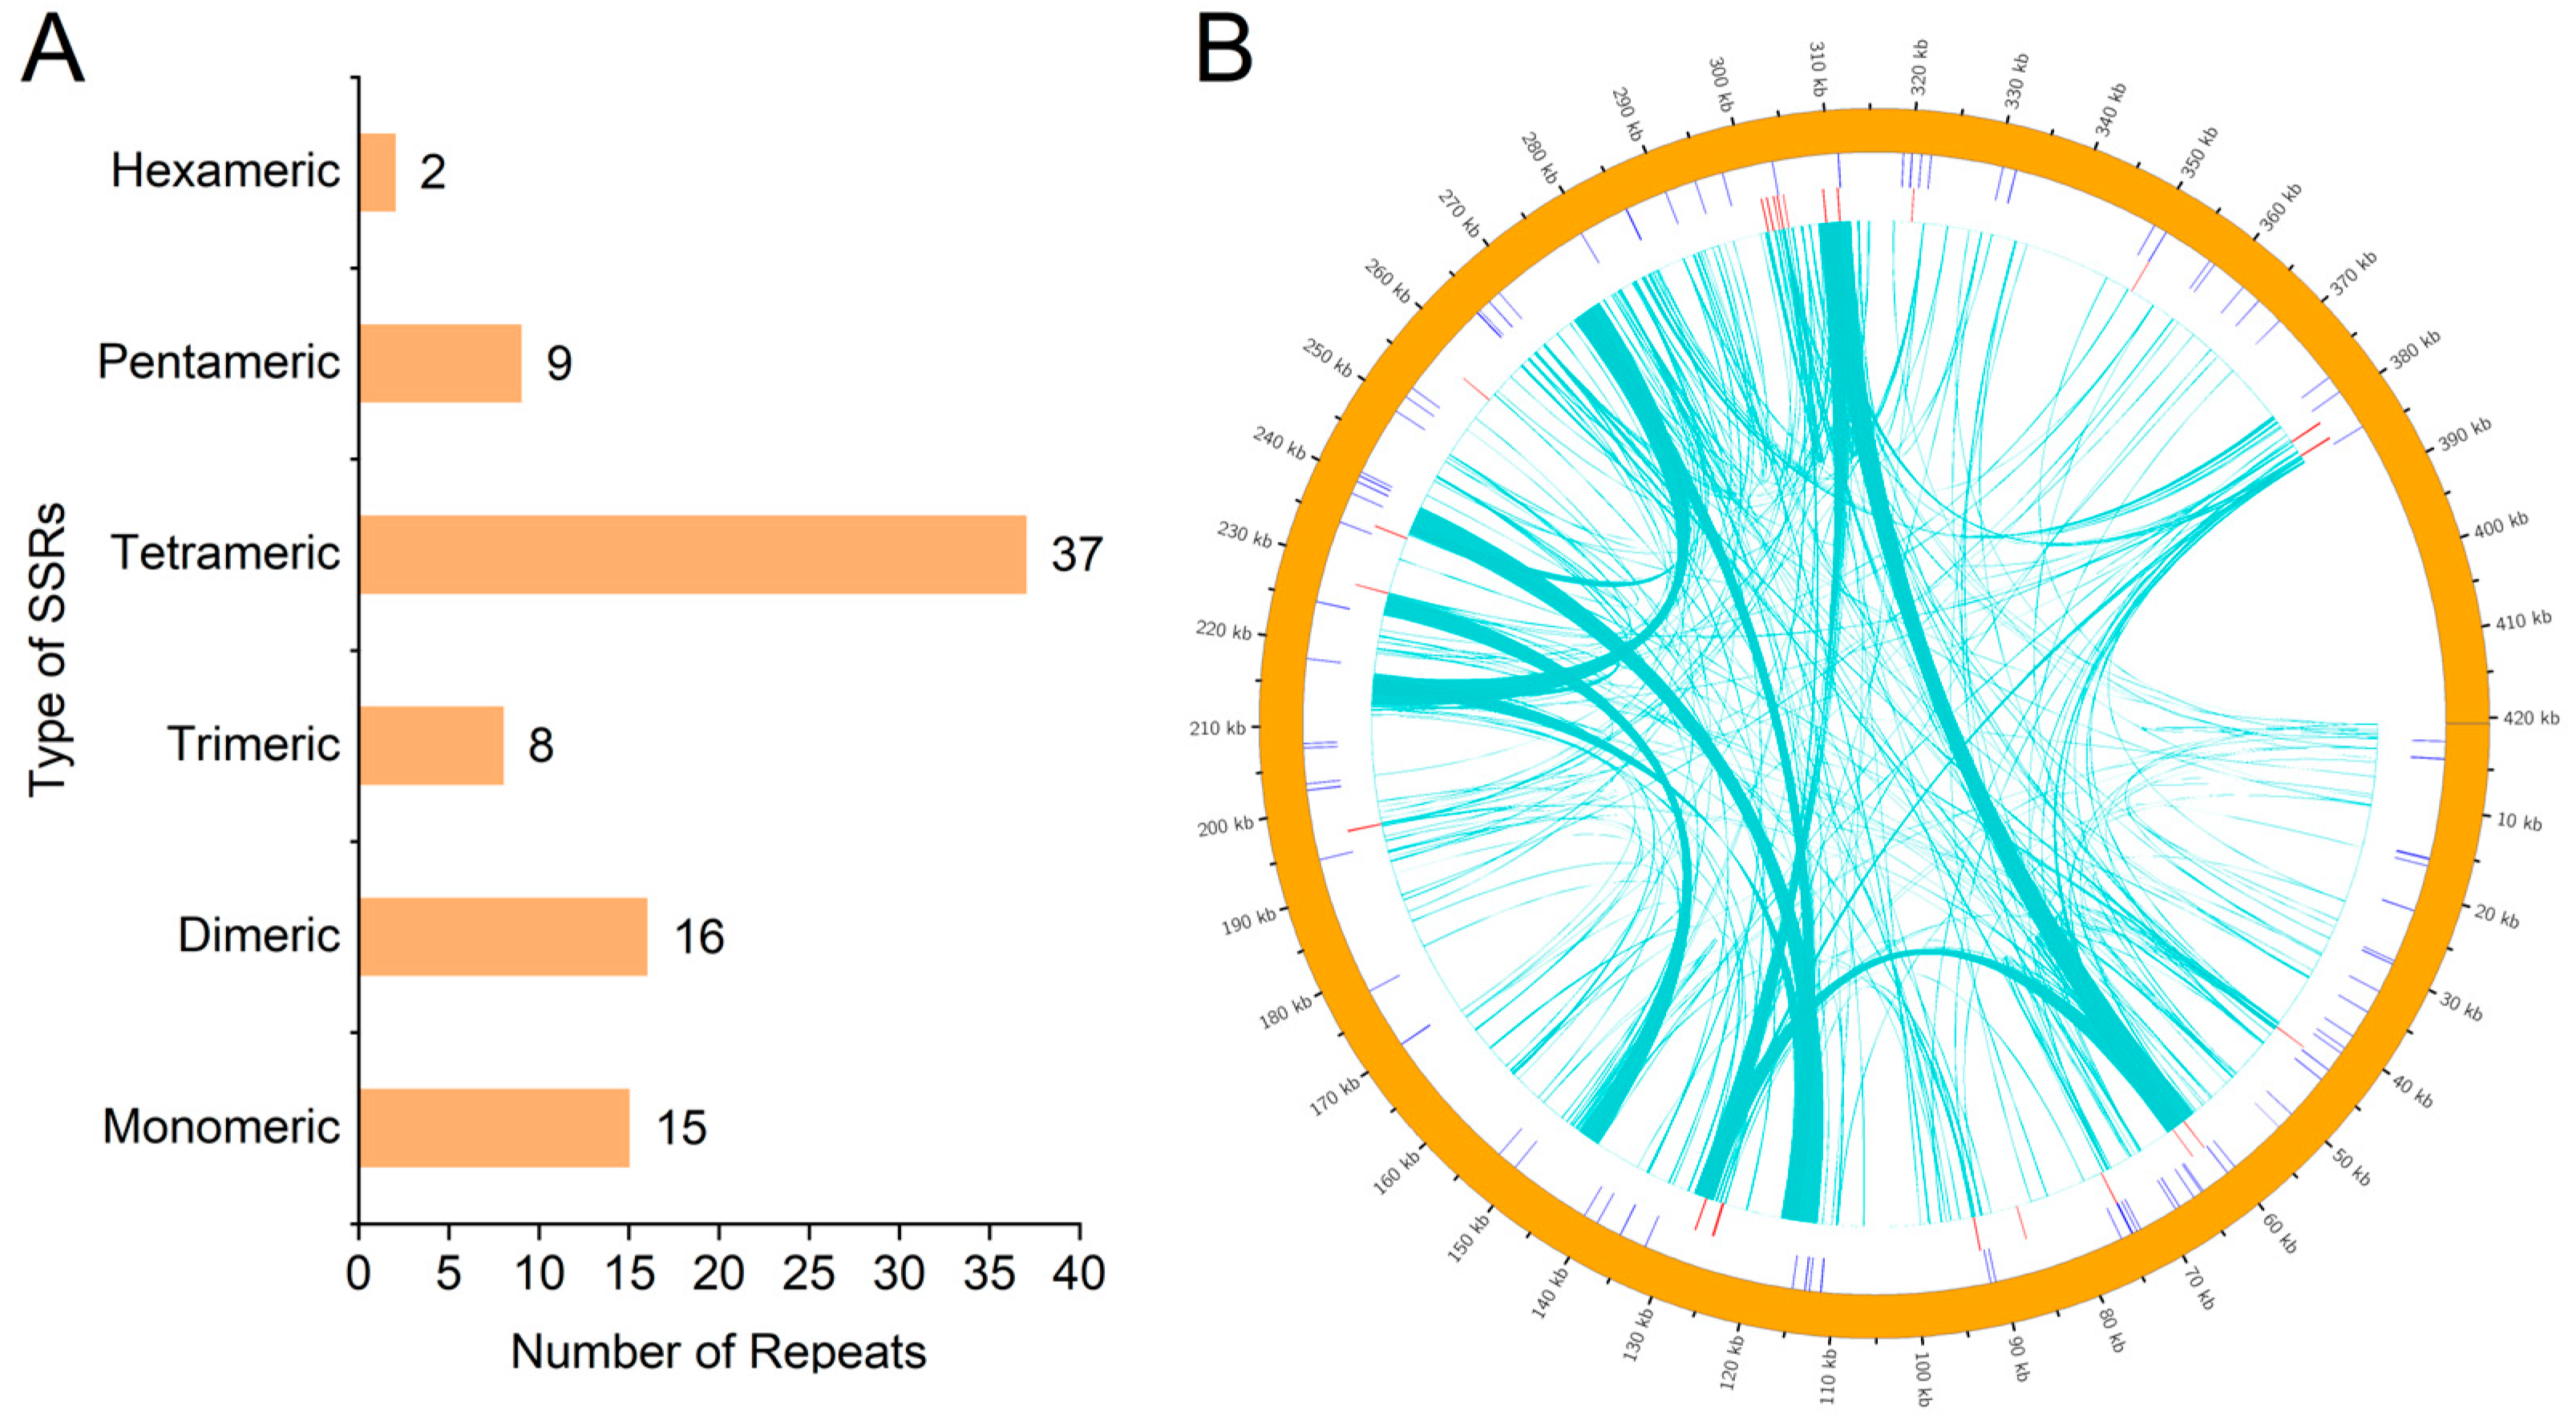
3.2. Repeat Sequence Analysis

Microsatellites, also known as simple sequence repeats (SSRs), consist of single, double, triple, quadruple, or quintuple repeated DNA motifs [33]. They exhibit dominant inheritance and are important for genetic and evolutionary studies of plant mitochondrial genomes [34]. A total of 87 SSRs were identified in the mitochondrial genome of watercress. Mononucleotide and dinucleotide SSRs accounted for 35.63% of the SSRs, with adenine (A) mononucleotide repeats accounting for 60.00% of the mononucleotide SSRs. AG and CT repeats were the most common types of dinucleotide SSRs, accounting for 62.50% of the dinucleotide SSRs. Hexanucleotide SSRs are widespread in eukaryotic and prokaryotic genomes, but only two were identified in the mitochondrial genome of watercress, representing the lowest proportion (Figure 2A). In addition, the basic composition of SSR motifs in the watercress mitochondrial genome showed a strong bias towards AT-rich sequences. Research has shown that plant mitochondrial genomes may undergo recombination at the locations of scattered repetitive sequences, especially longer ones [18]. The distribution of scattered repetitive sequences in the mitochondrial genome was analyzed and a distribution map was generated (Figure 2B and Tables S3 and S4). A total of 585 pairs of repetitive sequences with a length ≥ 30 were observed, including 278 pairs of palindromic repeats, 301 pairs of forward repeats, and 6 pairs of reverse repeats. No complementary repeats were found. The longest palindromic repeat and forward repeat were 4018 and 4801 bp, respectively.

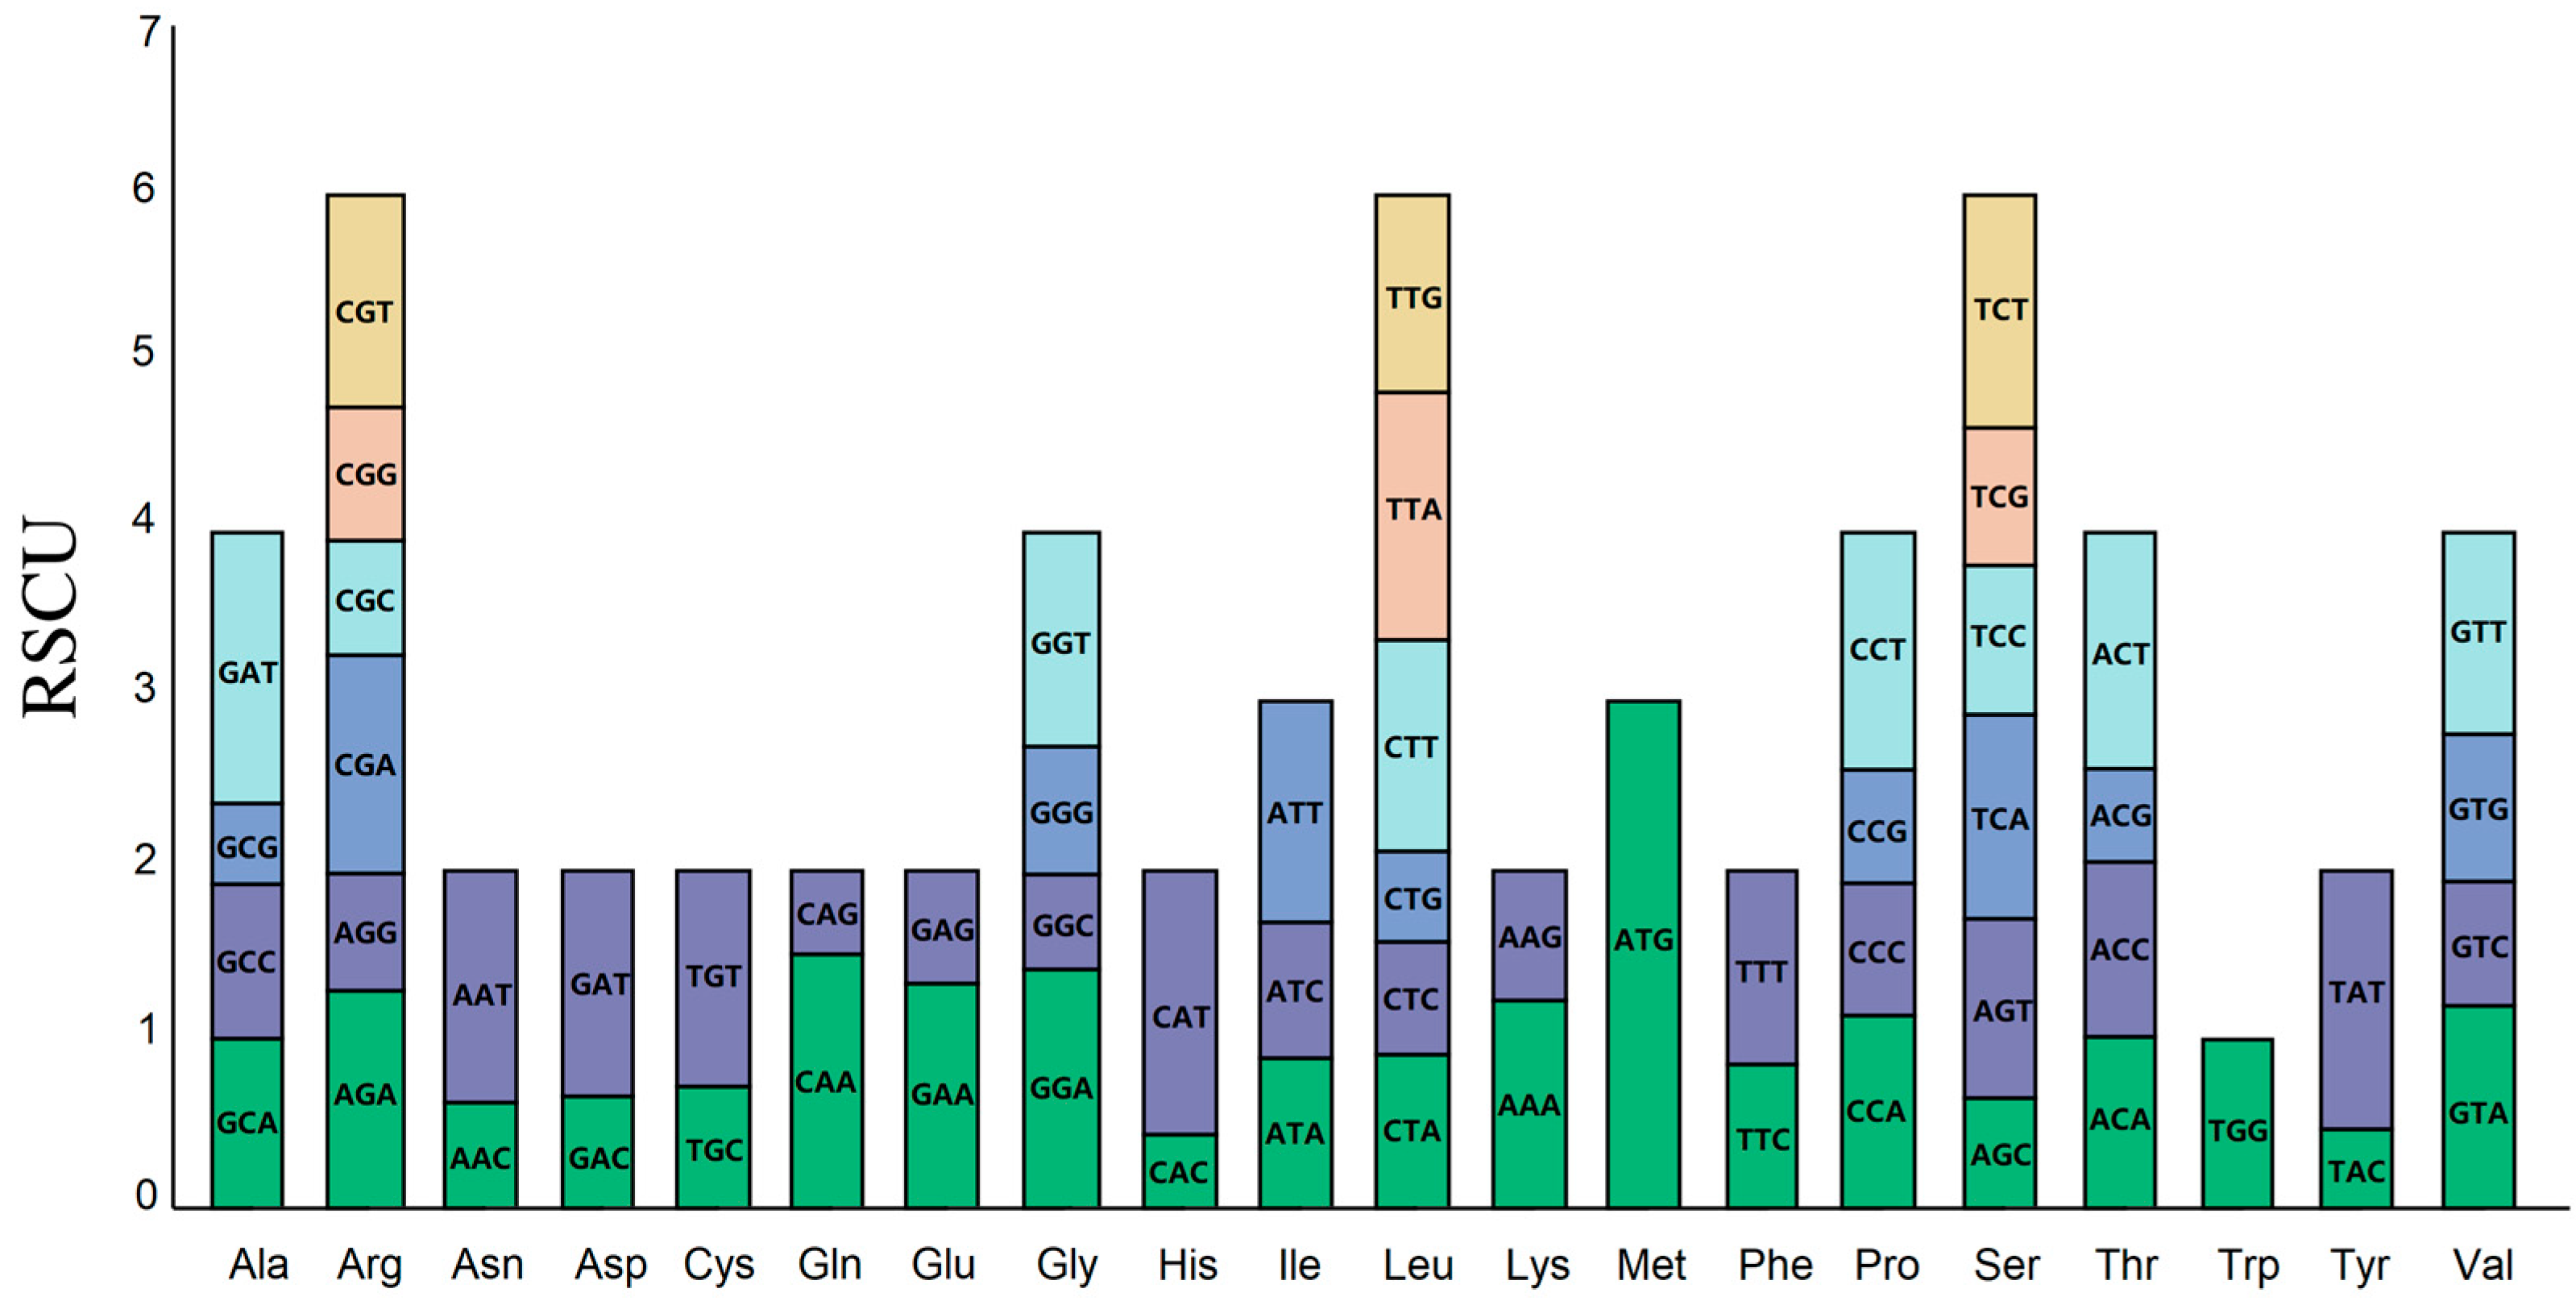
3.3. Analysis of Codon Usage Bias

Research has shown that there are differences in the usage of codons in the mitochondrial genomes of different species. This preference provides a basis for studying species evolution [35]. Codon usage bias analysis was performed on the watercress mitochondrial genome, and codon usage for each amino acid is shown in Table S5. A total of 9900 codons were detected, with leucine, isoleucine, and serine having the highest frequency of use with 1022, 918, and 764 occurrences, respectively. Cysteine and tryptophan had the lowest number of codons used with 133 and 145 occurrences, respectively. These results are consistent with observations in other plant mitochondrial genomes [36,37], indicating that the watercress mitochondrial genome is relatively conserved. Generally, codons with a relative synonymous codon usage (RSCU) value greater than 1 are considered to be preferred by amino acids. As shown in Figure 3, most mitochondrial protein-coding genes (PCGs) show a general preference for certain codons. For example, histidine (His) has a high preference for the AUG codon, with the highest RSCU value of 3.00 among mitochondrial PCGs, followed by alanine (Ala) with a preference for the GCU codon and an RSCU value of 1.60. It is worth noting that phenylalanine (Phe), valine (Val), and tryptophan (Trp) have maximum RSCU values less than 1.2, indicating a weak codon usage bias. There are 6485 codons with RSCU values greater than 1.00, of which 614 codons end with G (UUG, UGG, and AUG), and as many as 5871 codons end in A/U, suggesting a preference for A/U-ending codons in the protein-coding genes of the watercress mitochondrial genome.

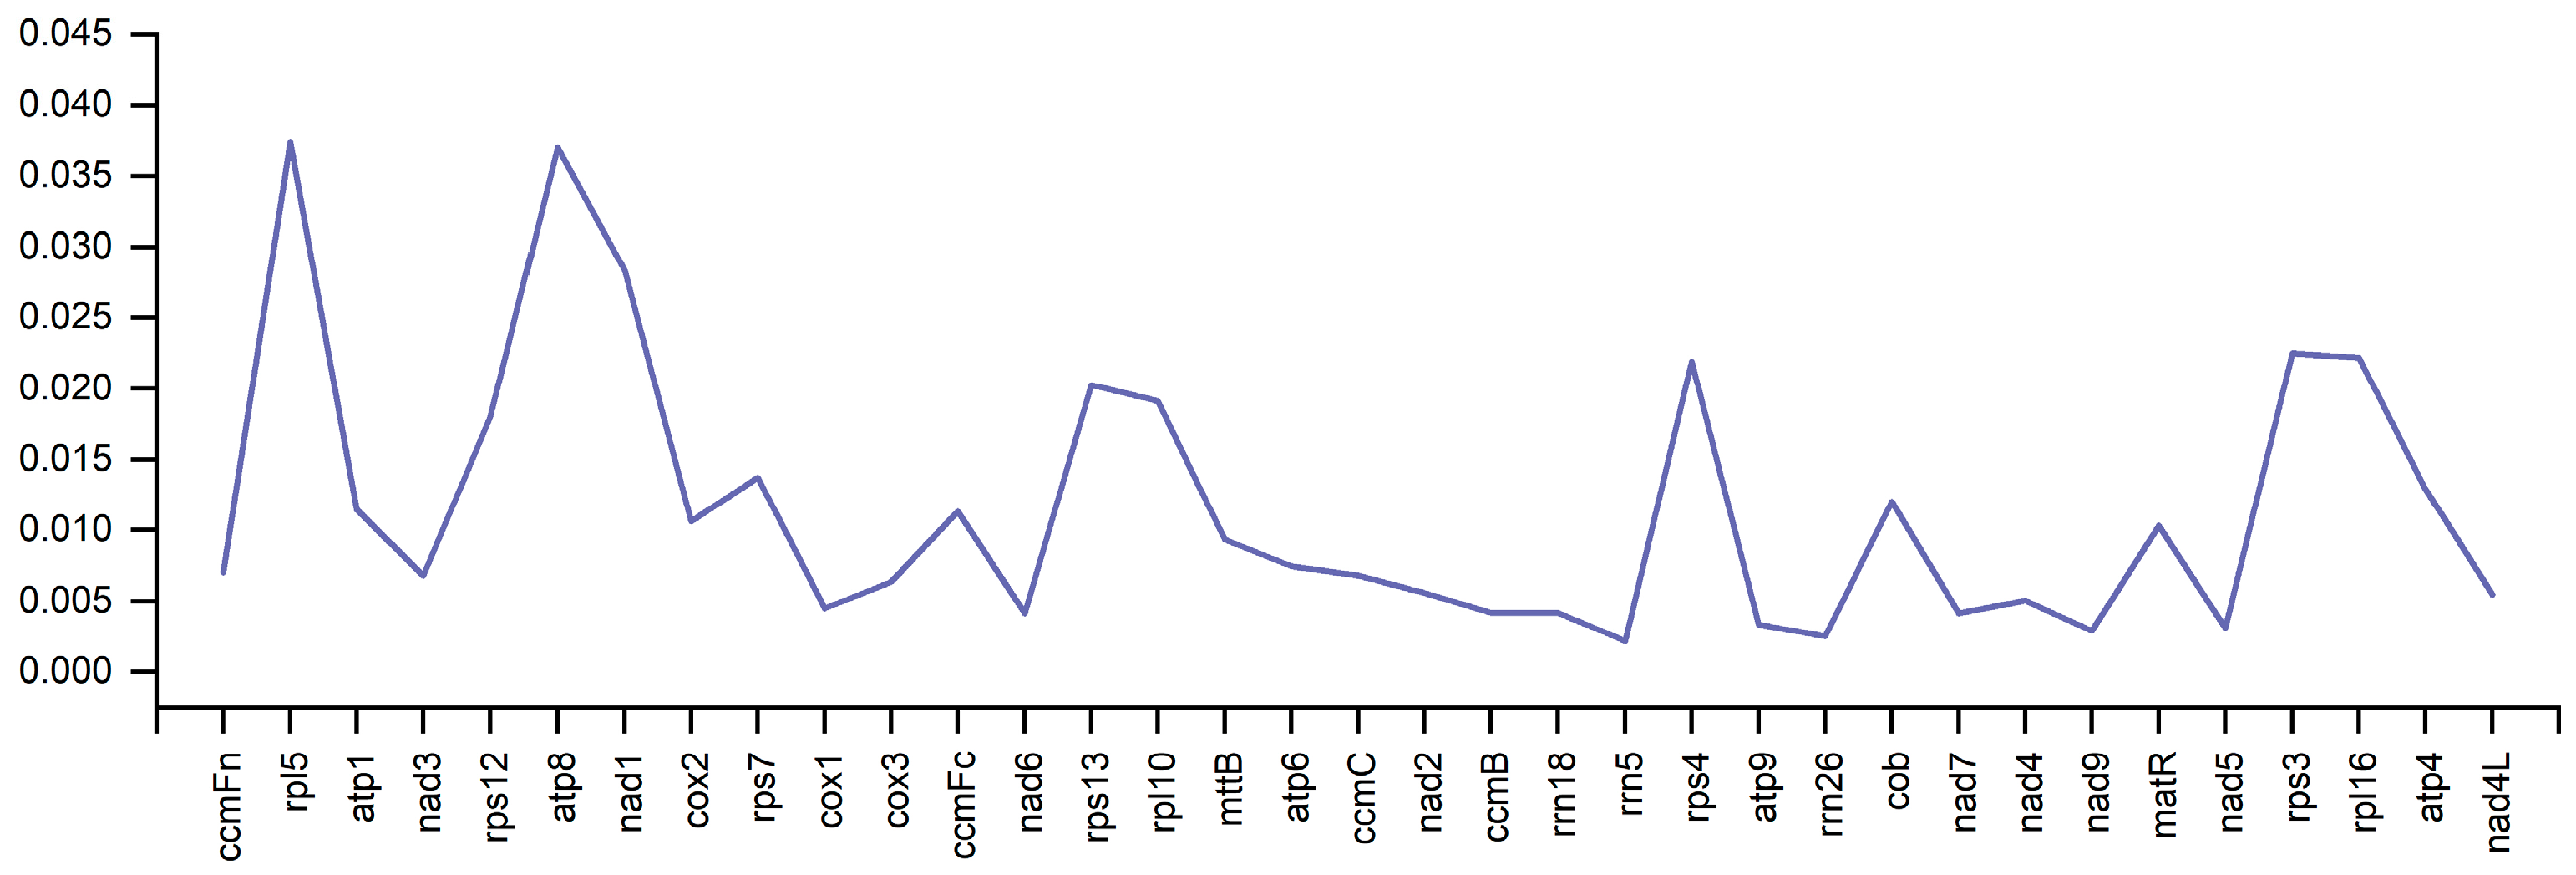
3.4. Analysis of Pi Nucleotide Diversity

Pi values can reveal variation in the nucleic acid sequences of different plants, and regions of higher variability can provide potential molecular markers for population genetics [38]. Pi values were calculated for 35 genes in watercress and ranged from 0.00217 to 0.03741 (Figure 4). It is worth noting that rpl5 had the highest Pi value (0.03714), followed by atp8, nad1, and rps3 with corresponding Pi values of 0.037, 0.02838, and 0.02251, respectively. We speculate that these four hotspots may contain information about evolutionary sites and could potentially serve as molecular markers [32]. Furthermore, in terms of the total number of mutations, rps3 has the highest number of mutations, reaching 97, with a region length of 1896 bp, followed by nad1 and matR with 72 and 71 mutations, respectively (Table S6). These three genes with the highest mutation rates may be the main sources of variation in Apiaceae plants.

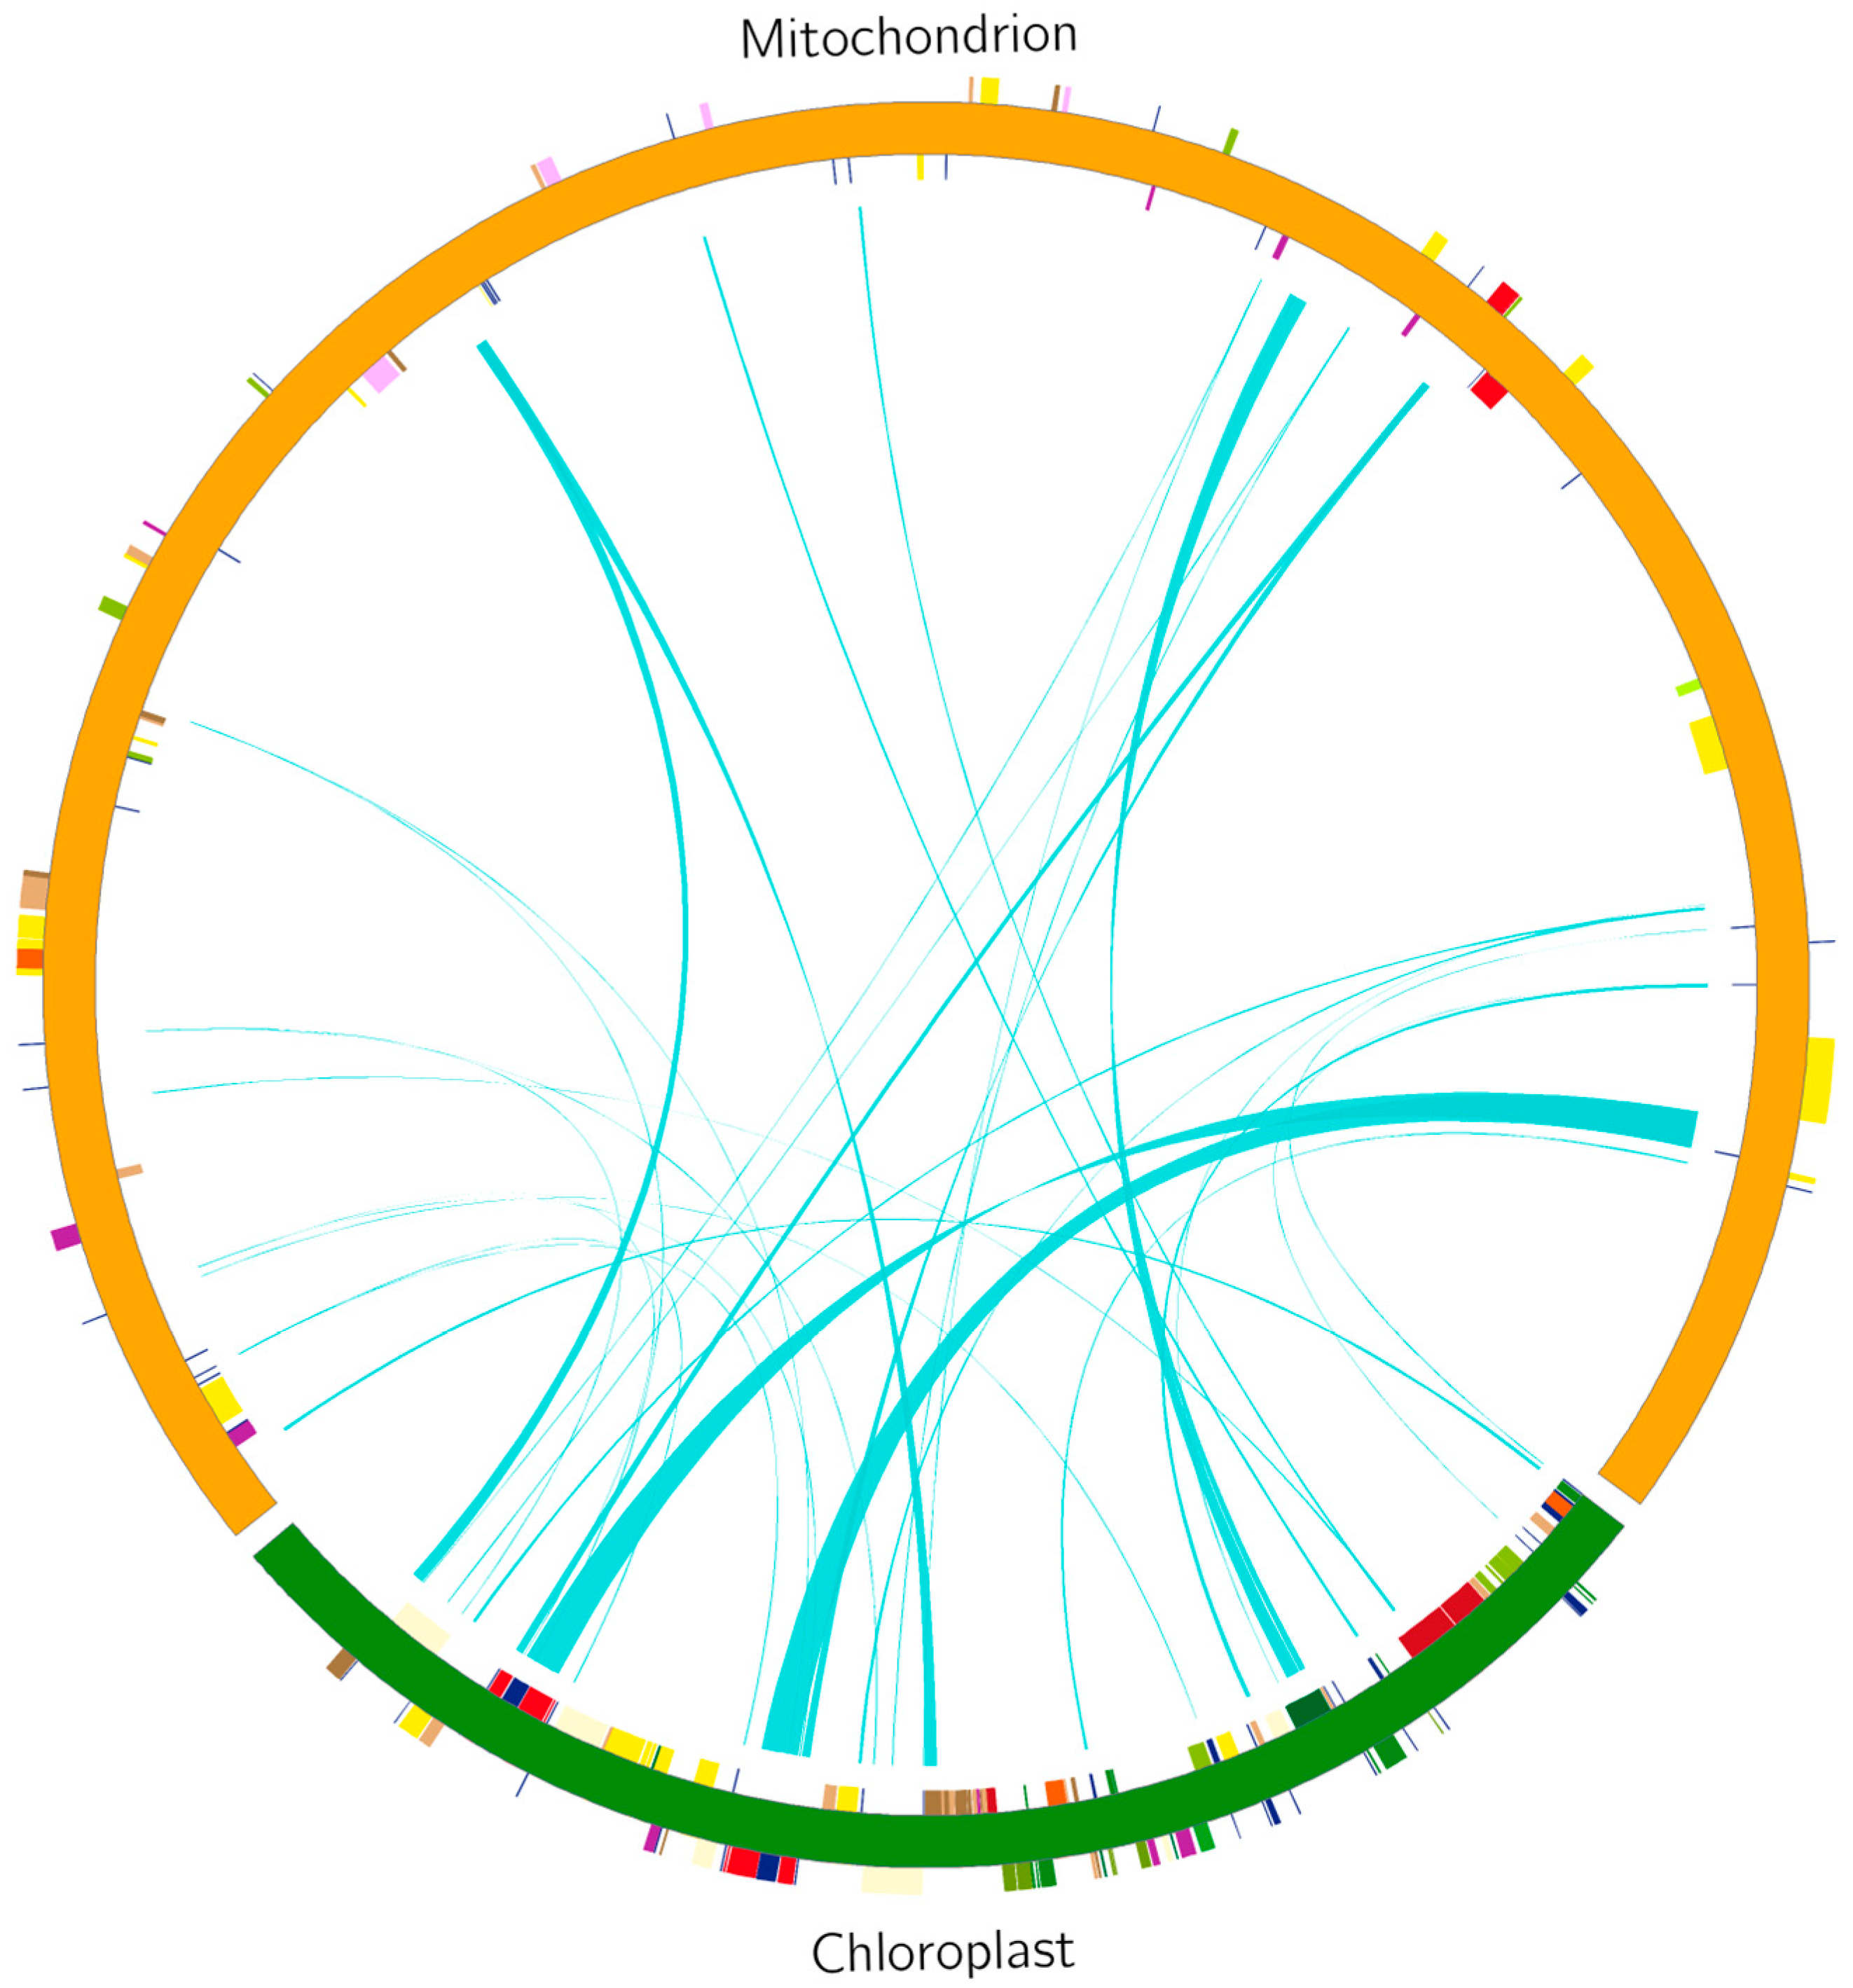
3.5. Analysis of Chloroplast-to-Mitochondria Genomic Transfers in Watercress

We identified 24 fragments of the chloroplast genome that were transferred to the mitochondrial genome of watercress. These fragments included both genes and intergenic regions (Table S7), and their homologous segments are shown in Figure 5. The total length of homologous sequences between the watercress mitochondrial and chloroplast genomes was 18,959 bp, which accounts for approximately 4.94% of the assembled mitochondrial genome. The lengths of these transferred fragments ranged from 30 to 4333 bp. Among the fragments with more than 95% sequence identity, we found 17 fragments, with the smallest being psaA and trnS-GCU with 34 and 30 bp, respectively. Furthermore, by aligning the chloroplast nucleotide sequences with the mitochondrial genome, we discovered sequences with 100% identity in trnS-GGA, trnH-GUG, ycf2, psaA, and trnS-GCU. The longest gene fragment among these was trnS-GGA, which spanned 459 bp.

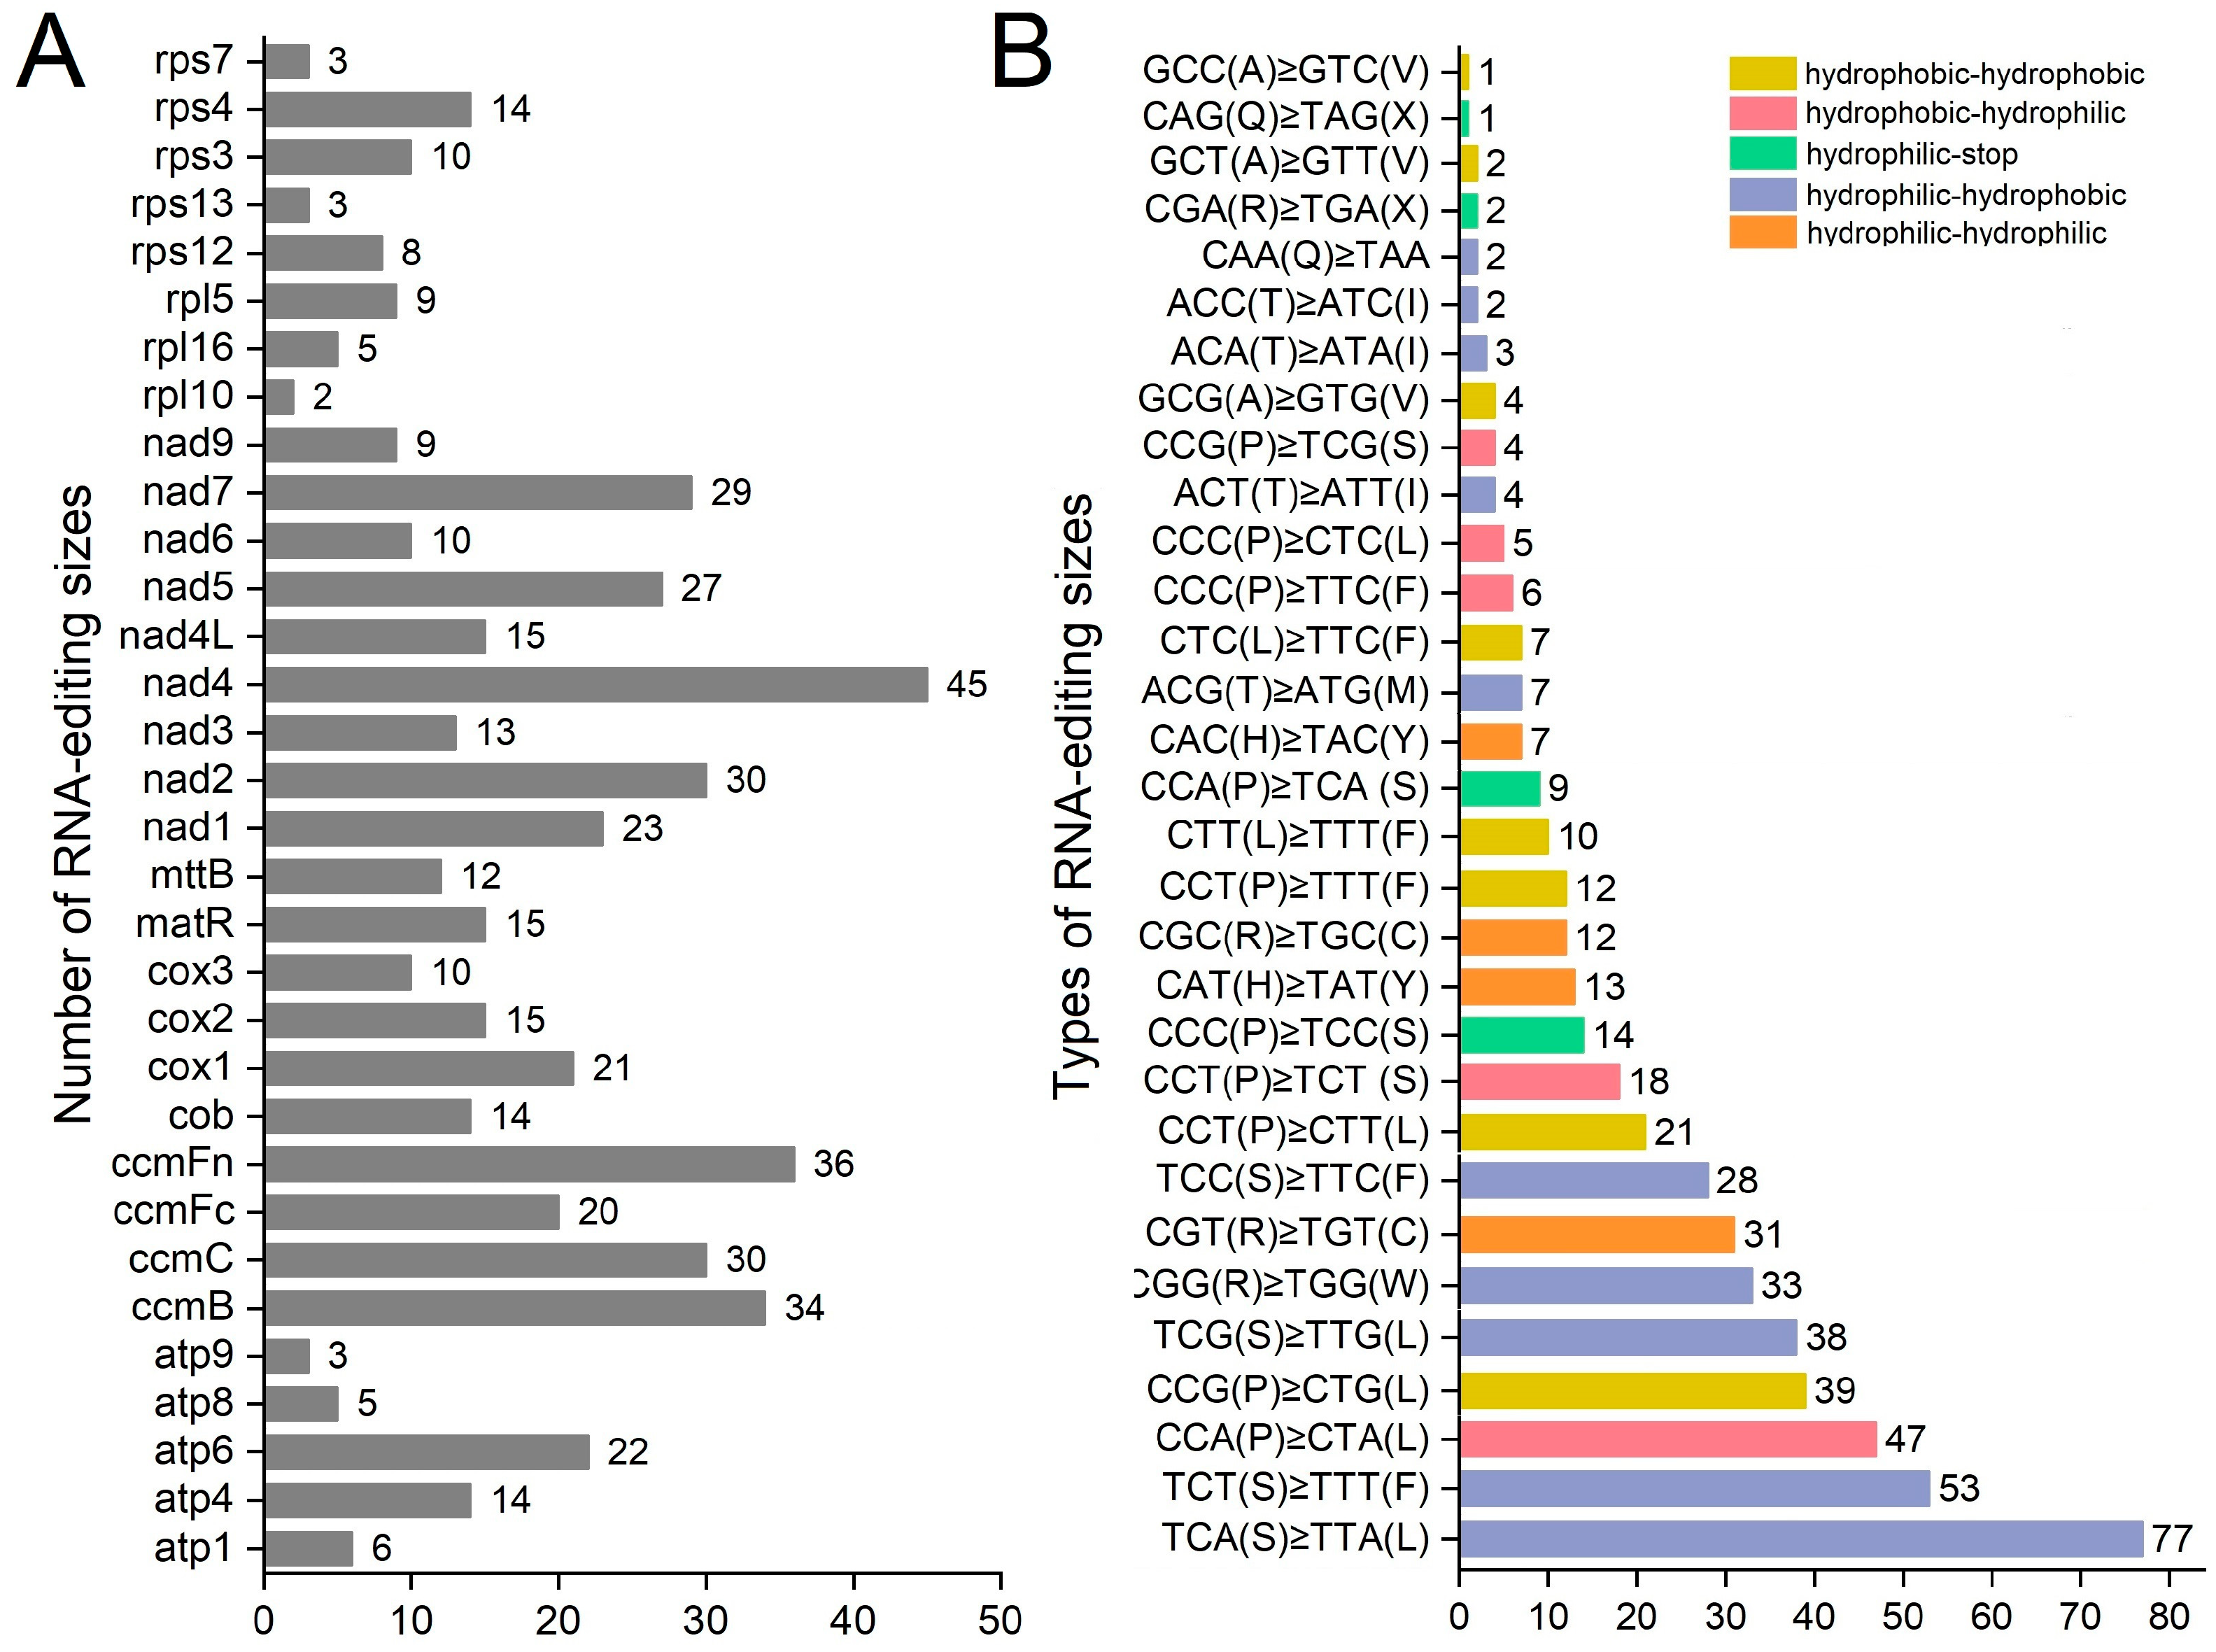
3.6. RNA Editing Site Analysis

We identified RNA editing sites in the protein-coding genes encoded by the watercress mitochondrial genome. The results revealed a total of 512 RNA editing sites in watercress (Figure 6A,B). The genes with the highest number of RNA editing sites were the NADH dehydrogenase genes nad4 and nad2 with 45 and 30 substitution sites, respectively. This was followed by the cytochrome C biogenesis genes ccmFn, ccmB, and ccmC, which had 36, 34, and 30 substitution sites, respectively. In contrast, ribosomal protein genes (rps3, rps4, rps7, rps12, and rps13) and ribosomal large subunit genes (rpl5, rpl10, and rpl16) had relatively few RNA-editing-induced substitutions (2–14 sites). These results indicate that RNA editing substitutions in Oenanthe are mainly distributed in core genes, whereas fewer substitutions are found in noncore genes (Figure 6A). To date, the most common type of RNA editing discovered is C→T, and in watercress, all RNA editing types were C→T, which is consistent with other species. RNA editing leads to changes in the hydrophilic and hydrophobic properties of amino acids. Among the altered properties, hydrophilic to hydrophobic editing accounted for the highest percentage at 47.85%, followed by hydrophobic to hydrophilic at 30.08%. The lowest score corresponding to GCT (A) ≥ GTT (V) in the rpl5 was only 0.22 (Figure 6B and Table S8).

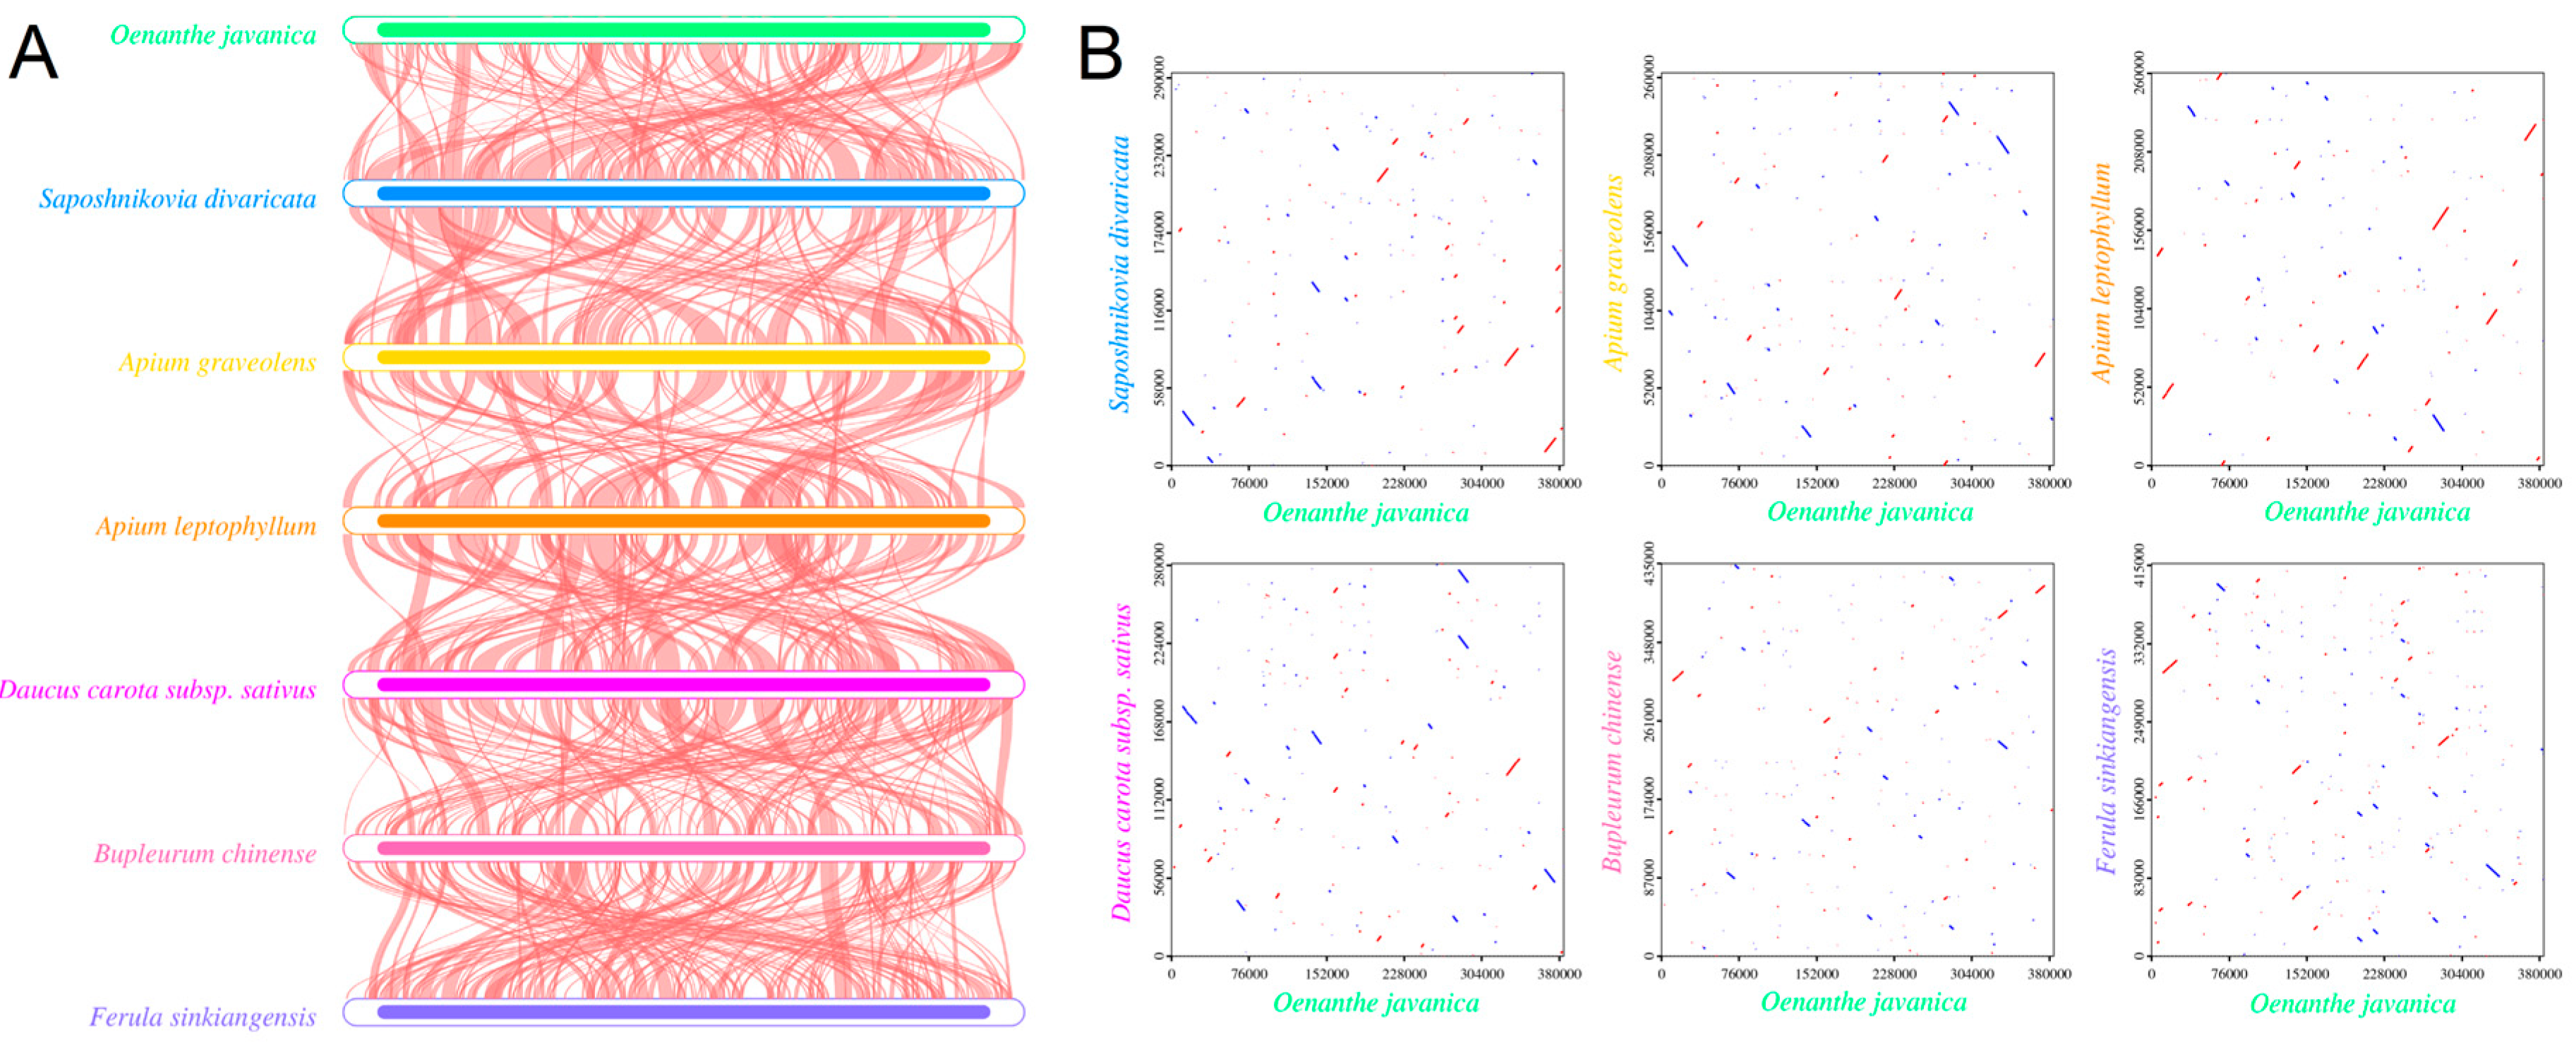
3.7. Comparative Analysis of Mitochondrial Structures

Graphical genome maps have been widely used to assess genome features and sequence characteristics [39]. In this study, we used CGView to compare and analyze the sequence similarity between the mitochondrial genomes of watercress and other closely related species within the watercress genus using the annotated mitochondrial genome sequence of watercress as a reference. The results indicate a high degree of similarity in the rRNA and tRNA coding regions in watercress, with a relatively high GC content in the regions corresponding to rRNA genes (Figure 7). Homologous collinear blocks were detected between watercress and its closely related species (Figure 8A). However, the arrangement order of collinear blocks differed within individual mitochondrial genomes. The absence of longer diagonal segments in Figure 8B suggests structural variations in watercress during the process of evolution compared to other closely related species. In conclusion, the mitochondrial genome of watercress has undergone extensive genomic rearrangements with closely related species, indicating a highly nonconservative structure in the mitochondrial genome.

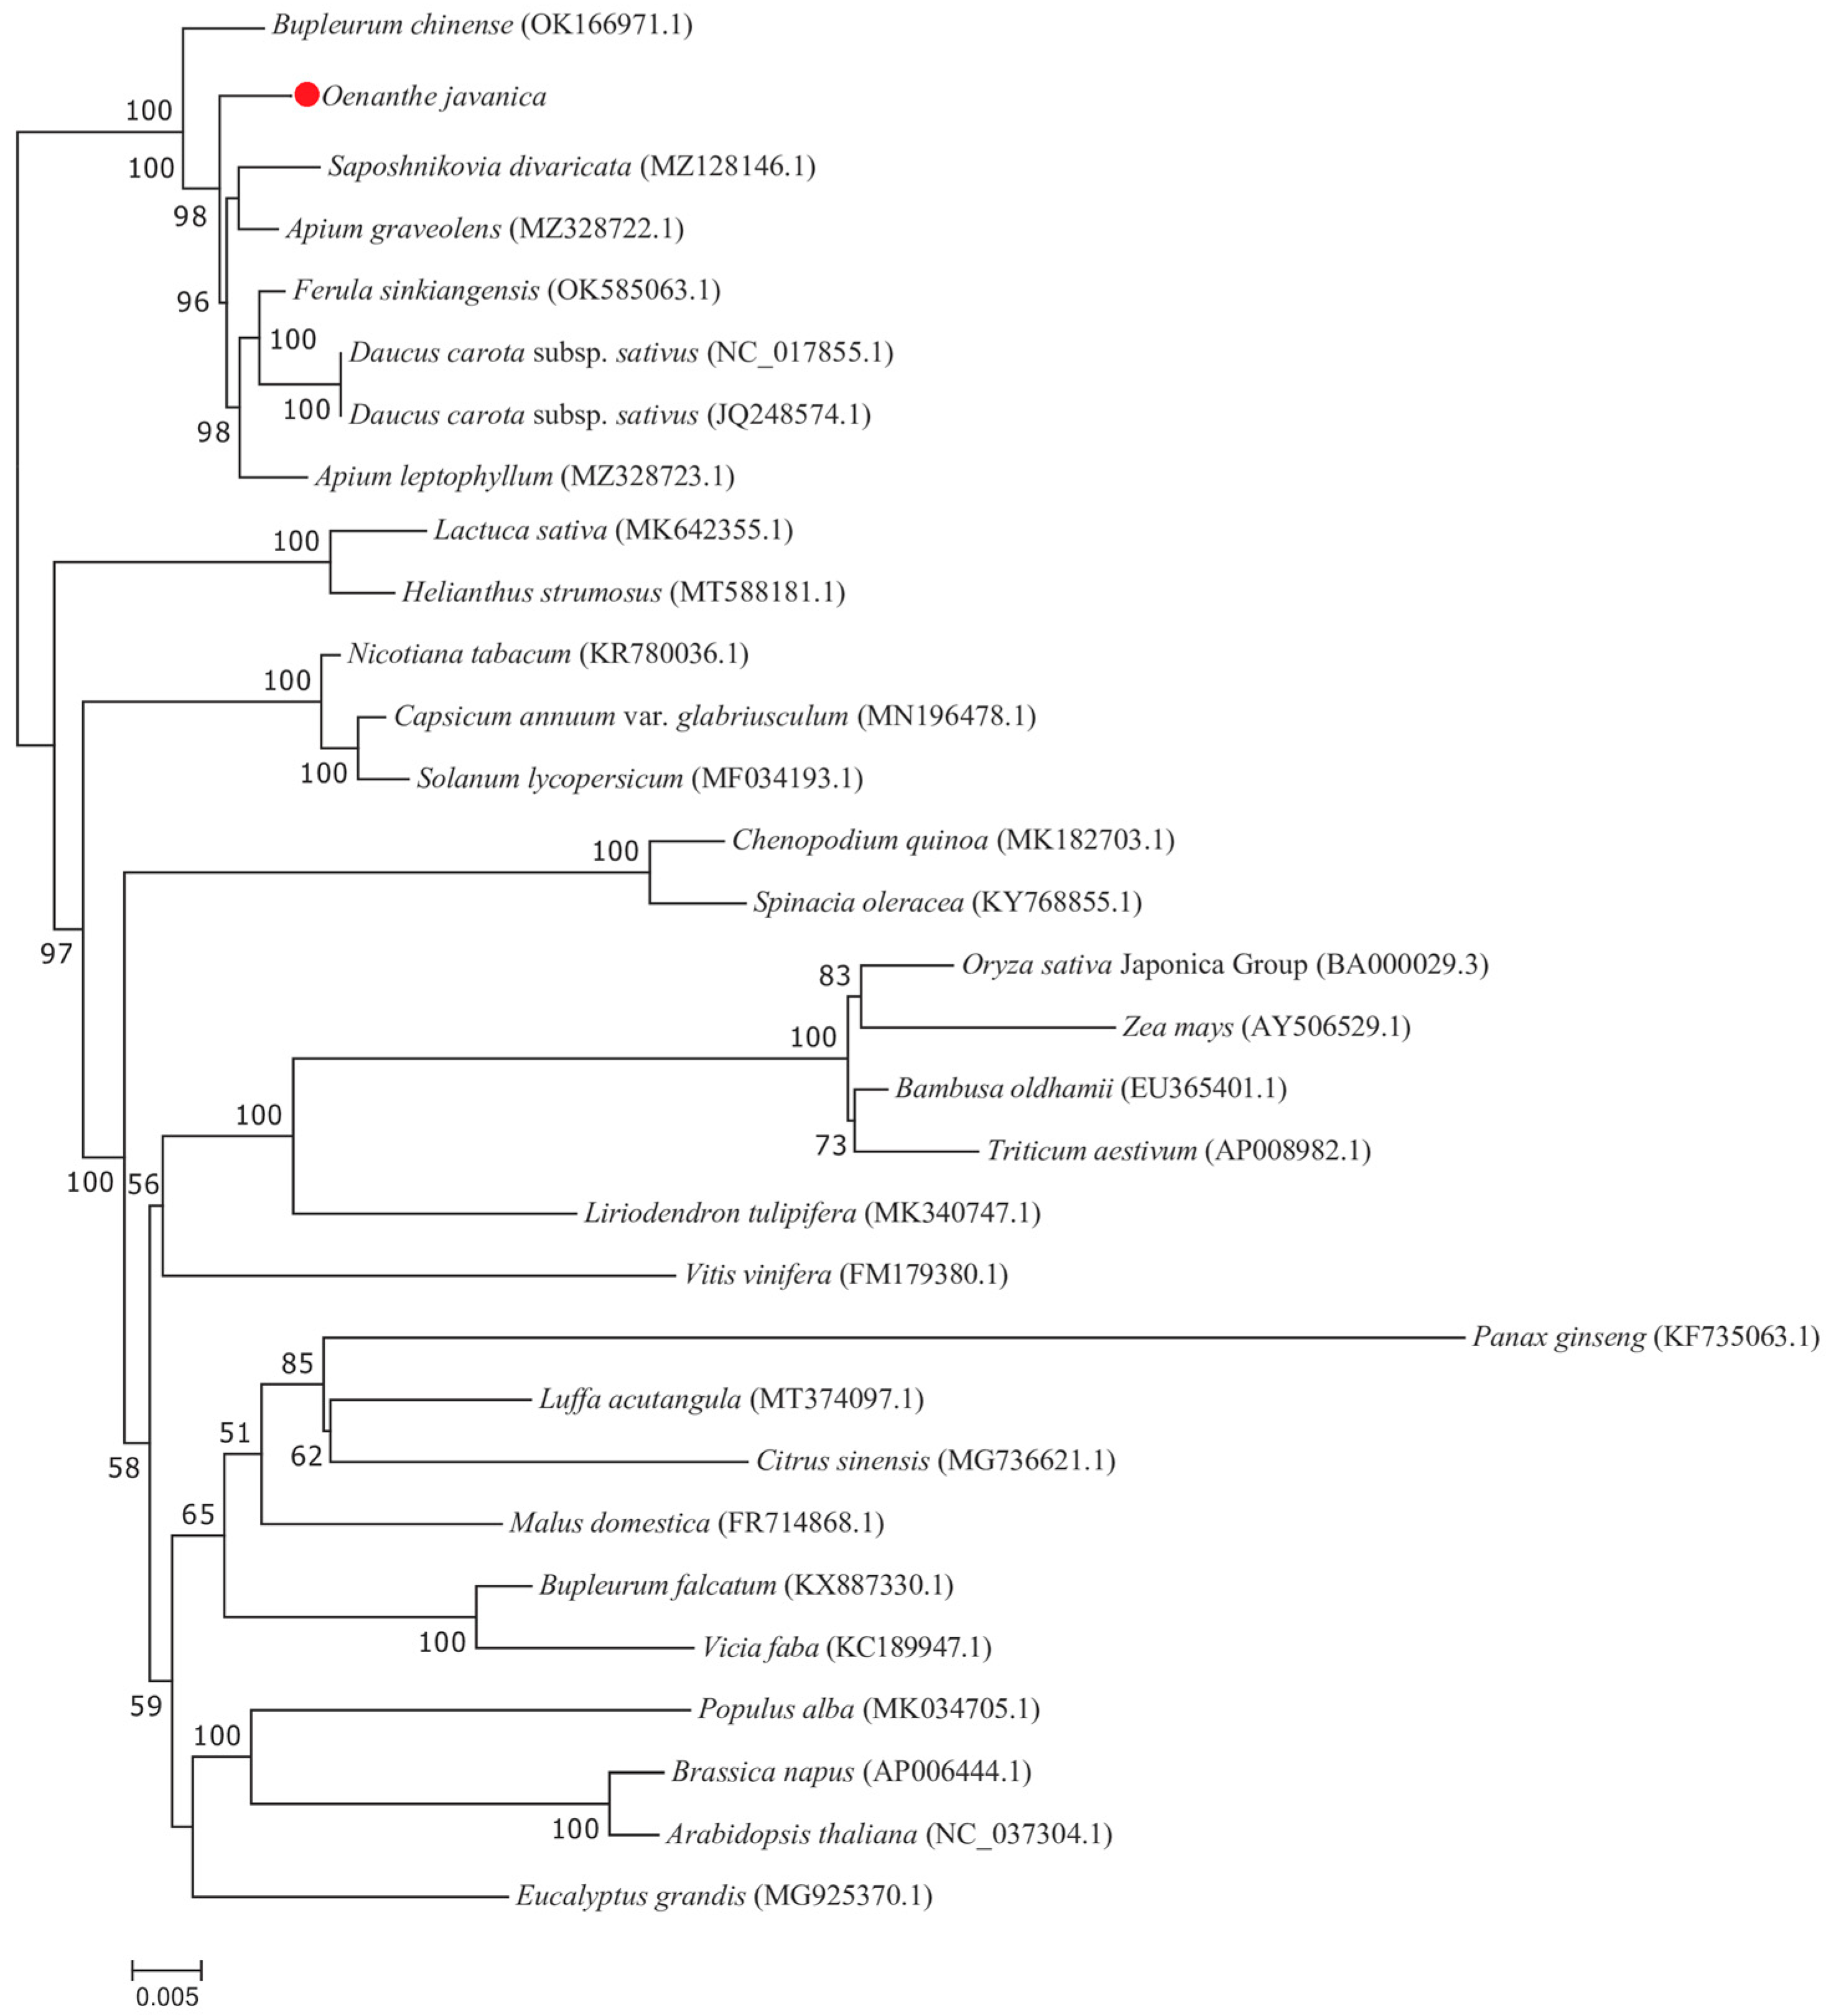
3.8. Phylogenetic Analysis

In this study, a maximum likelihood method was used to construct a phylogenetic tree of 29 plants, including watercress. The results showed that of the 27 nodes in the generated tree, 21 nodes had bootstrap support values greater than 70%, with 14 nodes having 100% support (Figure 9). The phylogenetic tree showed that watercress forms a clade with the genera Ferula, Apium, Angelica, and Daucus. Bupleurum formed another clade, while Nymphaea formed a distinct major clade, with most nodes showing 100% support. The closest evolutionary relationships of watercress were observed with S. divaricata (MZ128146.1) and A. graveolens (MZ328722.1), which is consistent with the collinearity analysis results (Figure 8A). It is worth noting that watercress emerged as a monophyletic lineage independently without sister relationships with other genera. Ferula and Apium appeared as sister groups with 100% support, while Angelica and Daucus formed a sister group with 100% support.

4. Discussion

The emergence of high-throughput sequencing technologies has greatly facilitated the study of plant mitochondrial genomes [17]. In this study, we successfully assembled the high-quality mitochondrial genome of watercress, which could serve as a valuable resource for future investigations into the evolution of watercress mitochondrial genomes. Sequence assembly revealed that the watercress mitochondrial genome is a circular molecule of 384,074 bp with a typical AT bias in base composition. It contains 28 tRNA genes (including 3 with introns), 3 rRNA genes, and 34 protein-coding genes. Among them, the trnM-CAT gene has up to seven copies. Studies have shown that the variation in size among plant mitochondrial genomes is not determined by the number of genes or introns in these coding genes [19]. Instead, most plant mitochondrial genomes contain noncoding sequences of varying sizes [40]. As products of biological evolution, repetitive sequences are often used to reveal the historical imprints of long-term exchange and recombination of genetic material between species [41]. Dispersed repetitive sequences are associated with the generation of genetic diversity and make a significant contribution to genome evolution. In our study, the watercress mitochondrial genome contained a total of 87 SSRs, the majority of which were mononucleotide or dinucleotide repeats, suggesting that the size variation in the watercress mitochondrial genome may be due to repetitive short sequences. Dispersed repetitive sequences typically include forward repeats, reverse repeats, complementary repeats, or palindromic repeats [42]. In the watercress mitochondrial genome, 99% of the repeats were composed of palindromic repeats and forward repeats, with only six pairs of reverse repeats detected and no complementary repeats identified, which is consistent with the findings in other species [43].
Codon usage bias refers to the differential frequency of synonymous codons used in coding sequences by an organism [44]. RCUS, based on the hypothesis that codon usage affects translation dynamics, has been proposed to regulate translation efficiency, accuracy, and protein folding, which provides a basis for the study of species evolution [45]. The highest codon usage frequencies in the watercress mitochondrial genome were observed for leucine, isoleucine, and serine. Screening for codons with RSCU values greater than 1.00 revealed that 90.53% of protein-coding genes in the watercress mitochondrial genome preferentially use A/U-ending codons, while the remaining 9.47% use A/G ending codons (UUG, UGG, and AUG). Nucleotide diversity analysis is commonly used to detect hotspots in the genome, and Pi values reflect the variation of nucleotide sequences in plants [38]. The Pi values of the watercress genes ranged from 0.00217 to 0.03741, with the rpl5 gene having the highest Pi value among the 35 genes. In addition, the rps33, nad1, and matR genes had the highest mutation levels in watercress. We also identified 24 plastid genome fragments in the watercress mitochondrial genome, representing 4.94% of the assembled mitochondrial genome. Chloroplast genome transfer to the mitochondria is associated with potential molecular functions and physiological processes in plants [46]. The genes with the most RNA editing in the watercress mitochondrial genome were NADH dehydrogenase genes and cytochrome c biogenesis genes. So far, the majority of RNA editing types discovered in plant species are C→T, and all RNA editing types in watercress were also C→T, showing a high degree of consistency with other species.
In recent years, with the increasing abundance of genomic and related genomic information, the convenience and novelty of graphical genome maps have been widely applied in the assessment of genomic features [39]. We utilized CGView to analyze the collinearity among mitochondrial genomes of closely related species in the Apiaceae family to investigate DNA rearrangement events within the mitochondrial genome. The mitochondrial genome sequences of seven species in the watercress genus exhibited certain collinearity but with significant structural variations, indicating a highly nonconservative structure in the watercress mitochondrial genome. Using the annotated mitochondrial genome sequence of watercress as a reference, we compared it with the assembled sequences of the other six species and no significant structural variations were found. In previous studies, the methods used to construct phylogenetic trees were based on one or more relatively short sequences [47]. However, due to horizontal gene transfer between populations and differences in rates of genetic evolution, phylogenetic trees based on single or few genes cannot fully represent the phylogenetic relationships. As DNA sequencing techniques mature, whole genome sequencing is increasingly being used in plant phylogenetics and population genetics [48,49]. In this study, the phylogenetic relationship of watercress was further analyzed based on mitochondrial genome information, and a sequence-based phylogenetic tree was constructed using protein-coding genes. The results indicate a close relationship between watercress, S. divaricata, and A. graveolens. Therefore, under the assumption of mitochondrial genome evolution and diversification mechanisms, the watercress mitochondrial genome may provide a potential for studying the evolution and development of the watercress genus and provide an important theoretical basis for improving watercress production, developing varietal resources, and maintaining stable morphology.

5. Conclusions

The watercress mitochondrial genome is a circular molecule of 384,074 bp. The nucleotide composition has a typical AT bias and contains 28 tRNA genes, 3 rRNA genes, and 34 protein-coding genes. A total of 87 SSR sites were detected, with 99% consisting of palindromic and forward repeats, only 6 pairs of reverse repeats, and no complementary repeats detected. Codon preference analysis revealed that watercress shares have the same codon preferences as most plant species, preferring to use codons encoding leucine, isoleucine, and serine and showing a preference for A/U-ending codons. In addition, the phylogenetic tree based on the mitochondrial genomes of 29 species helps in the scientific classification of watercress. In conclusion, this study provides information on the genetic characteristics, phylogenetic relationships, and evolution of watercress and provides a basis for species identification and biological studies of watercress and other species of Apiaceae.

Supplementary Materials

The following supporting information can be downloaded at: https://www.mdpi.com/article/10.3390/agronomy13082103/s1, Table S1: Sequencing statistics of watercress mitochondrial genome; Table S2: Specific information on the mitogenome composition of watercress; Table S3: Tandem repeat sequence information in the mitogenome of watercress; Table S4: Information on the distribution of repetitive sequences on the mitogenome of watercress; Table S5: The use of amino acid pairs of codons in the mitogenome of watercress; Table S6: Analysis of Pi nucleic acid diversity in watercress; Table S7: Chloroplast nucleic acid sequences compared to mitogenome information. Table S8: Statistical table of amino acid hydrophilicity changes caused by RNA editing.

Author Contributions

Conceptualization, Q.H. and G.T.; data processing, X.L.; formal analysis, X.L. and Q.H.; investigation, Q.L.; software, S.Z.; writing—original draft preparation, X.L. and Q.H.; writing—review and editing, M.L., Y.Z. and G.T.; funding acquisition, Y.Z. and G.T. All authors have read and agreed to the published version of the manuscript.

Funding

This research was funded by the Project of Guizhou Provincial Department of Science and Technology “Construction and Utilization of Horticultural Platform of Plant GenBank Creation” (No. Qiankehe Fuqi [2022] 005, No. Qiankehe Support [2022] Key 019); Guizhou Modern Agriculuture Research System (GZMARS)—Plateau Characteristic Vegetable Industry; Shaanxi Provincial Department of Science and Technology: 2022ZY1-CGZY-07; and the Project of Research and Demonstration of Key Technologies for Quality Improvement and Efficiency Enhancement of Vegetables in Bazhong City.

Institutional Review Board Statement

No application.

Informed Consent Statement

No application.

Data Availability Statement

The mitochondrial genome sequence of Oenanthe javanica that were generated are deposited at NCBI under the accession number OR209169.

Conflicts of Interest

The authors declare no conflict of interest.

References

  1. Grosser, M.R.; Sites, S.K.; Murata, M.M.; Lopez, Y.; Chamusco, K.C.; Love Harriage, K.; Grosser, J.W.; Graham, J.H.; Gmitter, F.; Chase, C.D. Plant mitochondrial introns as genetic markers-conservation and variation. Front. Plant Sci. 2023, 14, 1116851. [Google Scholar]
  2. Jang, W.; Lee, H.O.; Kim, J.-U.; Lee, J.-W.; Hong, C.-E.; Bang, K.-H.; Chung, J.-W.; Jo, I.-H. Complete mitochondrial genome and a set of 10 novel kompetitive allele-specific PCR markers in ginseng (Panax ginseng C. A. Mey.) . Agronomy 2020, 10, 1868. [Google Scholar]
  3. Xiong, Y.; Yu, Q.; Xiong, Y.; Zhao, J.; Lei, X.; Liu, L.; Liu, W.; Peng, Y.; Zhang, J.; Li, D.; et al. The complete mitogenome of Elymus sibiricus and insights into its evolutionary pattern based on simple repeat sequences of seed plant mitogenomes. Front. Plant Sci. 2022, 12, 802321. [Google Scholar]
  4. Maréchal, A.; Brisson, N. Recombination and the maintenance of plant organelle genome stability. New Phytol. 2010, 186, 299–317. [Google Scholar]
  5. Adams, K.L.; Palmer, J.D. Evolution of mitochondrial gene content: Gene loss and transfer to the nucleus. Mol. Phylogenet. Evol. 2003, 29, 380–395. [Google Scholar]
  6. Beier, S.; Thiel, T.; Münch, T.; Scholz, U.; Mascher, M. MISA-web: A web server for microsatellite prediction. Bioinformatics 2017, 33, 2583–2585. [Google Scholar]
  7. Alverson, A.J.; Rice, D.W.; Dickinson, S.; Barry, K.; Palmer, J.D. Origins and recombination of the bacterial-sized multichromosomal mitochondrial genome of cucumber. Plant Cell 2011, 23, 2499–2513. [Google Scholar]
  8. Palmer, J.D.; Adams, K.L.; Cho, Y.; Parkinson, C.L.; Qiu, Y.L.; Song, K. Dynamic evolution of plant mitochondrial genomes: Mobile genes and introns and highly variable mutation rates. Proc. Natl. Acad. Sci. USA 2000, 97, 6960–6966. [Google Scholar]
  9. Cheng, N.; Lo, Y.S.; Ansari, M.I.; Ho, K.C.; Jeng, S.T.; Lin, N.S.; Dai, H. Correlation between mtDNA complexity and mtDNA replication mode in developing cotyledon mitochondria during mung bean seed germination. New Phytol. 2017, 213, 751–763. [Google Scholar]
  10. Varré, J.-S.; D’Agostino, N.; Touzet, P.; Gallina, S.; Tamburino, R.; Cantarella, C.; Ubrig, E.; Cardi, T.; Drouard, L.; Gualberto, J.M.; et al. Complete Sequence, Multichromosomal Architecture and Transcriptome Analysis of the Solanum tuberosum Mitochondrial Genome. Int. J. Mol. Sci. 2019, 20, 4788. [Google Scholar] [CrossRef] [Green Version]
  11. Bi, C.; Paterson, A.H.; Wang, X.; Xu, Y.; Wu, D.; Qu, Y.; Jiang, A.; Ye, Q.; Ye, N. Analysis of the complete mitochondrial genome sequence of the diploid cotton Gossypium raimondii by comparative genomics approaches. BioMed. Res. Int. 2016, 2016, 5040598. [Google Scholar]
  12. Mustafa, S.I.; Heslop-Harrison, J.S.; Schwarzacher, T. The complete mitochondrial genome from Iraqi Meriz goats and the maternal lineage using whole genome sequencing data. Iran. J. Appl. Anim. Sci. 2021, 12, 321–328. [Google Scholar]
  13. Kozik, A.; Rowan, B.A.; Lavelle, D.; Berke, L.; Schranz, M.E.; Michelmore, R.W.; Christensen, A.C. The alternative reality of plant mitochondrial DNA: One ring does not rule them all. PLoS Genet. 2019, 15, e1008373. [Google Scholar]
  14. Alverson, A.J.; Wei, X.; Rice, D.W.; Stern, D.B.; Barry, K.; Palmer, J.D. Insights into the evolution of mitochondrial genome size from complete sequences of Citrullus lanatus and Cucurbita pepo (Cucurbitaceae). Mol. Biol. Evol. 2017, 27, 1436–1448. [Google Scholar]
  15. Zhong, F.; Ke, W.; Li, Y.; Chen, X.; Zhou, T.; Xu, B.; Qi, L.; Yan, Z.; Ma, Y. Comprehensive analysis of the complete mitochondrial genomes of three Coptis species (C. chinensis, C. deltoidea and C. omeiensis): The important medicinal plants in China. Front. Plant Sci. 2023, 29, 1166420. [Google Scholar]
  16. Wang, B.; Xue, J.; Li, L.; Liu, Y.; Qiu, Y.L. The complete mitochondrial genome sequence of the liverwort Pleurozia purpurea reveals extremely conservative mitochondrial genome evolution in liverworts. Curr. Genet. 2009, 55, 601–609. [Google Scholar]
  17. Dong, S.; Zhao, C.; Chen, F.; Liu, Y.; Zhang, S.; Wu, H.; Zhang, L.; Liu, Y. The complete mitochondrial genome of the early flowering plant Nymphaea colorata is highly repetitive with low recombination. BMC Genom. 2018, 19, 614. [Google Scholar]
  18. Yu, R.; Chen, X.; Long, L.; Jost, M.; Zhao, R.; Liu, L.; Mower, J.P.; de Pamphilis, C.W.; Wanke, S.; Jiao, Y. De novo assembly and comparative analyses of mitochondrial genomes in Piperales. Genom. Biol. Evol. 2023, 15, evad041. [Google Scholar]
  19. Ren, W.; Wang, L.; Feng, G.; Tao, C.; Liu, Y.; Yang, J. High-quality assembly and comparative analysis of Actinidia latifolia and A. valvata mitogenomes. Genes 2023, 14, 863. [Google Scholar]
  20. Cheng, Q.; Wang, P.; Li, T.; Liu, J.; Zhang, Y.; Wang, Y.; Sun, L.; Shen, H. Complete mitochondrial genome sequence and identification of a candidate gene responsible for cytoplasmic male sterility in celery (Apium graveolens L.). Int. J. Mol. Sci. 2021, 22, 8584. [Google Scholar]
  21. Chen, C.M.; Chen, I.C.; Chen, Y.L.; Lin, T.H.; Chen, W.L.; Chao, C.Y.; Wu, Y.R.; Lu, Y.T.; Lee, C.Y.; Chien, H.C.; et al. Medicinal herbs Oenanthe javanica (Blume) DC., Casuarina equisetifolia L. and Sorghum bicolor (L.) Moench protect human cells from MPP+ damage via inducing FBXO7 expression. Phytomedicine 2016, 23, 1422–1433. [Google Scholar]
  22. Lu, C.L.; Li, X.F. A review of Oenanthe javanica (Blume) DC. as traditional medicinal plant and its therapeutic potential. Evid. Based Complement. Altern. Med. 2019, 2019, 6495819. [Google Scholar]
  23. Feng, K.; Kan, X.-Y.; Liu, Q.; Yan, Y.-J.; Sun, N.; Yang, Z.-Y.; Zhao, S.-P.; Wu, P.; Li, L.-J. Metabolomics Analysis Reveals Metabolites and Metabolic Pathways Involved in the Growth and Quality of Water Dropwort [Oenanthe javanica (Blume) DC.] under Nutrient Solution Culture. Plants 2023, 12, 1459. [Google Scholar] [CrossRef]
  24. Kumar, S.; Huang, X.; Ji, Q.; Qayyum, A.; Zhou, K.; Ke, W.; Zhu, H.; Zhu, G. Influence of Blanching on the Gene Expression Profile of Phenylpropanoid, Flavonoid and Vitamin Biosynthesis, and Their Accumulation in Oenanthe javanica. Antioxidants 2022, 11, 470. [Google Scholar] [CrossRef]
  25. Kumar, S.; Li, G.; Yang, J.; Huang, X.; Ji, Q.; Liu, Z.; Ke, W.; Hou, H. Effect of salt stress on growth, physiological parameters, and ionic concentration of water dropwort (Oenanthe javanica) cultivars. Front. Plant Sci. 2021, 12, 660409. [Google Scholar]
  26. Seo, W.H.; Baek, H.H. Identification of characteristic aroma-active compounds from water dropwort (Oenanthe javanica DC.). J. Agric. Food Chem. 2005, 53, 6766–6770. [Google Scholar]
  27. Zhang, Z.; Dong, H.; Yuan, M.; Yu, Y. The complete chloroplast genome of Oenanthe javanica. Mitochondrial DNA B Resour. 2020, 5, 3151–3153. [Google Scholar]
  28. Jiang, Q.; Wang, F.; Tan, H.W.; Li, M.Y.; Xu, Z.S.; Tan, G.F.; Xiong, A.S. De novo transcriptome assembly, gene annotation, marker development, and miRNA potential target genes validation under abiotic stresses in Oenanthe javanica. Mol. Genet. Genom. 2015, 290, 671–683. [Google Scholar]
  29. Yao, J.; Zhao, F.; Xu, Y.; Zhao, K.; Quan, H.; Su, Y.; Hao, P.; Liu, J.; Yu, B.; Yao, M.; et al. Complete chloroplast genome sequencing and phylogenetic analysis of two Dracocephalum plants. BioMed Res. Int. 2020, 2020, 4374801. [Google Scholar]
  30. Koren, S.; Walenz, B.P.; Berlin, K.; Miller, J.R.; Phillippy, A.M. Canu: Scalable and accurate long-read assembly via adaptive k-mer weighting and repeat separation. Genom. Res. 2017, 27, 722–736. [Google Scholar]
  31. Chan, P.P.; Lowe, T.M. tRNAscan-SE: Searching for tRNA genes in genomic sequences. Methods Mol. Biol. 2019, 1962, 1–14. [Google Scholar]
  32. Li, M.Y.; Zhang, R.; Li, R.; Zheng, K.M.; Xiao, J.C.; Zheng, Y.X. Analyses of chloroplast genome of Eutrema japonicum provide new Insights into the evolution of Eutrema Species. Agronomy 2021, 11, 2546. [Google Scholar]
  33. Powell, W.; Machray, G.C.; Provan, J. Polymorphism revealed by simple sequence repeats. Trends Plant Sci. 1996, 1, 215–222. [Google Scholar]
  34. Avvaru, A.K.; Saxena, S.; Sowpati, D.T.; Mishra, R.K. MSDB: A comprehensive database of simple sequence repeats. Genom. Biol. Evol. 2017, 9, 1797–1802. [Google Scholar]
  35. Gu, C.; Dong, B.; Xu, L.; Tembrock, L.R.; Zheng, S.; Wu, Z. The complete chloroplast genome of Heimia myrtifolia and comparative analysis within myrtales. Molecules 2018, 23, 846. [Google Scholar]
  36. Dong, S.; Chen, L.; Liu, Y.; Wang, Y.; Zhang, S.; Yang, L.; Lang, X.; Zhang, S. The draft mitochondrial genome of Magnolia biondii and mitochondrial phylogenomics of angiosperms. PLoS ONE 2020, 15, e0231020. [Google Scholar]
  37. Shi, Y.; Liu, Y.; Zhang, S.; Zou, R.; Tang, J.; Mu, W.; Peng, Y.; Dong, S. Assembly and comparative analysis of the complete mitochondrial genome sequence of Sophora japonica ‘JinhuaiJ2’. PLoS ONE 2018, 13, e0202485. [Google Scholar]
  38. Sun, Y.; Li, M.Y.; Ma, J.Y.; He, M.L.; Zheng, Y.X. Complete chloroplast genome sequence of a new variety of Brasenia schreberi: Genome characteristics, comparative analysis, and phylogenetic relationships. Agronomy 2022, 12, 2972. [Google Scholar]
  39. Stothard, P.; Grant, J.R.; Van Domselaar, G. Visualizing and comparing circular genomes using the CGView family of tools. Brief. Bioinform. 2019, 20, 1576–1582. [Google Scholar]
  40. Spinelli, J.B.; Haigis, M.C. The multifaceted contributions of mitochondria to cellular metabolism. Nat. Cell Biol. 2018, 20, 745–754. [Google Scholar]
  41. Wynn, E.L.; Christensen, A.C. Repeats of unusual size in plant mitochondrial genomes: Identification, incidence and evolution. G3 2019, 9, 549–559. [Google Scholar]
  42. Ni, Y.; Li, J.; Chen, H.; Yue, J.; Chen, P.; Liu, C. Comparative analysis of the chloroplast and mitochondrial genomes of Saposhnikovia divaricata revealed the possible transfer of plastome repeat regions into the mitogenome. BMC Genom. 2022, 23, 570. [Google Scholar] [CrossRef] [PubMed]
  43. Li, Z.; Bai, D.; Zhong, Y.; Abid, M.; Qi, X.; Hu, C.; Fang, J. Physiological responses of two contrasting kiwifruit (Actinidia spp.) rootstocks against waterlogging stress. Plants 2021, 10, 2586. [Google Scholar] [CrossRef] [PubMed]
  44. Hanson, G.; Coller, J. Codon optimality, bias and usage in translation and mRNA decay. Nat. Rev. Mol. Cell Biol. 2018, 19, 20–30. [Google Scholar]
  45. Tang, D.; Huang, S.; Quan, C.; Huang, Y.; Miao, J.; Wei, F. Mitochondrial genome characteristics and phylogenetic analysis of the medicinal and edible plant Mesona chinensis Benth. Front. Genet. 2023, 13, 1056389. [Google Scholar] [CrossRef] [PubMed]
  46. Yu, C.H.; Dang, Y.; Zhou, Z.; Wu, C.; Zhao, F.; Sachs, M.S.; Liu, Y. Codon usage influences the local rate of translation elongation to regulate co-translational protein folding. Mol. Cell 2015, 59, 744–754. [Google Scholar] [CrossRef] [PubMed] [Green Version]
  47. He, P.; Xiao, G.; Liu, H.; Zhang, L.; Zhao, L.; Tang, M.; Huang, S.; An, Y.; Yu, J. Two pivotal RNA editing sites in the mitochondrial atp1 mRNA are required for ATP synthase to produce sufficient ATP for cotton fiber cell elongation. New Phytol. 2018, 218, 167–182. [Google Scholar] [CrossRef] [Green Version]
  48. Zhuang, Y.; Tripp, E.A. The draft genome of Ruellia speciosa (Beautiful Wild Petunia: Acanthaceae). DNA Res. 2017, 24, 179–192. [Google Scholar]
  49. Feng, Y.; Xiang, X.; Akhter, D.; Pan, R.; Fu, Z.; Jin, X. Mitochondrial phylogenomics of fagales provides insights into plant mitogenome mosaic evolution. Front. Plant Sci. 2021, 12, 762195. [Google Scholar] [CrossRef]
Figure 1. Gene map of the mitochondrial genome of O. javanica. Forward-coding genes are on the outside of the circle, reverse-coding genes are on the inside of the circle, and the inner gray circle represents the GC content.
Agronomy 13 02103 g001
Figure 2. Distribution of tandem repeats in the watercress mitochondrial genome. (A) Type and number of tandem repeats. (B) Distribution of repeats on the genome. The yellow color is the genome scale, with simple repeats in the outermost circle (blue), followed (red) by tandem repeats, and scattered repeats in the innermost concatenation.
Agronomy 13 02103 g002
Figure 3. RSCU of the watercress mitochondrial genome.
Agronomy 13 02103 g003
Figure 4. The nucleotide variability (Pi) value of genes in watercress mitochondrial genome.
Agronomy 13 02103 g004
Figure 5. Chloroplast and mitochondrial sequence homologous fragments from watercress. Chloroplast is the chloroplast sequence, and the others are mitochondrial sequences. Genes from the same complex are labeled with the same color, and the middle line connection indicates homologous sequences.
Agronomy 13 02103 g005
Figure 6. Statistics of the number of RNA editing sites in watercress. (A) Statistics of the number of RNA editing sites per gene. (B) Statistics of the change in hydrophilicity of amino acids caused by RNA editing.
Agronomy 13 02103 g006
Figure 7. Comparative analysis of mitochondrial structure. The two outermost circles represent the gene lengths and orientations of the mitochondrial genome, the inner circle represents the similarity results between comparisons with other genomes, and the black circle represents the GC content.
Agronomy 13 02103 g007
Figure 8. Mitochondrial sequence covariance analysis of watercress. (A) Multiple synteny plot of watercress with closely related species. The boxes in each row indicate a genome, and the connecting lines in the middle indicate regions of homology. (B) Dot plot of watercress with closely related species. The horizontal coordinate in each box indicates the assembled sequence, the vertical coordinate indicates the other sequences, the red line in the box indicates the forward comparison, and the blue line indicates the reverse complementary comparison.
Agronomy 13 02103 g008
Figure 9. Phylogenetic tree based on protein-coding genes in mitochondrial genomes of 29 species. The numbers at each node are bootstrap support values (expressed as a percentage of 1000 replicates). The text corresponding to the red dots in the figure indicates watercress (Oenanthe javanica).
Agronomy 13 02103 g009
Table 1. Gene composition of the mitogenome of O. javanica.
TypesGroup of GenesName of Genes
Protein coding genes (PCGs)ATP synthaseatp1, atp4, atp6, atp8, atp9
NADH dehydrogenasenad1, nad2, nad3, nad4, nad4L, nad5, nad6, nad7, nad9
Cytochrome c biogenesiscob
Ubiquinol cytochrome c reductaseccmB, ccmC, ccmFC, ccmFN
Cytochrome c oxidasecox1, cox2, cox3
MaturasesmatR
Transport membrane proteinmttB(×2)
Ribosomal proteins (LSU)rpl5, rpl10(×2), rpl16
Ribosomal proteins (SSU)rps3, rps4, rps7, rps12, rps13
Ribosomal RNAsrrn5, rrn18, rrn26
Transfer RNAstrnC-GCA, trnD-GTC, trnE-TTC, trnF-AAA, trnF-GAA, trnG-GCC, trnH-GTG, trnI-GAT *, trnK-TTT, trnM-CAT(×7), trnN-GTT, trnP-CGG *, trnP-TGG(×2), trnQ-TTG, trnS-GCT, trnS-GGA, trnS-TGA(×2), trnT-TGT *, trnW-CCA, trnY-GTA
Notes: * indicates that the gene contains one intron; the number in parentheses represents the number of copies of the gene (×2 means having two copies).
Disclaimer/Publisher’s Note: The statements, opinions and data contained in all publications are solely those of the individual author(s) and contributor(s) and not of MDPI and/or the editor(s). MDPI and/or the editor(s) disclaim responsibility for any injury to people or property resulting from any ideas, methods, instructions or products referred to in the content.

