Article

Legume Cover Crop Alleviates the Negative Impact of No-Till on Tomato Productivity in a Mediterranean Organic Cropping System

by
Lara Abou Chehade
1,*,
Daniele Antichi
1,2,
Christian Frasconi
1,
Massimo Sbrana
1,2,
Lorenzo Gabriele Tramacere
1,2,
Marco Mazzoncini
1,2 and
Andrea Peruzzi
1
1
Department of Agriculture, Food and Environment, University of Pisa, Via Del Borghetto 80, 56124 Pisa, Italy
2
Centre for Agri-Environmental Research “Enrico Avanzi”, University of Pisa, Via Vecchia di Marina 6, San Piero a Grado, 56122 Pisa, Italy
*
Author to whom correspondence should be addressed.
Agronomy 2023, 13(8), 2027; https://doi.org/10.3390/agronomy13082027
Submission received: 31 May 2023 / Revised: 25 July 2023 / Accepted: 27 July 2023 / Published: 30 July 2023

Abstract

:
The ecosystem services a cover crop (CC) provides depend enormously on species choice and tillage system. Here, we evaluated the impact of (a) three winter CCs—rye (Secale cereale L.) and squarrose clover (Trifolium squarrosum L.) monocultures and their mixture, and (b) two tillage systems—roller-crimping of CC residue as dead mulch for no-till (NT) systems and incorporating CC residue into the soil as green manure for conventional tillage (CT) systems—on the performance of organic processing tomato, i.e., plant growth, nutrient accumulation, fruit yield, and weed biomass. The assessments took place over two years in field experiments conducted under Mediterranean conditions. At the termination time, rye and mixture were the most productive and the best weed-suppressive CCs. During tomato growing season, squarrose clover regardless of tillage system stimulated tomato growth, Nitrogen content and uptake, and the yield relative to the other cover crops. Nevertheless, NT generally impaired the tomato nutritional status and increased weed biomass compared to CT despite some potential weed control by cover crops. These two aspects caused a significant drop in tomato yield in all NT systems. The results suggested that, despite the multiple benefits the compared CCs can offer in Mediterranean agroecosystems, legume CCs could be the key to developing feasible organic vegetable no-till systems.

1. Introduction

Cropping practices that enhance and preserve long-term soil fertility are central to organic farming. Realizing the harmful consequences of frequent soil inverting and stirring on soil fertility has raised questions regarding the use of conventional tillage in organic agroecosystems. In fact, decades of research and application have documented the positive impacts of conservation agriculture techniques, i.e., no-till or reduced tillage, residue retention on the soil surface, and cropping system diversification, on soil quality including soil stability, chemical, and biological fertility [1]. In the European Mediterranean region, organic farmers primarily focus on growing cover crops in winter, whose residue eventually turns into green manure, to promote soil health, biodiversity, and weed management [2,3,4].
Previous research has emphasized the difficulties in implementing no-till systems in organic farming, pointing particularly to ineffective weed control and nutrient management [5,6]. Thus, finding cover crop species capable of targeting these two aspects to sustain crop yield is needed [2]. Cover crops that generate dense, ideally long-lasting biomass [7] and/or release allelochemicals [8] are favored for the first target.
It is known that the magnitude of cover crop services changes as cover crop traits differ among cover crop species and their families. Legumes can symbiotically fix Nitrogen (N) and add it significantly to agroecosystems though they often yield low biomass [7]. Cereals are more efficient in resource use, have a rapid establishment, and can produce more residue with a slow decay rate [8,9]. One of the most effective cover crops is cereal rye (Secale cereale L.), which has excelled in no-till systems owing to these characteristics and its remarkable capacity to control weeds [10]. Ascribed to soil N immobilization [11,12] and the allelochemicals released during residue decomposition [13], rye has occasionally been reported to injure crops and reduce yields if not appropriately managed [11,12,13].
One of the means to achieve balanced ecosystem services while maintaining reduced tillage is using cover crop mixtures. Besides combining the advantages of the single species, multispecies cover crops, based mainly on functional complementarity, favor distinct niche occupations and resource use [14,15]. As numerous studies have documented [16,17,18,19], among the primary ecosystem services consequently provided is increased biomass production, i.e., overyielding. Therefore, mixtures are more likely to improve weed suppression [18,20], N retention, and N supply compared to pure cover crop stands [9,17,21]. Cereal and legume bicultures have been popular for these purposes and since they are simpler to manage in fields than multispecies cover crops [9,22,23]. These mixtures can be combined to include species with distinct traits, both above- and below-ground, such as those related to growth habits and nutrient-foraging strategies. Legumes such as vetches (Vicia sp.) with a tall climbing habit and spreading roots can be coupled with grass species with extensive shallower fibrous root systems and an upright canopy, such as the well-known rye. By exploiting these traits among others, mixing rye with hairy vetch can be a valid substitution for monocultures, able to outyield them by more than 60% and build up as much N as the vetch [9]. Other legumes such as clovers (Trifolium sp.), which have a deep and branched taproot and grow relatively quickly to cover the soil and control weeds [18], can also be used as part of other cereal–legume combinations. Mixtures with the right ratio of legume to cereal can guarantee a low residue C: N ratio, which is fundamental for N to be available to the cash crop, especially in situations with slow mineralization rates such as in no-till systems [21,24,25,26].
Here, we seek to assess the agronomic impacts of reducing tillage in Mediterranean organic vegetable production. We focused on processing tomato, a cash crop that accounts for most of the organic vegetable production in Italy [27]. Over two growing seasons, we evaluated (i.) the performance of three cover crops before termination—monoculture of squarrose clover (Trifolium squarrosum L.), monoculture of rye, and a combination of both—in terms of biomass production, nutrient uptake, and weed suppression, and (ii.) the effects of these cover crops under two tillage systems—conventional tillage and no-till—on organic processing tomato performance, i.e., crop growth, nutrient status, nutrient uptake, yields, and residual weed biomass.

2. Materials and Methods

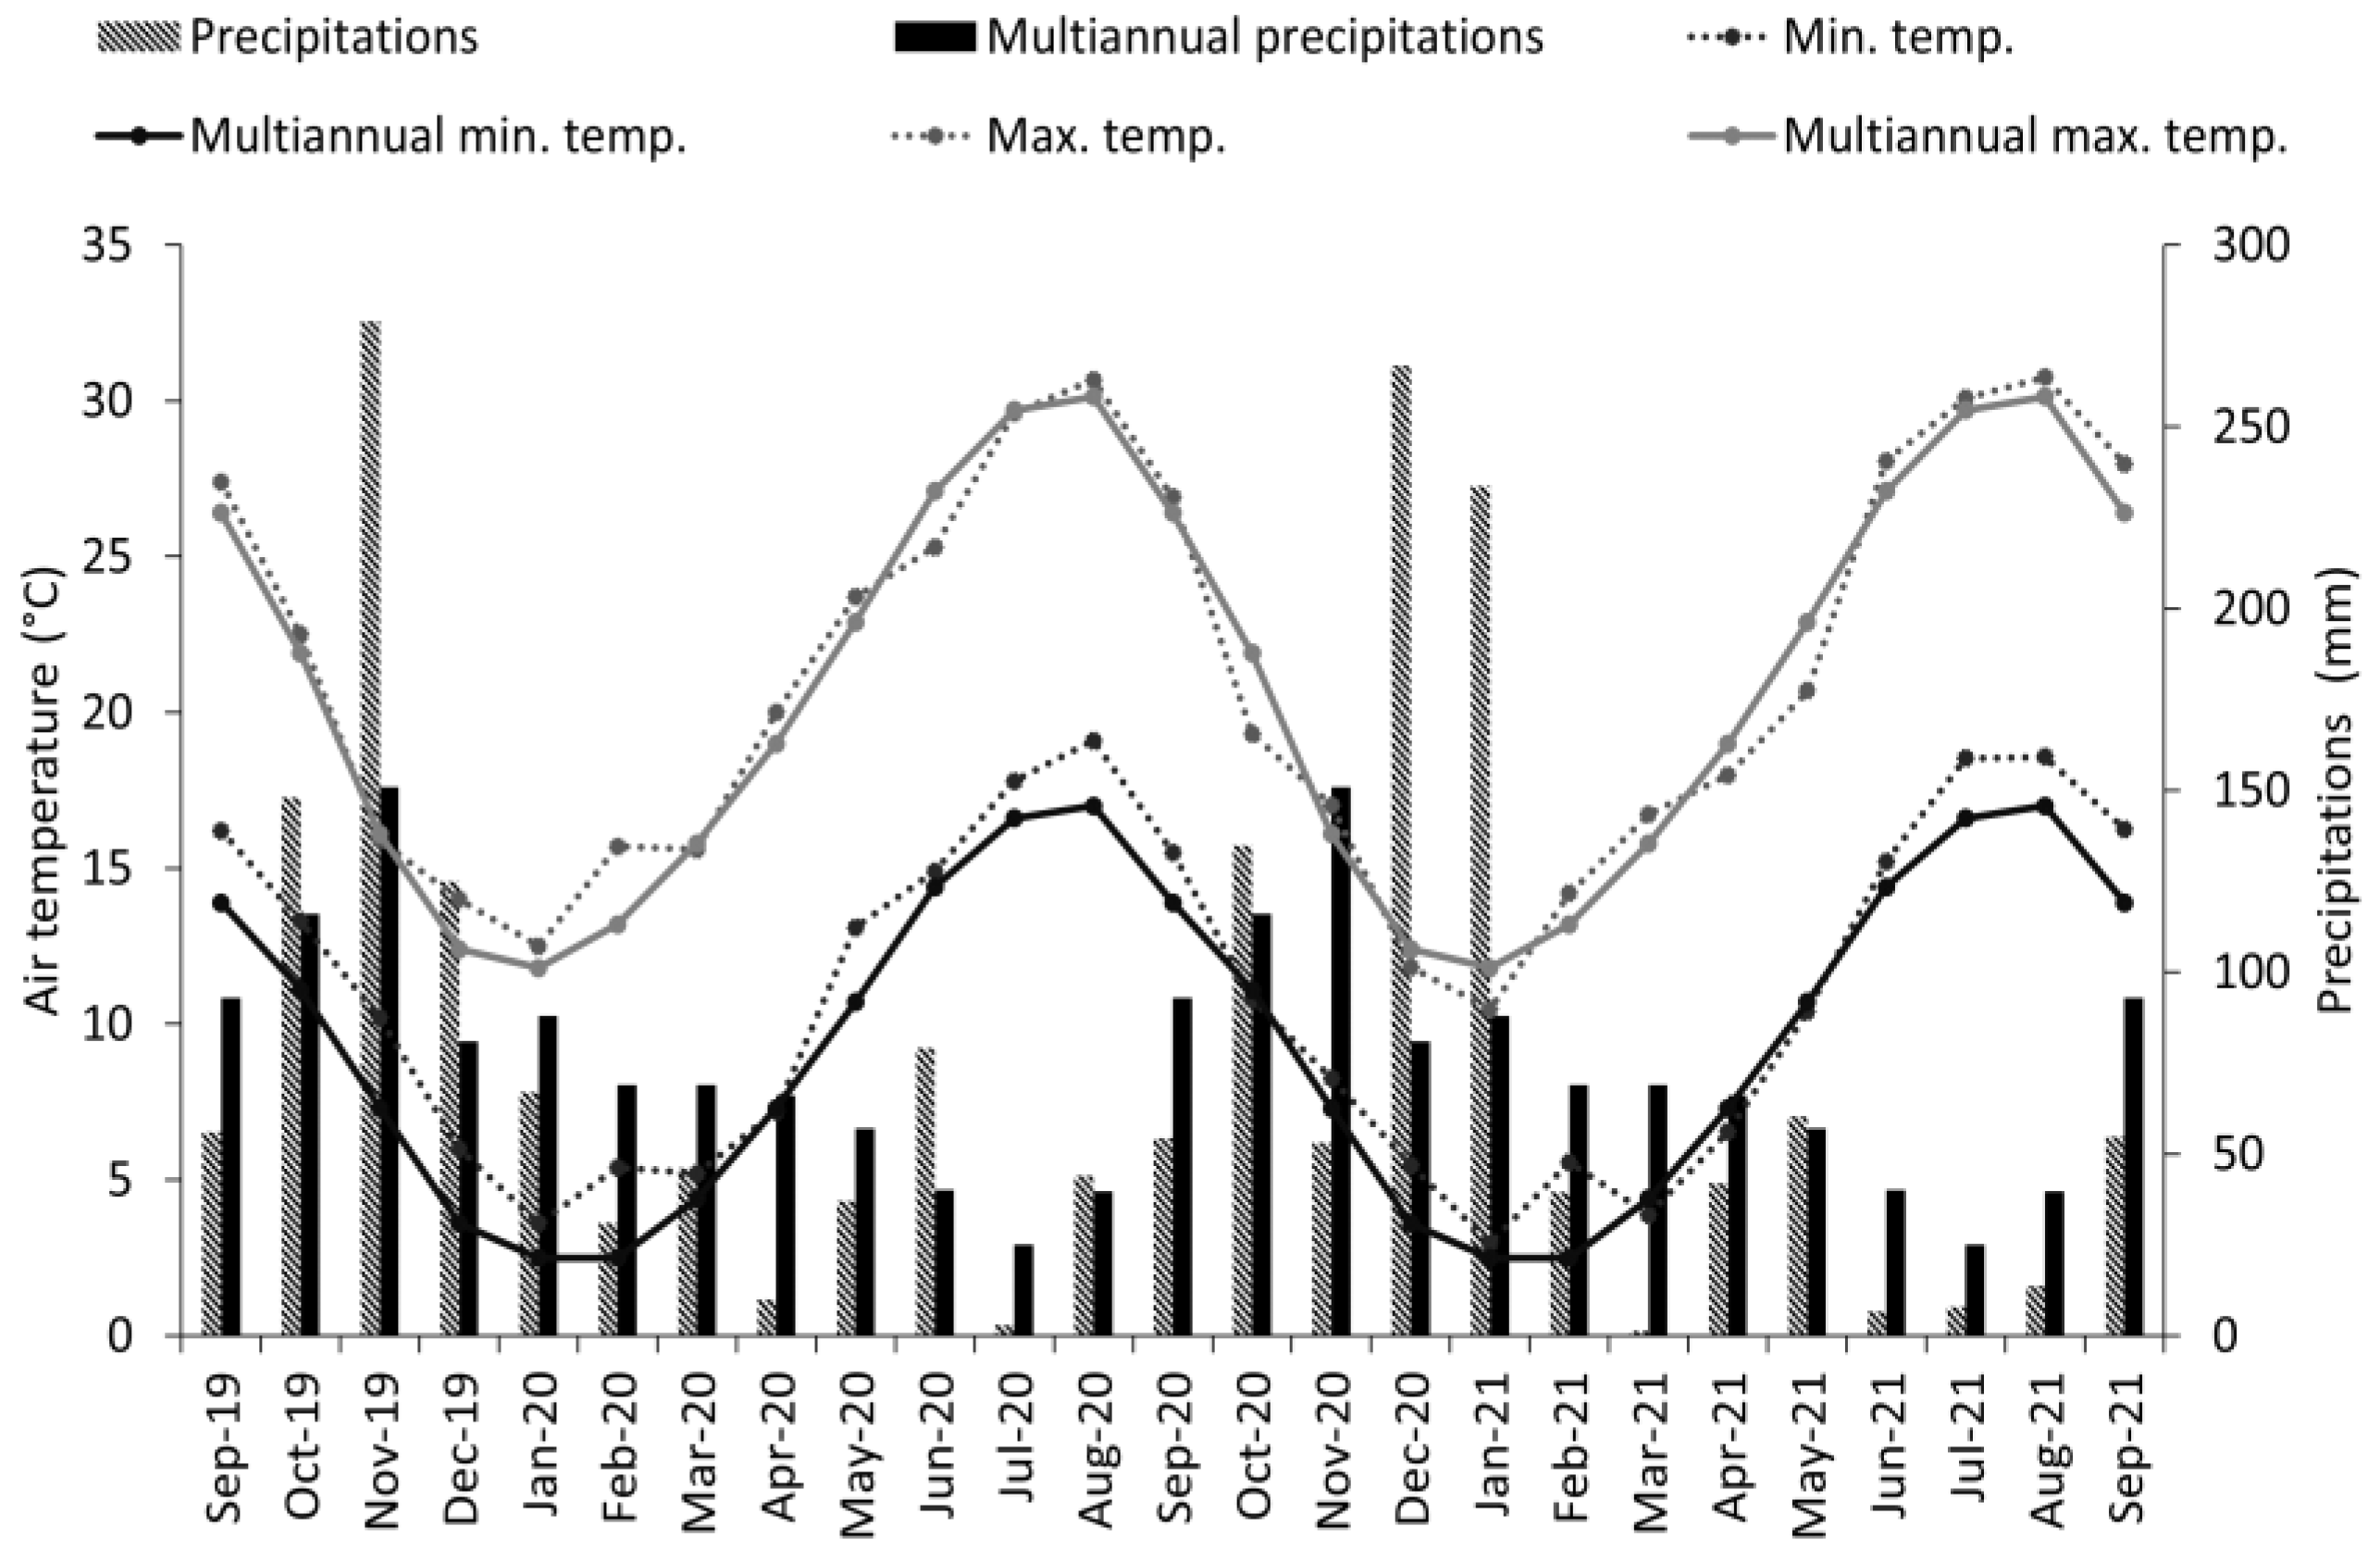
2.1. Site Description

The study was established for two seasons (2019–2020 and 2020–2021) on certified organic fields at the Center for Agri-environmental Research “Enrico Avanzi” of the University of Pisa, situated in the lower valley of the Arno River in San Piero a Grado in Pisa, Central Italy (43°40′ N Lat; 10°19′ E Long; 1 m above mean sea level and 0% slope). The site is characterized by a Mediterranean climate with an average annual precipitation of 895 mm, mainly in spring and fall, and a mean annual temperature of 14.9 °C (1993–2020). Monthly average temperatures and total precipitations registered during the study and long-term average values (1993–2020) are represented in Figure 1.
Warmer temperatures occurred during the autumn–winter of 2019–2020 and summer 2021 compared with the multiannual trend. The hottest temperatures in both years occurred in August, reaching almost 31 °C, and the coolest ones were registered in January with 3.6 °C in 2020 and 3.0 °C in 2021. Different distributions in precipitation compared to the multiannual average occurred in both years. In particular, a wetter November and December and a drier spring than the multiannual trend were recorded in 2019–2020. In 2020–2021, the season was mainly characterized by unusual rainfall in December and January and a particularly dry March. In 2020, precipitations were roughly double that of the multiannual average in early summer. A drier summer (June to September) compared to the multiannual trend and 2020 was encountered in 2021.
The experiment was set up in different fields each year. Both trials followed a fallow year. The soil, a Typic Xerofluvent, had a loamy sand texture in the first site (2019–2020) and a sandy loam texture in the second (2020–2021). Soil chemical characteristics (0–30 cm depth) at the beginning of the experiment are represented in Table 1.

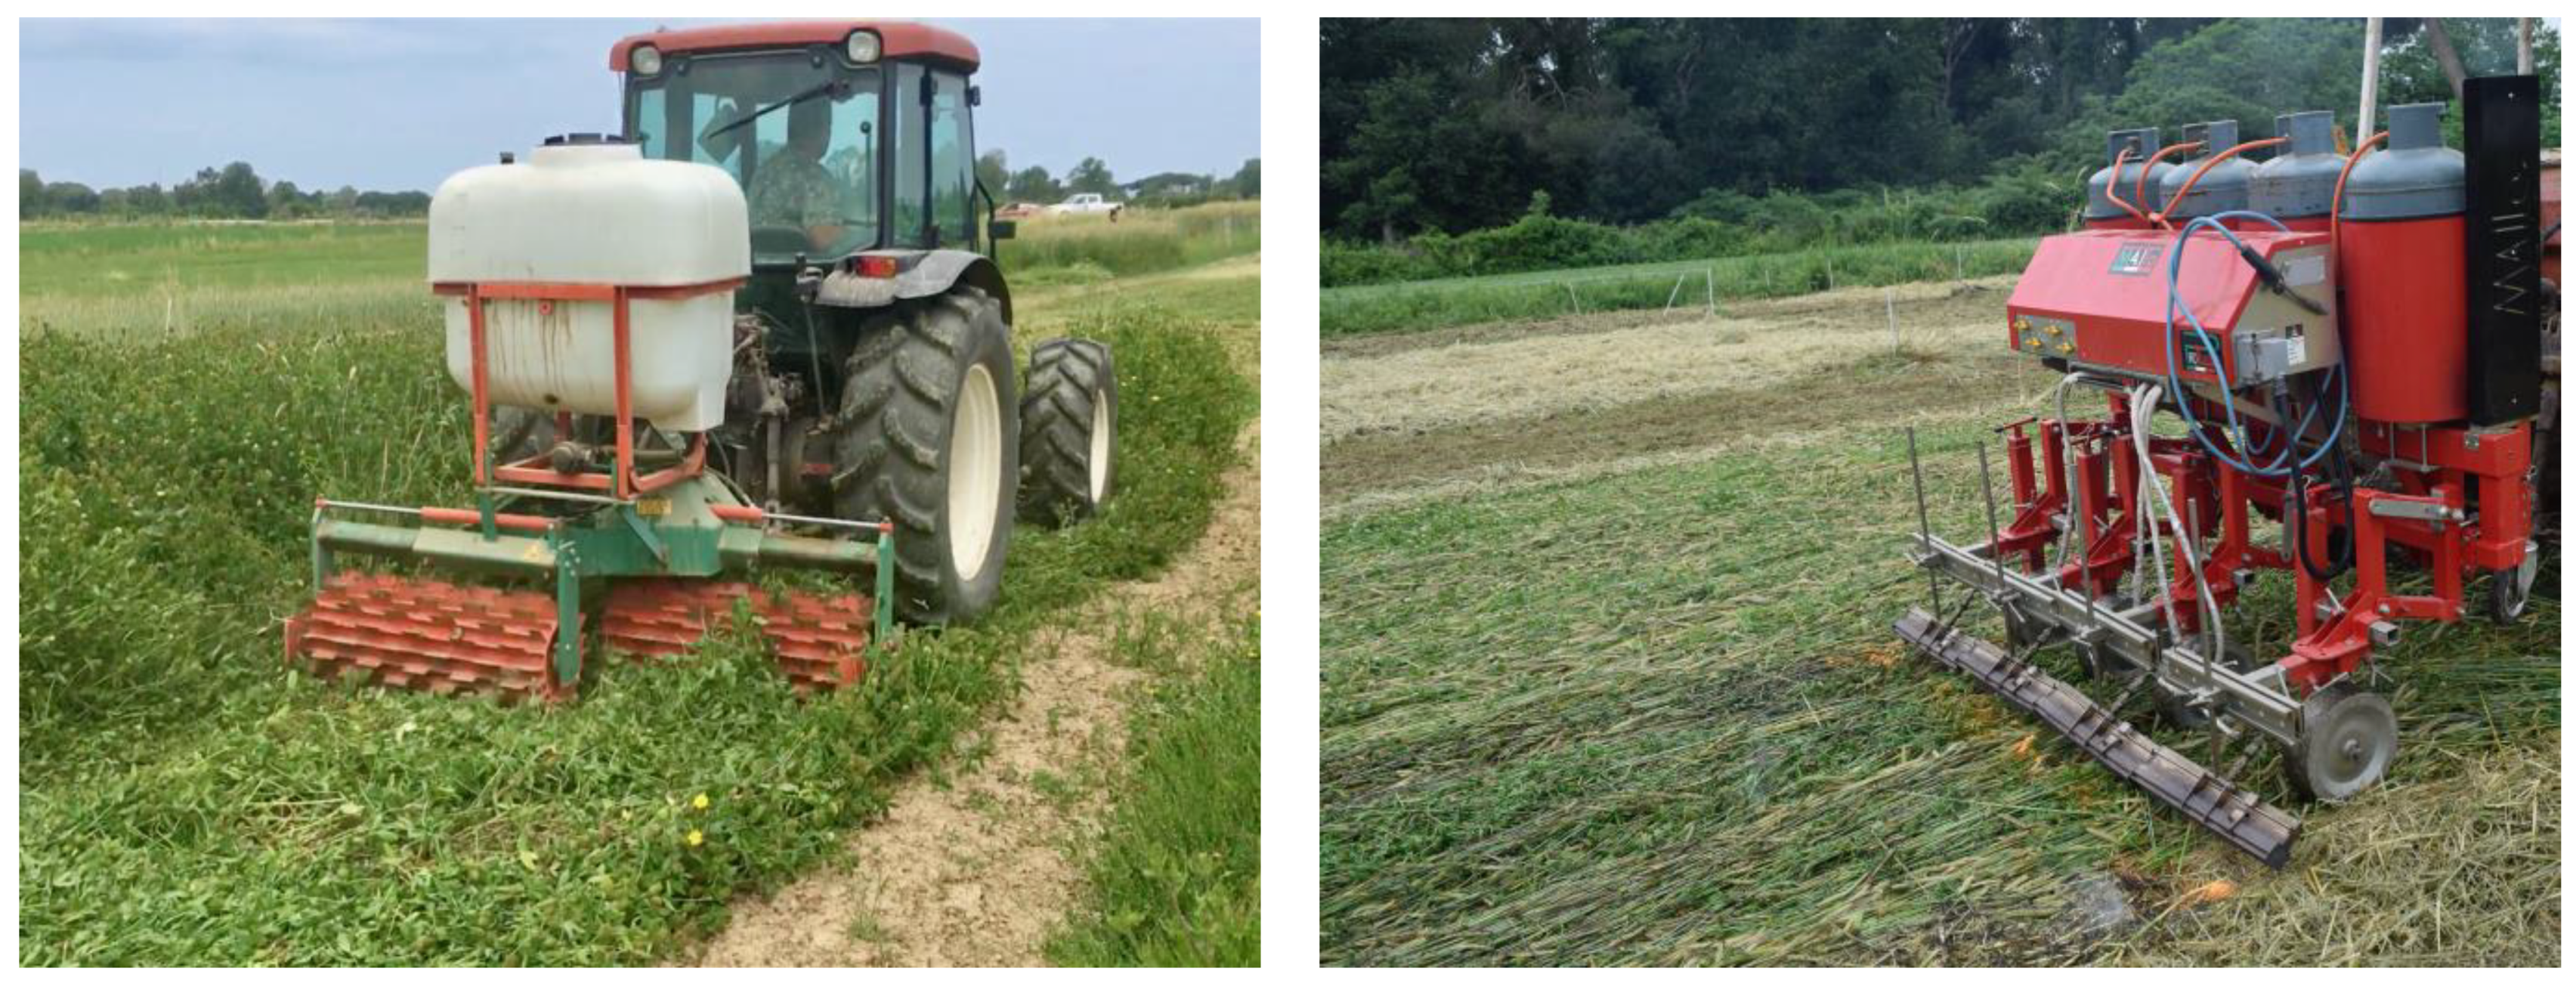
2.2. Experimental Set-Up

The experiment included eight treatments within two factors, cover crop species and tillage system. Treatments were arranged over plots following a randomized complete block design (RCBD) with three replicates. Plots measured 6 m × 10 m. Cover crop treatments consisted of monocultures of rye (S. cereale cv. Dukato), squarrose clover (T. squarrosum cv. OK), their mixture, and control kept with natural vegetation during winter. Cover crops and control plots were compared under two tillage systems (i) flail mowing and soil incorporation to almost 15 cm depth with a rotary tiller/cultivator in two passes as a standard conventional tillage system (CT) and (ii) rolling with two passes of a roller-crimper (Eco-Roll®, Clemens Technologies, Wittlich, Germany) followed by two flaming interventions (MAITO Srl., Arezzo, Italy, based on a prototype designed and realized at the University of Pisa) as a no-till (NT) system (Figure 2).
Before cover crop establishment, the soil was tilled by a combined harrow at 15 cm depth, followed by one pass of a rotary harrow to complete seedbed preparation. Cover crop seeds were hand-broadcast on the plots on 25 October 2019 and 23 November 2020, respectively. Cover crops were seeded at a rate of 50 kg ha−1 for squarrose clover and 180 kg ha−1 for rye. The corresponding mixture consisted of half the seeding rate of the single species (25:90 kg ha−1). Cover crops grew rainfed without fertilization and weed control interventions and were terminated on 28 May 2020 and 7 June 2021, respectively, for the first and second years. At termination time, squarrose clover was almost at the full flowering stage (BBCH 65), and rye was at the early milk stage (BBCH 73) [28].
Tomato seedlings (Solanum lycopersicum L. cv. Elba F1) were transplanted with a vegetable transplanter (Fast model, Fedele Costruzioni, Lanciano, Chieti, Italy) adapted to each system [29]. Transplantation was conducted at a density of 2.2 plants m−2 (1.5 m between rows, 0.3 m in-row) on 3 and 9 June 2020 and 2021, respectively. Tomatoes were harvested manually twice in each season, starting at the end of August/early September. Fertilization, irrigation, and phytosanitary interventions were the same for all treatments compared and followed the European organic agriculture standards (ex Reg. EU 2018/848 and 2018/1584). Fertilization consisted of a total of 38.7 and 36.3 kg ha−1 of N given in the first and the second year, respectively, and 21.8 kg ha−1 K2O only in the second year (VIT-ORG, Green Has Italia, Canale, Italy, 3-0-6; NUTRIGREEN, Green Has Italia, 8-0-0). Fertilizers were distributed by drip fertigation along the tomato cropping cycle. In addition, calcium (NEWCAL, Green Has Italia, 16.8%) was given in the second year at 8 kg ha−1 of CaO via foliar applications. Weed management during tomato growth was carried out with one manual weeding intervention each year on the intra-row space in all the treatments. Weeds in the inter-row area at early tomato growth stages were controlled by inter-row cultivation (twice in the first year and once in the second year) only in the plots where cover crops and natural vegetation were incorporated. In contrast, inter-row shredding was performed twice each year in no-till plots.

2.3. Samplings and Measurements

Cover crop biomass samplings were taken at the termination time by clipping the cover crop 2–3 cm above the soil surface over two areas of 0.5 m2 each per plot. Weeds were hand-separated from the samples, and the biomass yield on a dry weight (DW) basis of each component (weeds and cover crops) was determined after oven-drying of aliquots at 60 °C until a constant weight. Biomass data were used to calculate the land equivalent ratio (LER) for the mixture as a metric of “outyielding” or biodiversity effects, as reported by Smith et al. [30]. A value of LER > 1 indicates that the mixture is overyielding relative to the constituent monocultures or that more land would be required for monocultures to produce equivalent biomass to the mixture. An LER < 1 instead implies that the mixture is under-yielding or that monocultures need less land than the mixture to reach the same biomass.
Dried samples of the cover crops were then ground to pass through a 1 mm sieve. Total N and P were evaluated in the dry ground samples by Kjeldhal and colorimetric methods, respectively.
Soil-Plant Analysis Development (SPAD) readings were taken on three plants in two central regions of each plot by means of a portable chlorophyll meter (SPAD-502 Plus, Konica Minolta, Tokyo, Japan) to monitor the N status of the tomato crop. The measurements were performed on three dates (SPAD1, SPAD2, and SPAD3), on the same plants every time, during each cropping season (10/07/2020, 30/07/2020, and 27/08/2020 in the first year; 19/06/2021, 22/07/2021, and 06/08/2021 in the second year). The three dates corresponded to the vegetative growth (SPAD1), the flowering (SPAD2), and the fruit development (SPAD3) stages. One fully developed leaf was chosen for each plant, and an average of three measurements per leaf was recorded. Tomato plant growth was evaluated as plant height variations on the same plants and two dates (Height1: flowering stage; Height2: fruit development stage).
Tomato fruits were harvested from each plot in two interventions at fruit maturity, over two areas of three plants each, to determine crop yield. Tomato fruits were separated into unmarketable and potentially marketable fruits (the sum of commercial and green fruits). Fruits in each category were counted, and their fresh weight was measured. The same plants were harvested during each intervention, and the data were cumulated. A sample from marketable fruits at each harvest was put in the oven at 60 °C to determine the dry matter content. Ground samples were then analyzed for total N and P in the same way as the cover crops. The same plants harvested were also sampled each year at the final harvest time to determine their total dry biomass and N and P contents. N and P accumulations were calculated by multiplying their concentration by the dry yield. Nitrogen utilization efficiency (NUtE) was calculated as follows:
N U t E = Y N a c c t
where 𝑌 is the fresh weight of potential tomato yield (Mg ha−1), and 𝑁𝑎𝑐𝑐t is the N accumulated (kg N ha−1) in total aboveground biomass of the crop.
Weeds from the same 1.5 m2 areas where tomato plants were harvested were also collected for total aboveground dry biomass determination.

2.4. Statistical Analysis

Statistical analyses and data visualization were conducted using Rstudio statistical software (R version 4.1.2). All data were first subjected to Shapiro–Wilk and Levene’s tests to check for data normality and heteroscedasticity. Data that verified these assumptions were fitted to general linear models. Data that failed to meet these assumptions were fitted to generalized linear models selecting the best fit (distribution and link function) via the Akaike information criterion (AIC). Initially, mixed models were fitted including the block and the year as random factors. As the variance of the random effect was insignificant and the models were overfitted, we used linear models including only fixed factors. For cover crop variables, we considered the cover crop, the year, their interaction, and the block as model fixed terms. For tomato crop variables, the terms in the models were the cover crop, the tillage system, the year, their interaction, and the block. The same terms were adopted for SPAD and plant height besides timing and its interaction with the other terms. Mixed models were first fitted to these two variables trying to account for the correlation structure of data between the individual plants assessed. Analysis of deviance was then generated using the Likelihood Ratio test or F-test according to the distribution. Estimated marginal means (emmeans) comparison for statistically significant terms was carried out with Bonferroni-adjusted post hoc test at a significance level of 5% (p ≤ 0.05). Data were presented as emmeans and corresponding standard errors. The significance of the main terms and their interactions are presented in Tables S1–S3 in the Supplementary Material.

3. Results

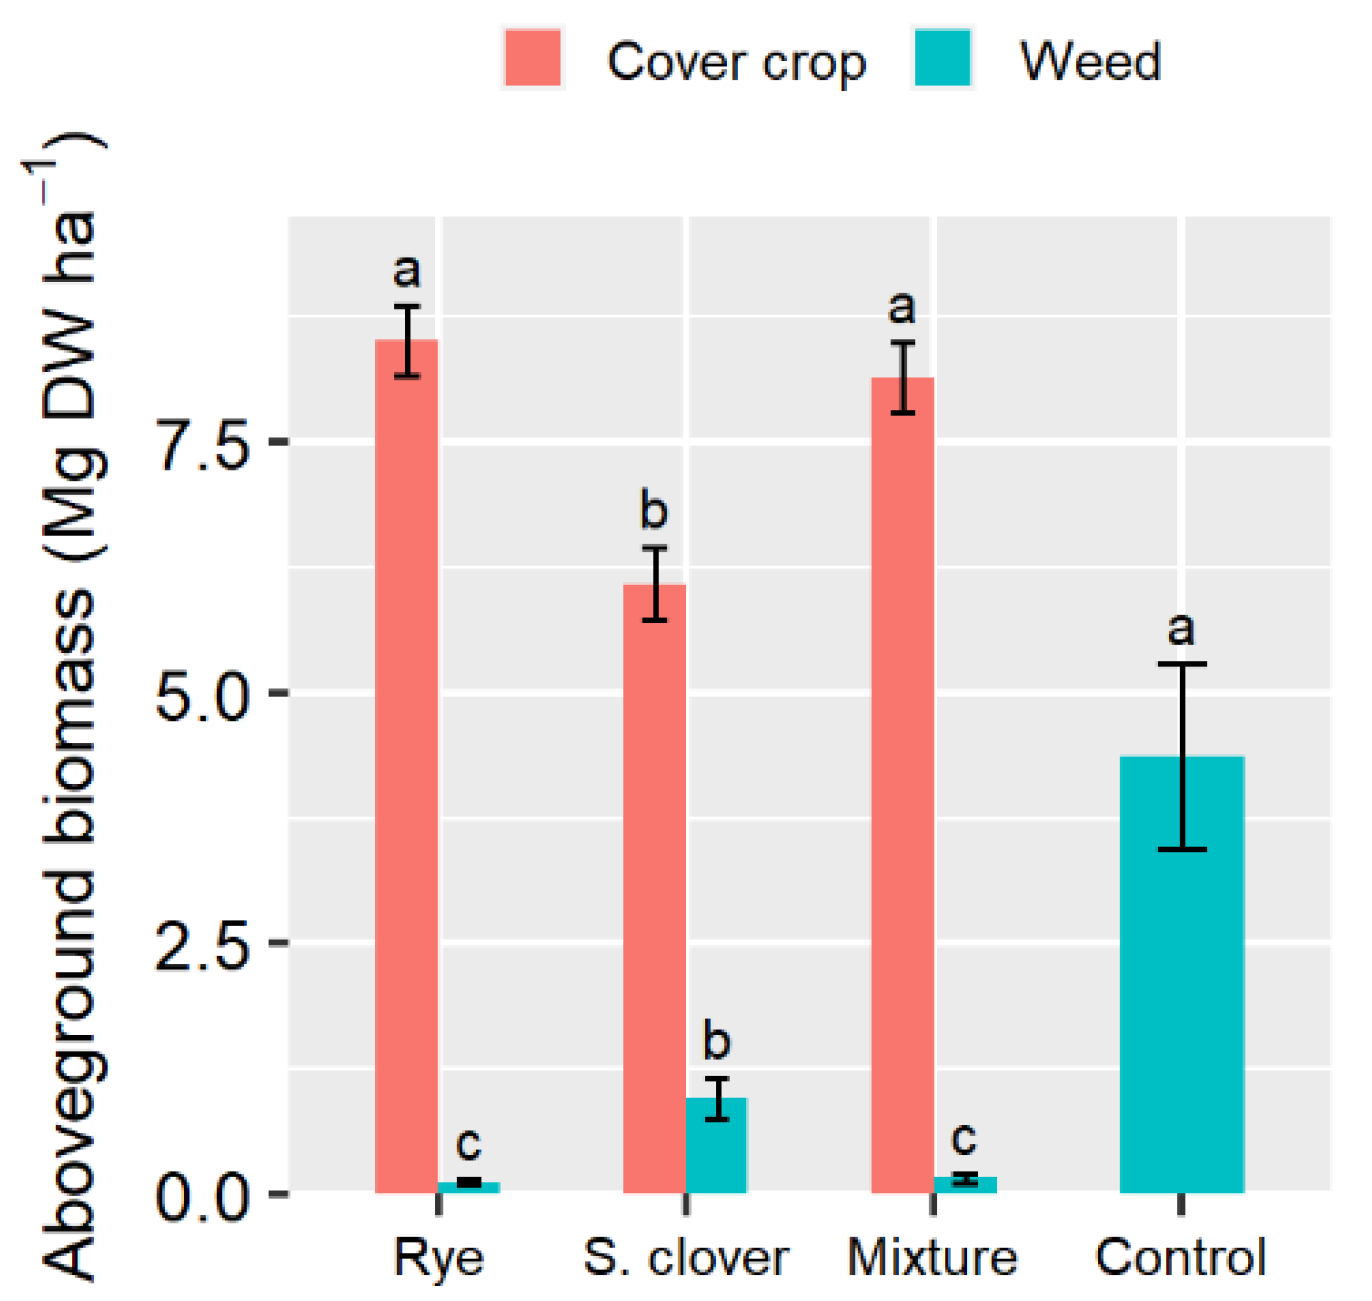
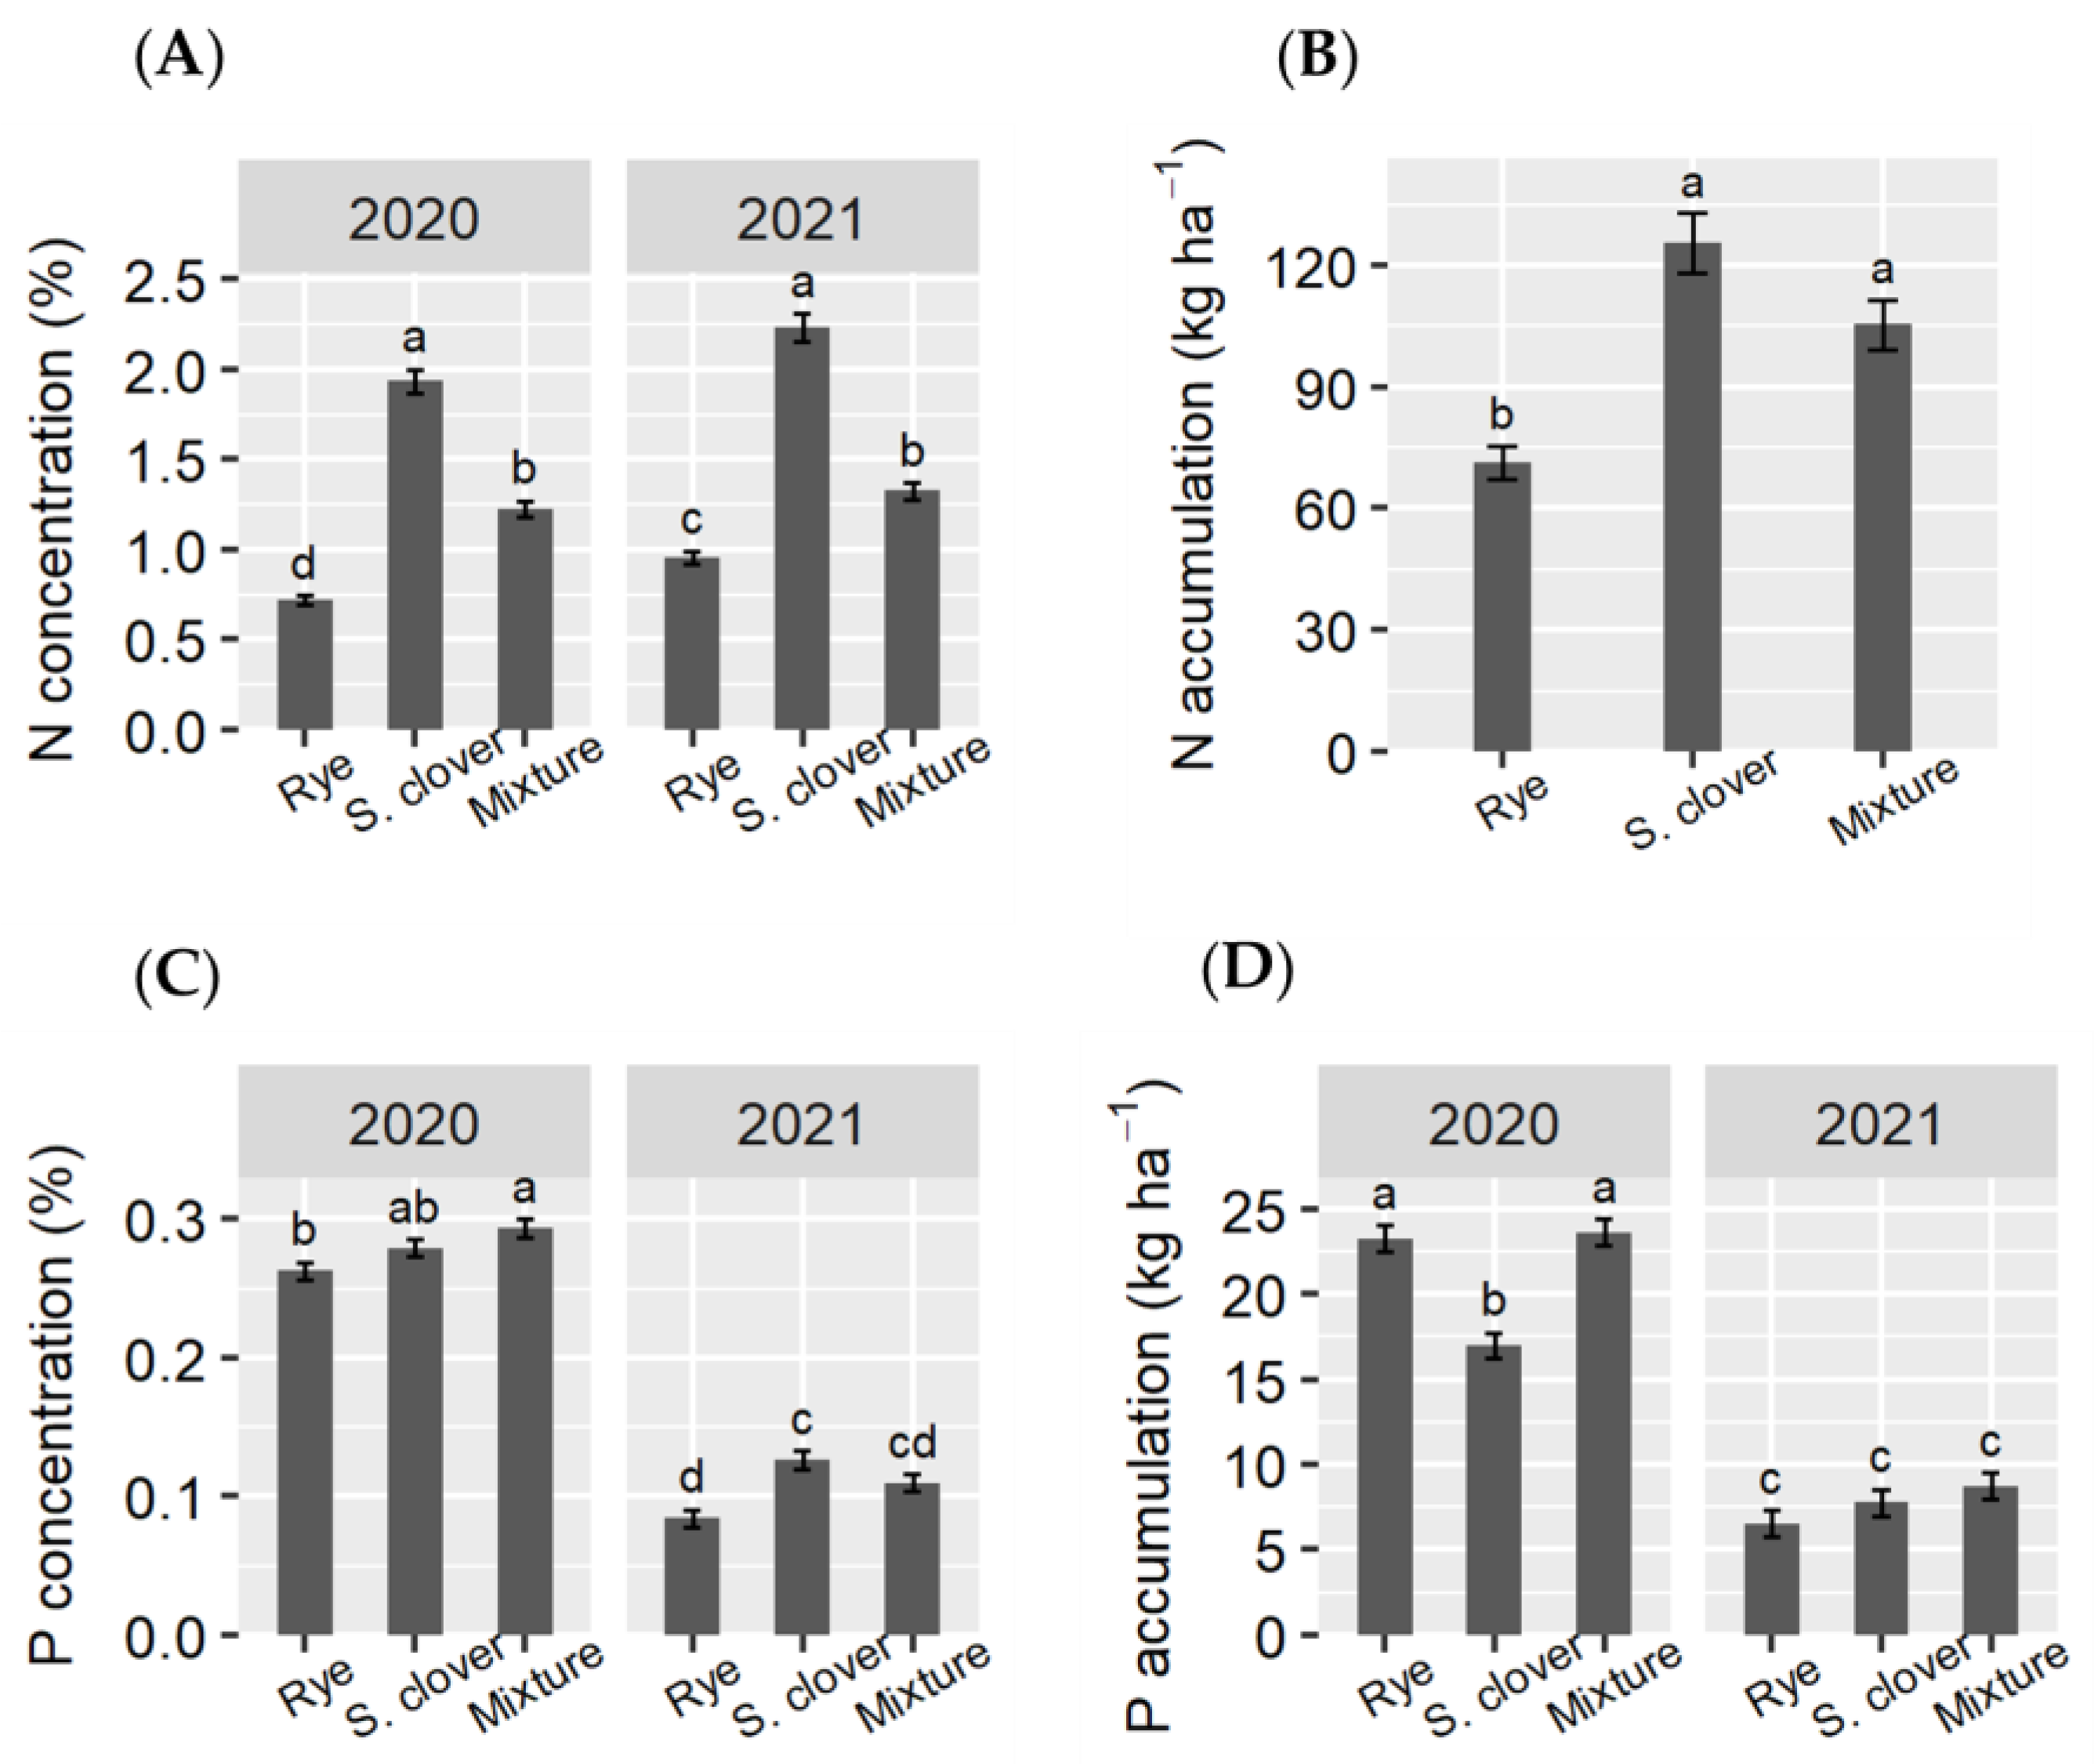
3.1. Cover Crops Performance at Termination Time: Aboveground Dry Biomass, Nutrient Accumulation, and Weed Control

The statistical significance of the effects of the main factors and their interactions on the evaluated cover crop variables are presented in Table S1 in the Supplementary Material. The cover crop biomass was not affected by the year but only by cover crop species (Figure 3). The mixture and rye produced, on average, almost 36% more biomass (8.14 and 8.51 t DW ha−1 for mixture and rye, respectively) than squarrose clover (6.09 t DW ha−1). The mixture, which was equivalent to pure rye in biomass, had consistently in both years around 64% rye and 36% squarrose clover in dry matter composition at the termination time. The year factor did not affect the LER of the mixture. Pooled across the two years, the LER had a mean of 1.10 ± 0.04 (p < 2 × 10⁻¹⁶).
The year and cover crop species drove changes in weed biomass in cover crop stands with no interaction between both (Table S1, Figure 3). Greater weed biomass characterized the second year (+35.3%). However, the three cover crops successfully controlled weeds in both years. The positive weed suppression service provided by the cover crops was about 97% for rye and the mixture, and 78% for squarrose clover, averaged over the two years, compared to the control kept with natural vegetation.
Different tissue N concentrations were found across cover crop species and years (Table S1). In 2021, tissue N concentration in rye was slightly greater than in 2020. In both years, squarrose clover had the highest N concentration, around 2.5 times on average more than N in rye at the termination time (Figure 4A). N concentration for the mixture (1.23 and 1.33 g 100 g−1, respectively for 2020 and 2021) was intermediate between pure rye (0.72 and 0.96 g 100 g−1, respectively, for 2020 and 2021) and pure squarrose clover (1.93 and 2.22 g 100 g−1, respectively, for 2020 and 2021).
Similarly, cover crop N accumulation differed across cover crop species and years (with no significant interaction, as shown in Table S1) and was mainly influenced by cover crop tissue N concentration (Figure 4B). Across both years, squarrose clover and the mixture accumulated the highest amount of N, while rye had the least amount), with N accumulation varying between 71.21 and 125.60 kg ha−1. P concentration was drastically lower in 2021 in all the cover crops (on average, 0.28 vs. 0.11 in 2020 and 2021, respectively). The mixture in 2020 and the clover in 2021 had higher P concentration than rye, with differences accounting for up to +40% in 2021, as represented in Figure 4C. P accumulation in cover crops ranged from 16.99 to 23.63 kg ha−1 in 2020, with clover accumulating the least (but significantly compared to rye and the mixture only in 2020). In 2021, on average the cover crops accumulated around half the P accumulated in 2020, ranging from 7.78 to 8.75 kg ha−1, with no differences between the cover crops (Figure 4D).

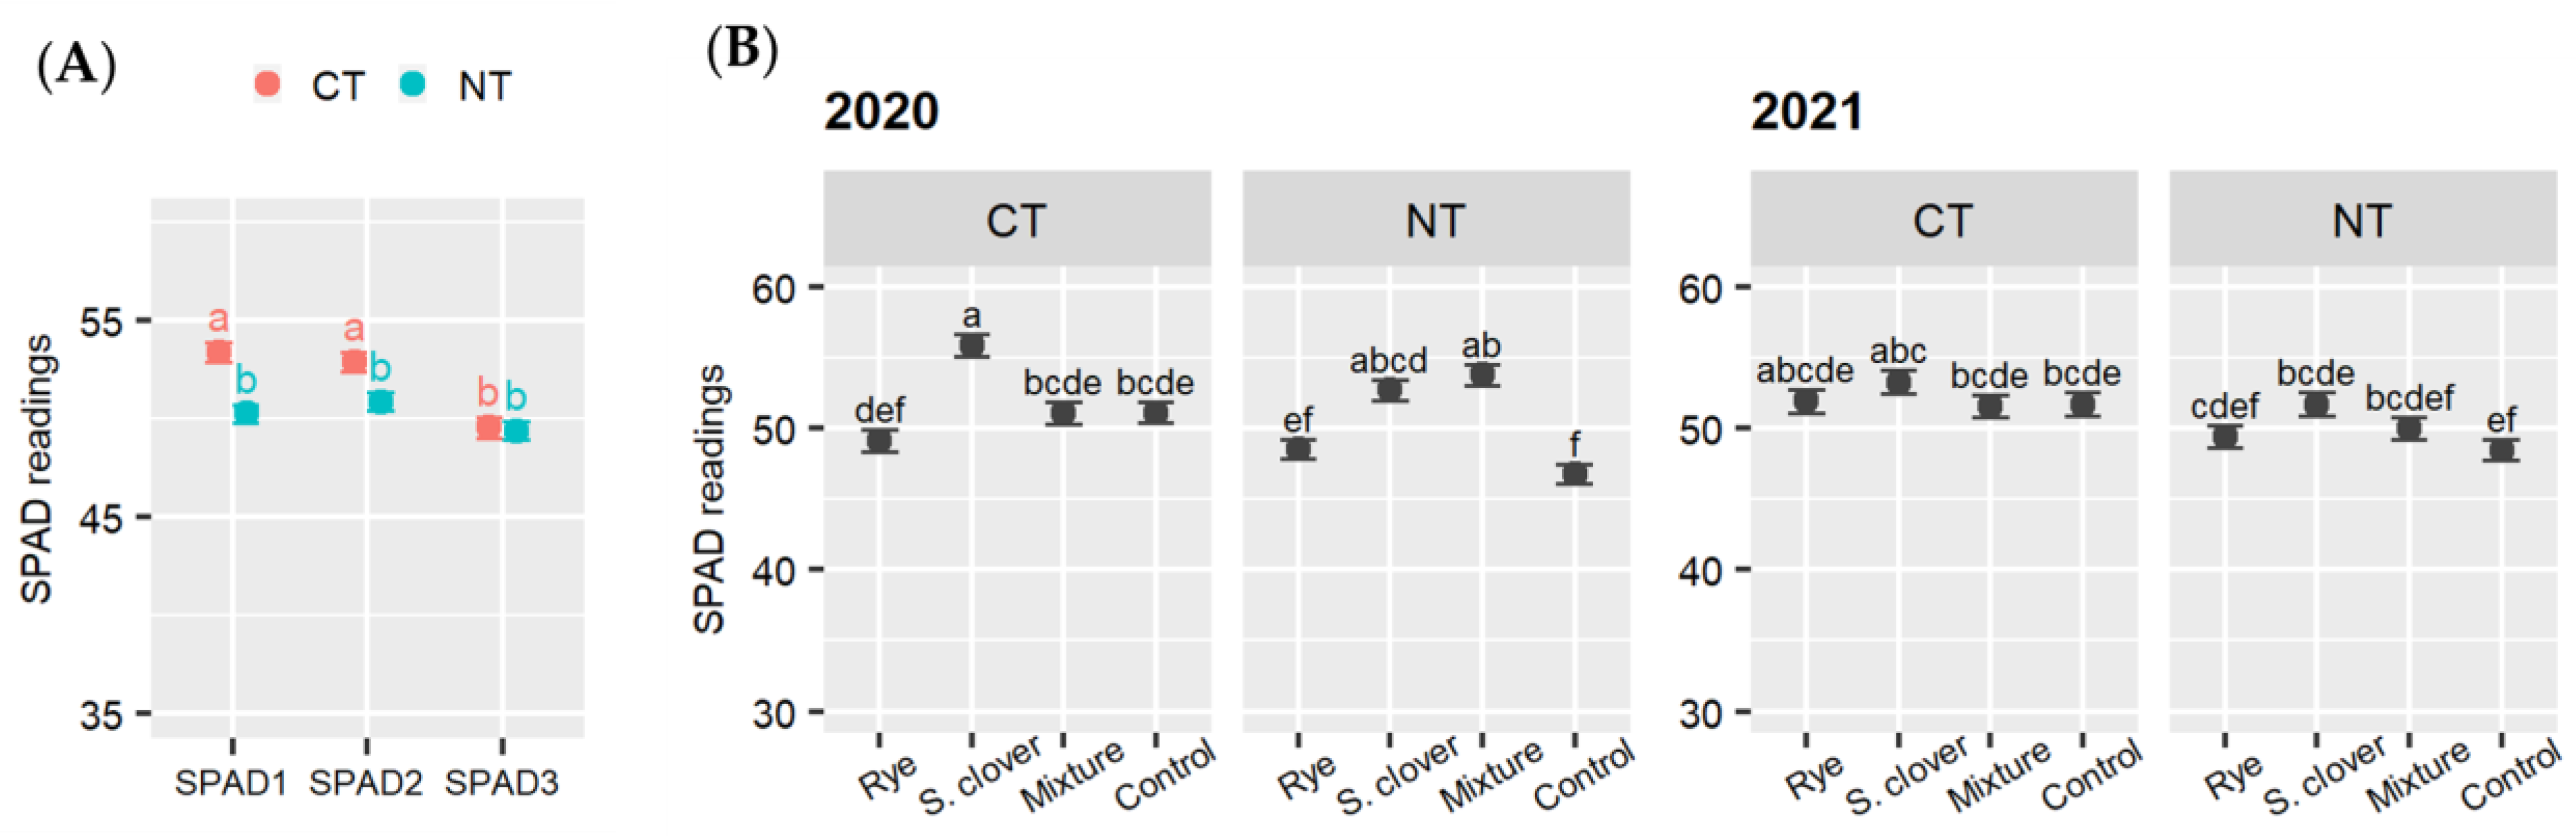
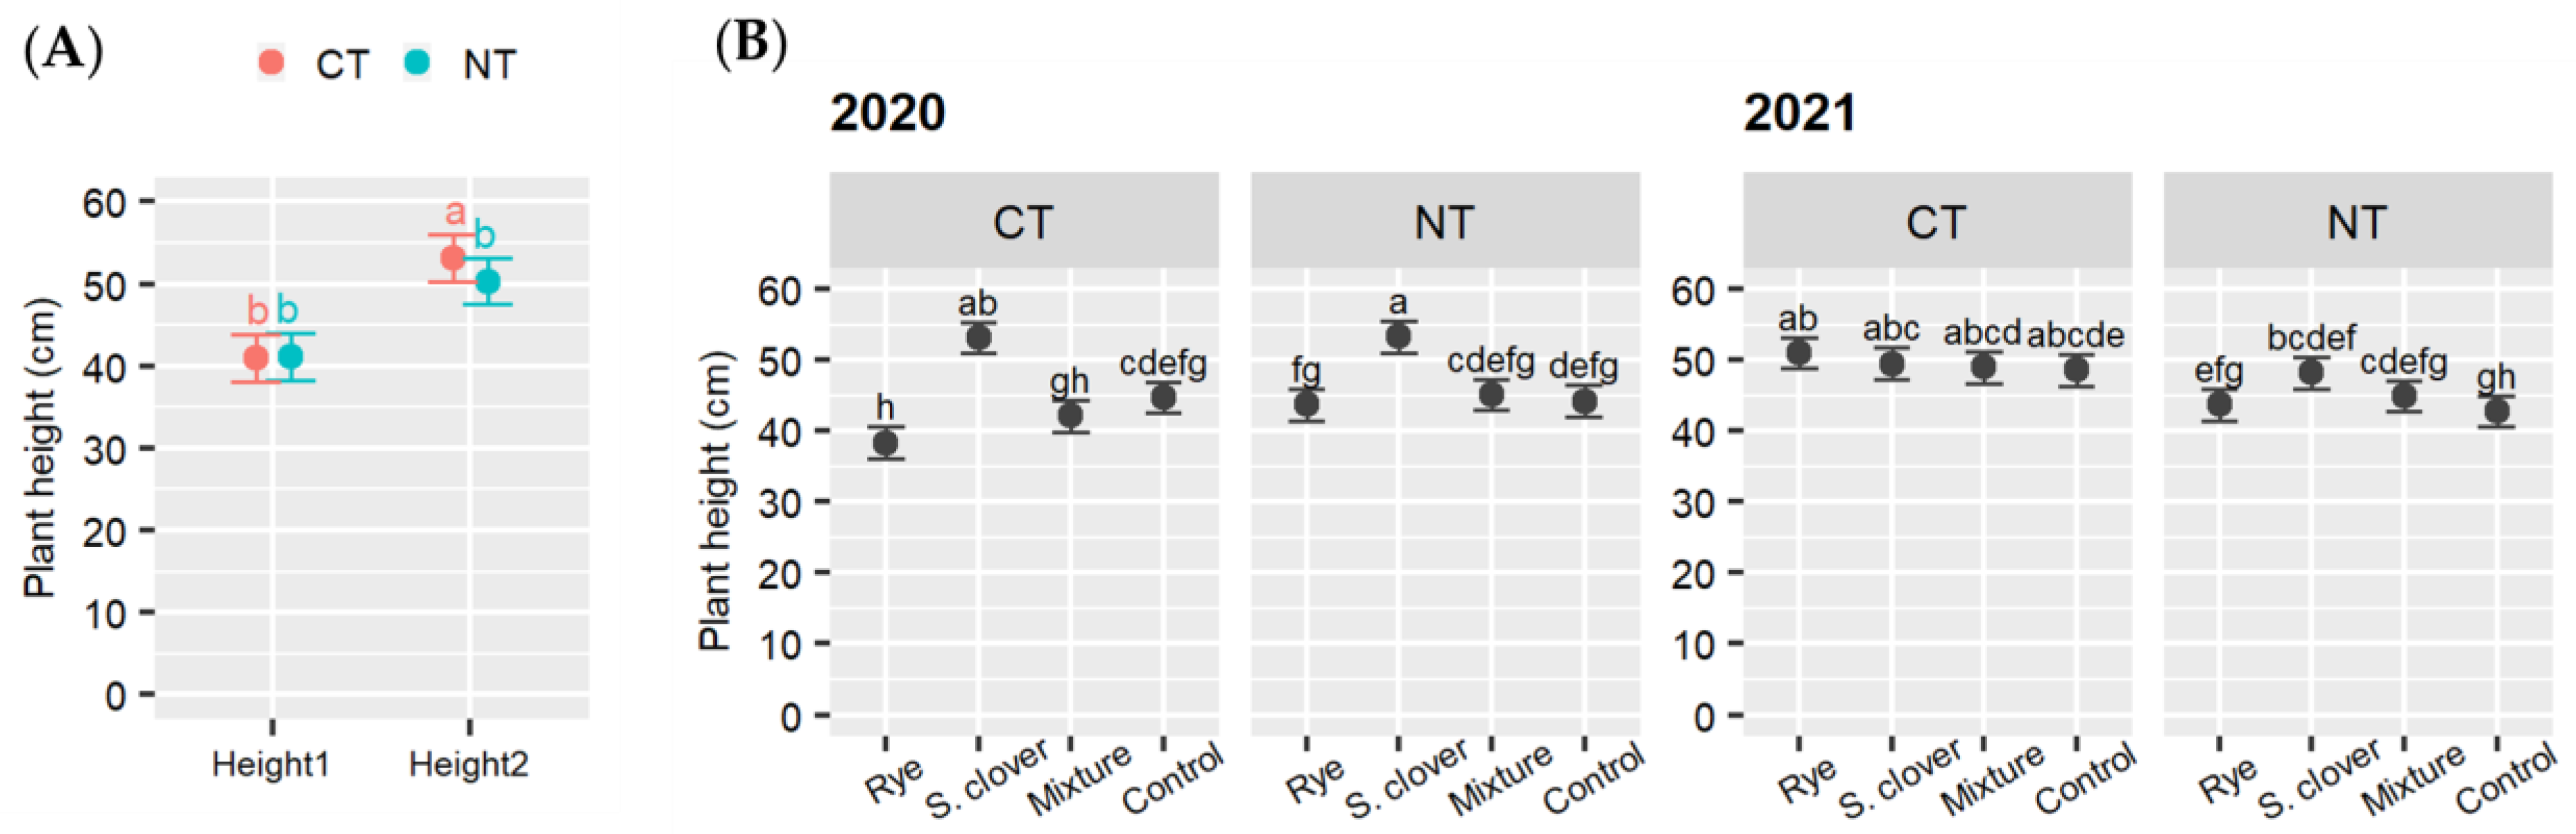
3.2. SPAD and Plant Height

Differences arose for SPAD values and tomato plant height between years, tillage systems, cover crop species, timing and their interactions (Table S2 in the Supplementary Material, Figure 5 and Figure 6). Averaged over cover crop species and years (tillage × crop stage), we observed a positive effect of CT on the SPAD value compared to NT during the cropping season until fruit development (Figure 5A). Furthermore, the tillage system interacted with cover crops differently each year (Table S2). As Figure 5B shows, differences between cover crops in each tillage system (averaged over crop stages) were observed mainly in 2020, with squarrose clover and the mixture (this latter only in NT) outperforming the other cover crop treatments. None of the cover crop effects varied significantly between tillage systems despite a general increase in CT compared to NT treatments, nor between the years (Figure 5B).
With regards to tomato plant height, we found a significant interaction between tillage and crop stage (Figure 6A). Averaged over years and cover crops, tomato plants grown under CT were taller than NT late in the season (Figure 6A). Averaged over years and tillage (cover crop × crop stage), higher plants under squarrose clover compared to all other treatments (except for mixture during fruit development) were found during the season. Tillage interacted also with cover crops and years (Table S2, Figure 6B). Similarly to SPAD, squarrose clover plots had the tallest tomato plants among the cover crops in 2020 in both tillage systems. Differences between cover crops in each tillage system in 2021 were less evident, even under CT where a significant increase in plant height in rye and mixture treatments relative to 2020 was noticed (Figure 6B).

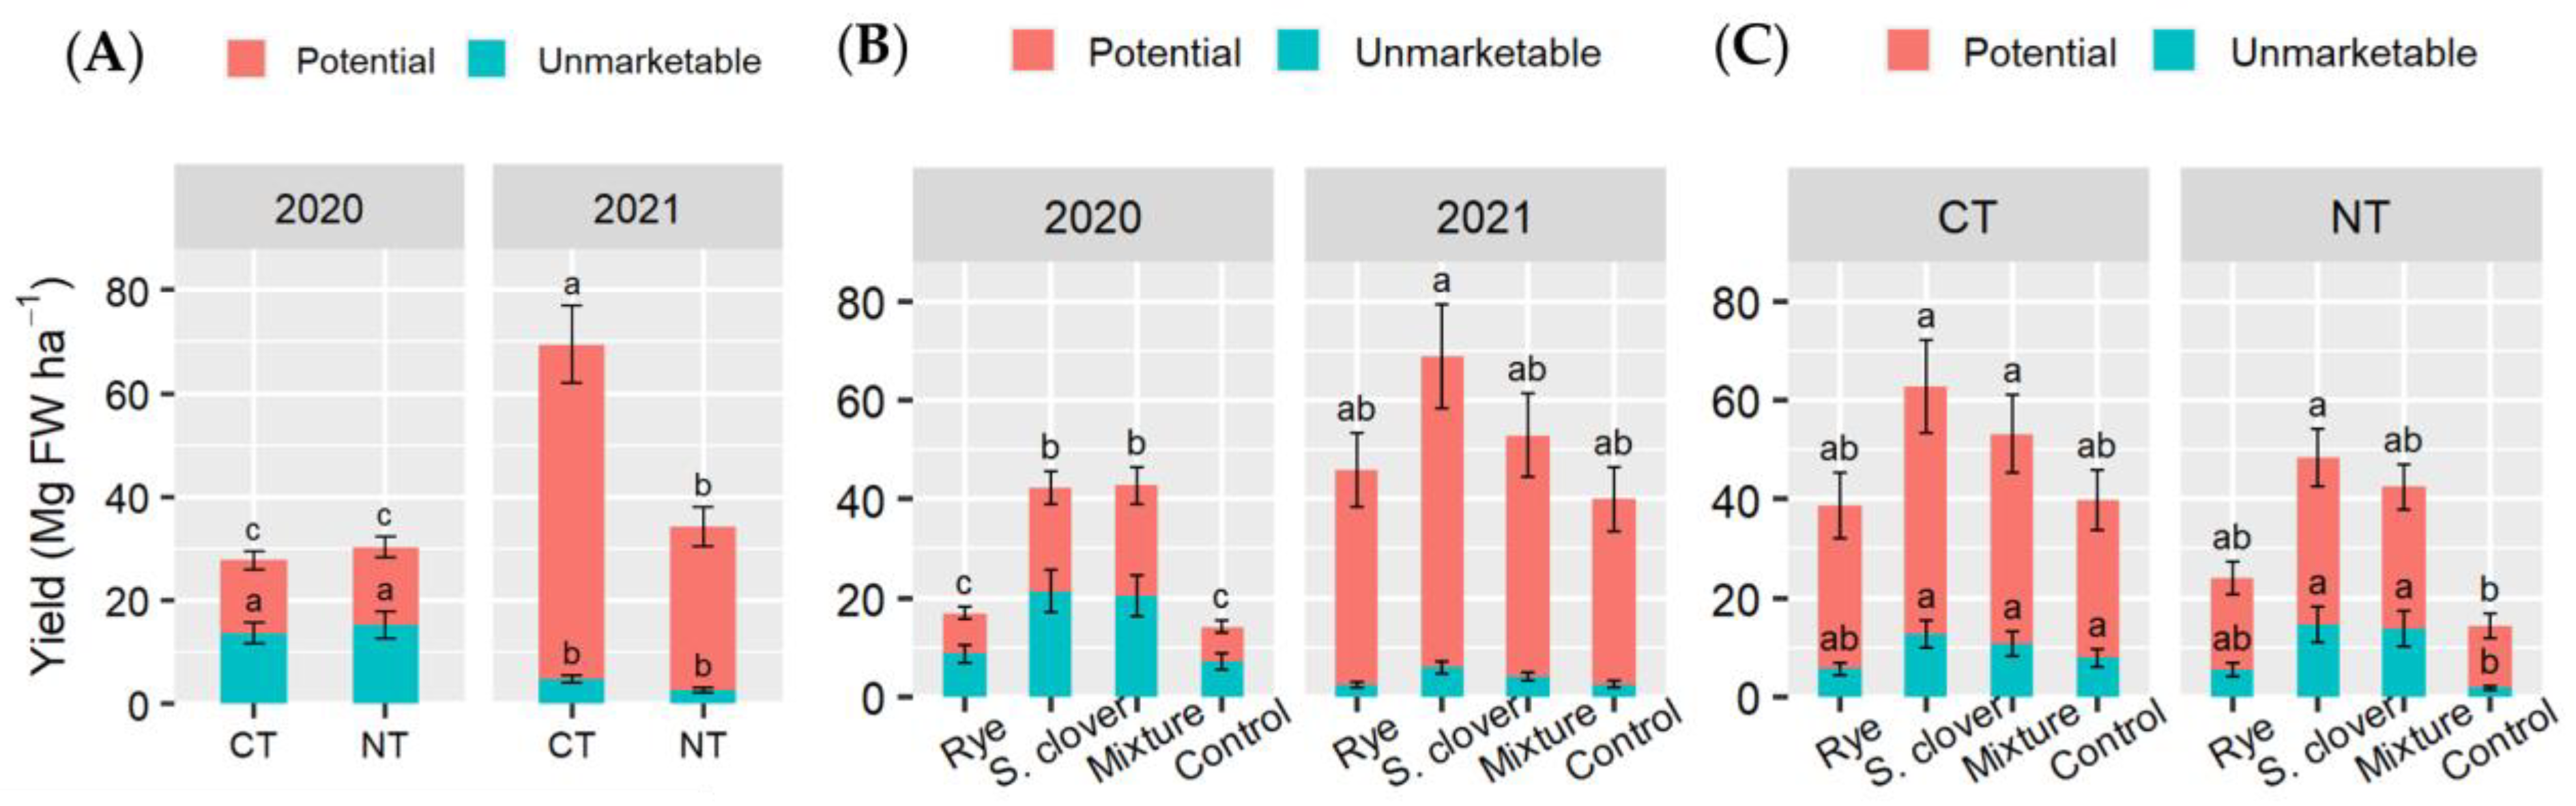
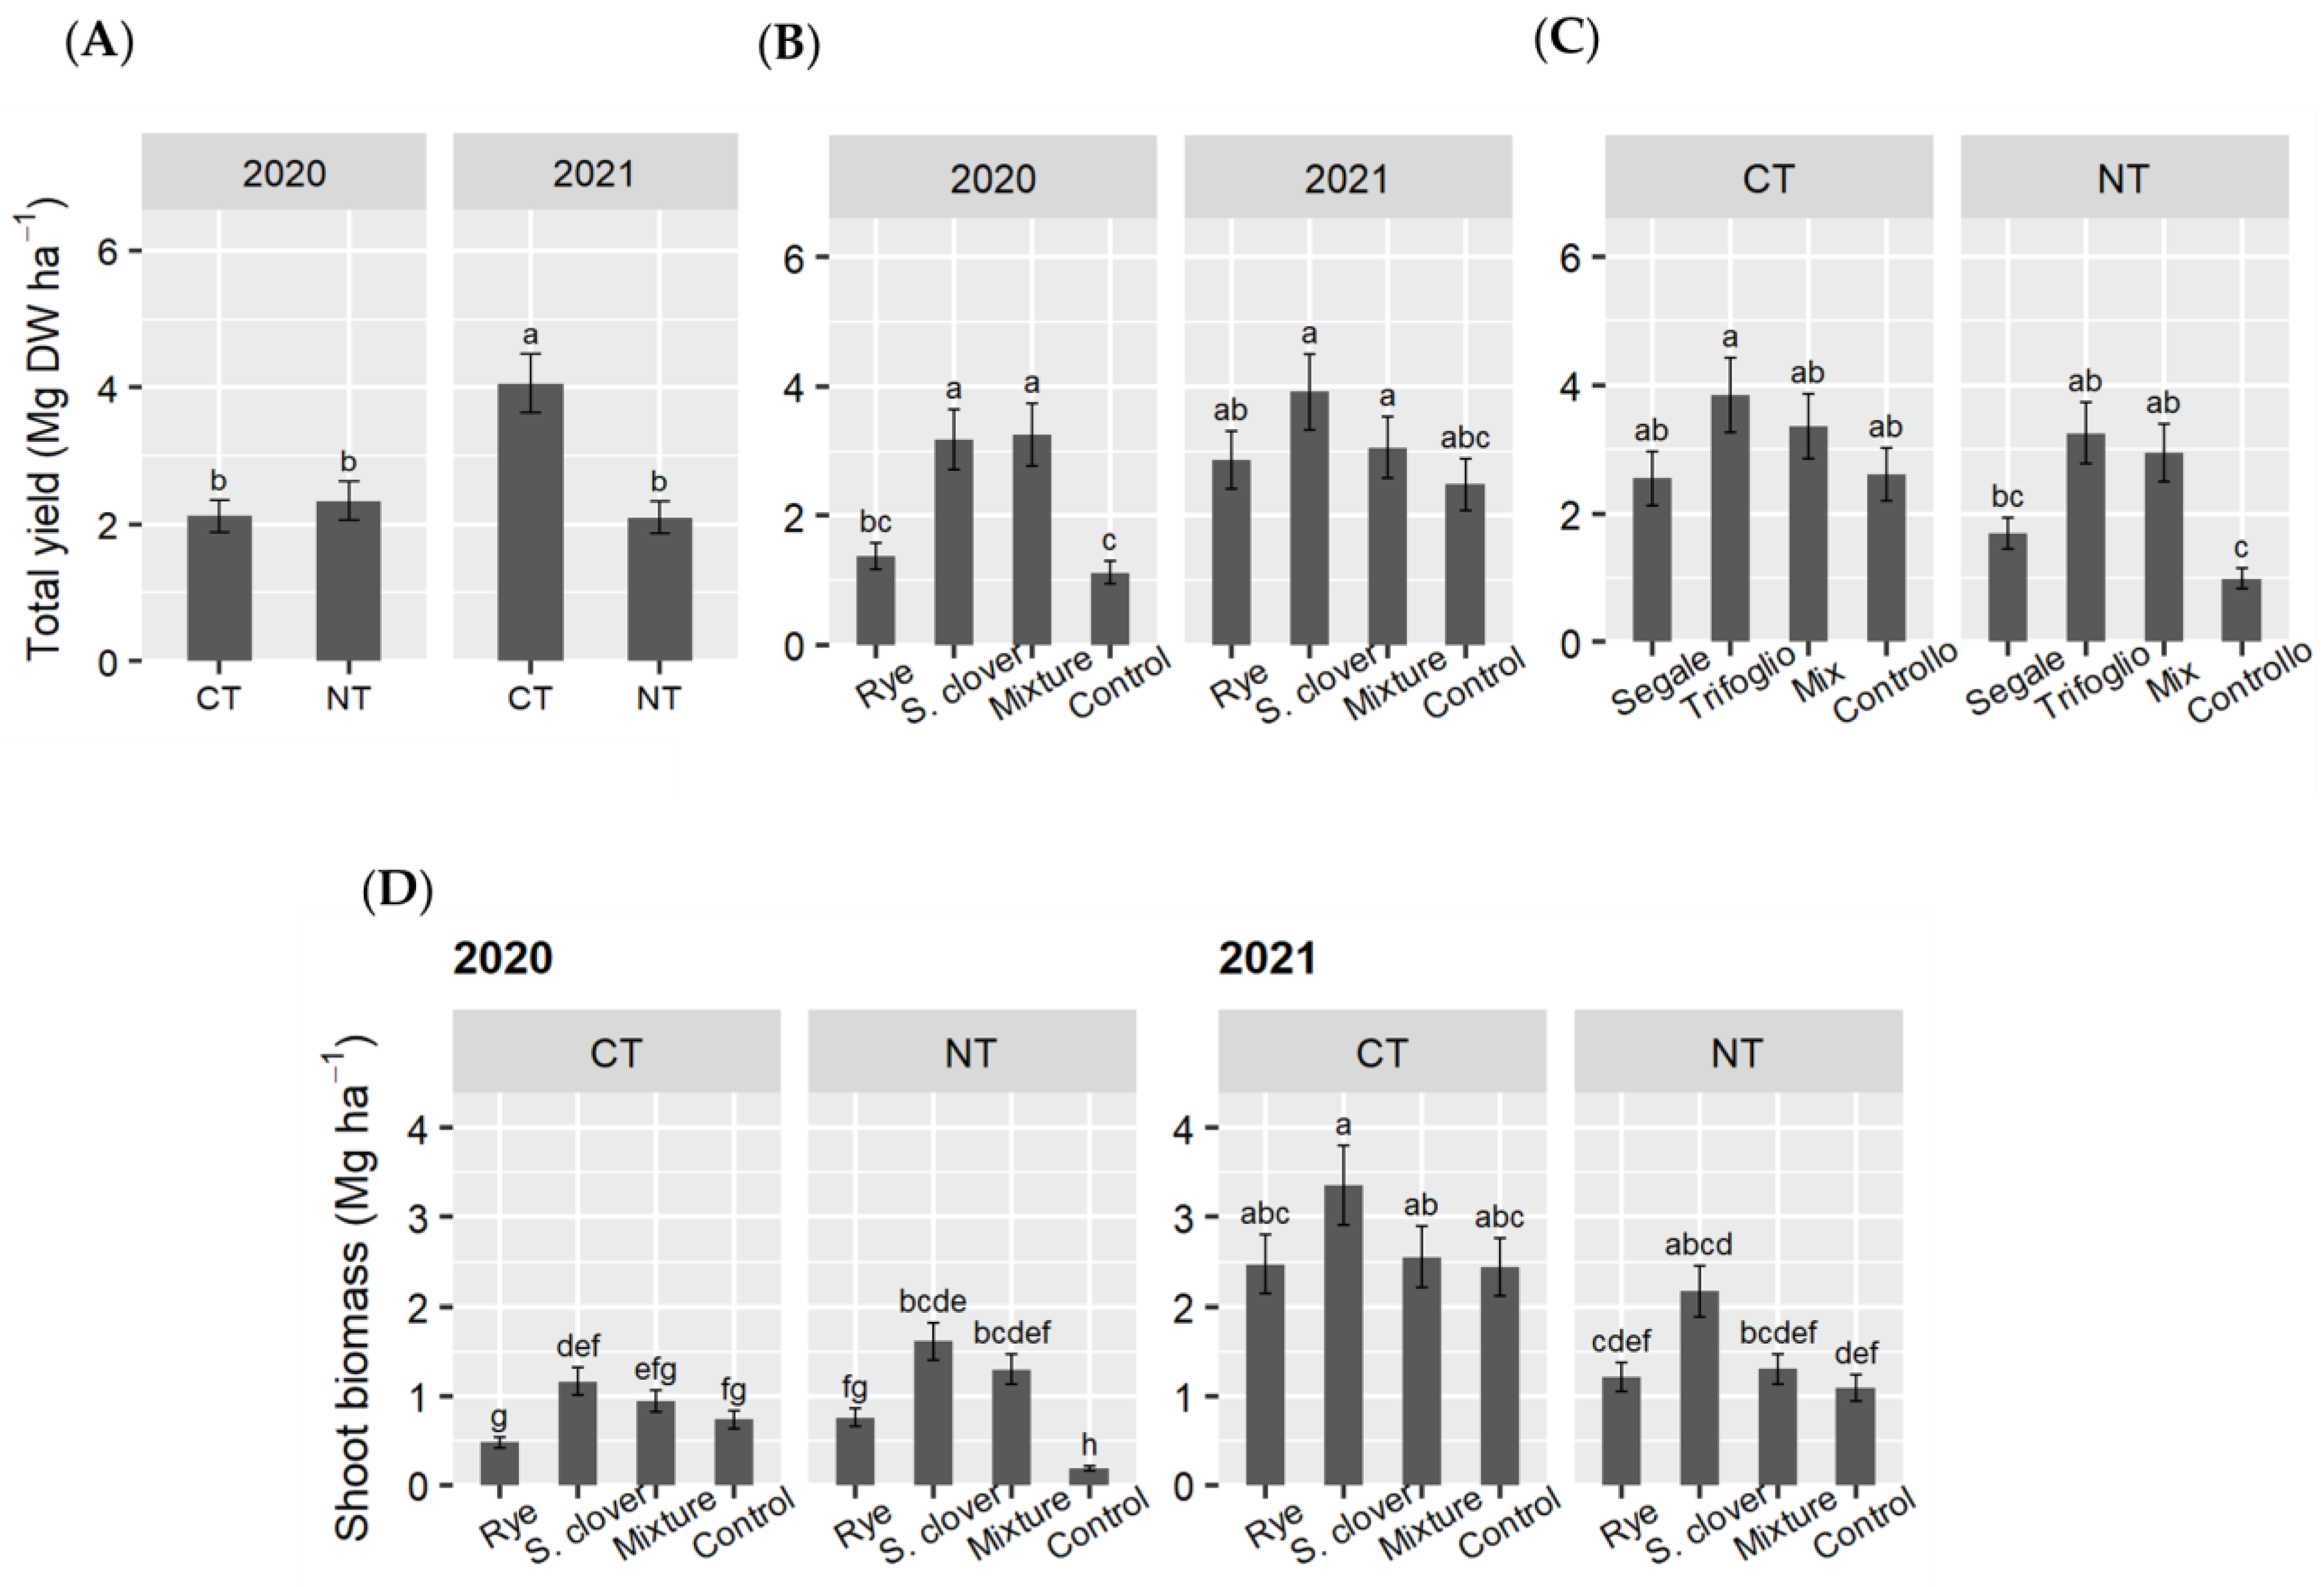
3.3. Tomato Fresh Yield and Aboveground Dry Biomass

Significant interactions between tillage and year, cover crop and year, and cover crop and tillage were found for tomato unmarketable, potential, and total fresh yields (Table S3 in the Supplementary Material, Figure 7A–C).
Concerning the interaction between tillage system and year (Figure 7A), a significant increase in the potential yield and a decrease in the unmarketable yield were observed for both CT and NT in 2021. However, differences between tillage systems for potential fresh yield were only observed in 2021 (Figure 7A). In 2021, the total fresh yield was 2.5 times greater than that in 2020. Compared to NT, double the total fresh yield was found in CT (69.73 vs. 34.46 t ha−1). Averaged over tillage systems, the interaction between cover crop and year was significant only for the potential yield and the total yield, showing clover and mixture producing around 2.7 times more of potential and total yield than rye and control in 2020 while being statistically like them in 2021 (Figure 7B). A significant interaction between cover crop and tillage system (Figure 7C) did not reveal statistically supported differences between cover crops despite the higher values in squarrose clover and mixture treatments in both tillage systems. In contrast, clover and mixture significantly incremented NT’s potential and unmarketable yields by almost 68% and 150%, averaged over both cover crops, compared to rye and control. respectively (Figure 7C). Differences between treatments were not statistically significant for the total fresh yield as well, despite a tendency for squarrose clover and mixture in CT and NT to have higher yields relative to all other treatments.
Differences in fresh yields were consistent with the trend demonstrated by the number of fruits produced per area (Tables S3 and S4 and Figure S1A,B in the Supplementary Material). For dry matter content in tomato fruits, we found it was 30% higher in the first year (7.91 vs. 6.09 g 100 g−1) (Table S4). Averaged over tillage systems and years, fruit dry matter content was lower in clover and mixture treatments than the control (Table S4). Considering the interaction between years, tillage systems and cover crops, the dry matter content of fruits did not reveal differences among the three cover crops in either tillage system but only with control (Tables S3 and S4 in the Supplementary Material) and tended to be slightly higher in NT (confirmed for squarrose clover in 2021 with 6.16 vs. 5.49 g 100 g−1).
Tomato total dry yield at harvest followed the same trend as fresh tomato yields each year (Figure 8A–C). Tomato shoot plant biomass was influenced by the interaction of cover crop, tillage, and year and confirmed the trend observed in yield results. As represented in Figure 8D, squarrose clover monoculture and the mixture (though the latter was statistically like rye) stimulated tomato shoot biomass in CT and NT in 2020. Despite the same tendency, no differences between cover crops were found in 2021 in both tillage systems. Although there was a tendency for higher shoot biomass in all cover crops in CT relative to NT in 2021, no statistically significant differences were reported (Figure 8 D). As with the yield, shoot biomass was greater in CT in 2021 compared to that in 2020.

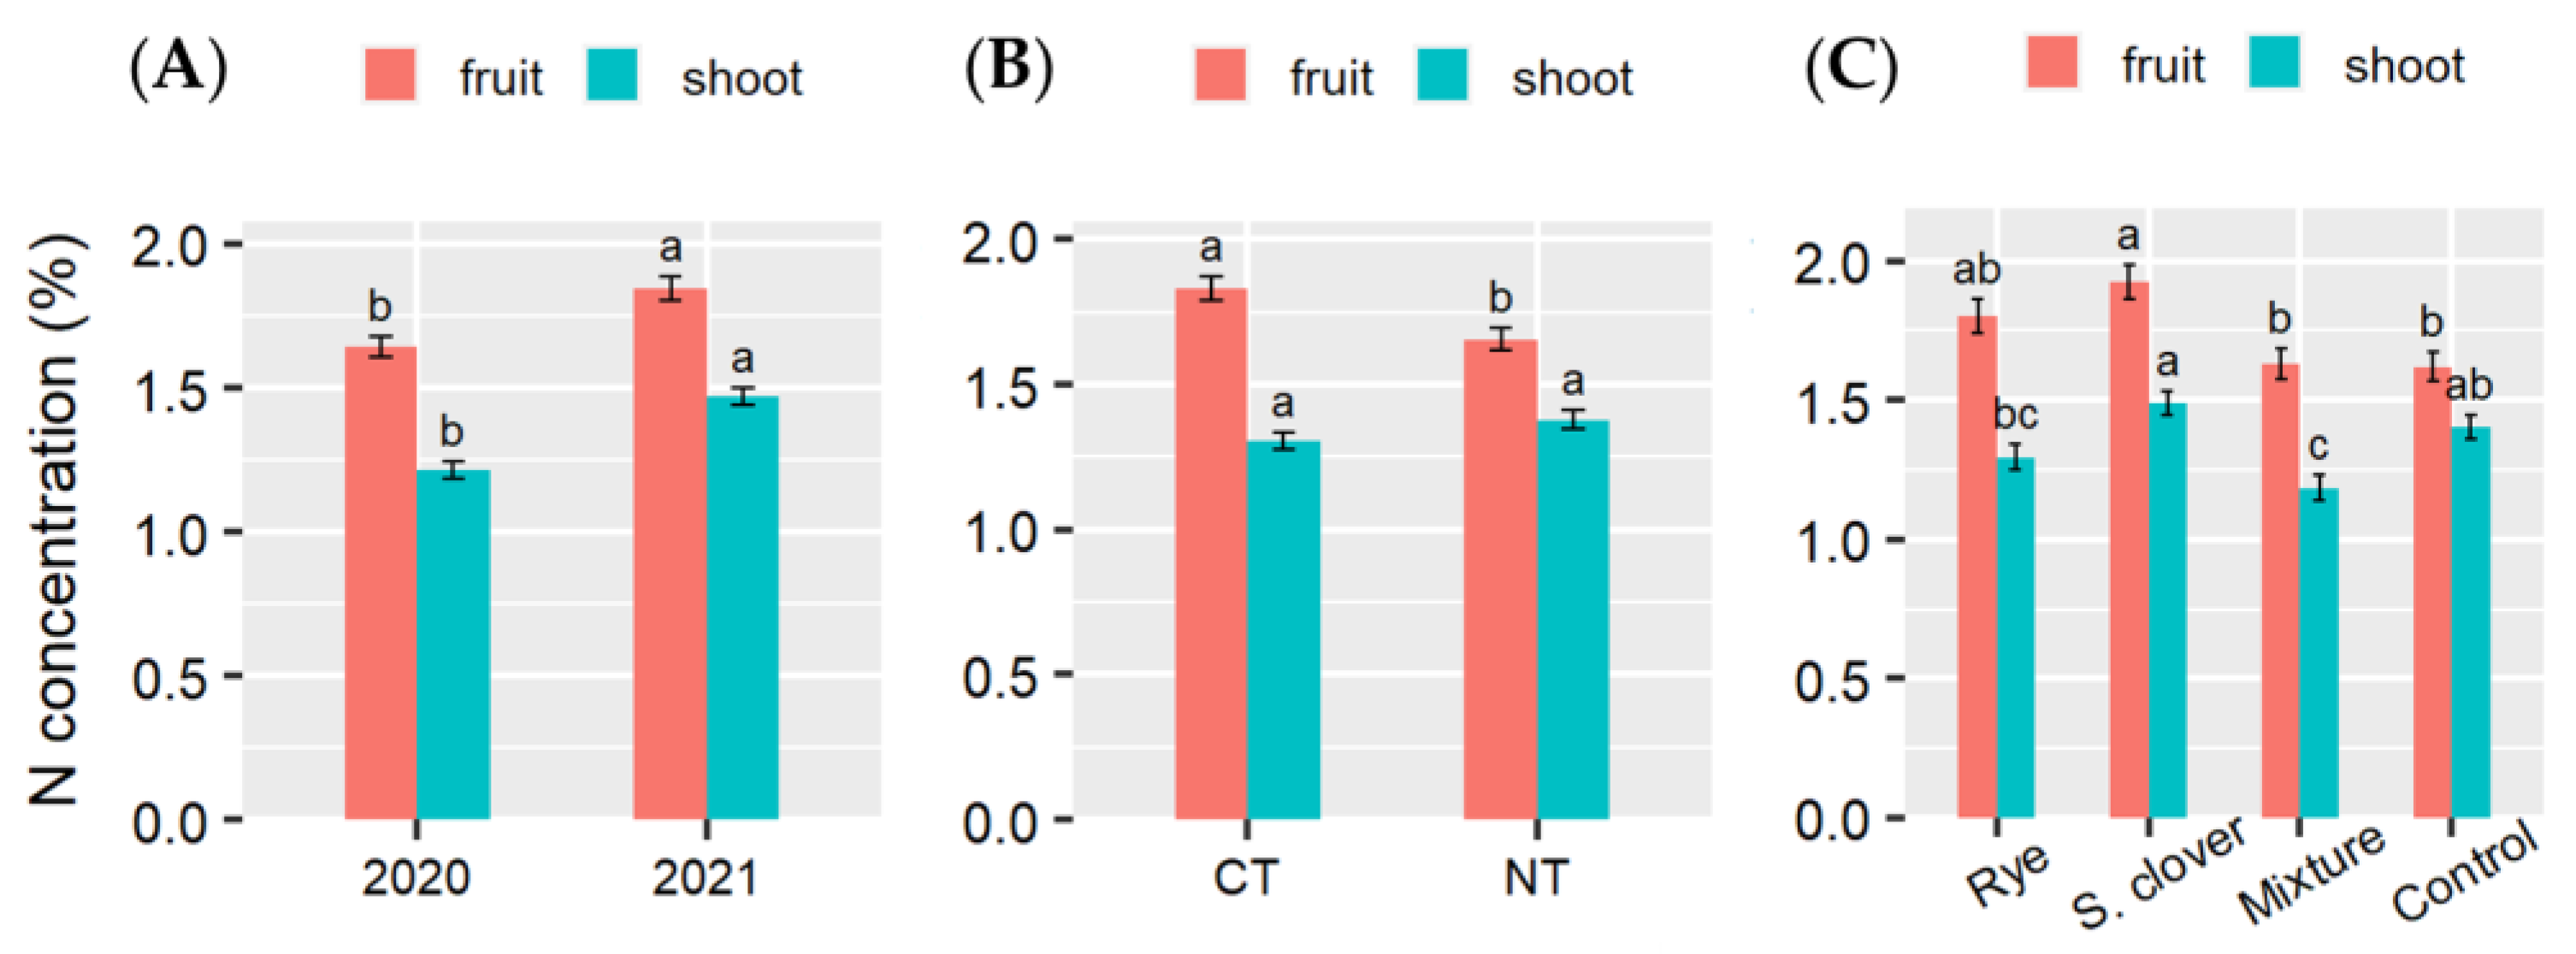
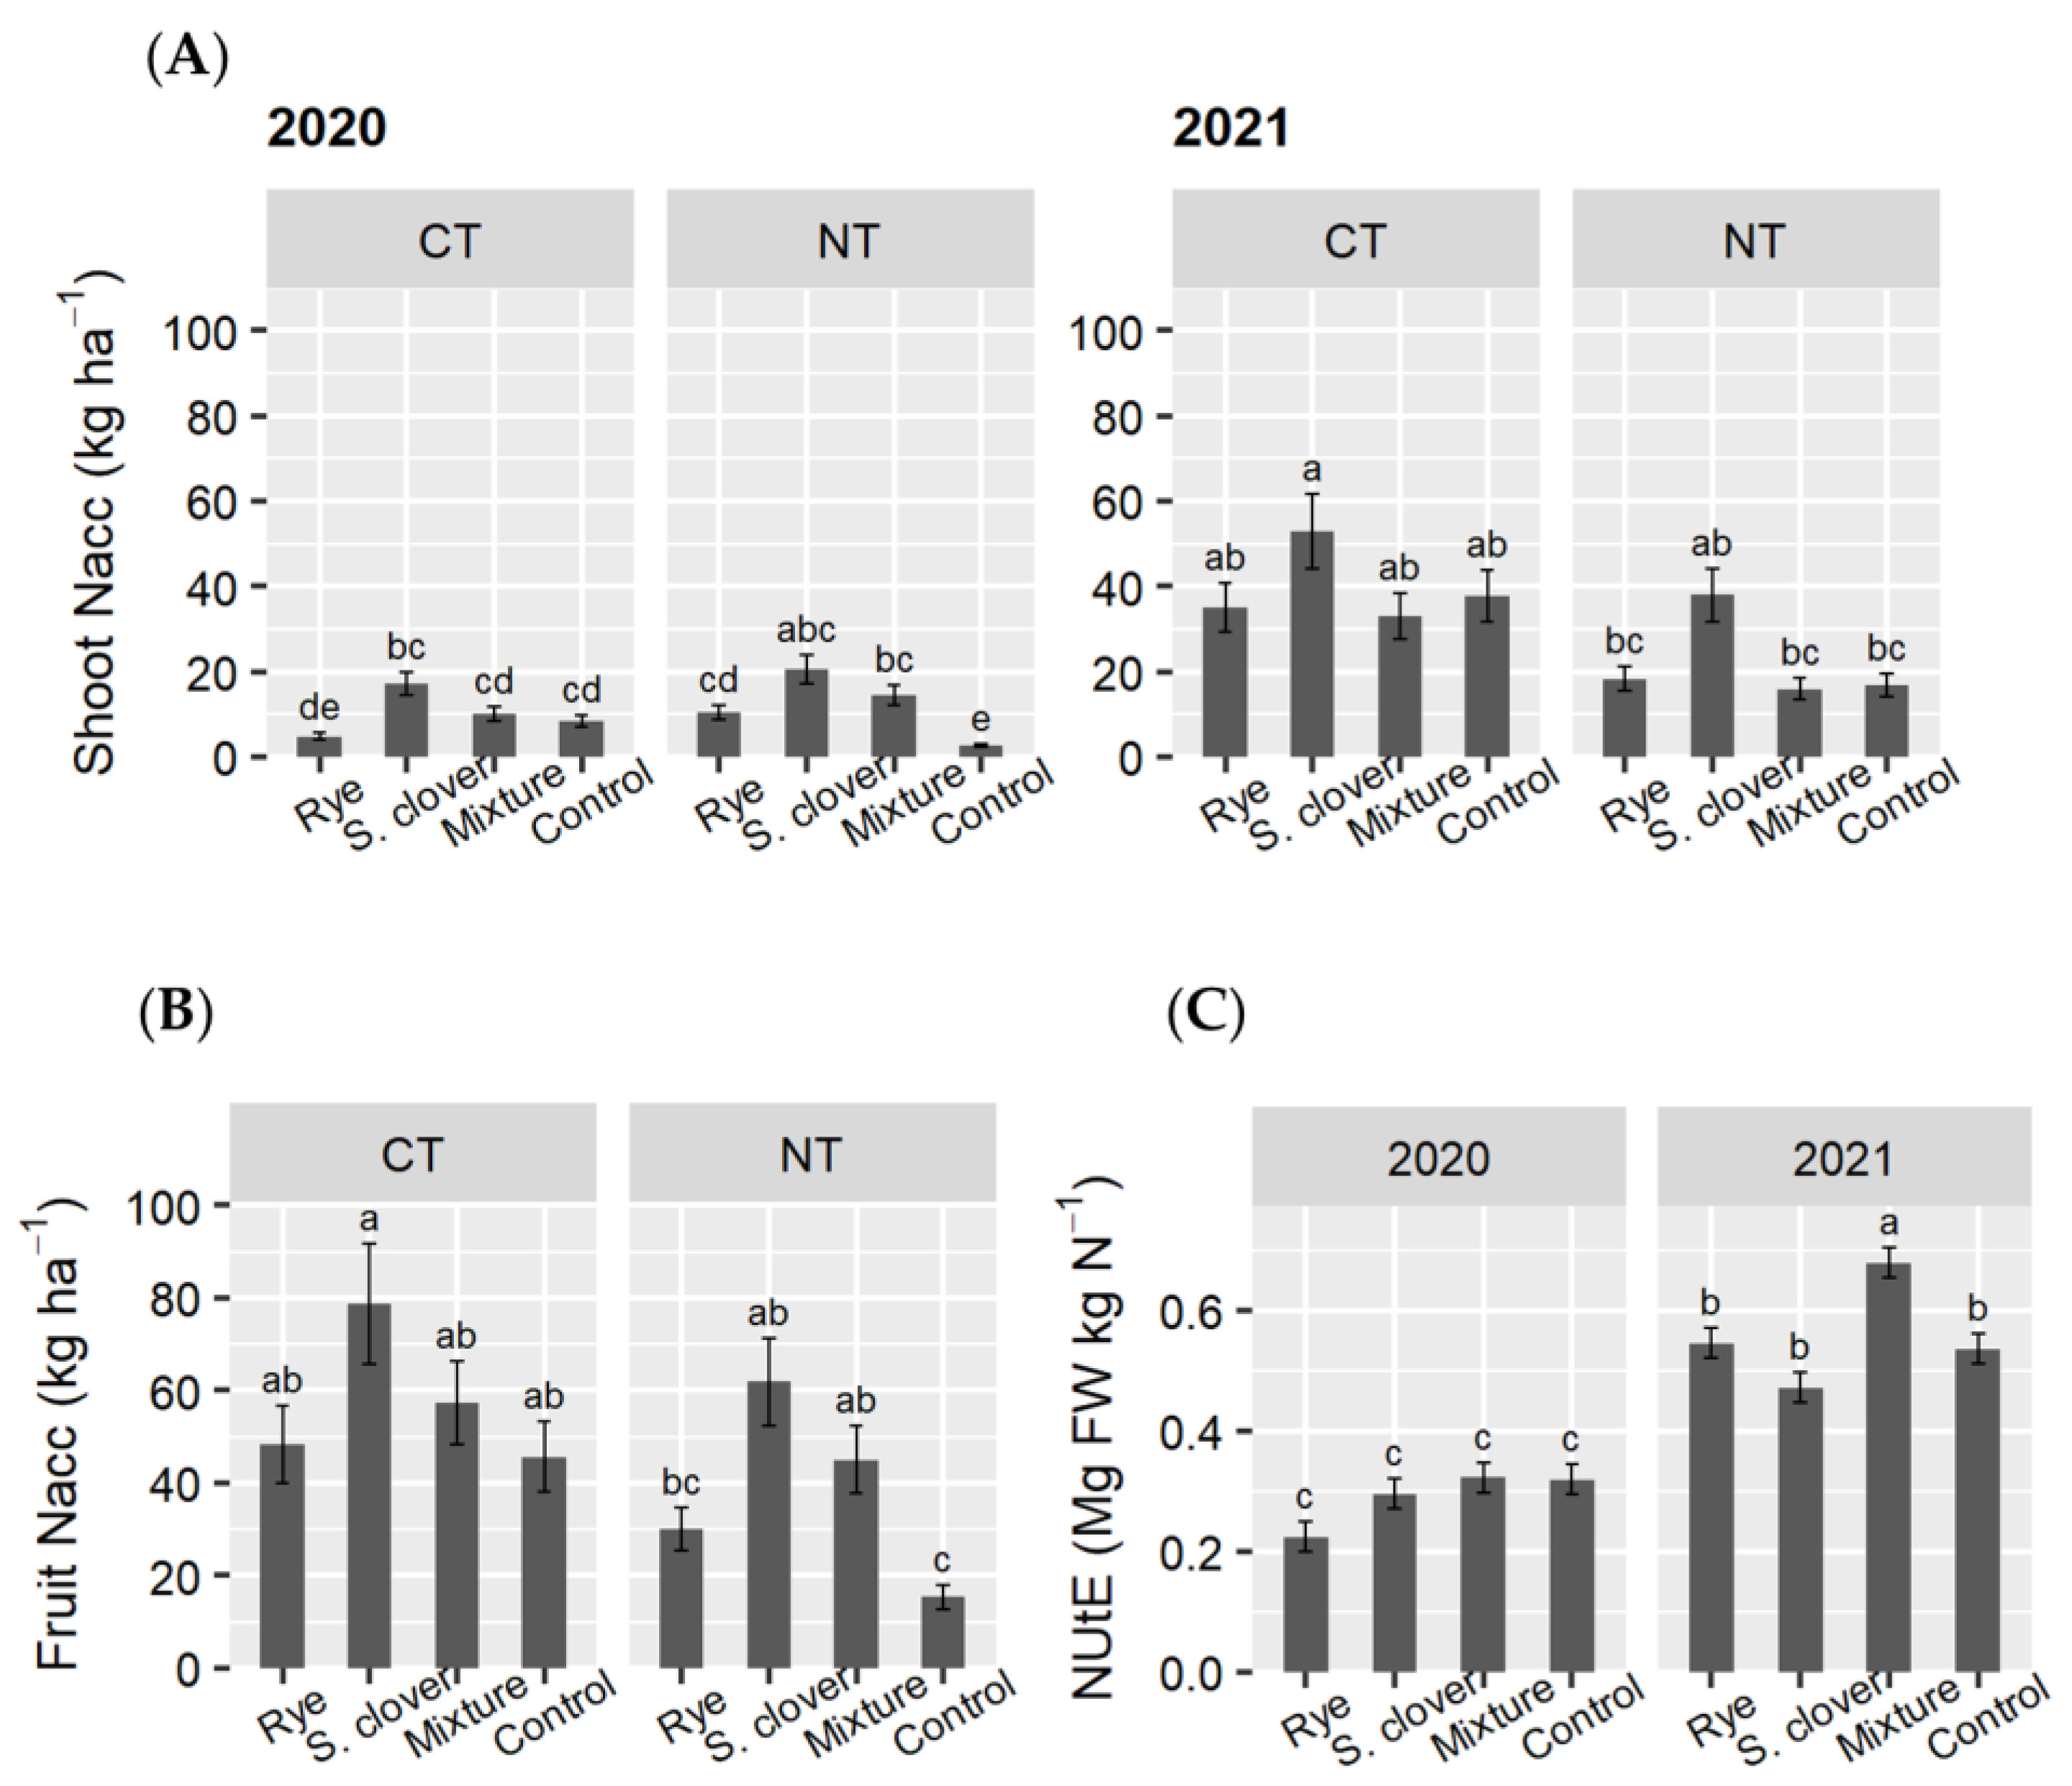
3.4. N and P Concentration and Accumulation in Tomato Shoots and Fruits

The significance of factors and their interaction effects on N and P concentrations and accumulations in tomato biomass components are presented in Table S3 in the Supplementary Material. Nconc in fruits was generally greater than that in shoots (Figure 9A–C). Tillage had an insignificant impact on Nconc in plant tissues but a significant effect on Nconc in fruits (Figure 9A). Under NT, tomato fruits had almost 9.2% lower N contents. Cover crop species changed Nconc in shoots, with those under squarrose clover monoculture having around 15.5 and 26.3% more compared to those under rye monoculture and mixture respectively, as represented in Figure 9B. At the same time, the interaction between cover crops and years on Nconc in fruits revealed the effects of cover crops only in 2021, with clover also increasing fruit N content (2.23 g N 100 g−1) relative to all other cover crop treatments which appeared to behave similarly (1.84 g N 100 g−1 in rye, 1.73 g N 100 g−1 in control and 1.58 g N 100 g−1 in mixture). Nconc in fruits was generally higher in 2021, as Nconc in shoots (Figure 9C), but it was most evident only in clover (+37.6%).
Like N content and tomato yields, N accumulations (Nacc) in shoots and fruits were higher in the second year due mainly to a considerable increase in those of CT treatments. The interaction of cover crop, tillage system and year influenced Nacc in tomato shoots while that of tillage system and year, cover crop and year, and cover crop and tillage influenced that in fruits (Table S3 in the Supplementary Material). Changes in tomato yields mainly drove changes in N accumulation in the plant’s organs. Squarrose clover stimulated shoot Nacc under both tillage systems compared to control (a significant difference was noticed within NT in 2020) and the other cover crops, mainly rye (significantly only under CT in 2020) (Figure 10A). Within the years, differences between tillage systems were not statistically detected for any of the cover crop treatments essayed, but for the control in 2020. Nevertheless, Nacc in shoot biomass seemed to be higher in CT than NT in 2021, and in 2021 than 2020 in CT as with yields. The amount of N accumulated in tomato fruits tended to be the highest following the monoculture of squarrose clover with 70.30 kg ha−1 averaged over both years and tillage systems, and the lowest in the rye and control with a total of 39.17 and 30.54 kg ha−1, respectively (Figure 10B). Nacc in fruits was remarkably reduced in NT (−50%) only in 2021 (37.46 vs. 37.11 kg ha−1 for CT and NT, respectively, in 2020 and 77.69 vs. 39.01 kg ha−1 for CT and NT, respectively, in 2021). Differences were due to the increase in Nacc in shoots and fruits in CT in general in 2021 compared to 2020. On average, tomato plants accumulated 114.6 kg ha−1 under CT and only 55.1 kg ha−1 under NT in 2021, while 40.4 kg ha−1 of N was absorbed on average in 2020 for both NT and CT.
Cover crops affected the Nitrogen utilization efficiency (NUtE) only in 2021 with the mixture enhancing the NUtE compared to the monocultures of clover (+43.9%) and rye (+24.2%). The NUtE was lower in 2020 for all treatments, averaging around 0.29 compared to 0.56 Mg of fresh yield kg−1 N in 2021.
Statistical analysis outcomes regarding P concentration and accumulation are presented in Table S3 in the Supplementary Material. Tillage and cover crops modified P concentration in tomato shoots as well. Contrary to Nconc, Pconc in shoots was improved by 30% under NT (0.18 vs. 0.24 g P 100 g−1) (Table S4). Regardless of tillage and year, shoot Pconc was the least in squarrose clover (0.16 vs. 0.23 g P 100 g−1 in the control in 2020 and 0.15 vs. 0.25 g P 100 g−1 in the mixture in 2021) (Table S4). Pconc in fruits seemed indifferent to cover crops and the tillage system adopted but decreased in 2021 (−38.8%) (Table S4). Despite the higher Pconc in tomato shoots under NT, Pacc in shoots and fruits response to tillage was variable with the year and depended mainly on the dry aboveground biomass production: in 2020, plants under NT had higher Pacc in shoots, while in 2021 the contrary was true for fruits too (Figure S2 in the Supplementary Material). Cover crops behaved almost similarly for Pacc in fruits and shoots, and only under NT were they better than the control (Figure S2 in the Supplementary Material). Tomato plants accumulated in fruits between 12.49 and 7.63 kg P ha−1 in CT and 11.29 and 3.12 in NT, whereas the uptake in shoots varied between 3.29 and 2.92 in CT and 3.39 and 1.68 in NT.

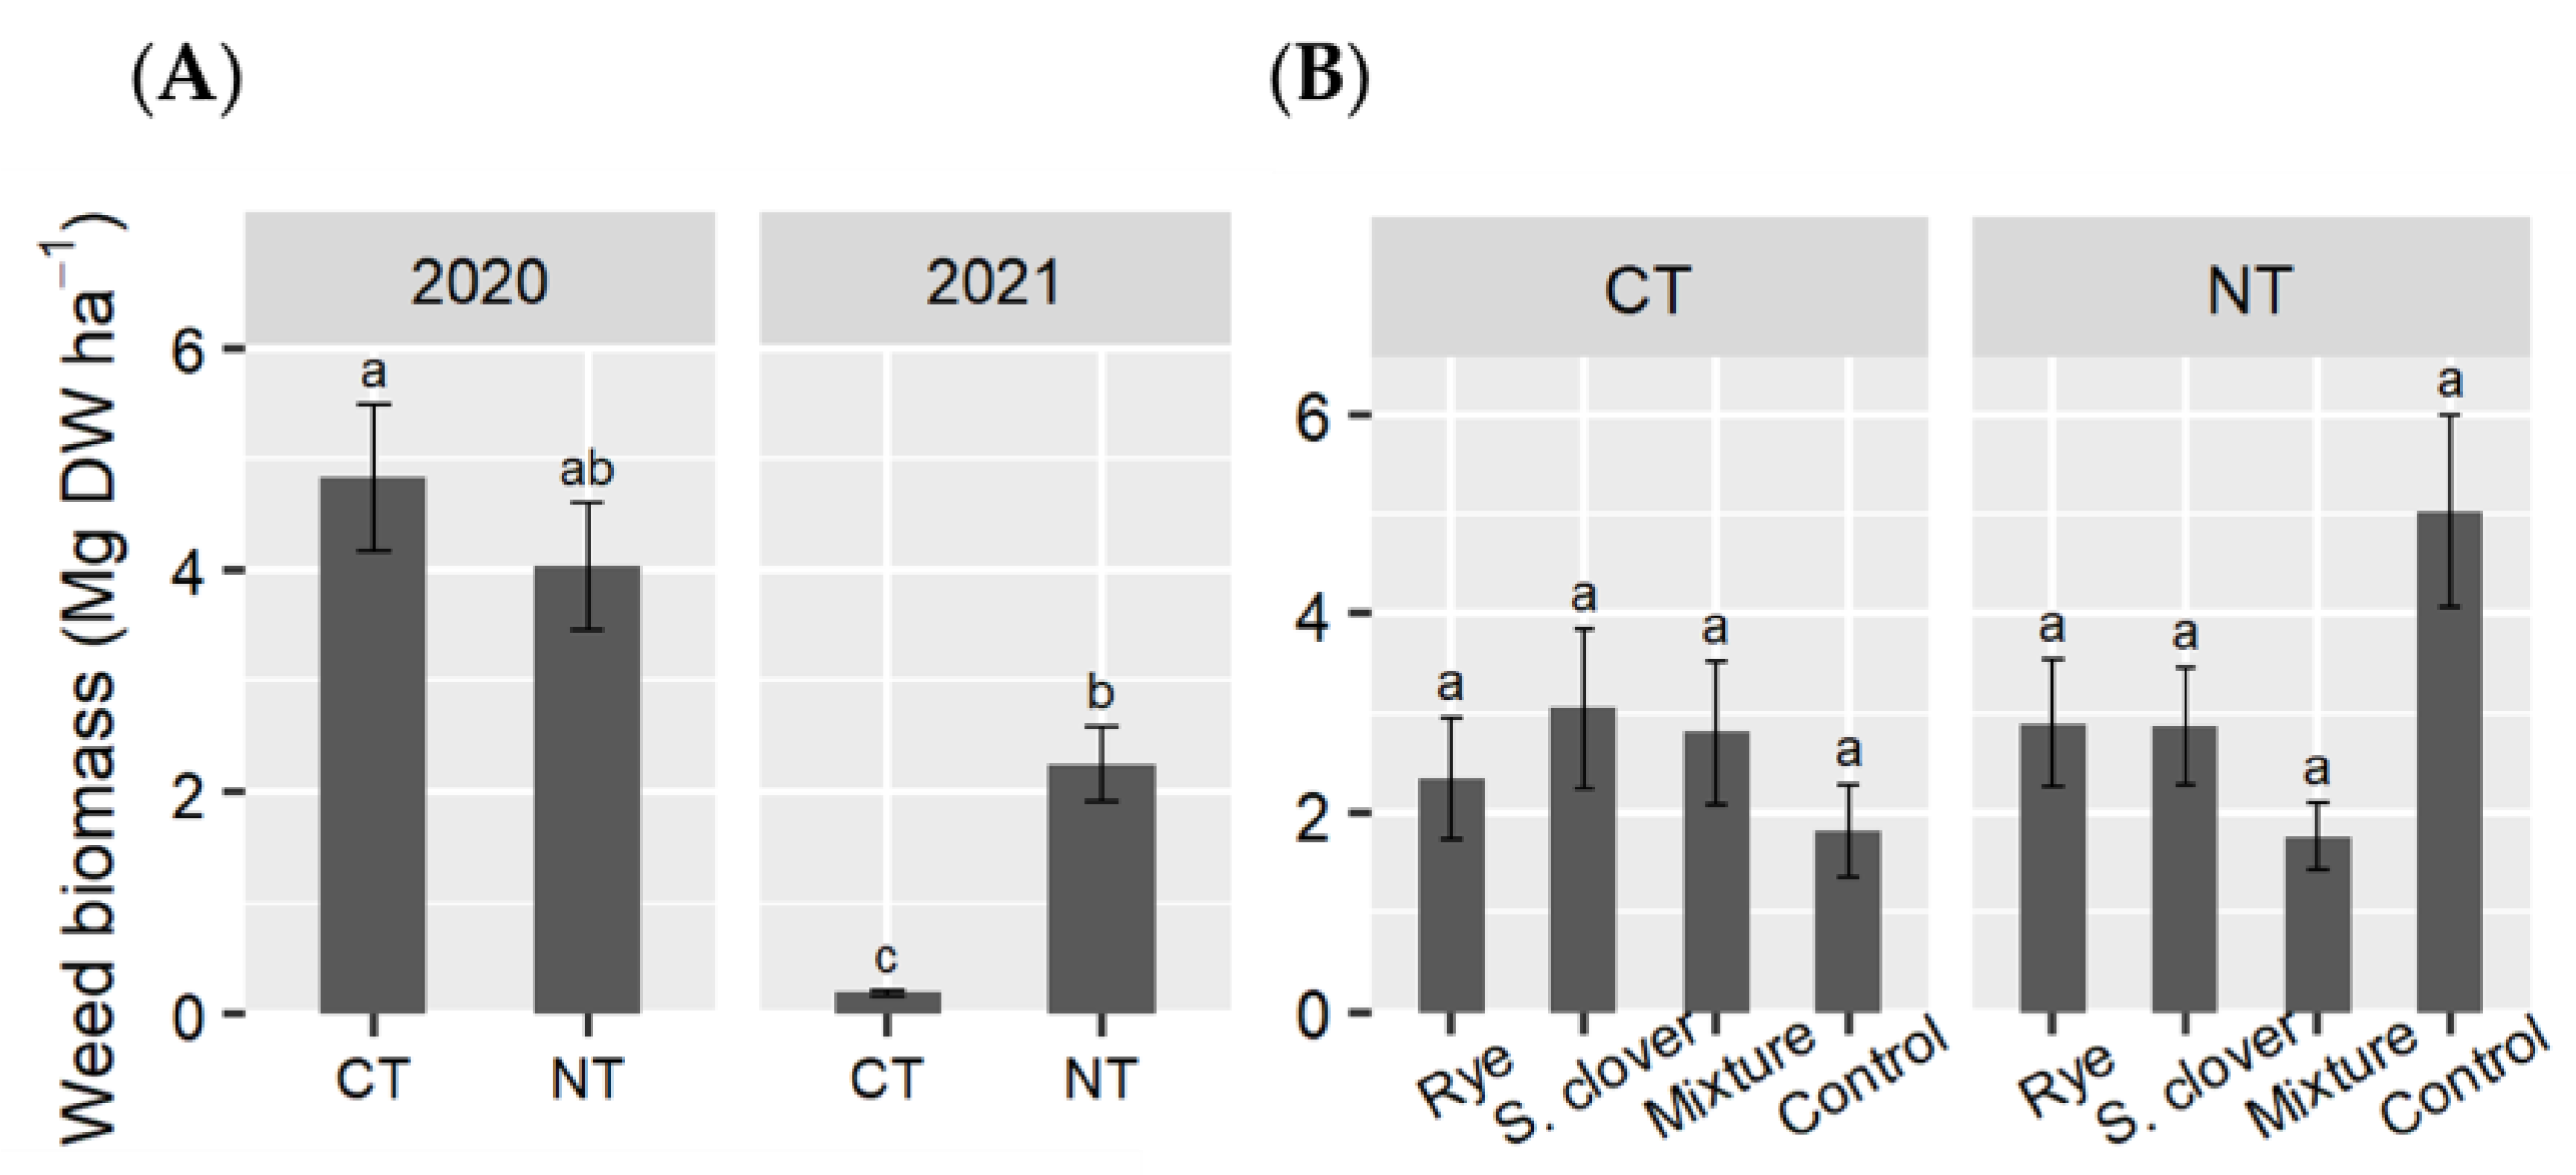
3.5. Weed Biomass at Tomato Harvest

The response of weed biomass at harvest was influenced by the interaction of the tillage system and year, and cover crop and tillage system, as reported in Table S3 in the Supplementary Material. Weed infestation in CT, averaged over the cover crops, was around 25 times greater in the first year than in the second year, whereas it seemed similar between NT over the years (Figure 11A). The effect of the tillage system on weed biomass was observed only in 2021 with a consistent decrease of almost 92% relative to CT (Figure 11A). Despite the significant effect obtained by the generalized linear model for the interaction between cover crop and the tillage system, the post hoc test returned no significant differences between treatments (Figure 11B). However, it seems that when averaged over the years, the weed-suppressing effect of cover crops tended to be more significant in NT, with the mixture probably reducing weed biomass compared to the control (−65%) (Figure 11B).

4. Discussion

4.1. Cover Crops Performance at Termination Time: Aboveground Dry Biomass, Nutrient Accumulation, and Weed Control

Pure stands of rye, squarrose clover, and their mixture produced a large quantity of residue, with rye and the mixture outperforming the clover monoculture. Over two years, squarrose clover has grown around 6.1 t ha−1 of dry matter, significantly higher than in a recent study [5]. Early sowing, i.e., October–November, and late termination dates, i.e., end of May, besides good climatic factors, i.e., at least 595 mm of precipitations, have favored squarrose clover growth and ensured well-performing stands. In addition, all three cover crops have produced stable amounts of biomass yields and almost equivalent N yields across the two years of the experiment, despite differences in temperatures and precipitation distribution between the years. Even though it yielded the same quantity of residues as the most performing monoculture, i.e., rye, we found that the mixture slightly enhanced biomass production relative to the pure stands. The same might be deducted by a LER value superior to 1 (1.10 with a confidence interval between 1.02 and 1.19). Like our findings, mixture “over-yielding” was repeatedly reported when greater biomass was produced than the average monoculture yields [30,31]. On the other hand, “transgressive over-yielding” has been documented when the mixture produced more biomass than the best-performing monoculture [22,32]. The overyielding observed might suggest that squarrose clover–rye mixtures have benefited from positive interspecific or/and lower intraspecific interactions. In our case, the rye component might have accounted for the overyielding of the mix, as it produced more than what ideally could be expected under a half seed rate.
The reasons for the beneficial interspecific interactions in mixtures include facilitation processes resulting from complementarity or selection effects at play according to resource availability [20,32,33]. As Mason et al. [31] described, complementarity effects can occur through the efficient utilization of resources (water, Nitrogen, and light) caused by niche partitioning. In combinations of grasses and forbs, the complementary use of resources was found to increase when resources are limited, while the proportion of biomass gained through the dominance of the high-yielding monoculture increases with resource availability [34]. As a legume, the squarrose clover can fix atmospheric Nitrogen through biological fixation and have a deeper root system than rye which might have allowed rye to access more amounts of N. Moreover, rye is an aggressive N scavenger [23]. Reducing the proportion of rye in the cover crop might have reduced intraspecific competition and increased rye biomass in the mixture, where it accounted for an average of 64% of total biomass.
As expected, N accumulation was the highest in squarrose clover among cover crops, while the mixture was intermediate between rye and clover. Biomass overyielding could be potentially the most significant contributor to the accumulation of N in the mixture, though insufficient to obtain equivalent amounts to squarrose clover [9].
Compared with the control, all three cover crops consistently reduced weed biomass during the fallow period as measured at termination time, with rye outperforming the squarrose clover monoculture. Rye’s ability to control weeds has been well established. Rye was reported to provide at least 80% weed control in terms of weed density and occasionally even biomass, primarily of annual weeds, compared to no-cover crops [13,22]. Yet, in our study, the weed suppression of the mixture matched that of pure rye, the most suppressive cover crop. These results are congruent with those of Smith et al. [35], who found no differences between rye and other multispecies mixtures of cover crops in weed suppression despite non-transgressive overyielding. Indeed, including aggressive species such as rye, even at a low rate, such as 20%, in mixtures, can ensure a high level of weed suppression [22,36]. Cover crop weed suppression depends on several mechanisms of which mainly resource preemption and competition are often indicated by cover crop biomass [36,37,38], soil coverage [39], and/or allelopathy [40]. Instead of the overall biomass it generates, rye has repeatedly been demonstrated to inhibit weeds owing to its comparatively rapid growth, soil covering, N scavenging, and, notoriously, its allelopathic capacity [36,41,42]. Despite some allelopathic effects [43] and the power to smother weeds [18,44], squarrose clover is a slow-growing legume that, by improving N availability in the soil, allows for substantial weed establishment during the season [36,37].

4.2. Effects of Cover Crops and Tillage System on Tomato Plant Growth, Crop Productivity, Nutrient Accumulation, and Residual Weed Abundance

Crop performance was primarily influenced by the interaction of tillage and cover crop and by the general interaction of the single factors with the year. Tomato yields were higher in 2021 because of the interannual variability in weather, particularly the drier summer, the lower pest incidence, and the effectiveness of phytosanitary interventions once pests have emerged.
Cover crops are expected to affect the succeeding cash crop yield positively. Indeed, the least productive tomato systems were those without a cover crop or with rye monoculture, mainly in 2020, as shown by the interaction of cover crop and year. These results were found in both tillage systems despite not being statistically well verified (possibly because of year and field variability). As SPAD readings and N concentration in tomato shoots and fruits have revealed, tomato plants under rye, especially in 2020, and with no-till in general, might have suffered N stress during the season. Low N availability, for which fertilization did not compensate, likely contributed to the reduced growth and yield of tomatoes grown on rye. Dense rye residues, as a cereal with low N concentration and high residue C/N, might have caused a temporary shortage of available Nitrogen through N immobilization, besides releasing allelopathic compounds. For the same reasons, some experiments have documented a decline in vegetable performance with rye residues relative to other or no-cover crops [12,13].
In contrast, squarrose clover might have released N before and after termination, which met some of the nutrient requirements of tomato plants [26,45]. Through the N released, the clover might have also alleviated the weed-crop competition by providing an advantage to tomato plants before weed establishment [46]. These factors were previously behind the enhanced performance of several vegetables under legume mulches [45,47,48,49]. The effect of the mixture on tomato performance, which was equivalent to that of squarrose clover in 2020, might be due to some N release, lower competition with the weed community, and successful weed control, especially in NT. Increasing the squarrose clover proportion in the mixture may have promoted N release and provided an advantage to the tomato crop in the competition against weeds early in its growth [50]. Besides cover crop species, cover crop aboveground biomass management and weed cultivation may have influenced the residue decomposition rate over the two years. The reduced contact between residue and the soil surface in dead mulches may be responsible for a lower mineralization rate [26], especially in the poor N rye. Interestingly, we found that the no-till system consistently enhanced the P content in tomato shoots, supporting findings from an earlier experiment [6]. Since equivalent plant biomasses were produced between CT and NT in the first year, we argue that one factor responsible for this effect could be the promotion of arbuscular mycorrhizal fungi symbiosis and activity by no-till.
Cover crops and tillage and their interactions with the year affected N and P uptakes driven by tomato biomass and fruit yields. However, despite a lower yield than squarrose clover, the mixture had the highest nitrogen utilization efficiency in 2021. The mixture in that year produced around 678 kg of tomato fresh yield (sum of marketable and green fruits) for each kg of N absorbed from the soil compared to only 322 kg of tomato kg−1 N for pure squarrose clover. This output is comparable to past findings, demonstrating an inverse trend between nitrogen utilization efficiency and yield (somehow lower than the squarrose clover monoculture) and nitrogen-use efficiency and N inputs (here indicated by a probable lower N supply by this cover crop) [45,47].
In-season weed suppression might have been provided during tomato growth, especially at earlier stages (i.e., soon after cover crop residue management). However, its magnitude may be affected by residue management and, more generally, the tillage system. Our results revealed only a tendency (not supported statistically) for all three cover crops, especially for the mixture, to reduce weed biomass under the no-till system. This effect could be ascribed to the physical barrier that cover crops provide, thereby modifying the environmental conditions under the residue necessary for weed emergence and establishment, i.e., blocking light and lowering daily temperature amplitude. The apparent weed control by the mixture of dead mulch could be due to the enhanced release of bioactive compounds in the soil when rye is mixed with clover, slowing weed emergence and resulting in long-season weed suppression [43].
In contrast to earlier works undertaken under Mediterranean conditions in Italy [51,52], we did not observe a significantly lower weed abundance in no-till systems compared to the conventionally tilled systems; we observed instead the contrary in one year. Weed infestation in NT, despite the cover crop weed suppression, was comparable to CT in 2020 and considerably higher in 2021. For the latter, we might think that the improved soil conditions for weed seed germination and inefficient post-transplanting direct weed control (performed as occasional inter-row threshing) could be the reasons behind the increased weed biomass at the harvest of tomato in NT. For 2020, despite weed cultivation, a large weed infestation during tomato growth in CT treatments might have inflicted a crop performance drop and masked the differences with NT. Data on weed population compositions among years and treatment combinations might help unravel other ecological mechanisms behind these different behaviors of weed biomass.

5. Conclusions

The three cover crops compared in this study (rye, squarrose clover and their mixture) are attractive winter cover crops for the Mediterranean region, with fast growth, high productivity, and great weed competition. Mixtures might even benefit from overyielding, generating almost similar amounts to the highest productive cover crop, i.e., rye. However, their effects on cash crops under different tillage systems depend widely on the pedo-climatic and field conditions in which they occur. Cover crops were demonstrated to be of a high value, especially to no-till systems. Using the mixture as dead mulch may provide consistent weed biomass reduction under different infestation levels and possibly weed communities. Nevertheless, the effect of the mixture on tomato performance was variable with the site/year in our study. Squarrose clover, through its Nitrogen fixing capacity, compensated for its lower weed control ability as dead mulch, which ensured the best crop performance even under high weed infestation conditions. A legume also seems a guarantee in conventionally tilled systems under these suboptimal circumstances. Besides the squarrose clover monoculture, a mixture with increased legume proportion could be a trade-off between weed control (before and after cover crop termination) and N supply to the crop. Future research may concentrate on a deeper understanding of how the studied cover crops and the tillage system affect weed management, including weed abundance dynamics, weed community alterations, and weed functional biodiversity promotion. These insights would help us better understand the results obtained herein and develop fine-tuned cover crops that target long-term weed suppression.

Supplementary Materials

The following supporting information can be downloaded at: https://www.mdpi.com/article/10.3390/agronomy13082027/s1, Table S1: Significance of terms (p-values) from the linear models fitted for the dependent variables evaluated at cover crop termination. Table S2: Significance of terms (p-values) from the linear models fitted for SPAD and tomato plant height at different crop stages. Table S3: Significance of terms (p-values) from the linear models fitted for the dependent variables of tomato performance evaluated after cover crop termination. Table S4: Effects (emmean ± standard error) of tillage system, cover crop and year on tomato fruit number, fruit dry matter content, fruit and shoot P concentration (Pconc) and accumulation (Pacc). Figure S1: Effects of the interaction of cover crop and year (A) and cover crop and tillage system (B) on the number of marketable and green fruits, and unmarketable tomato fruits, respectively. Figure S2: Effects of the interaction of tillage system and year (A), cover crop and year (B) and cover crop and tillage system (C) on P accumulation in tomato shoots and fruits.

Author Contributions

Conceptualization, L.A.C. and D.A.; methodology, D.A.; formal analysis, C.F., M.S. and L.A.C.; investigation, M.S., L.A.C. and L.G.T.; resources, A.P. and M.M.; data curation, L.A.C., M.S., D.A., C.F. and L.G.T.; writing—original draft preparation, L.A.C.; writing—review and editing, D.A., C.F., M.S., L.G.T., M.M. and A.P.; visualization, L.A.C.; supervision, D.A. and C.F.; project administration, A.P.; funding acquisition, A.P. and M.M. All authors have read and agreed to the published version of the manuscript.

Funding

This research was funded by the Italian Ministry of Agricultural, Food and Forestry Policies (MiPAAF) under the project MEORBICO (MEccanizzazione dell’ ORticoltura BIologica e COnservativa), DM 89238, 19 December 2019.

Data Availability Statement

Data are available upon request.

Acknowledgments

The authors acknowledge all the CiRAA staff involved in the field management, sample processing, and lab analysis. In particular, thanks to Alessandro Pannocchia, Giovanni Melai, Marco Della Croce, Roberta Del Sarto, Nadia Ceccanti, Rosenda Landi, Rosalba Risaliti, and Sabrina Ciampa. Warm thanks to Marco Ginanni, who helped design the trial and the water irrigation plant. We also acknowledge the precious support of Fausto Messina, Niccolò Pignotti, and Romans Caetani in field activities.

Conflicts of Interest

The authors declare no conflict of interest. The funders had no role in the design of the study; in the collection, analyses, or interpretation of data; in the writing of the manuscript; or in the decision to publish the results.

References

  1. Palm, C.; Blanco-Canqui, H.; Declerck, F.; Gatere, L.; Grace, P. Conservation Agriculture and Ecosystem Services: An Overview. Agric. Ecosyst. Environ. 2014, 187, 87–105. [Google Scholar] [CrossRef] [Green Version]
  2. Vincent-Caboud, L.; Peigné, J.; Casagrande, M.; Silva, E.M. Overview of Organic Cover Crop-Based No-Tillage Technique in Europe: Farmers’ Practices and Research Challenges. Agronomy 2017, 7, 42. [Google Scholar] [CrossRef] [Green Version]
  3. Blanco-canqui, H.; Shaver, T.M.; Lindquist, J.L.; Shapiro, C.A.; Elmore, R.W.; Francis, C.A.; Hergert, G.W. Cover Crops and Ecosystem Services: Insights from Studies in Temperate Soils. Agron. J. 2015, 107, 2449–2474. [Google Scholar] [CrossRef] [Green Version]
  4. Shackelford, G.E.; Kelsey, R.; Dicks, L.V. Effects of Cover Crops on Multiple Ecosystem Services: Ten Meta-Analyses of Data from Arable Farmland in California and the Mediterranean. Land Use Policy 2019, 88, 104204. [Google Scholar] [CrossRef]
  5. Abou Chehade, L.; Antichi, D.; Martelloni, L.; Frasconi, C.; Sbrana, M.; Mazzoncini, M.; Peruzzi, A. Evaluation of the Agronomic Performance of Organic Processing Tomato as Affected by Different Cover Crop Residues Management. Agronomy 2019, 9, 504. [Google Scholar] [CrossRef] [Green Version]
  6. Antichi, D.; Sbrana, M.; Martelloni, L.; Abou Chehade, L.; Fontanelli, M.; Raffaelli, M.; Mazzoncini, M.; Peruzzi, A.; Frasconi, C. Agronomic Performances of Organic Field Vegetables Managed with Conservation Agriculture Techniques: A Study from Central Italy. Agronomy 2019, 9, 810. [Google Scholar] [CrossRef] [Green Version]
  7. Büchi, L.; Gebhard, C.; Liebisch, F.; Sinaj, S.; Ramseier, H.; Charles, R. Accumulation of Biologically Fixed Nitrogen by Legumes Cultivated as Cover Crops in Switzerland. Plant Soil 2015, 393, 163–175. [Google Scholar] [CrossRef]
  8. Abdalla, M.; Hastings, A.; Cheng, K.; Yue, Q.; Chadwick, D.; Espenberg, M.; Truu, J.; Rees, R.M.; Smith, P. A Critical Review of the Impacts of Cover Crops on Nitrogen Leaching, Net Greenhouse Gas Balance and Crop Productivity. Glob. Chang. Biol. 2019, 25, 2530–2543. [Google Scholar] [CrossRef] [Green Version]
  9. Thapa, R.; Poffenbarger, H.; Tully, K.L.; Ackroyd, V.J.; Kramer, M.; Mirsky, S.B. Biomass Production and Nitrogen Accumulation by Hairy Vetch–Cereal Rye Mixtures: A Meta-Analysis. Agron. J. 2018, 110, 1197–1208. [Google Scholar] [CrossRef] [Green Version]
  10. Mirsky, S.B.; Ryan, M.R.; Teasdale, J.R.; Curran, W.S.; Reberg-Horton, C.S.; Spargo, J.T.; Wells, M.S.; Keene, C.L.; Moyer, J.W. Overcoming Weed Management Challenges in Cover Crop—Based Organic Rotational No-Till Soybean Production in the Eastern United States. Weed Technol. 2013, 27, 193–203. [Google Scholar] [CrossRef]
  11. Wells, M.S.; Smith, A.N.; Grossman, J.M. The Reduction of Plant-Available Nitrogen by Cover Crop Mulches and Subsequent Effects on Soybean Performance and Weed Interference. Agron. J. 2013, 105, 539–545. [Google Scholar] [CrossRef]
  12. Miville, D.; Leroux, G.D. Rolled Winter Rye—Hairy Vetch Cover Crops for Weed Control in No-till Pumpkin. Weed Technol. 2018, 32, 251–259. [Google Scholar] [CrossRef]
  13. Campanelli, G.; Testani, E.; Canali, S.; Ciaccia, C.; Trinchera, A. Effects of Cereals as Agro-Ecological Service Crops and No-till on Organic Melon, Weeds and N Dynamics. Biol. Agric. Hortic. 2019, 35, 275–287. [Google Scholar] [CrossRef]
  14. Vandermeer, J.H. The Ecology of Intercropping; Cambridge University Press: Cambridge, UK, 1989. [Google Scholar]
  15. Tilman, D.; Lehman, C.L.; Thomson, K.T. Plant Diversity and Ecosystem Productivity: Theoretical Considerations. Proc. Natl. Acad. Sci. USA 1997, 94, 1857–1861. [Google Scholar] [CrossRef]
  16. Wortman, S.E.; Francis, C.A.; Bernards, M.L.; Drijber, R.A.; Lindquist, J.L. Optimizing Cover Crop Benefits with Diverse Mixtures and an Alternative Termination Method. Agron. J. 2012, 104, 1425–1435. [Google Scholar] [CrossRef] [Green Version]
  17. Finney, D.M.; White, C.M.; Kaye, J.P. Biomass Production and Carbon/Nitrogen Ratio Influence Ecosystem Services from Cover Crop Mixtures. Agron. J. 2016, 108, 39–52. [Google Scholar] [CrossRef] [Green Version]
  18. Ranaldo, M.; Carlesi, S.; Costanzo, A.; Arberi, P.B. Functional Diversity of Cover Crop Mixtures Enhances Biomass Yield and Weed Suppression in a Mediterranean Agroecosystem. Weed Res. 2019, 60, 96–108. [Google Scholar] [CrossRef]
  19. Elhakeem, A.; Bastiaans, L.; Houben, S.; Couwenberg, T.; Makowski, D.; Werf, W. Van Der Do Cover Crop Mixtures Give Higher and More Stable Yields than Pure Stands ? Field Crop. Res. 2021, 270, 108217. [Google Scholar] [CrossRef]
  20. Reiss, E.R.; Drinkwater, L.E. Promoting Enhanced Ecosystem Services from Cover Crops Using Intra- and Interspecific Diversity. Agric. Ecosyst. Environ. 2022, 323, 107586. [Google Scholar] [CrossRef]
  21. Lawson, A.; Cogger, C.; Bary, A.; Fortuna, A. Influence of Seeding Ratio, Planting Date, and Termination Date on Rye-Hairy Vetch Cover Crop Mixture Performance under Organic Management. PLoS ONE 2015, 10, e0129597. [Google Scholar] [CrossRef]
  22. Hayden, Z.D.; Brainard, D.C.; Henshaw, B.; Ngouajio, M. Winter Annual Weed Suppression in Rye—Vetch Cover Crop Mixtures. Weed Technol. 2012, 26, 818–825. [Google Scholar] [CrossRef]
  23. Hayden, Z.D.; Ngouajio, M.; Brainard, D.C. Rye—Vetch Mixture Proportion Tradeoffs: Cover Crop Productivity, Nitrogen Accumulation, and Weed Suppression. Agron. J. 2014, 106, 467. [Google Scholar] [CrossRef]
  24. White, K.E.; Brennan, E.B.; Cavigelli, M.A.; Smith, R.F. Winter Cover Crops Increased Nitrogen Availability and Efficient Use during Eight Years of Intensive Organic Vegetable Production. PLoS ONE 2022, 17, e0267757. [Google Scholar] [CrossRef] [PubMed]
  25. Fiorini, A.; Remelli, S.; Boselli, R.; Mantovi, P.; Ardenti, F.; Trevisan, M.; Menta, C.; Tabaglio, V. Driving Crop Yield, Soil Organic C Pools, and Soil Biodiversity with Selected Winter Cover Crops under No-Till. Soil Tillage Res. 2022, 217, 105283. [Google Scholar] [CrossRef]
  26. Radicetti, E.; Mancinelli, R.; Moscetti, R.; Campiglia, E. Management of Winter Cover Crop Residues under Different Tillage Conditions Affects Nitrogen Utilization Efficiency and Yield of Eggplant (Solanum melanogena L.) in Mediterranean Environment. Soil Tillage Res. 2016, 155, 329–338. [Google Scholar] [CrossRef]
  27. SINAB Sistema d’Informazione Nazionale sull’Agricoltura Biologica. Available online: https://www.sinab.it/superfici (accessed on 21 May 2023).
  28. Meier, U. Growth Stages of Mono- and Dicotyledonous Plants: BBCH Monograph, 2nd ed.; Federal Biological Research Centre for Agriculture and Forestry: Braunschweig, Germany, 2001. [Google Scholar]
  29. Frasconi, C.; Martelloni, L.; Raffaelli, M.; Fontanelli, M.; Abou Chehade, L.; Peruzzi, A.; Antichi, D. A field vegetable transplanter for use in both tilled and no-till soils. Trans ASABE 2019, 62, 593–602. [Google Scholar] [CrossRef]
  30. Smith, R.G.; Atwood, L.W.; Warren, N.D. Increased Productivity of a Cover Crop Mixture Is Not Associated with Enhanced Agroecosystem Services. PLoS ONE 2014, 9, e097351. [Google Scholar] [CrossRef] [Green Version]
  31. Mason, N.W.H.; Orwin, K.H.; Lambie, S.; Waugh, D.; Pronger, J.; Perez, C.; Paul, C. Resource-Use Efficiency Drives Overyielding via Enhanced Complementarity. Oecologia 2020, 193, 995–1010. [Google Scholar] [CrossRef]
  32. Wendling, M.; Büchi, L.; Amossé, C.; Jeangros, B.; Walter, A.; Charles, R. Specific Interactions Leading to Transgressive Overyielding in Cover Crop Mixtures. Agric. Ecosyst. Environ. 2017, 241, 88–99. [Google Scholar] [CrossRef]
  33. Siebenkäs, A.; Schumacher, J.; Roscher, C. Resource Availability Alters Biodiversity Effects in Experimental Grass-Forb Mixtures Alrun. PLoS ONE 2016, 11, e0158110. [Google Scholar] [CrossRef] [Green Version]
  34. Blesh, J. Functional Traits in Cover Crop Mixtures: Biological Nitrogen Fixation and Multifunctionality. J. Appl. Ecol. 2018, 55, 38–48. [Google Scholar] [CrossRef] [Green Version]
  35. Smith, R.G.; Warren, N.D.; Cordeau, S. Are Cover Crop Mixtures Better at Suppressing Weeds than Cover Crop Monocultures? Weed Sci. 2020, 68, 186–194. [Google Scholar] [CrossRef] [Green Version]
  36. Baraibar, B.; Hunter, M.C.; Schipanski, M.E.; Hamilton, A.; Mortensen, D.A. Weed Suppression in Cover Crop Monocultures and Mixtures. Weed Sci. 2018, 66, 121–133. [Google Scholar] [CrossRef]
  37. Mckenzie-Gopsill, A.; Mills, A.; Macdonald, A.N.; Wyand, S. The Importance of Species Selection in Cover Crop Mixture Design. Weed Sci. 2022, 70, 436–447. [Google Scholar] [CrossRef]
  38. Maclaren, C.; Swanepoel, P.; Bennett, J.; Wright, J.; Dehnen-schmutz, K. Cover Crop Biomass Production Is More Important than Diversity for Weed Suppression. Crop Sci. 2019, 59, 733–748. [Google Scholar] [CrossRef] [Green Version]
  39. Christina, M.; Négrier, A.; Marnotte, P.; Viaud, P.; Auzoux, S.; Techer, P.; Hoarau, E. A Trait-Based Analysis to Assess the Ability of Cover Crops to Control Weeds in a Tropical Island. Eur. J. Agron. 2021, 128, 126316. [Google Scholar] [CrossRef]
  40. Scavo, A.; Mauromicale, G. Crop Allelopathy for Sustainable Weed Management in Agroecosystems: Knowing the Present with a View to the Future. Agronomy 2021, 11, 2104. [Google Scholar] [CrossRef]
  41. Boselli, R.; Anders, N.; Fiorini, A.; Ganimede, C.; Faccini, N.; Marocco, A.; Schulz, M.; Tabaglio, V. Improving Weed Control in Sustainable Agro-Ecosystems: Role of Cultivar and Termination Timing of Rye Cover Crop. Ital. J. Agron. 2021, 16, 1807. [Google Scholar] [CrossRef]
  42. Grint, K.R.; Arneson, N.J.; Oliveira, M.C.; Smith, D.H.; Werle, R. Cereal Rye Cover Crop Terminated at Crop Planting Reduces Early-Season Weed Density and Biomass in Wisconsin Corn—Soybean Production. Agrosystems Geosci. Environ. 2022, 5, e20245. [Google Scholar] [CrossRef]
  43. Abou Chehade, L.; Puig, C.G.; Souto, C.; Antichi, D.; Mazzoncini, M.; Pedrol, N. Rye (Secale cereale L.) and Squarrose Clover (Trifolium squarrosum L.) Cover Crops Can Increase Their Allelopathic Potential for Weed Control When Used Mixed as Dead Mulch. Ital. J. Agron. 2021, 16, 1869. [Google Scholar] [CrossRef]
  44. Adeux, G.; Antichi, D.; Carlesi, S.; Mazzoncini, M.; Munier-jolain, N.; Paolo, B. Cover Crops Promote Crop Productivity but Do Not Enhance Weed Management in Tillage-Based Cropping Systems. Eur. J. Agron. 2021, 123, 126221. [Google Scholar] [CrossRef]
  45. Campiglia, E.; Mancinelli, R.; Radicetti, E. Influence of No-Tillage and Organic Mulching on Tomato (Solanum lycopersicum L.) Production and Nitrogen Use in the Mediterranean Environment of Central Italy. Sci. Hortic. 2011, 130, 588–598. [Google Scholar] [CrossRef]
  46. Little, N.G.; Ditommaso, A.; Westbrook, A.S.; Ketterings, Q.M.; Mohler, C.L. Effects of Fertility Amendments on Weed Growth and Weed—Crop Competition: A Review. Weed Sci. 2021, 69, 132–146. [Google Scholar] [CrossRef]
  47. Testani, E.; Montemurro, F.; Ciaccia, C.; Testani, E. Agroecological Practices for Organic Lettuce: Effects on Yield, Nitrogen Status and Nitrogen Utilisation Efficiency Nitrogen Status and Nitrogen Utilisation efficiency. Biol. Agric. Hortic. 2019, 36, 84–95. [Google Scholar] [CrossRef]
  48. Radicetti, E.; Mancinelli, R.; Campiglia, E. Impact of Managing Cover Crop Residues on the Floristic Composition and Species Diversity of the Weed Community of Pepper Crop (Capsicum annuum L.). Crop Prot. 2013, 44, 109–119. [Google Scholar] [CrossRef]
  49. Manici, L.M.; Caputo, F.; Nicoletti, F.; Leteo, F.; Campanelli, G. The Impact of Legume and Cereal Cover Crops on Rhizosphere Microbial Communities of Subsequent Vegetable Crops for Contrasting Crop Decline. Biol. Control 2018, 120, 17–25. [Google Scholar] [CrossRef]
  50. Kramberger, B.; Gselman, A.; Kristl, J.; Lesnik, M.; Šuštar, V.; Muršec, M.; Podvršnik, M. Winter Cover Crop: The Effects of Grass—Clover Mixture Proportion and Biomass Management on Maize and the Apparent Residual N in the Soil. Eur. J. Agron. 2014, 55, 63–71. [Google Scholar] [CrossRef]
  51. Canali, S.; Campanelli, G.; Ciaccia, C.; Leteo, F.; Testani, E.; Montemurro, F. Conservation Tillage Strategy Based on the Roller Crimper Technology for Weed Control in Mediterranean Vegetable Organic Cropping Systems. Eur. J. Agron. 2013, 50, 11–18. [Google Scholar] [CrossRef]
  52. Ciaccia, C.; Canali, S.; Campanelli, G.; Testani, E.; Montemurro, F.; Leteo, F.; Delate, K. Effect of Roller-Crimper Technology on Weed Management in Organic Zucchini Production in a Mediterranean Climate Zone. Renew. Agric. Food Syst. 2016, 31, 111–121. [Google Scholar] [CrossRef]
Figure 1. Monthly average minimum and maximum temperatures (°C) and monthly total precipitations (mm) during the trials at San Piero a Grado (2019–2021) compared with the long-term average values (1993–2020).
Agronomy 13 02027 g001
Figure 2. Cover crop termination with a roller-crimper (left) and a flame-weeding machine (right) in the no-till systems (NT).
Agronomy 13 02027 g002
Figure 3. Cover crop and weed aboveground dry biomass at the time of cover crop termination. For each variable, bars with different letters are significantly different (p ≤ 0.05). S. clover: Squarrose clover. Error bars represent the standard errors of the estimated marginal means.
Agronomy 13 02027 g003
Figure 4. Interaction effects of cover crop and year (A,C,D) and main effects of cover crop (B) on tissue N and P content and accumulation at the cover crop termination time. Different letters indicate significant differences (p ≤ 0.05) in each interaction/main effect. S. clover: Squarrose clover. Error bars represent the standard errors of the estimated marginal means.
Agronomy 13 02027 g004
Figure 5. Variation in SPAD values during the growing season in response to the interactions of the tillage system and crop stages (A) and cover crop, tillage, and year (B). Points represent the emmeans, and bars represent their standard errors. Different letters indicate significant differences (p ≤ 0.05) in each interaction. S. clover: squarrose clover; CT: conventional tillage; NT: no-till; SPAD1: vegetative growth stage; SPAD2: flowering stage; SPAD3: fruit development stage.
Agronomy 13 02027 g005
Figure 6. Variation in tomato plant height during the growing season in response to the interactions of tillage system and crop stage (A) and cover crop, tillage system and year (B). Points represent the emmeans, and bars represent their standard errors. Different letters indicate significant differences (p ≤ 0.05) in each interaction. S. clover: squarrose clover; CT: conventional tillage; NT: no-till; Height1: flowering stage; Height2: fruit development stage.
Agronomy 13 02027 g006
Figure 7. Interaction effects of tillage system and year (A), cover crop and year (B) and cover crop and tillage system (C) on tomato potential and unmarketable yields. Different letters indicate significant differences (p ≤ 0.05) in each interaction. Interaction is not significant for the unmarketable yield in Figure (B). S. clover: Squarrose clover; CT: conventional tillage; NT: no-till. Error bars represent the standard errors of the estimated marginal means.
Agronomy 13 02027 g007
Figure 8. Interaction effects of tillage system and year (A), cover crop and year (B) and cover crop and tillage system (C) on dry tomato yield, and interaction effects of tillage system, cover crop and year (D) on tomato shoot biomass at harvest. Different letters indicate significant differences (p ≤ 0.05) in each interaction. S. clover: Squarrose clover; CT: conventional tillage; NT: no-till. Error bars represent the standard errors of the estimated marginal means.
Agronomy 13 02027 g008
Figure 9. Main effects of tillage (A), cover crop (B), and year (C) on Nitrogen concentration (Nconc) in tomato shoots and fruits. For each variable, different letters indicate significant differences (p ≤ 0.05) in each main effect. S. clover: Squarrose clover; CT: conventional tillage; NT: no-till. Error bars represent the standard errors of the estimated marginal means.
Agronomy 13 02027 g009
Figure 10. Interaction effects of cover crop, tillage, and year on Nitrogen concentration (Nconc) in tomato shoots (A), cover crop and year on Nitrogen accumulation (Nacc) in tomato fruits (B), and cover crop and year on Nitrogen utilization efficiency (NUtE) (C). Different letters indicate significant differences (p ≤ 0.05) in each interaction. S. clover: Squarrose clover; CT: conventional tillage; NT: no-till. Error bars represent the standard errors of the estimated marginal means.
Agronomy 13 02027 g010
Figure 11. Interaction effects of tillage system and year (A) and cover crop and tillage system (B) on weed biomass at tomato harvest. Different letters indicate significant differences (p ≤ 0.05) in each interaction. S. clover: Squarrose clover; CT: conventional tillage; NT: no-till. Error bars represent the standard errors of the estimated marginal means.
Agronomy 13 02027 g011
Table 1. Initial soil characteristics (0–30 cm depth) at trial sites.
Characteristic2019–20202020–2021
pH6.728.27
Organic matter (g 100 g−1)2.191.45
Total N (g 100 g−1)0.120.09
Available P (mg 100 g−1)0.490.91
Cation exchange capacity (meq 100 g−1)10.813.56
Electrical conductivity (µS cm−1)113.5454.45
Organic matter was determined with the Walkley–Black method, total Nitrogen with the Kjeldahl method, and available Phosphorus with the Olsen method.
Disclaimer/Publisher’s Note: The statements, opinions and data contained in all publications are solely those of the individual author(s) and contributor(s) and not of MDPI and/or the editor(s). MDPI and/or the editor(s) disclaim responsibility for any injury to people or property resulting from any ideas, methods, instructions or products referred to in the content.

