Article

The Effect of Rootstock on the Activity of Key Enzymes in Acid Metabolism and the Expression of Related Genes in ‘Cabernet Sauvignon’ Grapes

1
Xinjiang Production and Construction Corps Key Laboratory of Special Fruits and Vegetables Cultivation Physiology and Germplasm Resources Utilization, College of Agriculture, Shihezi University, Shihezi 832003, China
2
Zhengzhou Fruit Tree Research Institute, Chinese Academy of Agricultural Sciences, Zhengzhou 450009, China
*
Author to whom correspondence should be addressed.
Ruiyun Yao and Meng Zhang have contributed equally to this paper and are the co-first authors.
Agronomy 2023, 13(8), 2068; https://doi.org/10.3390/agronomy13082068
Submission received: 12 July 2023 / Revised: 2 August 2023 / Accepted: 3 August 2023 / Published: 5 August 2023

Abstract

:
The types and contents of organic acids in wine grapes determine wine quality. To explore the effects of different rootstocks on the acid metabolism of ‘Cabernet Sauvignon’ grapes, various perennial rootstock–scion combinations were used as experimental materials. High-performance liquid chromatography (HPLC) was used to determine citric acid, tartaric acid, and malic acid contents during fruit development. Succinic acid and oxalic acid contents and the activity of related enzymes were measured using spectrophotometry. The expression levels of related genes were measured using a real-time fluorescence quantitative method. The results showed that all four rootstock types significantly reduced oxalic acid and citric acid contents in the grapes, while increasing succinic acid content to varying degrees. Employing 110R, SO4, and Kangzhen3 rootstocks increased tartaric acid and malic acid contents. Enzyme activity analysis revealed that 110R, SO4, and Kangzhen3 rootstocks increased the NAD-MDH enzyme activity, which positively correlated with malic acid content. Simultaneously, these rootstocks reduced the NADP-ME enzyme activity level. NAD-MDH and PEPC gene expression levels were higher in ‘Cabernet Sauvignon’ grapes grafted with 110R, SO4, and Kangan3 rootstocks compared to control self-rooted seedlings. Grafting these three rootstocks enhanced malic acid accumulation in ‘Cabernet Sauvignon’ grapes.

1. Introduction

The ‘Cabernet Sauvignon’ grape variety, renowned for its exceptional winemaking quality, has a rich history of cultivation and can be traced back to the Bordeaux region. Owing to its excellent and unique internal characteristics, strong adaptability, and high aging quality, it is planted and distributed worldwide [1]. The quality of wine grapes is affected by organic acids, and the composition and content of organic acids are important factors that directly influence the internal quality of the fruit [2]. The main components of organic acids in ‘Cabernet Sauvignon’ grapes are tartaric acid and malic acid, while the remaining components include citric acid, succinic acid, oxalic acid, formic acid, and acetic acid [3,4,5]. Tartaric acid accounts for a large proportion of organic acids but does not participate in the primary metabolic pathways of physiological activities. Citric acid and oxalic acid are low in content, whereas malic acid is an important intermediate product in physiological metabolic processes, such as the tricarboxylic acid cycle and glycolysis, and is an unusually important carbon source in grapes [6]. In actual grape production, different rootstocks are generally used to adjust the internal microenvironment, thereby improving grape quality. However, the interactions between rootstocks and scions are multifaceted and complex [7], and different rootstocks can affect fruit organic acid content [8]. From fruit growth to maturity, the expression of genes related to acid metabolism causes enzymes in the acid metabolism pathway to undergo a series of carboxylation reactions with complex interactions to produce organic acids in grapes. The enzymes involved in the synthesis and decomposition of organic acids in fruits, which have important relationships with them, mainly include malic acid enzymes (NADP-ME), phosphoenolpyruvate carboxylase (PEPC), citric acid synthase (CS), aconitase (ACO), and malic acid dehydrogenase (NAD-MDH) [9,10]. Some researchers believe that there is a relationship between the activity of enzymes involved in acid metabolism in fruits and the synthesis and decomposition of organic acids. For example, Jinyang et al. measured NADP-ME activity in plum and apricot fruits. Their findings concluded that there was a significant correlation with their malic acid content, and that this enzyme activity was the main reason for the difference in organic acids between the two fruits [11]. Qing et al. [12] suggested that changes in CS activity were significantly positively correlated with changes in citric acid content during the growth and development of Actinidia tomentosa. Moreover, Qianqian et al. [13] found that the change in NAD-MDH activity in Junzao and Suanzao fruits was significantly positively correlated with malic acid content.
Organic acids in wine grapes play a crucial role in the quality and flavor of subsequently processed wine [14,15,16]. To date, most studies on acid metabolism and its influencing factors in grapes at home and abroad have focused on the effects of production, cultivation, and shaping methods on organic acid metabolism. There are few reports on the relationship between organic acid metabolism and acid-metabolizing enzyme activity in ‘Cabernet Sauvignon’ grapes with different rootstocks in Xinjiang, China. This study builds upon prior research and examines the dynamic changes in organic acid content, acid metabolism enzyme activity, and acid metabolism-related gene expression in ‘Cabernet Sauvignon’ grapes. Five different rootstock–scion combinations were studied, namely, ‘Cabernet Sauvignon’ self-rooted seedlings, CS169/110R, CS169/3309C, CS169/SO4, and CS169/Kangzhen3. The aim is to gain preliminary insights into the trends and influencing factors of organic acid in grapes under different rootstock–scion combinations. The study also seeks to understand the differing mechanisms of fruit acid metabolism under various grape rootstock–scion combinations, providing a theoretical basis for studying the acid metabolism of grapes at the molecular level. The findings aim to offer a valuable reference for addressing related issues in red wine production in the Xinjiang region.

2. Materials and Methods

2.1. Test Location

The test site was located in Shihezi, a renowned area for grape production, at 45° north latitude and 86° east longitude. Shihezi benefits from a temperate continental climate characterized by a flat terrain and predominantly gravelly soil. The soil is slightly alkaline, while the climate is dry with high effective accumulated temperature and significant day-to-night temperature variations. These conditions promote the rapid accumulation of glucose, rendering Shihezi suitable for the cultivation of wine grapes [17].

2.2. Test Materials

2.2.1. Plant Materials

The four rootstocks used in this experiment (110R, 3309C, S04, and Kangzhen3) were obtained from the Zhengzhou Fruit Research Institute (Zhengzhou, China). The scion used was ‘Cabernet Sauvignon’ Superior Line 169 from CITIC Guoan Agriculture Co., Ltd. (Beijing, China). In 2014, various rootstocks and ‘Cabernet Sauvignon’ grape seedlings were cultivated in greenhouses. In 2015, ‘Cabernet Sauvignon’ Superior Line 169 hardwood was grafted onto 1 year old rootstock seedlings. Each rootstock–scion combination was selected from 10 grapes with similar growth potential and planted in an east–west direction at the experimental site (Shihezi University Agricultural College Test Station, Shihezi, China). Following grafting, each rootstock–scion combination of ‘Cabernet Sauvignon’ consisted of CS169/110R, CS169/3309C, CS169/SO4, and CS169/Kangzhen3, while ‘Cabernet Sauvignon’ self-rooted seedlings served as the control (CK). Experimental materials comprised five grape plants selected from different rootstock–scion combinations of ‘Cabernet Sauvignon’, ensuring similar growth conditions. The field management practices remained consistent across all plants. The experiment began sampling at 56 d after anthesis, with a sampling interval of 7 d until the fruit was fully mature. The sampling dates were 56 d, 70 d, 84 d, 98 d, 112 d, and 126 d after anthesis. A total of six samples were taken, and the sampling was conducted from 9:00 to 10:00 a.m. During each sampling event, three clusters of fruit were randomly selected from each treatment, sealed in bags, and promptly transported to the laboratory. Fruit particles berries devoid of disease, insect pests, and mechanical damage were carefully chosen, thoroughly mixed, and rapidly frozen in liquid nitrogen. The frozen samples were then stored at −80 °C in a refrigerator. This process was repeated three times.

2.2.2. Main Reagents

Chromatographically pure phosphoric acid (Shanghai Jingchun Biochemical Technology Co., Ltd. Shanghai, China), chromatographically pure methanol (Shanghai Baili Biotechnology Co., Ltd. Shanghai, China), analytically pure potassium dihydrogen phosphate (Sinopharm Chemical Reagents Co., Ltd. Beijing, China), ultrapure water, sodium hydroxide, and phenolphthalein indicators were used.
High-quality standard products including tartaric acid, oxalic acid, malic acid, citric acid, and succinic acid were purchased from Sigma (purity > 99.5%).
Hydrochloric acid, potassium dihydrogen phosphate, sodium hydroxide, ethanol, Tris, sucrose, glutathione, mercaptoethanol, phosphoric acid, acetic acid, manganese sulfate, magnesium chloride, sodium isocitrate, and potassium hydrogen carbonate were purchased from Keming Biological Co., Ltd. (Suzhou, China).

2.2.3. Instruments and Equipment

The equipment utilized in the study included a 1/10,000 electronic balance (ME204/02, Mettler-Tollido Instrument Shanghai Co., Ltd., Shanghai, China), ultraviolet spectrophotometer (Shimadzu UV-2450, Shimazin Instrument (Suzhou) Co., LTD., Suzhou, China), SIM-F140AY65 ice maker (SANYO DENKI SHANGHAI CO., LTD., Shanghai, China), and colorimetric dishes were used. a BT221S electronic balance (Shanghai Hengqin Equipment Co., LTD., Shanghai, China), frozen high-speed centrifuge (Eppendorf Centrifuge 5430R), Agilent LC-1200 high-pressure liquid chromatography system with UV detector (Agilent Technologies (China) Co., Ltd., Beijing, China), and high-performance liquid chromatography (HPLC) 2D workstation. The chromatographic column employed was Thermodyncronis C18 (4.6 mm × 250 mm ID, 5 μm) from Thermo Fisher Scientific (China) Co., Ltd. (Shanghai, China). Other equipment utilized encompassed brown chromatography bottles (Agilent Technologies (China) Co., Ltd., Beijing, China), a Ultrasonic cleaning machine(CQ-500B, Shanghai Yuejin Medical Optical Equipment Factory, Shanghai, China), a 1/10,000 balance microporous filter, 0.45 μm water system microporous filter membranes, an ion chromatograph (ICS-3000, Thermo Fisher Scientific (China) Co., Ltd. (Shanghai, China), an oven (ZFD-A5090, Shanghai Zhicheng Analytical Instrument Manufacturing Co., Ltd., Shanghai, China), and a handheld sugar meter (TD-45, Zhejiang Top Yunnong Technology Co., Ltd., Hangzhou, China).

2.3. Measurement Items and Methods

2.3.1. Soluble Solid Content of ‘Cabernet Sauvignon’ Grapes by Different Rootstocks

At 126 d after flowering, 15 berries were randomly selected from the control and four groups of rootstock–scion combinations fruits; soluble solids were measured using a handheld sugar meter, and this was repeated three times.

2.3.2. Extraction and Determination of Organic Acids

The organic acids in the grapes were extracted and determined using HPLC according to the method of Wang et al. [18]. The specific test operation was slightly modified.
‘Cabernet Sauvignon’ grapes from different rootstock–scion combinations were seeded and ground to a powder under liquid nitrogen. A total of 1 g of the sample was quickly weighed using a 1/10,000 balance. A total of 25 mL of distilled water containing 0.8% 1 mol·L−1 phosphoric acid was added to the sample and was extracted for 10 min in a constant temperature water bath at 25 °C. After uniform shaking, the sample was frozen and centrifuged at 12,000× g rpm and 4 °C for 20 min. The supernatant was collected and filtered using a 0.45 μm filter membrane (water system filter membrane) for subsequent machine analysis. Chromatographic analysis was performed under the following conditions: C18 chromatographic column (250 mm × 4.6 mm × 5 mm) as the main column, with an Agilent C18 protection column. The mobile phase consisted of 3% CH3OH-0.01 mol·L−1 H3PO4 at pH 2.2. The flow rate was set at 0.8 mL·min−1, with the column temperature at 40 °C, injection volume at 20 μL, and detection wavelength at 215 nm.

2.3.3. Determination of Organic Acid Metabolism Enzyme Activity

Extraction of all relevant enzymes and related reagents in the test was performed in an icebox. The enzyme solution was prepared according to the methods of Luo et al. [19] and Hirai et al. [9], with slight improvements. The specific extraction steps are described below.
A total of 3 g of seedless grape powder was ground with liquid nitrogen, and 5 mL of precooled grinding buffer was added, consisting of 0.2 mol·L−1 Tris·HCl (pH 8.0), 0.7 mol·L−1 sucrose, 20 mmol·L−1 isoascorbic acid, and 0.1% Triton X-100. Continuous grinding and mixing were applied; when working with ‘Cabernet Sauvignon’ grapes before 90 d after flowering, 3% PVPP was added to the grinding buffer. The mixture was frozen and centrifuged at 4 °C, 4500 rpm·min−1 for 20 min. The supernatant was collected, and its volume was adjusted to 10 mL using grinding buffer. A total of 4 mL of the supernatant was taken from a 10 mL volumetric flask and transferred to a 5 mL centrifuge tube, before re-centrifuging at 4 °C, 15,000× g rpm·min−1 for 15 min. The supernatant was transferred into a 5 mL centrifuge tube and brought to a constant volume of 5 mL with extraction buffer to obtain Cyt-ACO. To obtain NAD-IDH, grinding buffer was added to the precipitate at a constant volume of 5 mL. After freezing and centrifuging at 4 °C and 4500× g rpm·min−1 for 20 min, 5 mL of the remaining 6 mL of the extraction solution was pipetted into a 10 mL volumetric flask, and 5 mL of grinding buffer was added to it, which was used to determine MDH activity. To obtain the enzyme solution for PEPC and CS, 4 mL of the 10 mL extraction solution was taken and mixed with a large amount of dialysate (grinding buffer) for 10–14 h. The enzyme activity of PEPC and CS were then determined. The test was conducted at temperatures ranging from 0 to 4 °C.
Enzyme activity was determined according to the methods of Hirai et al. [9] and Luo et al. [19], with slight modifications. The total volume of the enzyme activity reaction mixture was 6 mL. After adding the corresponding reaction substrates, the absorbance was determined using an ultraviolet spectrophotometer. The sample was scanned for 5 min at 10 s intervals, the absorbance change was recorded, and the reaction was repeated three times. An absorbance change of 0.01 per min was considered one enzyme unit. The enzyme activity was expressed as Unit·min−1·g−1 FW.

2.3.4. Determination of Relative Expression of Key Enzyme Genes in Organic Acid Metabolism

The extraction of RNA from grapes was based on the method of Vashisth et al. [20] and slightly improved. The ‘Cabernet Sauvignon’ grapes were placed in a mortar with liquid nitrogen for protection. They were quickly ground to powder, and 100 mg of the sample was weighed using a 1/10,000 balance. To the sample, 700 μL of β-mercaptoethanol-containing buffer SL was added and immediately shaken and mixed. The mixture was then centrifuged at 4 °C, 13,400× g for 2 min. The supernatant was transferred to a filter column and centrifuged at 4 °C, 13,400× g for 2 min. The mixture was quickly mixed and centrifuged, and the liquid was transferred to an adsorption column. After centrifuging at 4 °C, 13,400× g for 15 s, the waste liquid was removed. The adsorption column was retained, and 350 μL of Buffer RW1 was added to the column. It was centrifuged at 4 °C for 15 s at 13,400× g to remove the waste liquid. This step was repeated, and then 80% ethanol was added to the column (350 μL of DNase I working solution). The column was left at 25 °C for 15 min. After centrifuging at 4 °C for 15 s at 13,400× g, the waste liquid was removed, and 500 μL of Buffer RW was added to the column. The column was centrifuged at 4 °C, 13,400× g for 15 s, and the waste liquid was removed. This step was repeated, and then the column was centrifuged at 4 °C, 13,400× g for 2 min. The RNA solution was suspended in 50% RNase Free ddH2O in the middle of the adsorption column and left at room temperature for 2 min. The RNA solution was obtained by centrifuging at 4 °C, 13,400× g for 1 min. The DNase I working solution was prepared by adding 10 μL of DNase I storage liquid to a new RNase Free centrifuge tube and 70 μL of Buffer RDD (DNA Digest Buffer). Before use, RW buffer was mixed with an appropriate amount of anhydrous ethanol. The quality of RNA was determined using RNA solution and 1% agarose gel electrophoresis, and the RNA concentration was measured using a nucleic acid protein analyzer.
RNA reverse transcription was performed using the TaKaRa PrimeScript RT Reagent Kit with gDNA Eraser (Perfect Real Time). The PCR tube was added to the precooled metal plate in the order of the reaction system shown in Table 1.
The reverse-transcribed cDNA was placed in an ice box or on a precooled metal domain. For the subsequent analysis, the TIANGEN SuperReal PreMix Plus (SYBR Green) kit was used. Each sample was replicated three times and sequentially added to the eight tubes according to Table 2.
After the PCR tube was thoroughly mixed using an instantaneous centrifuge, it was subjected to the following steps on a real-time fluorescence quantitative PCR instrument: ① heated to 95 °C for 30 s; ② 95 °C for 10 s; ③ 58 °C for 30 s. This process was repeated for a total of 42 cycles.
The primer design was based on the relevant literature on the organic acid synthesis pathway of ‘Cabernet Sauvignon’ grapes and the full-length sequences of the NAD-MDH, NADP-ME, and PEPC genes in GenBank. PCR primers for related genes were designed using Primer 5.0, with actin as the internal reference (registration number: AF369524). The upstream and downstream primers of the internal reference and target genes were synthesized by Shanghai Biotechnology Co., Ltd.; the primer sequences are shown in Table 3.

2.4. Data Processing and Analysis

Excel 2010 was used for data processing, and Spss21.0 statistical software was used for one-way ANOVA (p < 0.05). Origin2017 software was used for charting.

3. Results

3.1. Effect of Different Rootstocks on the Soluble Solids Content of ‘Cabernet Sauvignon’ Grapes

As shown in Figure 1, the soluble solid content in ‘Cabernet Sauvignon’ grapes with different rootstock–scion combinations increased with increasing maturity, with the largest variation observed between 70 and 84 d after anthesis. At 56 d after anthesis, there was no significant difference in soluble solid content in the fruits of SO4 and Kangzhen3, and they were higher than those of CK and other rootstock–scion combinations. At 70 d after anthesis, the soluble solids content in the fruit of Kangzhen3 was the highest, reaching 7.5%, which was significantly (p < 0.05) higher than that of the other rootstock–scion combinations. From 84 to 126 d after anthesis, the soluble solids content in the fruits of the 110R rootstock was the highest. From 84 to 112 d after anthesis, the soluble solid content in the fruits of the CS/3309C rootstock–scion combination was the lowest and was significantly lower than that of CK and other rootstock–scion combinations. The soluble solid content of the 3309C rootstock was close to 20.0% before and after 126 d, whereas that of the other rootstocks was close to 20.0% before and after 112 d, indicating that the 3309C rootstock delayed the ripening of ‘Cabernet Sauvignon’ grapes to some extent by 15–20 d. Therefore, the variation trend of soluble solid content in fruits of different rootstock–scion combinations was approximately the same; however, the impact of rootstock on soluble solid content varied greatly. The different rootstocks slightly increased the soluble solid content in fruits compared to ‘Cabernet Sauvignon’ self-rooted seedlings during fruit ripening.

3.2. Effect of Different Rootstocks on Organic Acid Content in ‘Cabernet Sauvignon’ Grapes

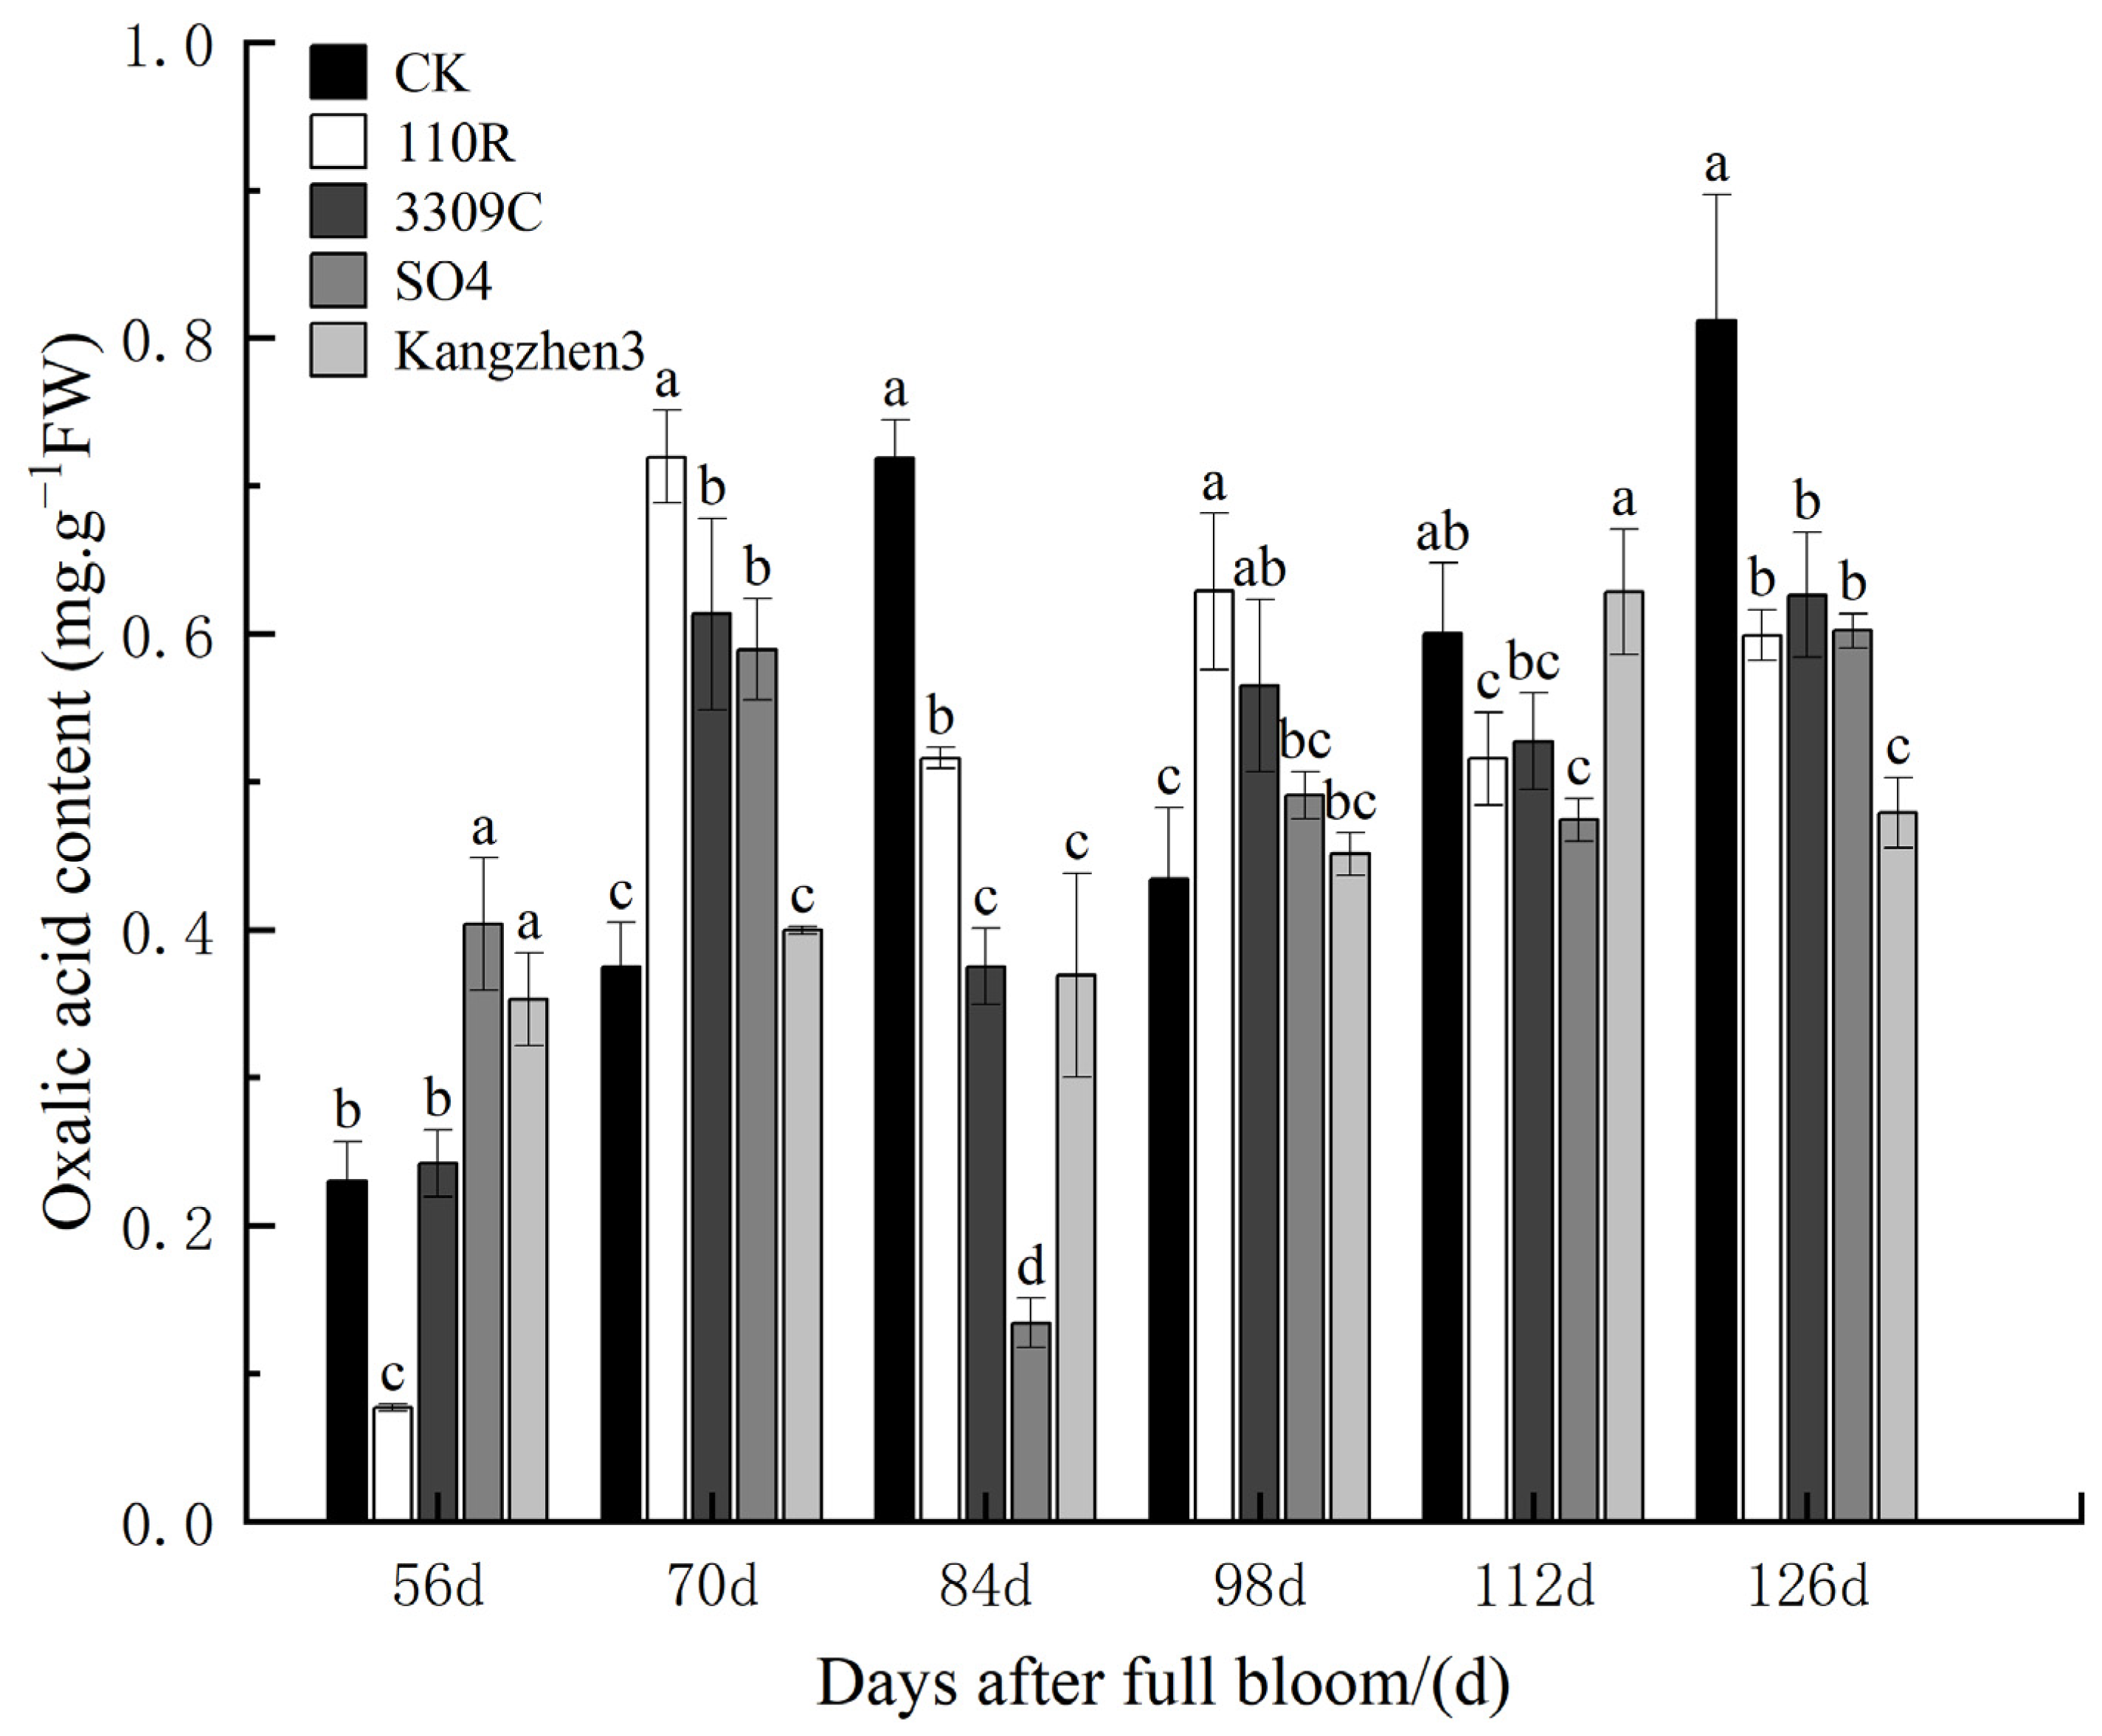
The dynamic changes in the impact of different rootstocks on the oxalic acid content in ‘Cabernet Sauvignon’ grapes are shown in Figure 2. The trend of oxalic acid content in the fruit between the different treatments exhibited a consistent pattern, initially increasing, then decreasing, and ultimately increasing again. The oxalic acid content at the mature stage was greater than that before the color conversion stage, and the oxalic acid content did not change significantly from flowering to maturity. At 56 d after anthesis, the oxalic acid content in the fruit was 0.35 mg.g−1 FW and 0.40 mg.g−1 FW for the CS169/Kangzhen3 and CS169/SO4 rootstock–scion combinations, respectively. These values were significantly higher than those of the control (CK) by 75.76% and 53.62%, respectively. However, in the CS169/110R rootstock–scion combination, the oxalic acid content of the fruit was 0.08 mg.g−1 FW, which was significantly lower than that of CK (66.65%). At 70 d after anthesis, the oxalic acid content in the fruit of the CS169/110R, CS169/3309C, and CS169/SO4 rootstock–scion combinations was significantly higher than that of CK (91.99%, 63.65%, and 57.23%, respectively). The difference between the CS169/Kangzhen3 rootstock–scion combination and CK was small. At 84 d after anthesis, the oxalic acid content in the fruits of each experimental rootstock–scion combination was significantly lower than that of CK. At 98 d after anthesis, the fruit of the CS169/110R and CS169/3309C rootstock–scion combinations had oxalic acid contents of 0.63 mg.g−1 FW and 0.56 mg.g−1 FW, respectively. These values were significantly higher than those of CK (44.82% and 30.09%, respectively). At 112 d after anthesis, the oxalic acid content in the fruits of CS169/110R and CS169/SO4 was 0.52 mg.g−1 FW and 0.47 mg.g−1 FW, respectively, while CS169/3309C and CS169/Kangzhen3, had significantly lower oxalic acid contents compared to CK by 14.12% and 12.16%, respectively. At 126 d after anthesis, the oxalic acid content in the fruits of each rootstock–scion combination was significantly lower than that of CK. According to comprehensive analysis, using materials such as 110R, SO4, 3309C, and Kangzhen3 as rootstocks, with ‘Cabernet Sauvignon’ self- rooted seedlings as control, can significantly reduce the oxalic acid content in mature fruits.
The dynamic changes in the influence of different rootstocks on the tartaric acid content in ‘Cabernet Sauvignon’ fruits are shown in Figure 3. Regardless of the rootstock used (110R, 3309C, SO4, Kangzhen3) or ‘Cabernet Sauvignon’ self-rooted seedlings, the tartaric acid content in the fruit exhibited a similar trend across different treatments. It initially showed a downward trend and underwent significant changes from flowering to maturity. At 56 d after anthesis, the tartaric acid content in the fruits of the CS169/110R and CS169/3309C rootstock–scion combinations was significantly lower than that of CK (10.25% and 7.75%, respectively), but this was not the case for CS169/Kangzhen3. At 70 d after anthesis, the tartaric acid content in the fruits of the CS169/110R and CS169/SO4 rootstock–scion combinations was significantly higher than that of CK by 43.28% and 22.21%, respectively. The tartaric acid content in the fruits of the CS169/3309C and CS169/Kangzhen3 rootstock–scion combinations was significantly lower than that of CK by 27.82% and 26.55%, respectively. At 84 d after anthesis, the tartaric acid content in the fruits of the CS169/110R and CS169/3309C rootstock–scion combinations was significantly lower than that of CK by 6.28% and 16.94%, respectively. The CS169/Kangzhen3 rootstock–scion combination was significantly higher than CK by 9.08%, with a small difference from the CS169/SO4 rootstock–scion combination. In contrast to the CS169/3309C rootstock–scion combination, the tartaric acid content in the fruit of the CS169/110R, CS169/SO4, and CS169/Kangzhen3 rootstock–scion combinations was significantly higher than that of CK by 31.34%, 10.06%, and 4.74%, respectively, at 98 d after anthesis. At 112 d after anthesis, the tartaric acid content in the fruits of CS169/110R, CS169/3309C, and CS169/Kangzhen3 was significantly higher than that of CK by 5.22%, 7.61%, and 8.00%, respectively. At 126 d after anthesis, the tartaric acid content in the fruits of CS169/3309C was slightly higher than that in the fruits of CK. The rootstock–scion combinations CS169/110R, CS169/SO4, and CS169/Kangzhen3 were significantly higher than those of CK by 9.03%, 6.30%, and 12.74%, respectively. Throughout the experimental period, the rootstock–scion combinations of CS169/110R, CS169/SO4, and CS169/Kangzhen3 significantly increased the tartaric acid content in the fruits of ‘Cabernet Sauvignon’ grapes to varying degrees.
The dynamic changes in the effect of different rootstocks on the malic acid content in ‘Cabernet Sauvignon’ grapes are shown in Figure 4. The variation trend of the malic acid content in the fruits of the different treatments was generally the same, showing a dynamic downward trend. The malic acid content in the fruits of different rootstock–scion combinations changed significantly from flowering to maturity. At 56 d after anthesis, in contrast to the fruit of the CS169/3309C rootstock–scion combination, the malic acid content of CS169/110R, CS169/SO4 and CS169/Kangzhen3 was significantly higher than CK by 45.83%, 12.15%, and 17.51%, respectively. At 70 d after anthesis, the malic acid content in the fruits of CS169/110R, CS169/SO4, and CS169/Kangzhen3 was significantly higher than that of CK by 17.17%, 8.61%, and 5.67%, respectively, whereas that of the CS169/3309C rootstock–scion combination was significantly lower than that of CK (14.66%). At 84 d after anthesis, the malic acid content in the fruits of CS169/110R, CS169/SO4, and CS169/Kangzhen3 was significantly higher than that of CK (14.09%, 16.34%, and 6.23%, respectively), whereas that of the CS169/3309C rootstock–scion combination was significantly lower than that of CK (15.32%). At 98 d after anthesis, the malic acid content in the fruits of CS169/110R, CS169/SO4, and CS169/Kangzhen3 was significantly higher than that of CK by 16.38%, 5.31%, and 13.11%, respectively, whereas that of the CS169/3309C rootstock–scion combination was significantly lower than that of CK by 26.16%. At 112 and 126 d after anthesis, the content of the CS169/3309C rootstock–scion combination was slightly lower than that of CK, whereas that of CS169/110R, CS169/SO4, and CS169/Kangzhen3 was significantly higher than that of CK. Comprehensive analysis showed that the rootstock–scion combination of CS169/110R, CS169/SO4, and CS169/Kangzhen3 significantly increased malic acid content in ‘Cabernet Sauvignon’ grapes at different stages after anthesis.
The dynamic changes in the influence of different rootstocks on the citric acid content in ‘Cabernet Sauvignon’ fruit are shown in Figure 5. The citric acid content in the fruits of the different treatments exhibited a consistent trend of initial decrease, followed by an increase and then another decrease. The citric acid content changed significantly from flowering to maturity. During the entire experimental period, there were differences between the rootstock–scion combinations at different stages and the ‘Cabernet Sauvignon’ self-rooted seedlings. At 56 d after anthesis, the citric acid content of all combinations, except the CS169/110R rootstock–scion combination, was significantly higher than that of CK. At 70 d after anthesis, there was no significant difference between the citric acid content and CK in the fruits of each rootstock–scion combination. At 84 d after anthesis, the citric acid content in the fruits of each rootstock–scion combination was significantly lower than that of CK, with CS169/3309C and CS169/SO4 being 51.79% and 51.68% lower, respectively. At 98 d after anthesis, the citric acid content in the fruits of CS169/110R and CS169/3309C was significantly higher than that of CK 64.07% and 33.90%, with a small difference compared to other rootstock–scion combinations. At 112 d after anthesis, the citric acid content in the fruits of CS169/110R and CS169/3309C was significantly lower than that of CK (36.03% and 26.80%, respectively). The rootstock–scion combinations of CS169/SO4 and CS169/Kangzhen3 were significantly higher than those of CK (24.23% and 46.88%, respectively). At 126 d after anthesis, the citric acid content in the fruits of each rootstock–scion combination was significantly lower than that of CK. Comprehensive analysis showed that using materials such as 110R, SO4, 3309C, and Kangzhen3 as rootstocks, with ‘Cabernet Sauvignon’ self-rooted seedlings as control, can significantly reduce the citric acid content in the fruit to varying degrees.
The dynamic changes in the impact of different rootstocks on succinic acid content in ‘Cabernet Sauvignon’ grapes are shown in Figure 6. The differences in the succinic acid content of the fruits between the different treatments were significant. During the entire experimental period, there were differences between rootstock–scion combinations at different stages and between ‘Cabernet Sauvignon’ self-rooted seedlings. At 56 d after anthesis, the succinic acid content in the fruits of the CS169/3309C and CS169/Kangzhen3 rootstock–scion combinations was slightly different from that of CK. The CS169/110R rootstock–scion combination was 30.42% lower than CK, and the CS169/SO4 rootstock–scion combination was 62.35% higher than CK. At 70 d after anthesis, the succinic acid content in the fruit of the CS169/SO4 rootstock–scion combination was slightly different from that of CK, with that of CS169/3309C and CS169/Kangzhen3 being significantly lower than that of CK (57.77% and 56.54%, respectively) and was significantly higher in CS169/110R than of CK (37.71%). At 84 d after anthesis, the succinic acid content in the fruit of CS169/110R was significantly lower than that of CK by 22.14%, and the other rootstock–scion combinations showed little difference from CK. At 98 d after anthesis, there was a small difference in succinic acid content between each rootstock–scion combination and the CK fruit. At 112 d after anthesis, the succinic acid content in the fruit of CS169/3309C was significantly lower than that of CK by 34.37%, and that of CS169/Kangzhen3 was significantly higher than that of CK by 46.84%. The differences among CS169/110R, CS169/SO4, and CK were relatively small. At 126 d after anthesis, the succinic acid content in the fruit of CS169/SO4 was slightly higher than that of CK, and that of the other rootstock–scion combinations was significantly higher than that of CK. According to a comprehensive analysis, utilizing rootstocks such as 110R, SO4, 3309C, and Kangzhen3, with ‘Cabernet Sauvignon’ self-rooted seedlings as a control, demonstrated the potential to enhance the content of succinic acid in ‘Cabernet Sauvignon’ grapes to varying degrees.
Dynamic changes in the impact of different rootstocks on the total accumulation of organic acids in ‘Cabernet Sauvignon’ grapes are shown in Figure 7. The accumulation of organic acids in the CS169/3309C fruit was lower than that in the CK fruit throughout the experimental period. With the exception of 70 d after anthesis, the acid accumulation in the fruits of the CS169/110R, CS169/Kangzhen3, and CS169/SO4 rootstock–scion combinations was significantly higher than that of CK during the remaining color conversion stages. This indicates that CS169/110R, CS169/Kangzhen3, and CS169/SO4 rootstock–scion combinations could significantly increase the organic acid content in ‘Cabernet Sauvignon’ grapes at different stages after anthesis.

3.3. Effect of Different Rootstocks on the Activity of Organic Acid Metabolism Enzymes in ‘Cabernet Sauvignon’ Grapes

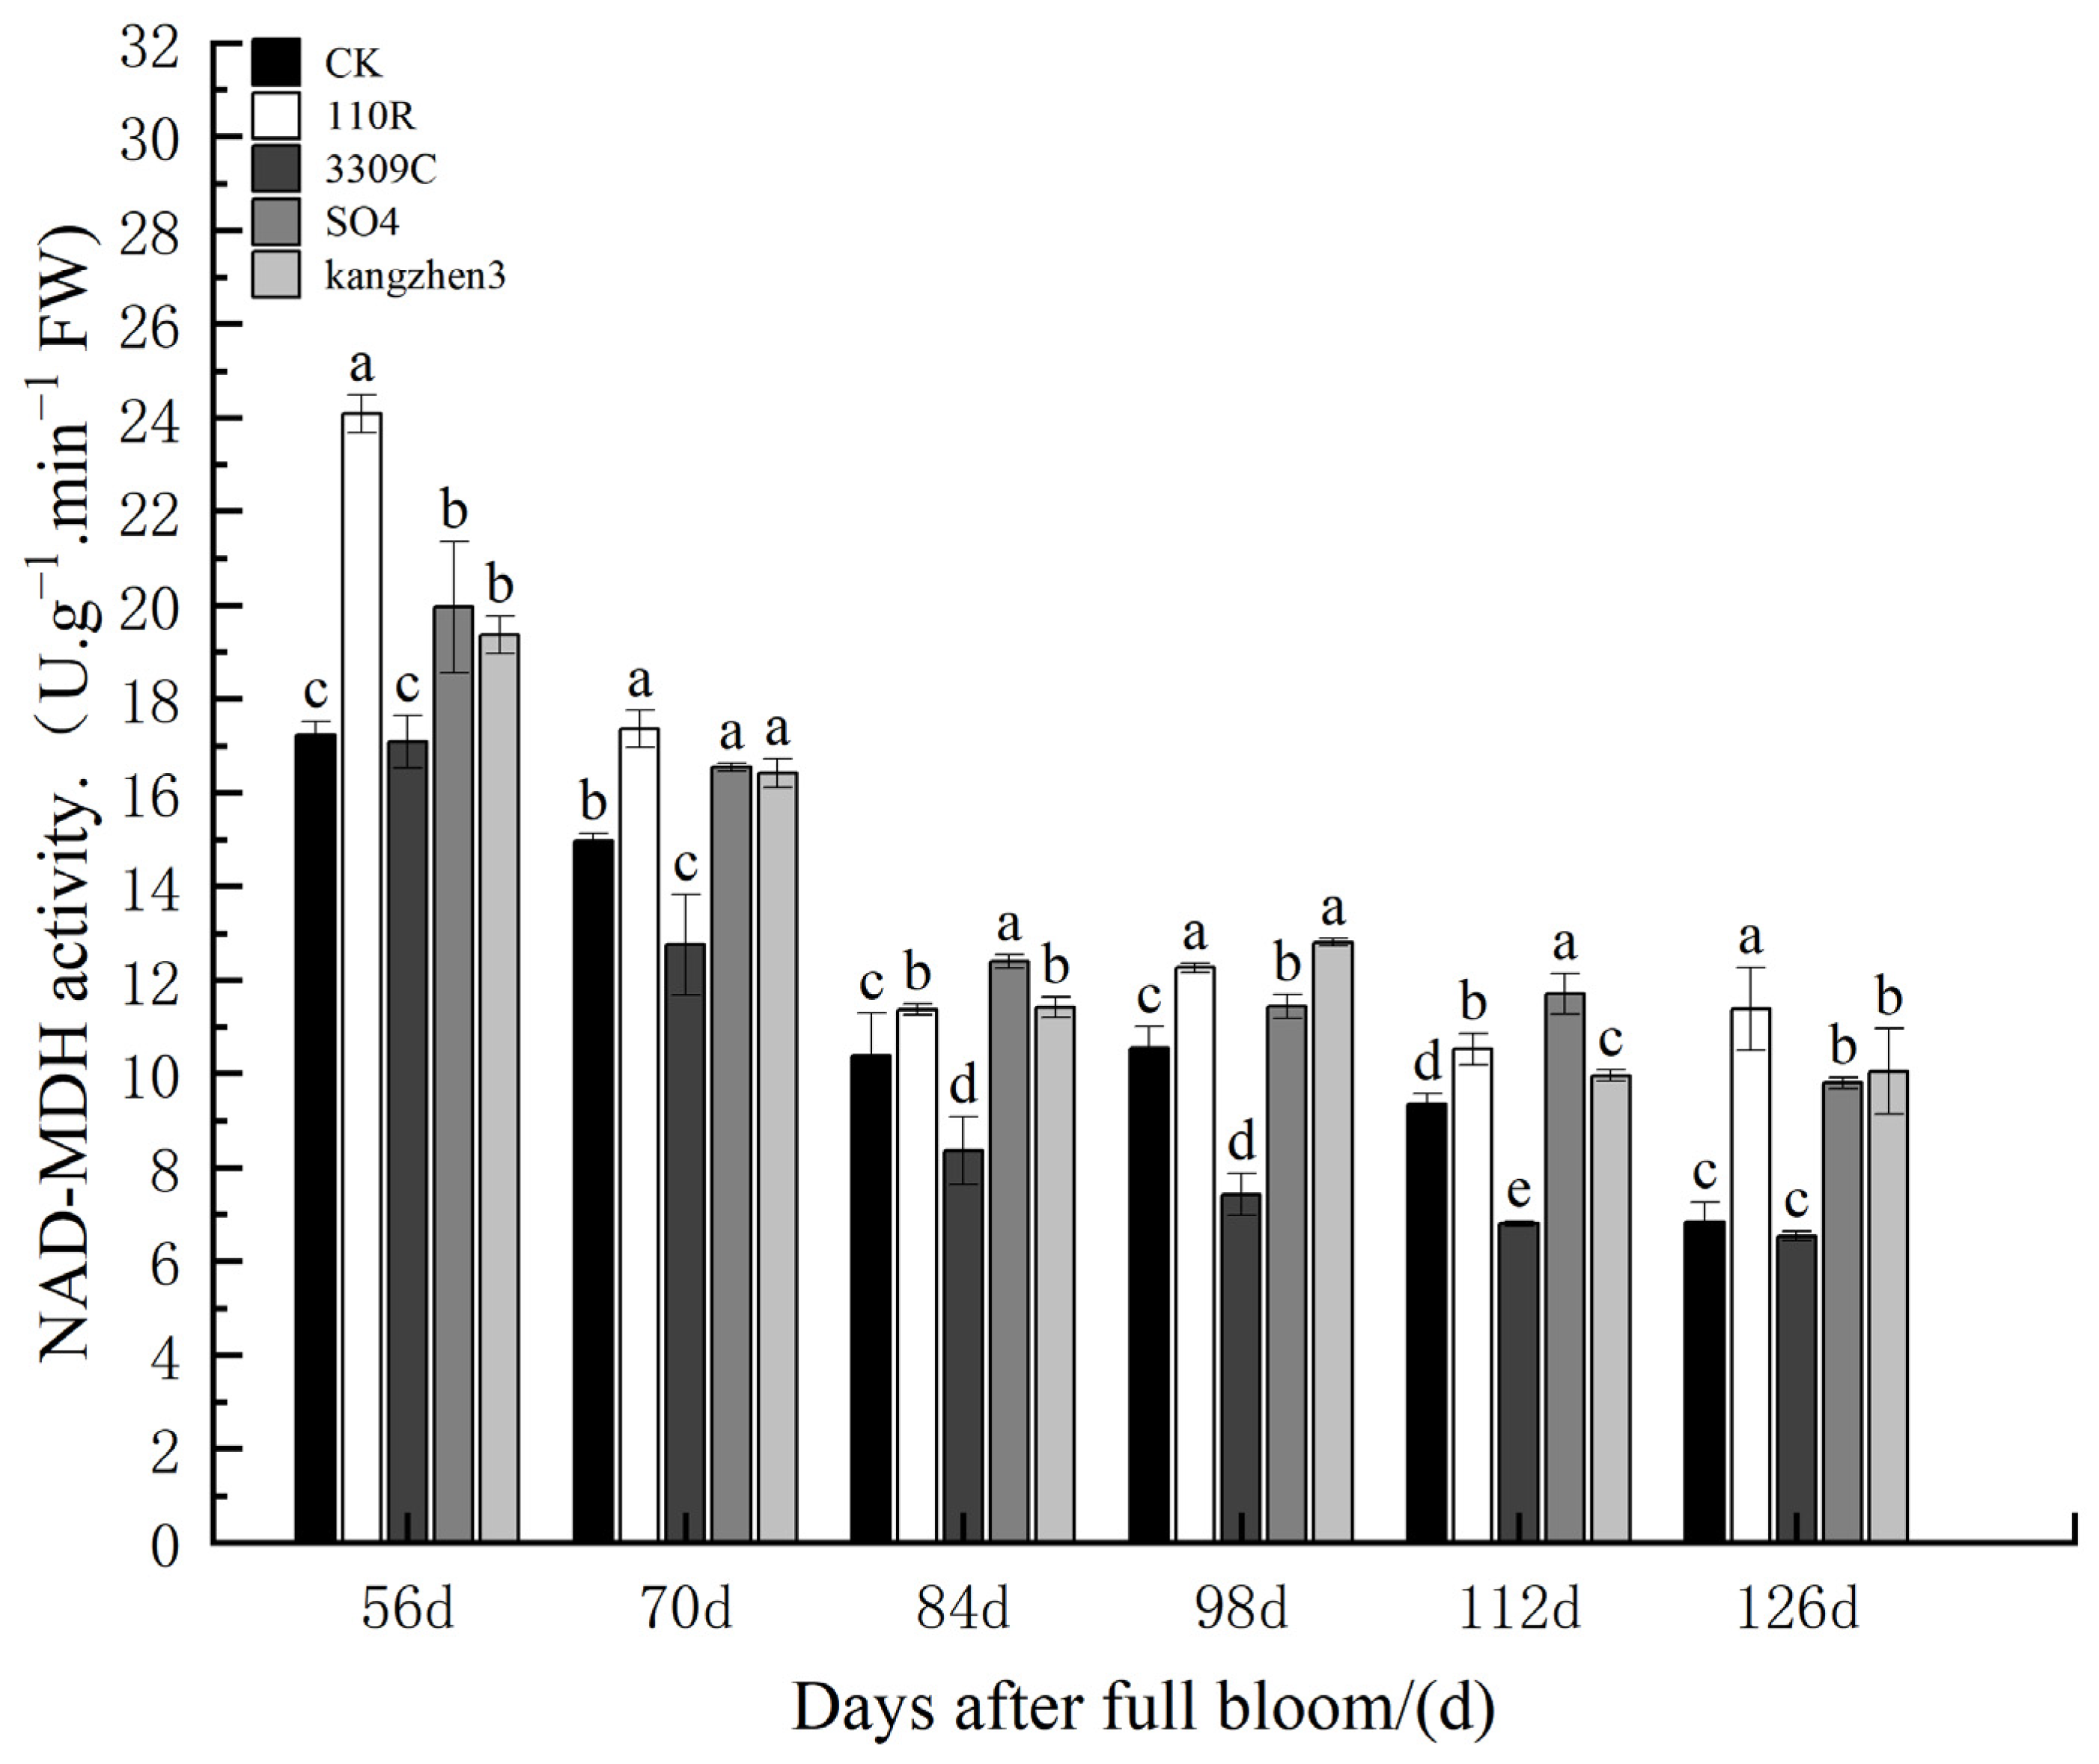
The NAD-MDH enzyme activity in ‘Cabernet Sauvignon’ grapes grown on different rootstocks is shown in Figure 8. The trend of change in NAD-MDH enzyme activity in fruits under different treatments was generally the same, showing a dynamic and violent decline, followed by a relatively stable rise and decline. NAD-MDH enzyme activity changed significantly from flowering to maturity. During the entire experimental period, there were differences between the rootstock–scion combinations at different stages and the ‘Cabernet Sauvignon’ self-rooted seedlings. At 56 d after anthesis, the NAD-MDH enzyme activity in the fruits of the CS169/SO4 and CS169/Kangzhen3 rootstock–scion combinations was significantly higher than that of CK, with differences of 11.48% and 19.28%, respectively. Similarly, the CS169/110R rootstock–scion combination showed a substantial difference from CK, displaying an increase of 46.90% in NAD-MDH enzyme activity. However, the CS169/3309C rootstock–scion combination demonstrated a minor difference in NAD-MDH enzyme activity compared to CK. At 70 d after anthesis, the NAD-MDH enzyme activity in the fruits of CS169/3309C was significantly lower than that of CK by 19.25%, and the spike combinations of CS169/110R, CS169/SO4, and CS169/Kangzhen3 were significantly higher than that of CK by 12.64%, 4.78%, and 3.94%, respectively. At 84 d after anthesis, NAD-MDH enzyme activity in the fruit of the CS169/SO4 rootstock–scion combination was significantly higher than that of CK by 19.04%, whereas that of CS169/110R and CS169/Kangzhen3 was significantly higher than that of CK by 9.54% and 6.41%, respectively. Other rootstock–scion combinations showed little difference compared to CK. At 98 d after anthesis, the NAD-MDH enzyme activity in the fruit of the CS169/3309C rootstock–scion combination was significantly lower than that of CK by 29.55%, that of the CS169/Kangzhen3 combination was significantly higher than that of CK by 21.43%, and that of the CS169/110R and CS169/SO4 rootstock–scion combinations was significantly higher than that of CK by 16.37% and 8.44%, respectively. At 112 d after anthesis, the NAD-MDH enzyme activity in the fruit of CS169/3309C was significantly lower than that of CK, the NAD-MDH enzyme activity in the fruit of CS169/SO4 was significantly higher than that of CK, and that of the combination of CS169/110R and CS169/Kangzhen3 was significantly lower than that of CK. At 126 d after anthesis, NAD-MDH enzyme activity in the fruits of CS169/110R, CS169/SO4, and CS169/Kangzhen3 was significantly higher than that of CK, whereas that of the CS169/3309C rootstock–scion combination was slightly lower than that of CK. Comprehensive analysis showed that using 110R, SO4, and Kangzhen3 as rootstocks improved the NAD-MDH enzyme activity of ‘Cabernet Sauvignon’ grapes to varying degrees.
The effects of the different rootstocks on NADP-ME enzyme activity in ‘Cabernet Sauvignon’ grapes are shown in Figure 9. The overall trend of the changes in NADP-ME enzyme activity in the fruits of the different treatments was the same, showing a dynamic upward trend. NADP-ME enzyme activity changed significantly from flowering to maturity. At 56 d after flowering, the NADP-ME enzyme activity in the fruits of the CS169/110R and CS169/3309C rootstock–scion combinations was significantly higher than that of CK by 23.65% and 5.37%, respectively, whereas the CS169/SO4 and CS169/Kangzhen3 rootstock–scion combinations were significantly lower than CK by 6.65% and 15.58%, respectively. At 70 d after anthesis, the NADP-ME enzyme activity in the fruits of the same CS169/110R and CS169/3309C rootstock–scion combinations was significantly higher than that of CK, whereas the activities of CS169/SO4 and CS169/Kangzhen3 rootstock–scion combinations were significantly lower than that of CK. At 84 d after anthesis, NADP-ME enzyme activity in the fruits of each rootstock–scion combination was significantly lower than that of CK. At 98 d after flowering, NADP-ME enzyme activity in the fruit of CS169/3309C was significantly higher than that of CK by 12.02%, and that of CS169/110R was significantly lower than that of CK by 17.23%. The differences among CS169/SO4, CS169/Kangzhen3, and CK were relatively small. At 112 d after anthesis, the NADP-ME enzyme activity in the fruits of the CS169/110R, CS169/SO4, and CS169/Kangzhen3 rootstock–scion combinations was significantly lower than that of CK by 6.83%, 20.19%, and 19.28%, respectively, whereas that of CS169/3309C was significantly higher than that of CK. At 126 d after flowering, the NADP-ME enzyme activity in the fruits of each rootstock–scion combination was significantly lower than that of CK. The overall analysis showed that, with the exception of using 110R, SO4, and Kangzhen3 materials as rootstocks at 56 and 70 d, with ‘Cabernet Sauvignon’ self-rooted seedlings as controls, all other treatments resulted in a varying decrease in NADP-ME enzyme activity in ‘Cabernet Sauvignon’ grapes.
The effects of the different rootstocks on PEPC enzyme activity in ‘Cabernet Sauvignon’ grapes are shown in Figure 10. The overall trend of PEPC enzyme activity in fruits under different treatments was the same, showing a dynamic downward trend. At 56 d after flowering, the PEPC enzyme activities of the CS169/110R, CS169/3309C, CS169/SO4, and CS169/Kangzhen3 rootstock–scion combinations were significantly lower than that of CK by 21.50%, 14.24%, 7.98%, and 42.60%, respectively. At 70 d after flowering, PEPC enzyme activity in the fruits of each rootstock–scion combination was significantly lower than that of CK. At 84 d after anthesis, the PEPC enzyme activity in the fruits of the CS169/110R, CS169/3309C, and CS169/SO4 rootstock–scion combinations was significantly lower than that of CK by 23.81%, 17.15%, and 5.04%, respectively. There was a small difference between CS169/Kangzhen3 and CK. At 98 d after flowering, PEPC enzyme activity in the fruits of each rootstock–scion combination was significantly lower than that of CK. At 112 d after flowering, the rootstock–scion combinations CS169/110R, CS169/3309C, and CS169/Kangzhen3 were significantly lower than CK, and there was no difference in PEPC enzyme activity between CK fruit and CS169/SO4. At 126 d after anthesis, PEPC enzyme activity in the CK fruit was significantly lower than that of CS169/SO4 and significantly higher than that of CS169/110R, CS169/3309C, and CS169/Kangzhen3 rootstock–scion combinations. Overall analysis showed that the use of 110R, SO4, 3309C, and Kangzhen3 materials as rootstocks, with ‘Cabernet Sauvignon’ self-rooted seedlings as a control, resulted in a varying decrease in PEPC enzyme activity in ‘Cabernet Sauvignon’ fruit.
The effects of different rootstocks on the CS enzyme activity in ‘Cabernet Sauvignon’ grapes are shown in Figure 11. The changes in CS enzyme activity in the fruits of the different treatments were not the same and showed dynamic changes. The CS enzyme activity changed significantly from flowering to maturity. At 56 d after flowering, the CS enzyme activity of the CS169/110R, CS169/SO4, and CS169/Kangzhen3 different rootstock–scion combinations was significantly lower than that of CK (62.76%, 55.20%, and 71.72%, respectively), but that of the CS169/3309C rootstock–scion combination was significantly higher than that of CK (44.84%). At 70 d after flowering, the CS enzyme activity in the fruit of the CS169/110R rootstock–scion combination was significantly higher than that of CK by 12.77%. However, all other rootstock–scion combinations showed significantly lower CS enzyme activity compared to CK. At 84 d after flowering, CS enzyme activity in the fruits of each rootstock–scion combination was significantly lower than that of CK. At 98 d after flowering, CS enzyme activity in the fruits of CS169/110R and CS169/Kangzhen3 was significantly lower than that of CK by 25.18% and 77.33%, respectively. The difference between the CS169/SO4 rootstock–scion combination and CK was relatively small. At 112 and 126 d after flowering, CS enzyme activity in the fruits of each rootstock–scion combination was significantly lower than that of CK.

3.4. Effects of Different Rootstocks on the Gene Expression of Key Enzymes for Organic Acid Metabolism in ‘Cabernet Sauvignon’ Grapes

The effects of different rootstocks on the relative expression of NAD-MDH in ‘Cabernet Sauvignon’ grapes are shown in Figure 12. The trend of changes in the combination of rootstock–scion at different stages was the same, and there were differences in the relative expression of the NAD-MDH gene in fruits among the different treatments. At 56 d after flowering, the relative expression of the NAD-MDH gene in the fruit of the CS169/110R, CS169/SO4, and CS169/Kangzhen3 different rootstock–scion combinations was significantly higher than that of CK (41.76%, 12.18%, and 19.40%, respectively). The difference between the CS169/3309C rootstock–scion combination and CK was small. Seventy days after flowering, the relative expression level of the NAD-MDH gene in the fruits of the CS169/110R, CS169/SO4, and CS169/Kangzhen3 rootstock–scion combinations was also significantly higher than that of CK, but the CS169/3309C rootstock–scion combination was significantly lower than that of CK by 17.15%. At 84 d after flowering, the expression level of the NAD-MDH gene in the fruit of the CS169/110R, CS169/SO4, and CS169/Kangzhen3 rootstock–scion combinations was significantly higher than that of CK, whereas that of the CS169/3309C rootstock–scion combination was significantly lower than that of CK, by 22.53%. At 98 d after flowering, the expression of NAD-MDH in the fruit of the CS169/3309C rootstock–scion combination was significantly lower than that of CK by 22.46%. The CS169/110R, CS169/SO4, and CS169/Kangzhen3 rootstock–scion combinations were significantly lower than CK by 26.89%, 5.06%, and 12.51%, respectively. At 112 d after flowering, the expression level of the NAD-MDH gene in the fruit of CS169/3309C was significantly lower than that of CK by 31.93%, and that of CS169/110R was significantly higher than that of CK by 28.89%. The difference between the CS169/SO4 and CS169/Kangzhen3 rootstock–scion combinations and CK was small. At 126 d after flowering, the NAD-MDH gene expression in the CS169/3309C rootstock–scion combination fruit was slightly lower than that of CK. However, the CS169/110R, CS169/SO4, and CS169/Kangzhen3 rootstock–scion combinations showed significantly higher NAD-MDH gene expression compared to CK by 55.83%, 32.87%, and 44.14%, respectively. Overall, when materials such as 110R, SO4, and Kangzhen3 were used as rootstocks, the relative gene expression of NAD-MDH in ‘Cabernet Sauvignon’ grapes under the rootstock–scion combination was significantly higher than that of CK, indicating a good correlation with NAD-MDH.
The relative expression level of the NADP-ME gene in ‘Cabernet Sauvignon’ grapes under different rootstocks is shown in Figure 13. There were differences in the relative expression levels of the NADP-ME gene in fruits under different treatments. At 56 d after flowering, the relative expression level of the NADP-ME gene in the fruits of the CS169/110R, CS169/SO4, and CS169/Kangzhen3 different rootstock–scion combinations was significantly higher than that of CK. The difference between the CS169/3309C rootstock–scion combination and CK was small. At 70 d after flowering, the relative expression levels of NADP-ME genes in fruits of CS169/110R and CS169/Kangzhen3 were significantly lower than those of CK (26.20% and 14.93%, respectively), whereas the relative expression levels of NADP-ME genes in fruits of CS169/3309C and CS169/SO4 rootstock–scion combinations were significantly higher than those of CK (42.84% and 28.00%, respectively). After 84 d of flowering, the expression level of the NADP-ME gene in the fruit of the CS169/110R, CS169/3309C, and CS169/SO4 different rootstock–scion combinations was significantly lower than that of CK, but that of CS169/Kangzhen3 was significantly higher than that of CK. At 98 d after flowering, the expression level of the NADP-ME gene in the fruit of CS169/3309C was significantly lower than that of CK by 16.45%. The expression level of the NADP-ME gene in CS169/110R and CS169/SO4 was significantly higher than that of CK by 62.92% and 13.94%, respectively. The difference between the CS169/Kangzhen3 rootstock–scion combination and CK was relatively small. At 112 d after flowering, the expression level of the NADP-ME gene in the CS169/110R and CS169/3309C rootstock–scion combinations were significantly lower than that of CK, whereas that of CS169/Kangzhen3 was significantly higher than that of CK. The difference between the CS169/SO4 rootstock–scion combination and CK was small. At 126 d after flowering, the expression level of the NADP-ME gene in the fruit of the CS169/3309C rootstock–scion combination was significantly higher than that of CK by 10.34%, whereas that of CS169/110R and CS169/Kangzhen3 was significantly lower than that of CK by 10.49% and 53.04%, respectively. The differences between the CS169/SO4 and CK treatments were small.
The expression level of the PEPC gene in ‘Cabernet Sauvignon’ grapes under different rootstocks is shown in Figure 14. There were certain differences in the expression level of the PEPC gene in fruits among different treatments. At 56 d after flowering, except for a small difference in PEPC gene expression between the CS169/3309 rootstock–scion combination and CK, all other rootstock–scion combinations were significantly higher than CK. At 70 d after flowering, the expression level of the PEPC gene in the fruit of CS169/110R and CS169/Kangzhen3 different rootstock–scion combinations was significantly higher than that of CK (14.16% and 19.10%, respectively), while that of CS169/3309C was significantly lower than that of CK (22.65%). The differences between the CS169/SO4 and CK treatments were small. At 84 d after flowering, except for CS169/3309C, which showed a significantly lower expression level of the PEPC gene compared to CK by 44.34%, the fruits of CS169/110R, CS169/SO4, and CS169/Kangzhen3 different rootstock–scion combinations exhibited significantly higher expression levels of the PEPC gene than CK. At 98 d after flowering, the expression level of the PEPC gene in the fruit of the CS169/110R, CS169/3309C, and CS169/Kangzhen3 rootstock–scion combinations was significantly lower than that of CK, while the expression level of the PEPC gene in the fruit of the CS169/SO4 rootstock–scion combination was significantly higher than that of CK. At 112 d after flowering, the expression level of the PEPC gene in the fruit of CS169/110R, CS169/3309C, and CS169/Kangzhen3 different rootstock–scion combinations was significantly lower than that of CK (62.38%, 33.29%, and 31.97%, respectively). The expression level of the PEPC gene in the fruit of CS169/SO4 rootstock–scion combination was significantly higher than that of CK (44.63%). At 126 d after flowering, the expression level of the PEPC gene in the fruit of the CS169/110R and CS169/Kangzhen3 different rootstock–scion combinations was significantly lower than that of CK by 28.49% and 14.95%, respectively. However, the expression level of the PEPC gene in the fruit of the CS169/SO4 rootstock–scion combination was significantly higher than that of CK by 26.15%. Moreover, the difference between the CS169/3309C rootstock–scion combination and CK was small.
During the analysis of the key enzyme genes for organic acid metabolism in ‘Cabernet Sauvignon’ grapes, it was found that the gene expression of NAD-MDH, NADP-ME, and PEPC in the self-rooted seedlings of ‘Cabernet Sauvignon’ grapes as controls remained almost unchanged at different stages of the experiment. However, the expression of these three genes in ‘Cabernet Sauvignon’ grapes under the action of rootstocks 110R, 3309C, SO4, and Kangzhen3 varied.

4. Discussion

In this study, different rootstock–scion treatments were applied to grapes in the Xinjiang region. The contents of organic acids and soluble solids in the grapes under different rootstock–scion combinations were determined. The results showed that, during the fruit-ripening period, the soluble solid content in the ‘Cabernet Sauvignon’ grapes under the action of each rootstock–scion combination reached the standard for harvesting wine grapes. The difference in soluble solid content among fruits grown using 110R, SO4, and Kangzhen3 as rootstocks was not significant at 112 and 126 d after flowering, whereas fruits grown using 3309C rootstocks reached their peak during the entire growth period at 126 d after flowering. This indicates that 3309C is a late-maturing variety compared with the other rootstocks and can be harvested later. The other three rootstocks can be harvested and processed earlier to improve their economic benefits. Organic acids are widely present in various plants, and their types and contents are influenced by many factors. The release of organic acid protons from fruit trees creates special sensory sensations in humans [21]. Improving grape quality using suitable rootstocks has become an important developmental trend [22,23]. Guo et al. [24] found that Ruidu ruby grapes grafted on 5BB, 110R, 1103P, and 3309 rootstocks could effectively reduce the content of titratable acid and soluble solids in the fruit. Niu et al. [25] studied the effects of ‘Cabernet Sauvignon’ grapes and five different rootstocks: 110R, 1103P, 3309C, SO4, and 5BB. The results showed that rootstocks such as SO4, 3309C, and 1103P can significantly reduce the content of reducing sugar in the fruit, and that rootstocks such as SO4, 3309C, and 110R have a strong impact on the content of titratable acid in the fruit. The acid content in the fruit is less affected by the 1103P and 5BB rootstocks. However, research on the fruit quality of different rootstocks and varieties has revealed that the content of soluble solids and acids in the fruit is not significantly influenced by the interactions between the rootstocks [26]. The four types of rootstocks used in this experiment slightly increased the soluble solids content of the fruit after ripening. In organic acid determination, 110R, SO4, and Kangzhen3 could increase the content of malic acid, tartaric acid, and succinic acid in fruits. All four rootstock–scion combinations significantly reduced oxalic acid and citric acid content. Except for malic acid, the contents of the acids were less affected by the rootstock, which is similar to the conclusions of Niu et al. [25]. A comparison of the tartaric acid content revealed that CS169/Kangzhen3 > CS169/110R > CS169/SO4 > CS169/3309C > CK. In the comparison of malic acid content, it was found that CS169/110R > CS169/Kangzhen3 > CS169/SO4 > CS169/3309C > CK.
The composition and proportion of organic acids in fruits play an important role in fruit flavor [27]. Therefore, the related metabolism of organic acids in fruits in this study can provide a theoretical basis for the regulation of acid metabolism in grapes, as well as for an in-depth study of grape quality. The accumulation and decomposition of organic acid content in grapes are mainly regulated by organic acid-related enzymes, and the process of organic acid metabolism is relatively complex, being comprehensively regulated by multiple related enzymes [28,29]. For example, key enzymes such as NAD-MDH and PEPC control the synthesis of malic acid, whereas NADP-ME controls the degradation of malic acid [30]. In this experiment, 110R, SO4, and Kangzhen3 all increased the NAD-MDH enzyme activity in the fruit compared to self-rooted seedlings, and the impact of different rootstocks on enzyme activity was highly correlated with the impact on malic acid. Therefore, NAD-MDH may be a key enzyme in controlling malic acid synthesis. Ruffer et al. [6] showed that NADP-ME plays a crucial role in decreasing the malic acid content. In this study, the NADP-ME enzyme activity of the three rootstock–scion combinations other than 3309C was lower than that of self-rooted seedlings at 84 d after flowering. Additionally, the trend of change in malic acid was opposite, supporting the findings of Ruffer and his colleagues. In addition, there were similarities between the changes in NAD-MDH enzyme activity and the trend of change in tartaric acid content, indicating that NAD-MDH also affects the content of tartaric acid. The correlation between the malic acid content and the activity of the PEPC enzyme in various fruits was not significant in some stages, especially in the early stages. This may be related to the highly acidic environment prevalent during the early stages of fruit development. This is consistent with the observation of Diakou et al. [10] that PEPC demonstrated reduced sensitivity to malic acid inhibition in unfavorable pH environments during early grape berry color transformation. CS is the key enzyme involved in citric acid metabolism. Within 56–98 d after flowering, the activity of the CS enzyme in fruits under different rootstocks increased to varying degrees with an increase in citric acid content in the fruit. However, in the later stages of fruit growth and development, there were certain differences between CS enzyme activity and citric acid content. This is consistent with the research of Liu et al. [31], which demonstrated a decrease in citric acid content during the later stages of mountain grape growth, attributed to the combined effects of various acid metabolism-related enzymes.
Furthermore, a study on the expression levels of acid metabolism-related genes in ‘Cabernet Sauvignon’ grapes from different rootstocks showed that, at 84 d after flowering, the relative expression levels of NAD-MDH genes in the fruits of the three rootstocks (excluding 3309C) were significantly higher than those in CK. This correlation was consistent with the NAD-MDH enzyme activity and malic acid content. The effects of different rootstocks on the relative expression of the NADP-ME and PEPC genes varied. The study revealed a relatively weak correlation between the NADP-ME gene and NADP-ME enzyme activity, which aligns with findings in studies conducted on ‘Huangguan’ apples and ‘Red Muscat’ grapes. This could be attributed to the susceptibility of PEPC enzyme activity to external environmental factors and certain physiological aspects. In particular, under highly acidic conditions, the activity of the PEPC enzyme is prone to inhibition [32].

5. Conclusions

In summary, rootstocks such as 110R, SO4, and Kangzhen3 can increase the expression levels of NAD-MDH and PEPC genes in ‘Cabernet Sauvignon’ grapes compared to CK, and they are beneficial for increasing the NAD-MDH enzyme activity level in ‘Cabernet Sauvignon’ grapes while reducing the NADP-ME enzyme activity level. To ensure that the soluble solids in ‘Cabernet Sauvignon’ grapes meet harvesting standards, increasing the acid content of ‘Cabernet Sauvignon’ grapes can improve fruit and wine quality. Therefore, 110R, SO4, and Kangzhen3 rootstocks are favorable choices for improving the low acid content of wine grapes in Xinjiang of China, which can provide a theoretical reference for a series of problems related to low sugar and high acid levels in red wine.

Author Contributions

M.Z. performed the experiments and analyzed the data; R.Y. wrote the first draft, revised the manuscript, and was responsible for the publication; R.B. performed the project management, designed the study, and finalized the manuscript; D.G. provided the research material and managed the project; B.Z. and J.S. performed the project administration and the study design; Y.B. and Z.O. performed the data collection. All authors have read and agreed to the published version of the manuscript.

Funding

This research was funded by the National Natural Science Fund: Screening of salt-resistant rootstock of grape and study on the mechanism of salt-tolerant adaptive reaction (32060647) and Mechanism study of grape resistant rootstock increasing resveratrol content in Cabernet Sauvignon plants (32060648).

Data Availability Statement

Not applicable.

Conflicts of Interest

The authors declare no conflict of interest.

References

  1. He, P.C. Enology; China Agricultural Press: Beijing, China, 1999; p. 97. [Google Scholar]
  2. Wang, X.C.; Qian, Y.M.; Wu, W.M.; Zhao, M.Z.; Zhou, B.B.; Wang, Z.W.; Wu, J.H. Effect of 6-BA on organic acid content and related genes expression in grape berry. N. China Agric. J. 2017, 32, 149–153. [Google Scholar] [CrossRef]
  3. Kliewer, W.M. Sugars and organic acids of vitis vinifera. Plant Physiol. 1966, 41, 923–931. [Google Scholar] [CrossRef] [PubMed] [Green Version]
  4. Carroll, D.E.; Marcy, J.E. Chemical and physical changes during maturation of Muscadine grapes (Vitis rotundifolia). Am. J. Enol. Vitic. 1982, 33, 168–172. [Google Scholar] [CrossRef]
  5. Coombe, B.G. Research on development and ripening of the grape berry. Am. J. Enol. Vitic. 1992, 43, 101–110. [Google Scholar] [CrossRef]
  6. Ruffner, H.P.; Brem, S.; Malipiero, U. The physiology of acid metabolism in grape berry ripening. Fruit Set Dev. 1982, 139, 123–128. [Google Scholar] [CrossRef]
  7. Zhang, J. Effects of Different Dwarf Training Patterns on Volatile Flavor Compound of Cabernet Gernischt. Master’s Thesis, Ningxia University, Yinchuan, China, 2018. [Google Scholar]
  8. Wei, L.Z.; Cheng, J.H.; Li, L.; Mei, J.X.; Wu, J. Effects of SO4 and Beta rootstocks on te growth and berry quality of Yinhong grapevine. Chin. Foreign Grapes Wine 2012, 4, 23–25. [Google Scholar] [CrossRef]
  9. Hirai, M.; Ueno, I. Development of citrus fruits: Fruit development and enzymatic changes in juice vesicle tissue. Plant Cell Physiol. 1977, 18, 791–799. [Google Scholar] [CrossRef]
  10. Diakou, P.; Svanella, L.; Raymond, P.; Gaudillère, J.P.; Moing, A. Phosphoenolpyruvate carboxylase during grape berry development: Protein level, enzyme activity and regulation. Aust. J. Plant Physiol. 2000, 27, 221–229. [Google Scholar] [CrossRef]
  11. Weng, J.Y.; Xue, S.; Ni, Z.J.; Yan, Y.; Shen, Z.; Gao, Z. The differences of organic acid metabolism in fruits of prunus mume and prunus armeniaca. J. Nanjing Agrisultural Univ. 2018, 41, 1009–1017. [Google Scholar] [CrossRef]
  12. Huang, Q.; Chen, L.; Zhong, M.; Huang, C.H.; Tao, J.J.; Qu, X.Y.; Xu, X.B. Changes in Organic Acid Components and Metabolic Enzyme Activity during the Development of Hairy Kiwifruit; Chinese Horticultural Society: Hongkong, China, 2018. [Google Scholar]
  13. Ma, Q.Q.; Pu, X.Q.; Wang, D.; Yu, J.; Wu, C.Y. Changes in organic acid concentration and acid-metabolising enzymatic activities during development of jujube fruits. Acta Agric. Boreali-Occident. Sin. 2017, 26, 1821–1827. [Google Scholar] [CrossRef]
  14. Cheng, J.H. Effect of 3 stocks on goldfinger grapes. Shanxi Fruit Trees 2009, 3, 55. [Google Scholar]
  15. Huang, B. Preliminary Study on the Effects of Rootstocks on Potash Uptake and Growth of Grape. Master’s Thesis, Yangzhou University, Yangzhou, China, 2008. [Google Scholar]
  16. Yuan, Y.Y.; Yao, Y.X.; Wang, W.J.; Xu, J.Y.; Guo, S.P.; Wang, Y.P. Current situation and prospect of grape grafting cultivation. China Foreign Grapes Wine 2012, 6, 57–61. [Google Scholar] [CrossRef]
  17. Zhou, J.L. Environmental background values of several elements in the main agricultural soil of shihezi city. Environ. Prot. Xinjiang 1990, 1, 38–41. [Google Scholar]
  18. Wang, H.B.; Xiu, D.R.; Wang, B.L.; Wang, X.D.; Wei, C.C.; He, J.X.; Zheng, X.C.; Liu, W.C.; Liu, F.Z. A new brewing and stock grape cultivar ‘Huapu 1’. Acta Hortic. Sin. 2012, 39, 2309–2311. [Google Scholar] [CrossRef]
  19. Luo, A.C.; Yang, X.H.; Deng, Y.Y.; Li, C.F.; Xiang, K.S.; Li, D.G. Organic acid concentrations and the relative enzymatic changes during the development of citrus fruits. Sci. Agric. Sin. 2003, 8, 941–944. [Google Scholar] [CrossRef]
  20. Vashisth, T.; Johnson, L.K.; Malladi, A. An efficient RNA isolation procedure and identification of reference genes for normalization of gene expression in blueberry. Plant Cell Rep. 2011, 30, 2167–2176. [Google Scholar] [CrossRef]
  21. Sweetman, C.; Deluc, L.G.; Cramer, G.R.; Ford, C.M.; Soole, K.L. Regulation of malate metabolism in grape berry and other developing fruits. Phytochemistry 2009, 70, 1329–1344. [Google Scholar] [CrossRef]
  22. Wang, M.J.; Shi, X.; Ni, J.J. Effects of rootstock on growth and fruit quality of red globe grape. J. Hunan Agric. Univ. Nat. Sci. 2009, 35, 145–147. [Google Scholar]
  23. Whiting, J.R. Selection of Grapevine Rootstocks and Clones for Greater Victoria; Department of Primary Industries, New South Wales: Orange, NSW, Australia, 2003; pp. 138–151. [Google Scholar]
  24. Guo, R.R.; Zhang, Y.; Lin, L.; Han, J.Y.; Cao, X.J.; Shi, X.F.; Zhou, S.H. Effect of different stock grafting on fruit quality of Ruidu rujade. South. Hortic. 2019, 30, 20–22. [Google Scholar] [CrossRef]
  25. Niu, R.M.; Xu, Z.H.; Huang, X.J.; Shen, T.; Chen, W.P. Effect of rootstock on the growth and fruit quality of ‘Cabernet Sauvignon’ grape. J. Northwest For. Univ. 2020, 35, 124–129. [Google Scholar] [CrossRef]
  26. Pauletto, D.; Mourao, F.D.A.; Kluge, R.A.; Scarpare Filho, J.A. Effect of rootstock on cluster quality of ‘Niágara Rosada’ table grape. Pesqui. Agropecuária Bras. 2001, 36, 935–939. [Google Scholar] [CrossRef]
  27. Hu, K.Y. The Relationship between Organic Acid Accumulation and Related Metabolic Enzymes in Melon Fruit Development. Master’s Thesis, Henan Agricultural University, Zhengzhou, China, 2018. [Google Scholar] [CrossRef]
  28. Wang, X.C.; Wu, W.M.; Zhao, M.Z.; Qian, Y.M.; Wang, Z.W. Effect of NAA treatment on sugar acid content and related gene expression in grape berries. Acta Hortic. Sin. 2015, 42, 425–434. [Google Scholar] [CrossRef]
  29. Shi, J.; Li, F.F.; Ma, H.; Li, Z.Y.; Xu, J.Z. Effects of different interstocks on key enzymes activities and the expression of genes related to malic acid metabolism in apple fruit. Acta Hortic. Sin. 2016, 43, 132–140. [Google Scholar] [CrossRef]
  30. Chen, F.X.; Liu, X.H.; Chen, L.S. Developmental changes in pulp organic acid concentration and activities of acid-metabolising enzymes during the fruit development of two loquat (Eriobotrya japonica Lindl.) cultivars differing in fruit acidity. Food Chem. 2009, 114, 657–664. [Google Scholar] [CrossRef]
  31. Liu, L.Y. The Physiological Study on the Sugar and Acid Accumulations and Metabolic Regulation Mechanisms of Vitis Amurensis Rupr. Grape. Ph.D. Thesis, Northwest A & F University, Xianyang, China, 2016. [Google Scholar]
  32. Wen, T.; Xiong, Q.E.; Zeng, W.G.; Liu, Y.P. Changes of organic acid synthetase activity during fruit development of navel orange (Citrus sinesis osbeck). Acta Hortic. Sin. 2001, 28, 161–163. [Google Scholar] [CrossRef]
Figure 1. Changes in soluble solid contents of different rootstock–scion combinations at different times. The data are presented as the mean ± standard error. Different lowercase letters indicate a significant difference in the same direction (day) among different treatments (p < 0.05).
Agronomy 13 02068 g001
Figure 2. Oxalic acid content in ‘Cabernet Sauvignon’ grapes on different rootstocks. The data are presented as the mean ± standard error. Different lowercase letters indicate a significant difference in the same direction (day) among different treatments (p < 0.05).
Agronomy 13 02068 g002
Figure 3. Tartaric acid content in ‘Cabernet Sauvignon’ grapes on different rootstocks. The data are presented as the mean ± standard error. Different lowercase letters indicate a significant difference in the same direction (day) among different treatments (p < 0.05).
Agronomy 13 02068 g003
Figure 4. Malic acid content in ‘Cabernet Sauvignon’ grapes on different rootstocks. The data are presented as the mean ± standard error. Different lowercase letters indicate a significant difference in the same direction (day) among different treatments (p < 0.05).
Agronomy 13 02068 g004
Figure 5. Citric acid content in ‘Cabernet Sauvignon’ grapes on different rootstocks. The data are presented as the mean ± standard error. Different lowercase letters indicate a significant difference in the same direction (day) among different treatments (p < 0.05).
Agronomy 13 02068 g005
Figure 6. Succinate acid content in ‘Cabernet Sauvignon’ grapes on different rootstocks. The data are presented as the mean ± standard error. Different lowercase letters indicate a significant difference in the same direction (day) among different treatments (p < 0.05).
Agronomy 13 02068 g006
Figure 7. Total acid accumulation content in ‘Cabernet Sauvignon’ grapes on different rootstocks. The data are presented as the mean ± standard error. Different lowercase letters indicate a significant difference in the same direction (day) among different treatments (p < 0.05).
Agronomy 13 02068 g007
Figure 8. Activity of NAD-MDH enzymes in ‘Cabernet Sauvignon’ grapes under different rootstocks. The data are presented as the mean ± standard error. Different lowercase letters indicate a significant difference in the same direction (day) among different treatments (p < 0.05).
Agronomy 13 02068 g008
Figure 9. Activity of NADP-ME enzymes in ‘Cabernet Sauvignon’ grapes under different rootstocks. The data are presented as the mean ± standard error. Different lowercase letters indicate a significant difference in the same direction (day) among different treatments (p < 0.05).
Agronomy 13 02068 g009
Figure 10. Activity of PEPC enzymes in ‘Cabernet Sauvignon’ grapes under different rootstocks. The data are presented as the mean ± standard error. Different lowercase letters indicate a significant difference in the same direction (day) among different treatments (p < 0.05).
Agronomy 13 02068 g010
Figure 11. Activity of CS enzymes in ‘Cabernet Sauvignon’ grapes under different rootstocks. The data are presented as the mean ± standard error. Different lowercase letters indicate a significant difference in the same direction (day) among different treatments (p < 0.05).
Agronomy 13 02068 g011
Figure 12. Relative expression levels of the NAD-MDH gene in ‘Cabernet Sauvignon’ grapes on different rootstocks. The data are presented as the mean ± standard error. Different lowercase letters indicate a significant difference in the same direction (day) among different treatments (p < 0.05).
Agronomy 13 02068 g012
Figure 13. Relative expression levels of the NADP-ME gene in ‘Cabernet Sauvignon’ grapes on different rootstocks. The data are presented as the mean ± standard error. Different lowercase letters indicate a significant difference in the same direction (day) among different treatments (p < 0.05).
Agronomy 13 02068 g013
Figure 14. Relative expression levels of the PEPC gene in ‘Cabernet Sauvignon’ grapes on different rootstocks. The data are presented as the mean ± standard error. Different lowercase letters indicate a significant difference in the same direction (day) among different treatments (p < 0.05).
Agronomy 13 02068 g014
Table 1. RNA reverse transcription program.
ProcessReagentVolume, μL−1
① RNA purification (removal of gDNA)5× gDNA Eraser Buffer2.0
gDNA Eraser1.0
Total RNA1 μg
RNase-free ddH2OUp to 10
② Reverse transcriptase10.0
PrimeScript RT Enzyme Mix I1.0
RT Prime Mix1.0
5× PrimeScript Buffer 2 (for real time)4.0
Rnase-free ddH2O4.0
Total20
Step ①: After thoroughly mixing the reaction system through an instantaneous centrifuge, it was incubated on a PCR apparatus at 42 °C for 2 min. Step ② The reaction system was incubated for 15 min at 42 °C after being fully mixed in a momentary centrifuge, and then incubated for 5 s at 85 °C. It was placed in an icebox or on a precooled metal plate for standby.
Table 2. PCR reaction system.
ReagentVolume, μL−1
2× SuperReal Pre Mix Plus10
Forward primers0.6
Reverse primers0.6
cDNA template1
RNase-free ddH2OUp to 20
Table 3. Primer Sequences.
Primer NamePrimer SequenceGen Bank Accession No.
Actin-FCCCCATGCTATCCTTCGAF369524
Actin-RAGGCAGCTCATAGTTC
NAD-MDH-FGCTGAGGCCAATGTACCAGTAF195869. 1
NAD-MDH-RATGCCATTGAGAGGGTTGCA
NADP-ME-FCAACTGTTGGTGAGGCTTGCFC061962. 1
NADP-ME-RCCAGAATCCGCTCACCATCA
PEPC-FTACCTTCCGAGTTGCTGCTGAF195869. 1
PEPC-RGCTCCCCTCAAGTCCTTCAC
Disclaimer/Publisher’s Note: The statements, opinions and data contained in all publications are solely those of the individual author(s) and contributor(s) and not of MDPI and/or the editor(s). MDPI and/or the editor(s) disclaim responsibility for any injury to people or property resulting from any ideas, methods, instructions or products referred to in the content.

